
Abstract
The extrapolation of test scores to a target domain—that is, association between test performances and relevant real-world outcomes—is critical to valid score interpretation and use. This study examined the relationship between Duolingo English Test (DET) speaking scores and university stakeholders’ evaluation of DET speaking performances. A total of 190 university stakeholders (45 faculty members, 39 administrative staff, 53 graduate students, 53 undergraduate students) evaluated the comprehensibility (ease of understanding) and academic acceptability of 100 DET test-takers’ speaking performances. Academic acceptability was judged based on speakers’ suitability for communicative roles in the university context including undergraduate study, group work in courses, graduate study, and teaching. Analyses indicated a large correlation between aggregate measures of comprehensibility and acceptability (r = .98). Acceptability ratings varied according to role: acceptability for teaching was held to a notably higher standard than acceptability for undergraduate study. Stakeholder groups also differed in their ratings, with faculty tending to be more lenient in their ratings of comprehensibility and acceptability than undergraduate students and staff. Finally, both comprehensibility and acceptability measures correlated strongly with speakers’ official DET scores and subscores (r ⩾ .74–.89), providing some support for the extrapolation of DET scores to academic contexts.
Keywords
Although international students’ academic success in English-medium universities is based on complex linguistic and social practices (Crowther, 2020), performance on standardized proficiency exams (e.g., Duolingo English Test, IELTS, TOEFL iBT) plays a major role in university admissions decisions. Such exams help admissions staff determine whether applicants possess high enough proficiency to gainfully pursue academic study (Chalhoub-Deville & Deville, 2006). These decisions are predicated on inferences that test scores will extrapolate to the specific domain of the English-medium university. To examine support for extrapolation, it is necessary to identify meaningful target language use (TLU) domain criteria against which to compare test scores.
In academic settings, comparing indicators of academic success (e.g., grade point average) and test scores used for admissions decisions is a logical starting point (Bridgeman et al., 2016; Ginther & Yan, 2018; Oliver et al., 2012). Fine-grained approaches that compare test scores with specific performance indicators, such as grades on written assignments (Llosa & Malone, 2019) or student evaluations of teaching for international teaching assistants (ITAs; Wagner, 2016), are also useful for establishing skill-specific extrapolations. In addition, the evaluations of “linguistic laypersons” (Sato & McNamara, 2019; e.g., students, faculty members, and administrative staff), who make up a substantial portion of the academic community test-takers interact with during university study, can shed light on academic preparedness, as their general impressions of linguistic performances are rooted in extensive personal experience and knowledge of community standards. Understanding layperson perceptions of test-takers’ linguistic capabilities is valuable not just because laypersons have broad, intuitive knowledge of language demands, but also because they are stakeholders who play key roles in the post-admissions experiences of test-takers. Whereas previous research has emphasized (primarily) undergraduate students’ perceptions of ITAs’ acceptability to deliver university-level instruction (e.g., Dalman & Kang, 2021; Kang, 2010, 2012) the current study extends the scope of linguistic laypersons’ perceptions to consider the views of both instructional faculty members with teaching duties and university administrative staff (henceforth faculty and staff, respectively, following terms widely used in the US context). Through analyzing a range of layperson perceptions, we aim to extend knowledge on the extent to which scores from one standardized speaking assessment, the Duolingo English Test (DET), may align with listener perceptions rooted in the TLU domain.
Literature review
The Duolingo English Test
As a result of the COVID-19 pandemic, English-medium universities were required to, at least temporarily, accept at-home language proficiency tests for admission purposes (Isbell & Kremmel, 2020). One such test was the DET, an increasingly used assessment tool for admission to English-medium university study (Duolingo English Test, n.d.-a). In brief, the DET purports to measure English proficiency for communication and use in English-medium settings (Cardwell et al., 2022). At the time of the study, the test had seven item types 1 (Figure 1). The first five item types were computer adaptive, with performance on previous items influencing selection of subsequent items:
C-test;
Y/N vocabulary (text);
Y/N vocabulary (audio);
Dictation;
Elicited imitation.
Test-takers also complete four Extended Writing items and four Extended Speaking items. According to Duolingo, the Extended Speaking tasks are intended to measure “English speaking abilities” and require “test takers to speak for an extended time period and to leverage different aspects of their organizational knowledge (e.g., grammar, vocabulary, text structure) and functional elements of their pragmatic knowledge (e.g., ideational knowledge)” (Cardwell et al., 2022, p. 17).
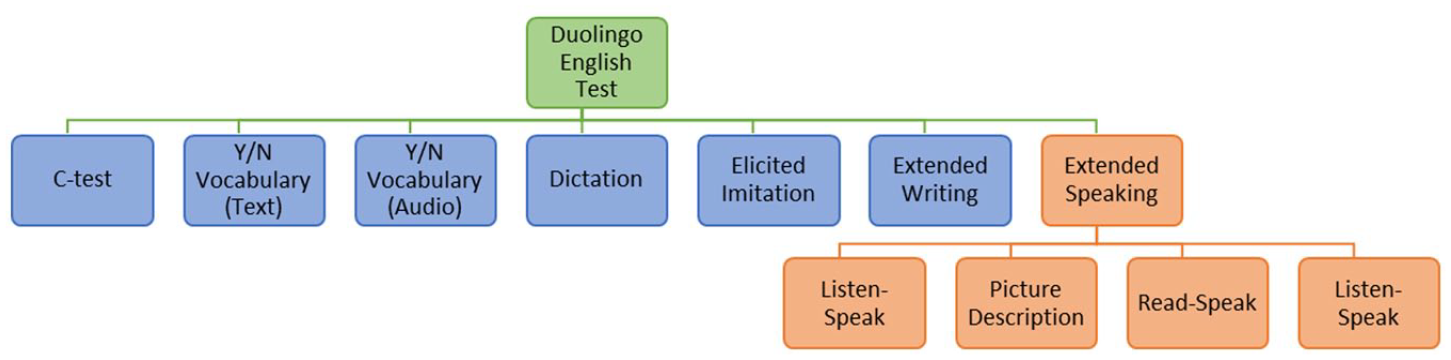
Design of the Duolingo English Test.
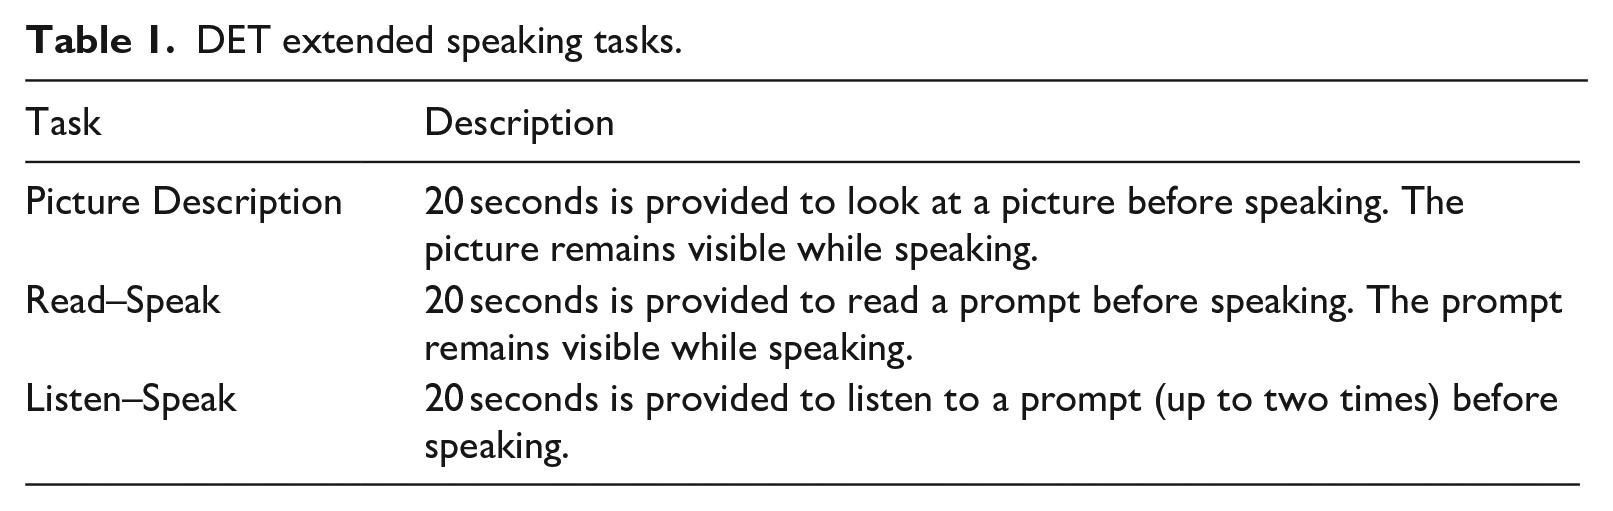
The current study focuses on the four Extended Speaking items. The four items each test taker must complete include one Picture Description task, one independent task with a written prompt (Read–Speak), and two independent tasks with aural prompts (Listen–Speak). While all picture description prompts are of the same general type, there are several types of prompts for the Read–Speak and Listen–Speak tasks based on a general communicative function, such as description, explanation, and argumentation. Test-takers are required to speak for at least 30 seconds in response to each prompt and may speak for up to 1 minute 30 seconds. Table 1 provides more details about each task type; readers may refer to the Duolingo English Test Official Guide for Test Takers (Duolingo English Test, 2022) or the online practice test (available Duolingo English Test, n.d.-b) for sample prompts. All Extended Writing and Speaking responses are then scored by automated scoring models (see Cardwell et al., 2022). For Extended Speaking, automated scores are based on measures of grammatical accuracy, grammatical complexity, lexical sophistication, lexical diversity, task relevance, length, fluency, and acoustic features of test-taker performances.
DET extended speaking tasks.
Upon completion of the DET, test-takers receive a DET Overall score, along with subscores for Comprehension, Conversation, Literacy, and Production. Overall scores and subscores range between 10 and 160, and universities vary in terms of cut scores and subscore use. As a point of reference, large public universities in the United States require a minimum Overall score in the range of 95–110 for undergraduate admissions, while more selective institutions tend to require at least 120–130. In addition, the DET elicits an unscored writing sample and an unscored speaking sample viewable by some university stakeholders to aid in admissions decisions. There has been some debate over the use of the DET as a measure of English language proficiency, especially in academic contexts. Wagner and Kunnan (2015) raised early concerns about the DET’s lack of extended written and spoken production. Subsequent revisions to the test, such as the 2019 addition of extended written and spoken production items, were made to address such critiques. A subsequent review of the DET still identified several validity concerns related to the use of DET scores for university admission purposes, including limited assessment of discourse-level language, interactional competence, and task authenticity (Wagner, 2020). Despite such critiques, DET overall scores have been found to correlate strongly with DET test takers’ self-reported IELTS (r = .78) and TOEFL iBT (r = .77) total scores (Cardwell et al., 2022). Focusing on speaking, relevant DET subscores (Conversation, Production) have shown moderate correlations with IELTS and TOEFL iBT speaking section scores (r = .51–.67; LaFlair, 2020). These correlations are similar to those between IELTS and TOEFL iBT, with IELTS and TOEFL iBT total scores correlated at r = .73 and speaking scores at r = .57 (Educational Testing Service, 2010). As a relatively new test, however, the DET is only beginning to accumulate a body of research evidence to support score use in academic settings beyond correlations with other tests used for similar purposes (but see Isaacs et al., 2023).
Extrapolation of test scores to target domains
Test scores are used to make decisions about people relevant to a particular TLU domain (Bachman & Palmer, 2010). For example, English language proficiency tests such as the DET, TOEFL iBT, and IELTS are commonly used to make decisions about whether a second language (L2) English user is linguistically prepared for English-medium higher education settings. 2 Naturally, how test scores relate to performance or predict success in the target domain is of interest to test score users—decisions can be more confidently made when test scores closely relate to how well someone fares in the real world (Bridgeman et al., 2012; LaFlair & Staples, 2017; Llosa & Malone, 2019; Schmidgall & Powers, 2020). This relationship between test scores and indicators of performance/success in the target domain is characterized as extrapolation (Chapelle, 2020; Kane, 2013).
In argument-based approaches to validity, a chain of inferences is used to justify the interpretations of test scores and the use(s) of scores for a particular real-world purpose (Chapelle, 2020; Kane, 2013). Extrapolation inferences are a critical link in the chain which moves the argument from what scores mean to their relevance in decision-making. In other words, while many tests can consistently tell us something meaningful about an individual’s language ability, whether that something is relevant to real-world situations is not a given—some kind of extrapolation is necessary to justify test score use.
Speaking test performance as predictor of academic success
When considering the effectiveness of speaking scores as a predictor of academic performance, several criterion measures have been employed. For example, Ockey et al. (2015) compared Japanese university students’ TOEFL iBT speaking scores with their performance on oral tasks designed and scored by experienced English instructors. They found that while TOEFL iBT speaking scores had large, positive correlations with instructors’ ratings of pronunciation, fluency, vocabulary, and grammar, these same speaking scores were less associated with instructors’ ratings for interactional competence, descriptive skill, and presentation ability. Bridgeman et al. (2016) compared international students’ TOEFL iBT scores with their first-year grade point average (GPA), a broad indicator of academic success influenced by numerous factors, obtaining a correlation between speaking scores and GPA of only .08. When examining subgroups, however, relationships proved slightly stronger for some majors (business, science, engineering) and notably stronger for some nationalities within majors (e.g., Chinese business majors). Isaacs et al. (2023) reported similar patterns among relationships between GPA and several English tests used for admission purposes, including the TOEFL iBT, IELTS, and DET. These findings highlight some of the nuances in linking high stakes assessment to other formal evaluations of academic success, including heterogeneity among student subgroups and the degree to which spoken language ability can be expected to account for particular outcomes.
The linguistic layperson and perceptions of L2 speech
In simplest terms, linguistic laypersons are not language professionals, and subsequently lack the training and metalinguistic knowledge of those typically employed to rate performances in high-stakes assessments (Sato & McNamara, 2019). As such, it might be expected that these linguistic laypersons, when asked to assess the speech of L2 English users, may assign weight to criteria less frequently included in formal rating procedures for L2 assessment, and instead rely on their intuitions and experience (Sato & McNamara, 2019). Relatively few studies draw upon linguistic layperson data in validation research on language proficiency tests. Bridgeman et al. (2012) presented TOEFL iBT speech samples to first language (L1) English undergraduate students. Each student assessed the speech for effort, confidence, interference, and task fulfillment (later combined into a single communicative competence score). They found that the undergraduates’ scoring of communicative competence strongly correlated with speakers’ TOEFL iBT scores assigned by expert raters. Schmidgall and Powers (2020) asked listeners based in English-medium international workplaces to rate the communicative effectiveness of L2 English users’ TOEIC speaking performances. Again, layperson judgments correlated strongly with TOEIC speaking scores assigned by expert raters. In both studies, the notion that test scores are relevant to the broader TLU domain found support, but little is known regarding other tests and other listener (sub)populations.
The linguistic layperson, sometimes referred to as the naïve or untrained listener, has been a frequent target population in L2 speech perception research given laypersons’ more frequent, everyday interactions with L2 users. In their highly influential study, Munro and Derwing (1995a) found that despite some L2 speakers’ inability to produce nativelike speech (i.e., had a degree of accentedness), these same speakers were still understandable (i.e., their speech was intelligible and comprehensible). Within their framework, Munro and Derwing defined intelligibility as the accuracy with which a listener understands an L2 speaker’s intended utterance (frequently measured through transcription; see Kang et al., 2018) and comprehensibility as the perceived ease or difficulty of understanding an utterance (as reported through subjective ratings). These two constructs have come to influence definitions of and evaluation criteria for speaking skill in assessment contexts (Isaacs, 2018). Importantly, accuracy of understanding has been shown to not necessarily entail ease of understanding (as discussed in Derwing & Munro, 2015). In essence, the two measures of understanding have been argued to be partially independent constructs. In the years since this study appeared, scholarly interest in listener perception of L2 comprehensibility has increased exponentially (Crowther et al., 2022). One point of interest has been that speech perceived as low in comprehensibility requires greater processing effort on the part of the listener (Munro & Derwing, 1995b) and elicits less favorable emotional reactions and social judgments (e.g., Dragojevic & Giles, 2016; Hosoda & Stone-Romero, 2010). Linguistic influences on perceptions of comprehensibility are varied, including phonological, lexical, grammatical, and fluency features, with variation across tasks (Crowther et al., 2018).
While less present in L2 speech perception research than comprehensibility (Thomson, 2018), scholars have begun to show an increased interest in the acceptability of L2 speech (e.g., Ballard & Winke, 2017; Kang, 2012). Although L2 research has been less than consistent in defining acceptability, Isaacs (2018) differentiated between two common streams of acceptability research. The first considers the acceptability of L2 speech in reference to a specified linguistic norm, often one associated with social power (see Levis, 2006). The second makes reference to speakers’ acceptability to fulfill a specific task or role, such as serving as an ITA at an English-medium university. It is this second stream of inquiry that has gained prominence in recent years, particularly in reference to academic acceptability, and informs the present study.
To this point, considerations of post-secondary L2 English acceptability have remained constrained primarily to the rating of ITAs, as judged by (primarily) L1 English undergraduate students. For example, Kang (2010, 2012) considered US undergraduate students’ perceptions of ITA speech and indicated that (a) undergraduate students associated more nativelike speech rates with higher comprehensibility (Kang, 2010) and (b) prosody directly informed how undergraduates perceived ITA’s oral English proficiency and instructional competence (Kang, 2012). Dalman and Kang (2021) additionally found that despite being rated as highly proficient by high-stakes speaking assessments, a sample of 20 L2 English speakers was not always rated as highly comprehensible, nor was their speech rated as acceptable for university teaching or group work by L1 English undergraduates. Interestingly, intervention involving listener collaboration with ITAs has been shown to promote more positive perceptions of ITA speech (Kang et al., 2015). This aligns with Ballard and Winke (2017), who, though focused on English as a second language (ESL) instructors rather than ITAs, additionally found that listener familiarity with a particular speaker’s accent (both L1 and L2) influenced both how comprehensible and how acceptable as a teacher the listeners perceived the speaker to be.
These studies highlighted only one layperson/test-taker relationship that exists in academic study based on a population (US undergraduate students) known to possess varying biases toward different varieties of L2 and L1 English speech (Lindemann, 2005). However, L2 English users at English-medium universities engage with a much wider range of stakeholders for a range of non-teaching purposes. For example, on any given day, an L2 English user is likely to engage with a peer (or two or three) in a course-based group discussion or project. Or, throughout their study, L2 English users will necessarily engage with multiple instructors, who likely hold specific expectations regarding what qualifies as acceptable English for both undergraduate and graduate study. Given ongoing global discussions on what constitutes academic English and what levels of proficiency are needed for success in English-medium instruction (e.g., Trenkic & Warmington, 2019), there is a clear need to extend inquiry beyond the perceptions of undergraduate students to those of other stakeholders who will interact with L2 English users in an academic setting, such as faculty members and administrative staff.
The current study
To investigate support for the extrapolation of DET scores to academic settings, in this study, we draw upon speech elicited through the DET and linguistic laypersons’ perceptions of comprehensibility and acceptability in reference to academic preparedness. Given the limited range of stakeholders’ perceptions elicited in previous research, we extended our layperson population to include not only undergraduate and graduate students, but also instructional faculty and university administrators. These laypersons judged speech samples from 100 DET test takers seeking undergraduate or graduate admission at an English-medium university. Through comparing stakeholders’ perceptions of DET speaking task performances, we addressed the following three research questions:
How do university stakeholders perceive the comprehensibility and academic acceptability of DET spoken performances?
How do groups of academic stakeholders differ in their perceptions of comprehensibility and academic acceptability?
What are the relationships between DET scores and university stakeholder perceptions of (a) comprehensibility and (b) academic acceptability?
As university stakeholders’ impressions of linguistic performance are rooted in their personal experience in and knowledge of the TLU domain, the relationships between their perceptions of comprehensibility and academic acceptability and DET test scores can serve as evidence for or against the extrapolation of DET spoken performances to performance in academic settings.
Method
Participants
DET speakers
The test provider and funder of this study, Duolingo, provided us with a stratified sample of 100 DET test-takers’ operational score data and speech sample recordings. The language backgrounds of the test-takers, stratified to reflect DET test-taker demographic trends, included Mandarin Chinese (n = 30), Arabic (n = 21), Spanish (n = 20), French (n = 14), Persian (n = 12), and English (n = 3). Their purposes of taking the test were for graduate (n = 49) and undergraduate admission (n = 51). Roughly the same number of test-takers were taken from each decile of overall DET score (n = 9–11) and had scores ranging from 70–145 (see Online Supplement S1 for a histogram of DET overall scores).
Listeners
We recruited listeners via email listservs and newsletters affiliated with the University of Hawaiʻi at Mānoa (UHM), USA. A total of 204 listeners from UHM were recruited, representing four stakeholder groups: 58 graduate students (34 females; mean age = 30.20, SD = 7.69), 58 undergraduate students (13 females; mean age = 23.00, SD = 5.58), 47 faculty members (23 female; mean age = 43.00, SD = 11.00), and 41 administrative staff (28 females; mean age = 45.20, SD = 11.10). Across groups, most listeners were L1 speakers of English (76.6%–87.8%). Reflecting the racial/ethnic demographics of the UHM community, most listeners identified as Asian (n = 123), followed by White (89), Hawaiian or Pacific Islander (19), Hispanic or Latino (15), and smaller numbers of Black, American Indian or Alaska Native, and others (participants could identify with multiple racial/ethnic categories). Faculty members’ academic fields were spread across several disciplines (e.g., Education = 7, Life Sciences = 7, Psychology and Social Sciences = 7, Humanities = 5, Engineering = 4, Business = 4). Graduate students’ areas of study were concentrated in Engineering (n = 14) and Psychology and Social Sciences (n = 11), with several other fields represented (e.g., Life Sciences = 5, Education = 5), while undergraduate students were concentrated in Engineering (undergraduates = 44). The staff were mostly involved in academic department support (n = 25) and student services (e.g., admissions, advising). All listener groups indicated similar mean levels of familiarity with nonnative English speech (M = 5.51–6.26; 1 = not familiar at all, 9 = very familiar). All listener procedures took approximately 40 minutes, and listeners received a US$25 gift card for participating in the study.
Materials
DET scores and speech samples
The DET Extended Speaking tasks are evaluated by an automated scoring model, which produces a single “Speaking Portfolio” score for each test-taker, which is not reported but used internally to calculate official scores and subscores. Based in part on this internal Speaking Portfolio score, an overall DET score and Conversation and Production subscores are calculated and reported on a 10–160 scale (LaFlair, 2020). The Conversation subscore incorporates performance on elicited imitation, dictation, and aural vocabulary tasks, while the Production subscore incorporates performance on the Extended Writing tasks. The most recent estimated test–retest reliability is .90 for DET Overall scores, .86 for Production subscores, and .86 for Conversation subscores (Cardwell et al., 2022). Reliability estimates for the internal Speaking Portfolio scores are not publicly available.
Duolingo provided all four Extended Speaking tasks (Picture Description, Read–Speak, and two Listen–Speak) for each of the 100 speakers attached to each speaker’s DET Overall score, Production and Conversation subscores, and Speaking Portfolio score. As the entire spoken performance for each task is submitted to DET’s autoscoring AI, we kept speech file editing minimal, removing only identifiable information (e.g., full name) and clicking sounds at the beginning and end of recordings. Speech files with low audio levels were amplified to 70 dB. Otherwise, speech files for each task were not trimmed for length (M = 69.3 seconds, SD = 20.7 seconds).
Speech judgments
To measure comprehensibility, three questions from Schmidgall and Powers (2020) were used. One item directly asked how comprehensible they found the speaker and the other two items referred to certainty and ease in understanding, which might similarly tap into listener effort in understanding (i.e., listeners would feel more ease and certainty in their understanding when they did not have to expend a great deal of effort). For acceptability, a construct less well-established in the literature, we drew inspiration from previous studies (Ballard & Winke, 2017; Dalman & Kang, 2021; Kang, 2010, 2012; Schmidgall and Powers, 2020) and created four questions targeting acceptability in different academic roles: undergraduate study, group work in classes, graduate study, and university teaching. While undergraduate listeners may have questionable basis for judging the linguistic demands of graduate study, listeners at the site of this study, a research-intensive doctoral granting institution, frequently have opportunities to interact with graduate students in courses (as teaching assistants), labs (research labs, practical laboratory components of science/engineering courses), tutoring centers, and student clubs/organizations. All questions featured 6-point response scales, a length adequate for L2 speech judgments (Isaacs & Thomson, 2013). For all scales, the least favorable rating was coded as 1 and the most favorable was coded as 6. Figure 2 presents the interface that listeners engaged with and includes the descriptors for each point of the seven scales.
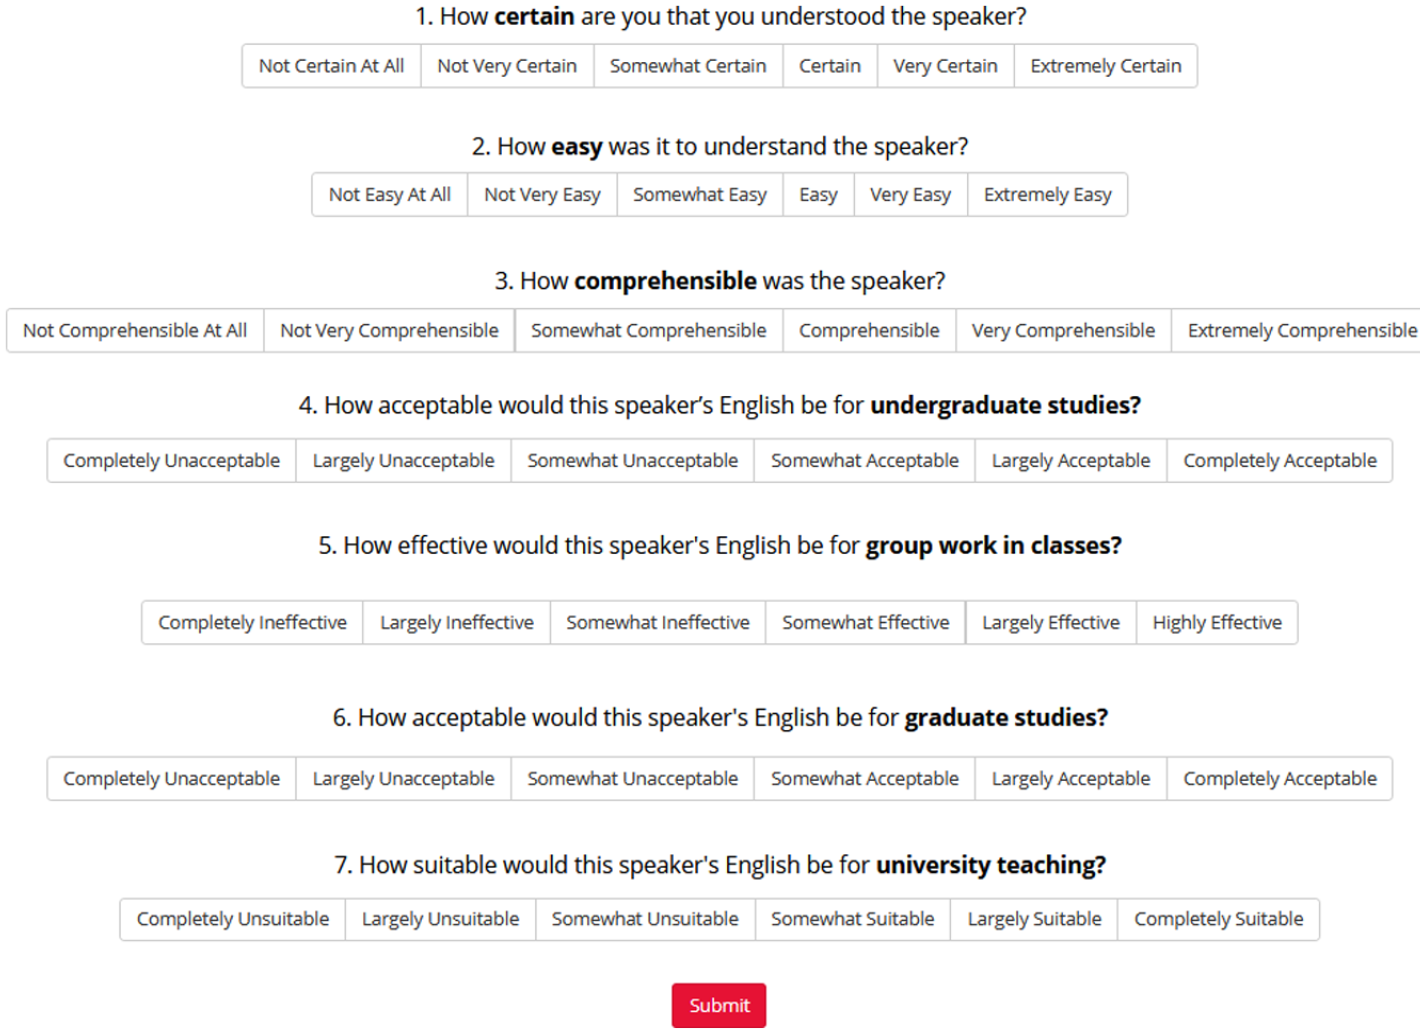
Speech judgment questions and interface.
Procedure
Listeners were invited by email to the online experiment platform Gorilla (Anwyl-Irvine et al., 2020), accessed at home on their personal computers. Upon beginning the experiment, listeners provided consent, completed a background questionnaire, and received training on the target constructs and how to complete the experiment. Two speech samples, created by the researchers based on DET sample prompts, were used for familiarization and practice rating. To check listeners’ focus during data collection, two attention checks were included in the experiment which required clicking a specified rating on three rating scales. Upon completing the experiment, listeners completed two open-ended debriefing questions about how they formed their judgments and what they focused on when responding to the comprehensibility and acceptability questions.
The experiment utilized a sparse rating design. The 400 DET speaking task responses were initially divided into 40 blocks of 10 files. Each block was composed of roughly one speaker per DET overall score decile and featured at least four different L1 backgrounds. Each block also featured at least two different speaking task types (among Picture, Listen–Speak, and Read–Speak), with most blocks including all three (see Supplement S1 for detailed characteristics of each block).
Blocks were designed so that each of a test-taker’s four speaking task responses were in different blocks. The 40 blocks were then divided into two sets, A and B. The blocks were divided in such a way that test-takers did not have responses in both sets. Listeners were assigned to one block from Set A and one block from Set B, with half of the listeners starting with a block from Set A and vice-versa. This prevented listeners from hearing the same speaker more than once. One participant completed study procedures twice but was assigned different blocks each time. Partway through data collection, we discovered errors in block design, leading to the addition of 13 blocks (see Supplement S1 for details). Ultimately, the number of listener ratings for each of the 400 audio files varied, with a mean of 10.40 ratings per file (SD = 7.03, min = 2, max = 37). Aggregated at the speaker level (across all four tasks), there was an average of 41.40 judgments (SD = 2.93, min = 34, max = 50) per speaker. On average, listeners took 63.7 seconds to complete their judgments of a single file, with considerable variation (SD = 38.8 seconds) due to differences in file length and idiosyncratic judgment behavior; listeners were encouraged but not required to listen to the entirety of each audio file 3 .
We examined listeners’ accuracy on the embedded attention checks to give an indication of listener judgment data quality. Overall, 1160/1230 attention checks were passed (94%), with 176 listeners responding correctly to every attention check (86%); 192 responded correctly to ⩾4/6 checks (94%). This suggests that most listeners were paying attention to directions. However, 12 listeners answered <4/6 attention checks correctly (including 2 faculty, 2 staff, 3 graduate students, 5 undergraduate students). These listeners were more concerning, although closer inspection generally did not reveal any clearly aberrant response patterns, such as uniform responses (e.g., selecting the most positive category for all judgments).
Analyses
Addressing RQ1, we used many-facet Rasch measurement (MFRM) to analyze the speech judgment data in Facets (Linacre, 2021). MFRM allows for several features, or facets, of a measurement situation to be analyzed simultaneously, producing measures for the elements in log odds units (logits) that are directly comparable to one another (Linacre, 2021). MFRM also produces reliability estimates for each facet, and estimates of fit, or consistency of measurement, for each element. Fit is indexed by outfit, which is more sensitive to outliers, and infit, which places more weight on typical observations. Both infit and outfit can range from 0 to infinity, with an expected value of 1.00. Values between 0.60 and 1.40 are considered adequate for surveys, while values exceeding 2.00 can potentially distort measurement outcomes (Wright & Linacre, 1994). MFRM ability measure for speakers can be represented on the original scale (i.e., 1–6) as fair averages, which are adjusted to account for differences in other facets (e.g., listener severity). Sparse rating data are also easily accommodated in MFRM, provided that elements are adequately linked (Isbell, 2018; Myford & Wolfe, 2000). MFRM, like other Rasch models, assumes unidimensionality and good fit of data to the model (see Aryadoust et al., 2021, for a detailed discussion of Rasch model assumptions). In this study, we constructed four-facet hybrid partial-credit models separately for comprehensibility and acceptability, with facets for speakers, listeners, communicative functions associated with each task, and judgment questions. We used listeners’ debriefing comments to contextualize these findings.
Analyses addressing RQ2 extended the MFRM analyses by examining the judgments of four listener groups (undergraduate students, graduate students, faculty, and staff). First, the summary statistics of groups were compared, including their raw observed score averages and MFRM-based severity measures. Second, an MFRM bias interaction between four listener groups and judgment questions was modeled to examine whether (and to what extent) any of the listener groups may have differed in their responses to each judgment question, beyond their overall severity of judgments. Interactions are interpreted according to magnitude, with a rule of thumb that|0.50| logits or greater is notable (Linacre, 2022; see also Educational Testing Service’s guidelines for differential item functioning, which characterize bias equivalent to|0.43| logits or less as “negligible,” Zwick, 2012), and statistically significant (i.e.,|t| > 2.0, indicating that an interaction with a true magnitude of 0 is unlikely). This analysis could reveal whether one group of stakeholders made extra strict (or extra lenient) judgments for one question compared with other groups. For example, this analysis could show whether undergraduates judge the university teaching question with more strictness than other groups, after accounting for their general severity in acceptability judgments.
For RQ3, we ran Pearson correlations among MFRM fair-average speech judgments (comprehensibility, acceptability) and DET (sub)scores (Overall, Production, Conversation, and the internal Speaking Portfolio score). Pearson correlations assume a linear relationship between two continuous variables; we assessed this assumption graphically.
Data quality is a concern in online speech research (Nagle & Rehman, 2021), and the Rasch approach to measurement generally prescribes removing elements with excessively poor fit. As previously mentioned, there were 12 listeners who, based on poor performance on attention checks, may have supplied low-quality (e.g., inattentive) judgment data. We also identified one listener with extremely poor fit 4 for both comprehensibility and acceptability models (infit and outfit values >3.0 in all cases) and another listener who provided only the highest ratings to all speakers for every question, preventing the calculation of fit statistics. To guard against distortion of findings due to the presence of low-quality listener data, we report MFRM models without data from those 14 listeners, but for transparency provide a parallel set of results drawing on all 204 listeners in Online Supplement S2. We also correlated the speaker measures and observed averages after excluding the 14 listeners with those yielded from analysis of the full dataset. The speaker measures and observed averages without the potentially low-quality data from 14 listeners correlated almost perfectly with speaker measures derived from the full dataset (r > .99).
Results
RQ1: MFRM analyses of listener judgments
The comprehensibility model accounted for 50.5% of variance in judgments while the acceptability model accounted for 55.9%, both exceeding Reckase’s (1979) 20% threshold to suggest unidimensionality. The proportions of standardized model residuals exceeding |2.0| (comprehensibility = 4.3%, acceptability = 4.4%) and|3.0| (comprehensibility = 0.4%, acceptability = 0.6%) were smaller than 5% and 2%, respectively, indicating acceptable fit for both models (Linacre, 2021).
Table 2 provides facet summary statistics for each model. Rasch reliability, analogous to Cronbach’s alpha, was estimated at .98 for speaker comprehensibility measures and .99 for speaker acceptability. Other facets had similarly high reliability, indicating that differences among facet elements (listeners, questions) were reliable, but the reliability for the task functions facet in each model was lower, owing to the minimal differences in difficulty among functions. In terms of fit, questions and functions in each model had generally desirable fit indices (with values near 1.00). Speakers varied more in terms of fit, but generally fell within an acceptable range. Listeners varied most in terms of fit, with a small handful of listeners demonstrating notably poor infit values (>2.00) (Comprehensibility n = 9, Acceptability n = 9) and outfit values (Comprehensibility n = 7, Acceptability n = 6; see also Online Supplement S1 for histograms of fit statistics), indicating inconsistency in judgments. Given the large number of raters, relatively small proportions of large standardized residuals, and precise measurement of speakers, these poor-fitting listeners were not trimmed from the dataset, as doing so would be expected to yield minimal improvements to speaker measurement at the cost of informative data on listeners in the sample.
Facet summary statistics for comprehensibility and acceptability models.
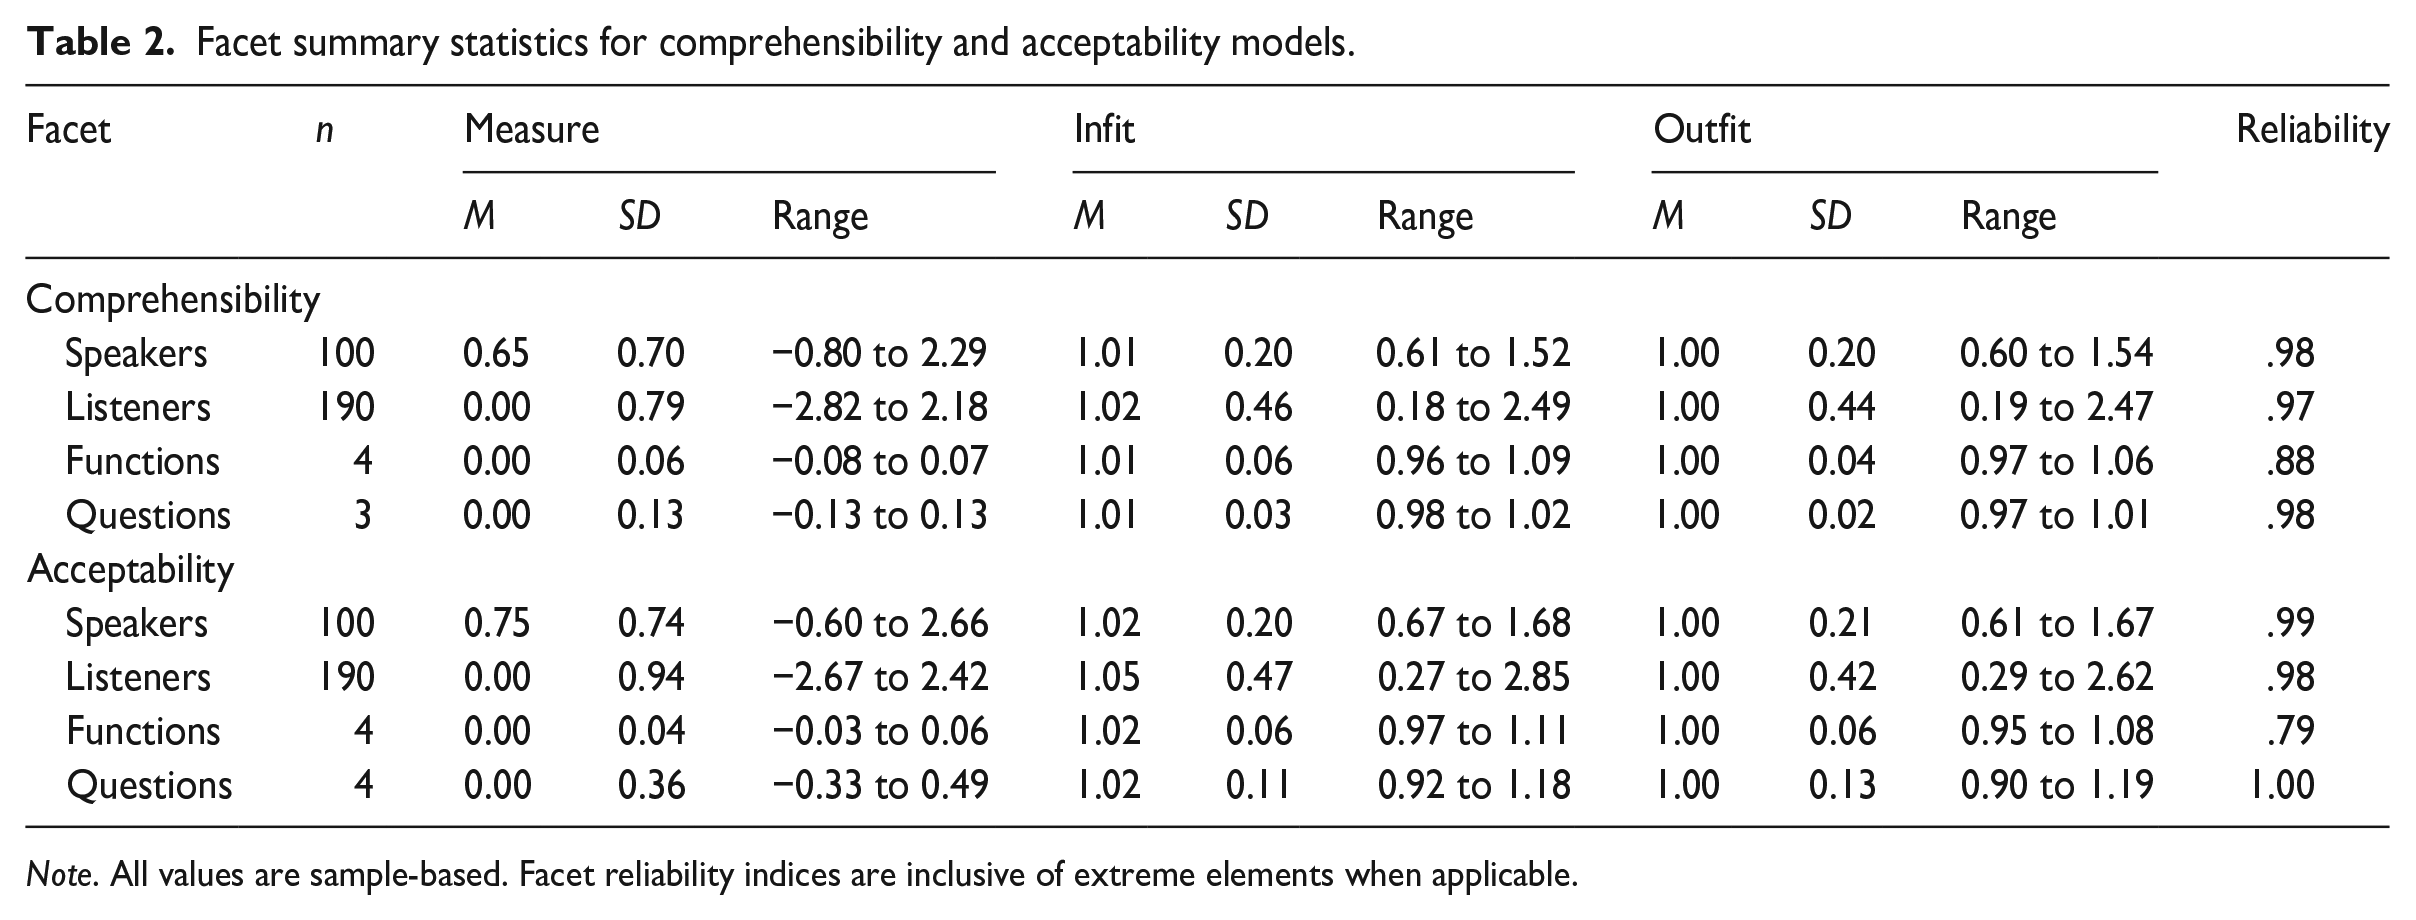
Note. All values are sample-based. Facet reliability indices are inclusive of extreme elements when applicable.
Figures 3 and 4 are Wright maps, which illustrate the relationships among elements of each facet in the Comprehensibility and Acceptability models, respectively. In the leftmost four panels on each map, each dot represents an individual facet element (e.g., 1 speaker). Speakers with higher measures have better odds of earning a high rating, while listeners, functions, and questions with higher measures indicate greater difficulty for a speaker to earn higher ratings. Compared with listeners, functions, and questions, speakers were relatively more able, that is, had higher levels of comprehensibility/acceptability. The rightmost panels in each map show the scale thresholds for each question. For instance, a speaker with a comprehensibility estimate of 2.25 logits would be expected to earn the highest rating on all three comprehensibility questions when judged by an average (severity = 0.00 logits) listener.
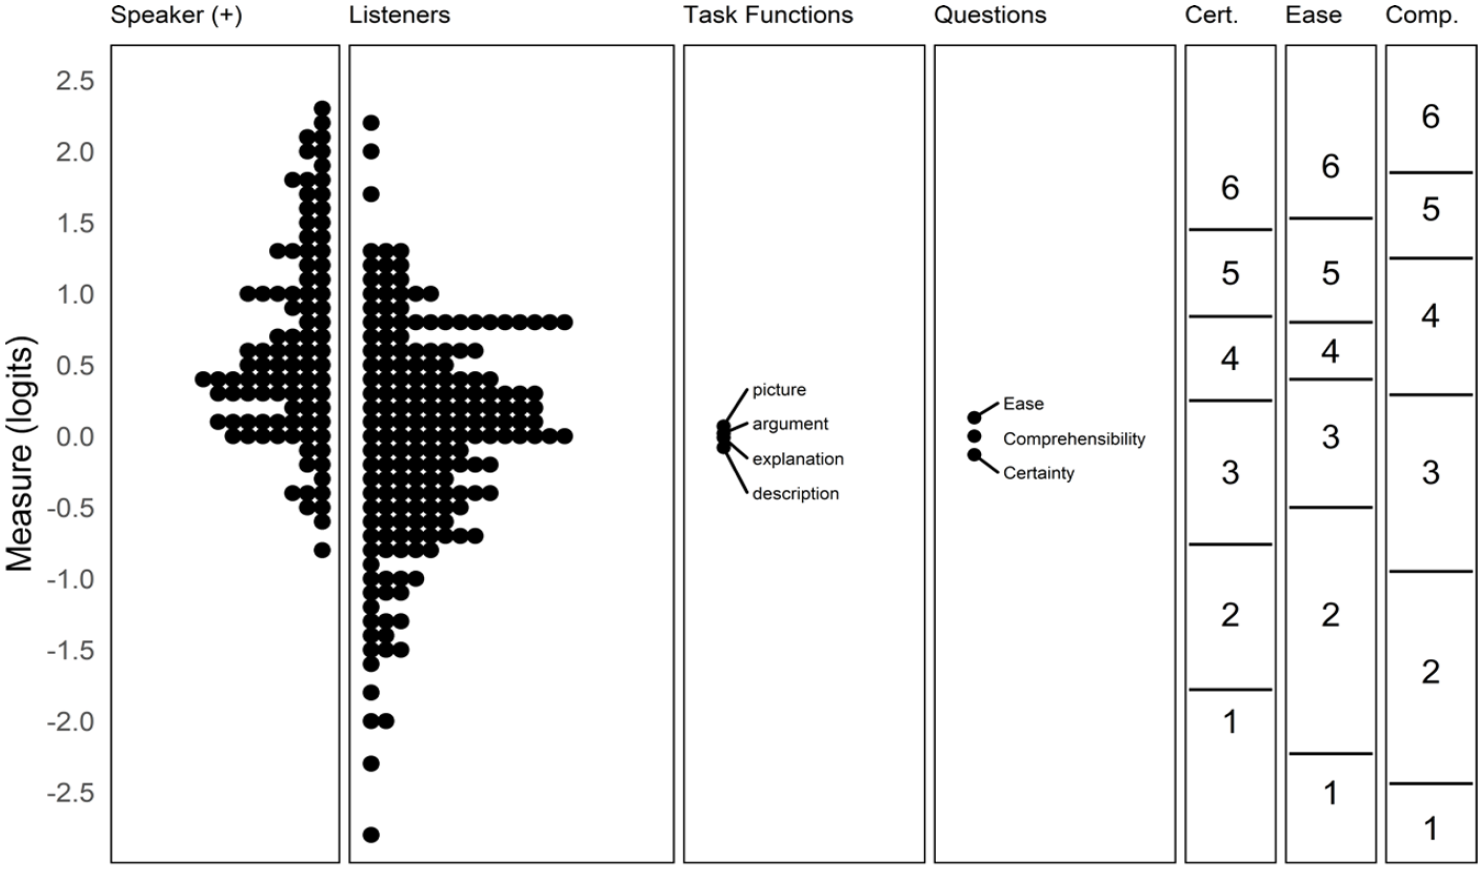
Wright map for comprehensibility.
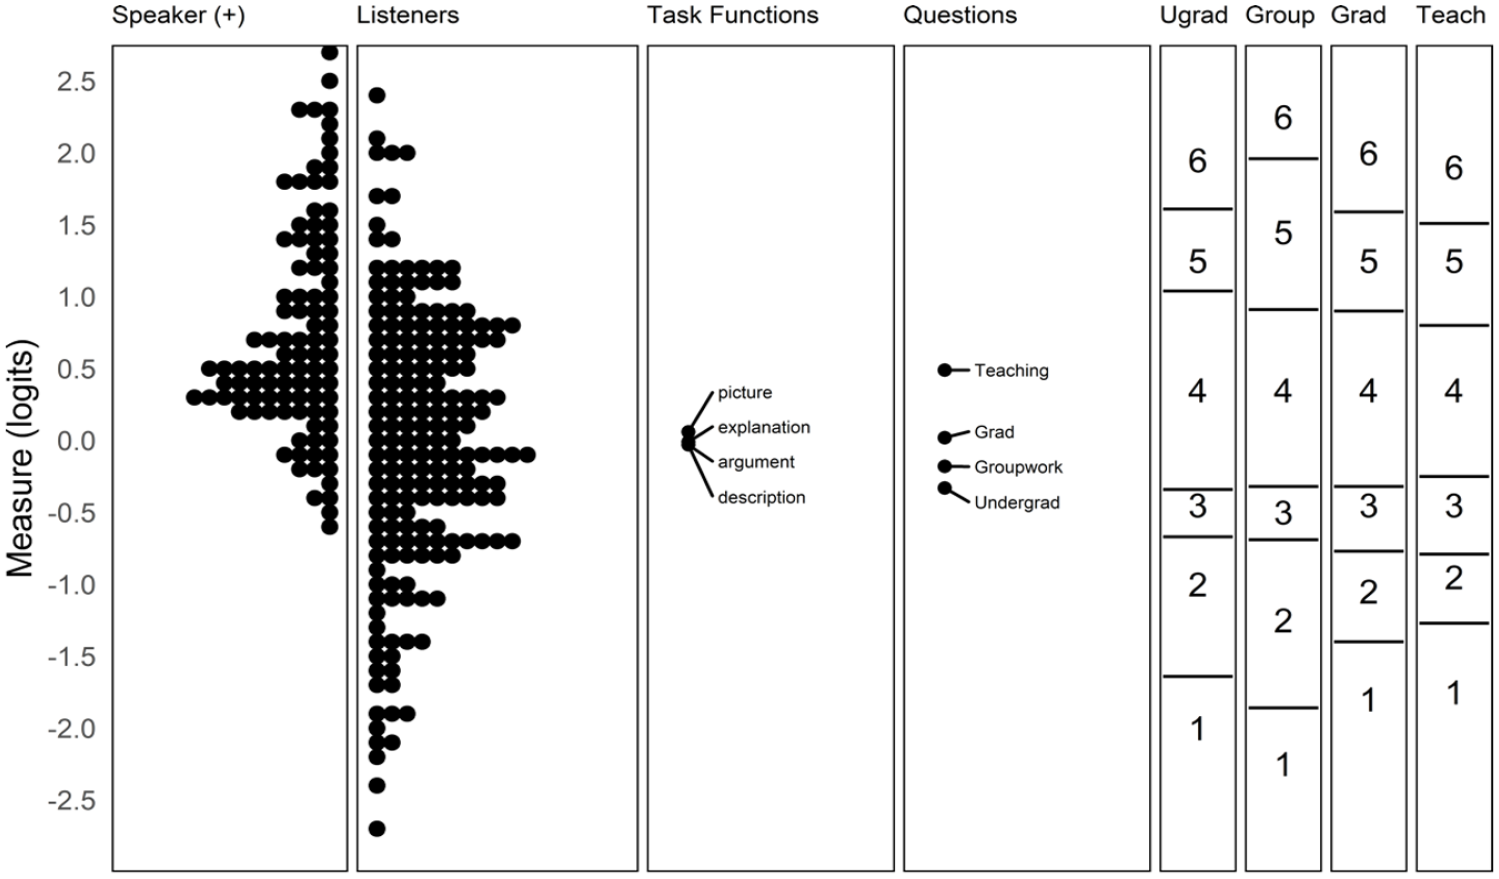
Wright map for acceptability.
Notably, the task functions varied little in difficulty for both the comprehensibility and acceptability models. The three comprehensibility questions were similar in difficulty, though the thresholds associated with higher and lower ratings differed somewhat; it was generally harder for speakers to receive a rating of “extremely comprehensible” than “extremely certain.” For acceptability, there were greater differences in difficulty among questions, with Teaching being substantially more difficult than Undergraduate study (a difference of 0.80 logits). In practical terms, it was common for speakers to receive a rating one step lower on Teaching compared with Undergraduate study.
Examining the category probability curves for judgments (Figure 5) suggests that the rating scales generally functioned well, with all categories in the expected order and most rating categories corresponding to a distinct, if sometimes small, range of speaker comprehensibility. For the comprehensibility judgments, the second most positive category was not always clearly distinct from the highest, but otherwise each category had a peak where it was the most likely choice. For acceptability judgments, the third rating category, indicating a “somewhat” unfavorable response was the least distinct, suggesting that unacceptability was a starker judgment for most listeners.
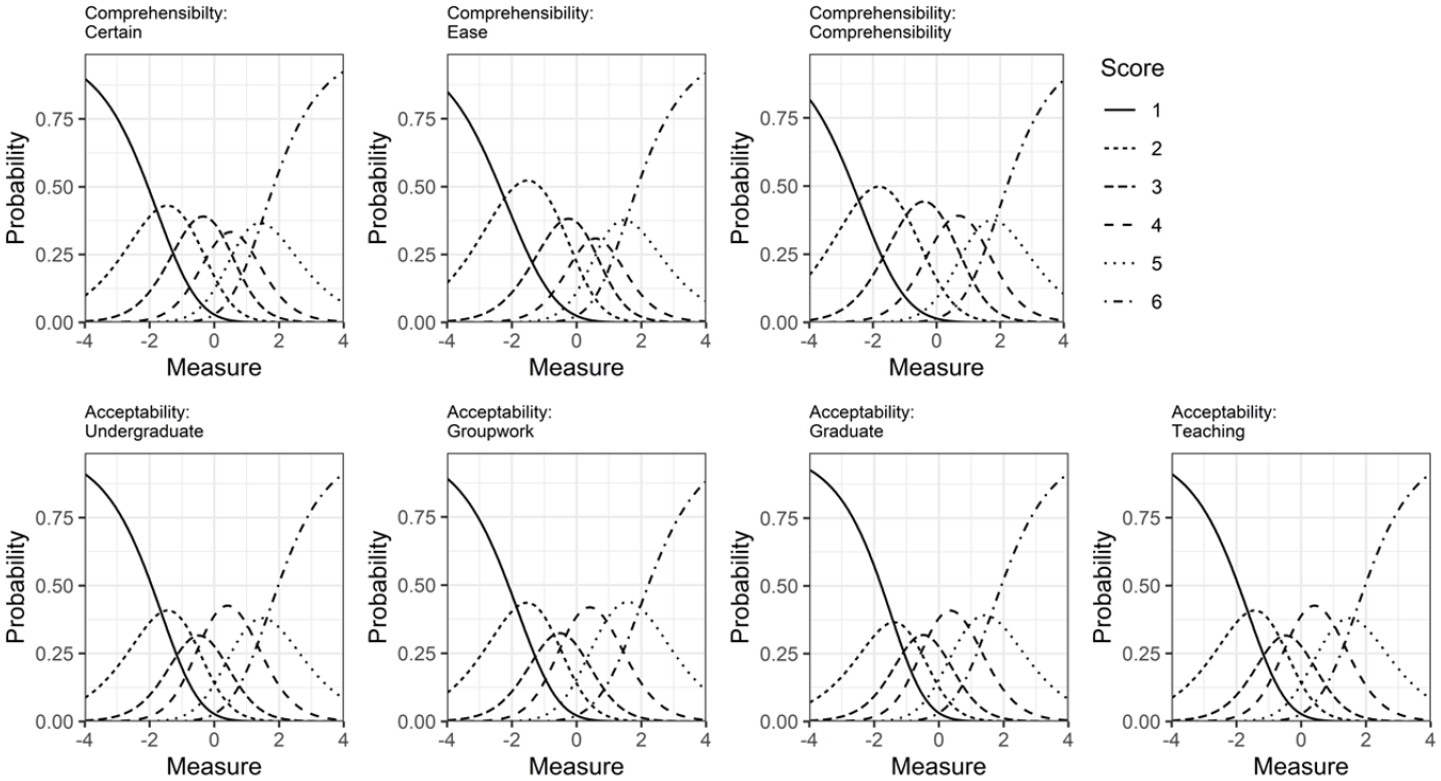
Category probability curves for speech judgments.
RQ2: Differences in speech judgments among listener groups
We examined the extent to which the groups of 53 undergraduate, 53 graduate, 45 faculty, and 39 staff listeners differed in their judgments of DET spoken performances (Table 3). For both comprehensibility and acceptability, faculty were the most lenient judges, while staff were the most strict. Undergraduate students were nearly as strict as staff, while graduate students fell between undergraduates and faculty.
Summary of judgments across listener groups.
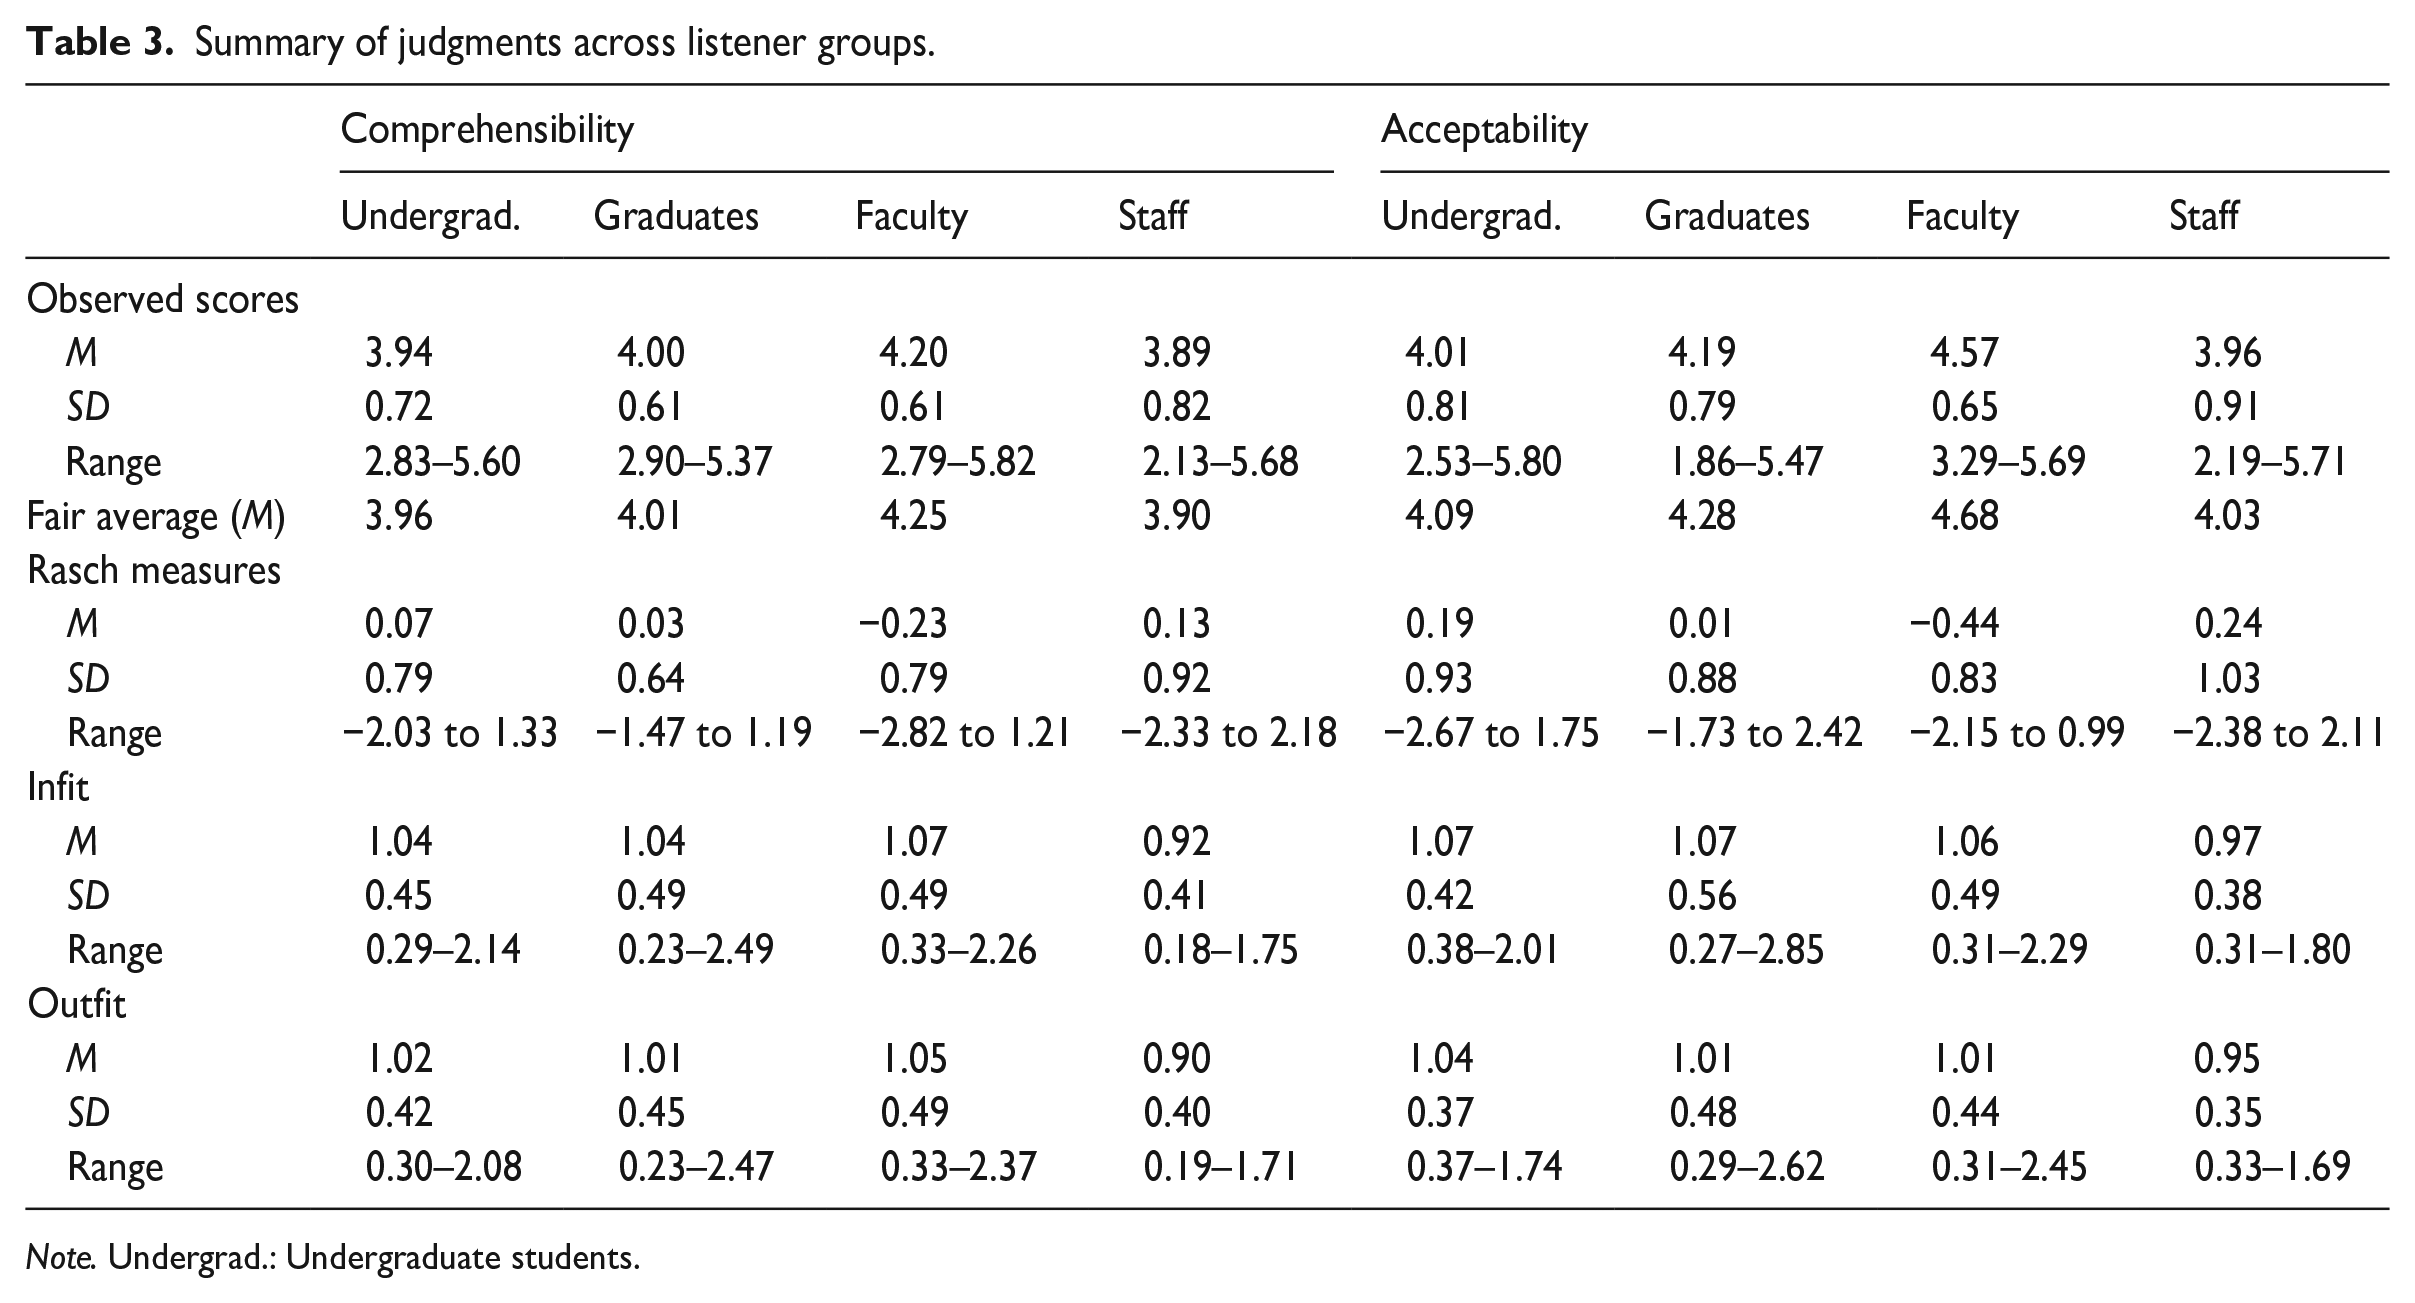
Note. Undergrad.: Undergraduate students.
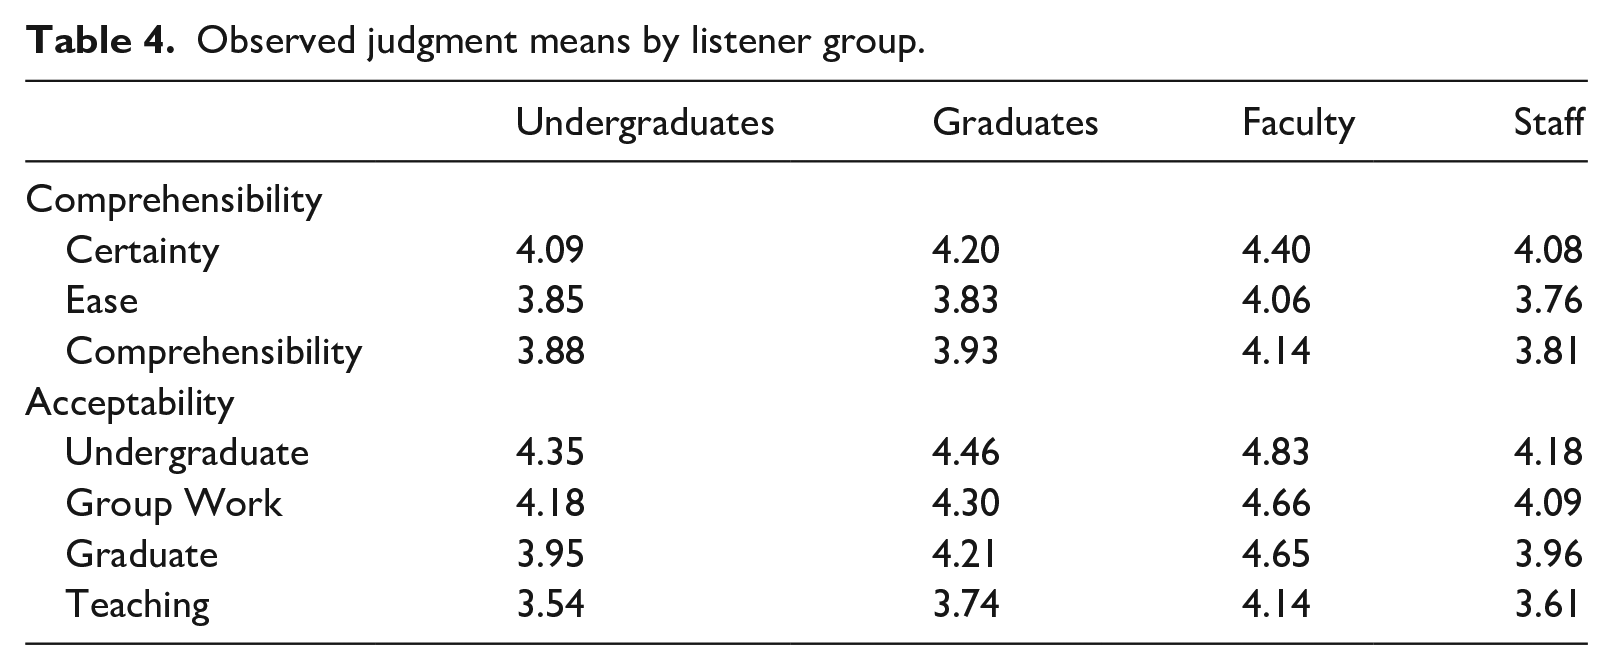
We were also interested in whether these listener groups might approach each question differently from other groups. Table 4 shows the mean observed judgments across groups for each question. Among comprehension questions, certainty yielded the most favorable judgments and ease yielded the least; a pattern which held across all listener groups. For acceptability questions, the undergraduate role yielded the most favorable judgments, followed by group work, the graduate role, and teaching.
Observed judgment means by listener group.
Bias interactions between listener groups and questions estimated in MFRM models also indicated that groups responded to questions similarly after accounting for their overall severity. Generally, chi-square results indicated that judgments functioned similarly across listener groups for comprehensibility (chi-squared = 6.7, df = 12, p = .88) but not for acceptability (chi-squared = 23.5, df = 16, p = .03). However, in both cases, the bias interactions explained negligible proportions of the overall variation in judgments (comprehensibility = 0.03%, acceptability = 0.08%). No pairwise bias comparisons were statistically significant for the comprehensibility questions, with all estimates <|0.08| logits. There were no statistically significant bias interactions between group and question for comprehensibility. For acceptability, staff were stricter than expected when it came to teaching (0.10 logits, t = 2.68, p = .008, Cohen’s d = 0.19) and more lenient than expected when it came to undergraduate study (−0.08 logits, t = −2.23, p = .026, d = −0.16) while undergraduates were more lenient than expected when it came to graduate study (−.06 logits, t = −2.05, p = .040, d = −0.13). While statistically significant, due in part to a large number of observations, these differences were small in magnitude (Plonsky & Oswald, 2014) and would generally be considered negligible in measurement (Zwick, 2012).
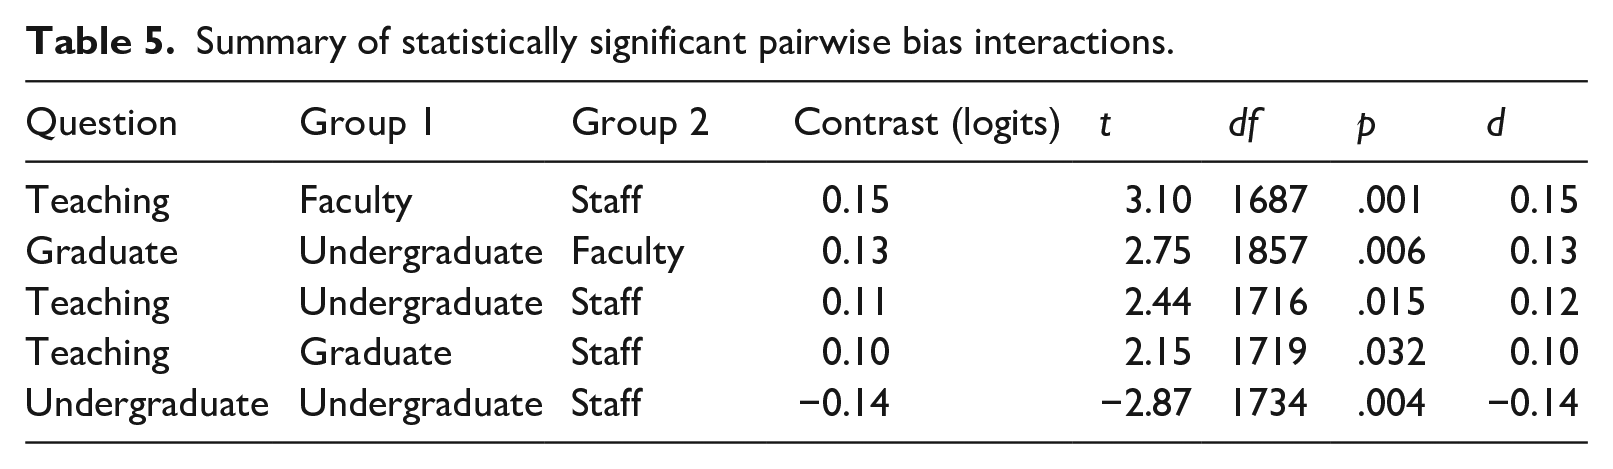
We also examined pairwise comparisons of question-related bias among the four listener groups. For comprehensibility, no pairwise comparison was statistically significant and all group contrasts were less than|.08| logits. For acceptability, there were five statistically significant contrasts (Table 5). Staff provided stricter ratings for teaching compared with all other groups, and undergraduate students provided more lenient ratings for graduate and undergraduate study compared with faculty and staff, respectively. However, the magnitudes of these differences were small, being no more than|0.15| logits or a Cohen’s d value of 0.15. In summary, group differences in responses to judgment questions were minimal, and groups ranked the difficulty of academic roles similarly.
Summary of statistically significant pairwise bias interactions.
RQ3: Relationships among speakers’ comprehensibility, acceptability, and DET scores
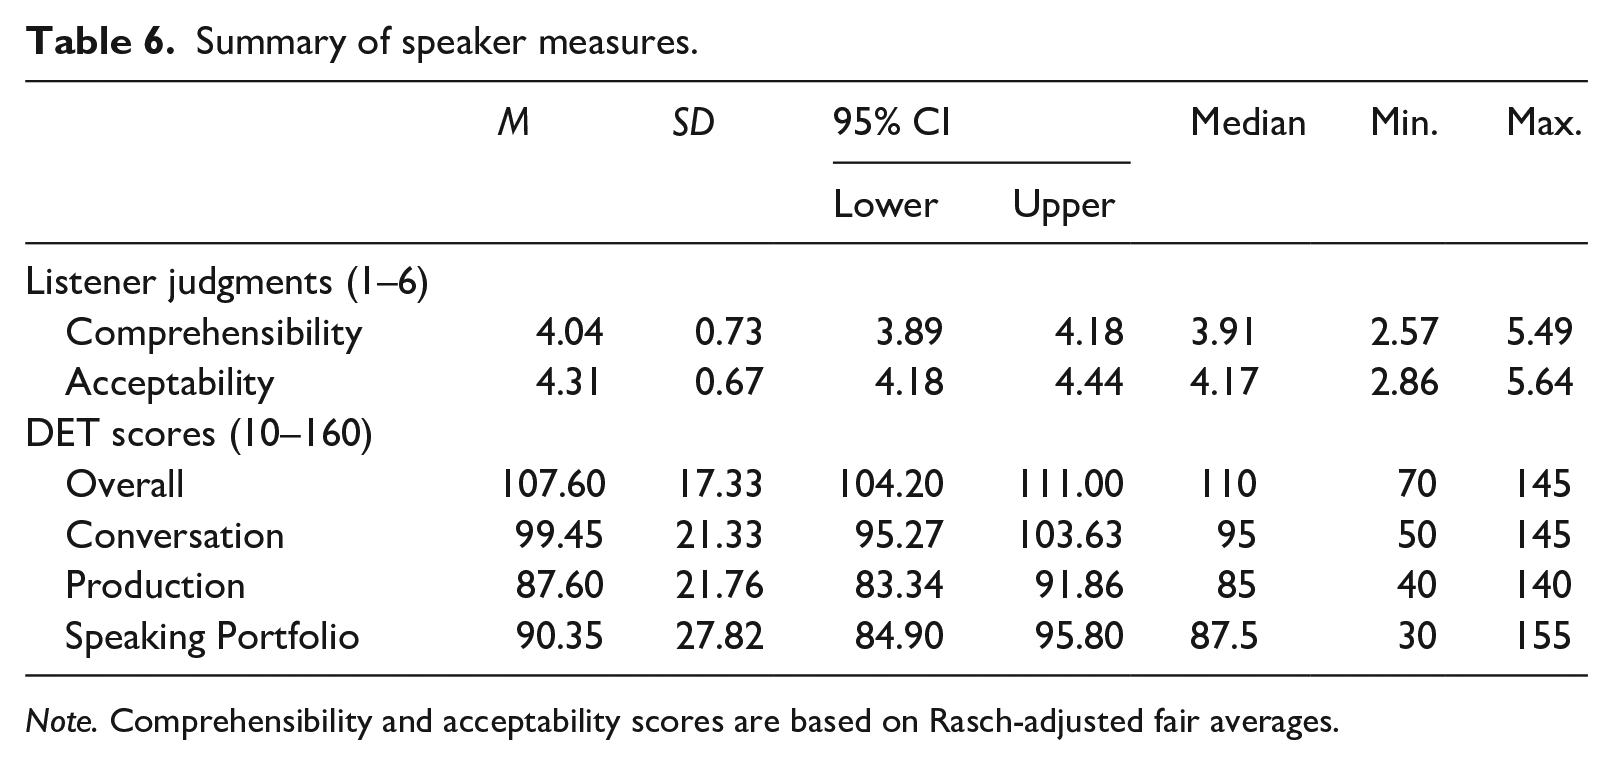
We now shift our focus to speakers. Table 6 shows summary statistics for speakers’ comprehensibility, acceptability, and DET scores. In general, speakers’ acceptability was slightly higher than their comprehensibility. Their overall DET scores were higher than their Conversation and Production subscores, and their DET-internal Speaking portfolio score was similar to their Production subscores.
Summary of speaker measures.
Note. Comprehensibility and acceptability scores are based on Rasch-adjusted fair averages.
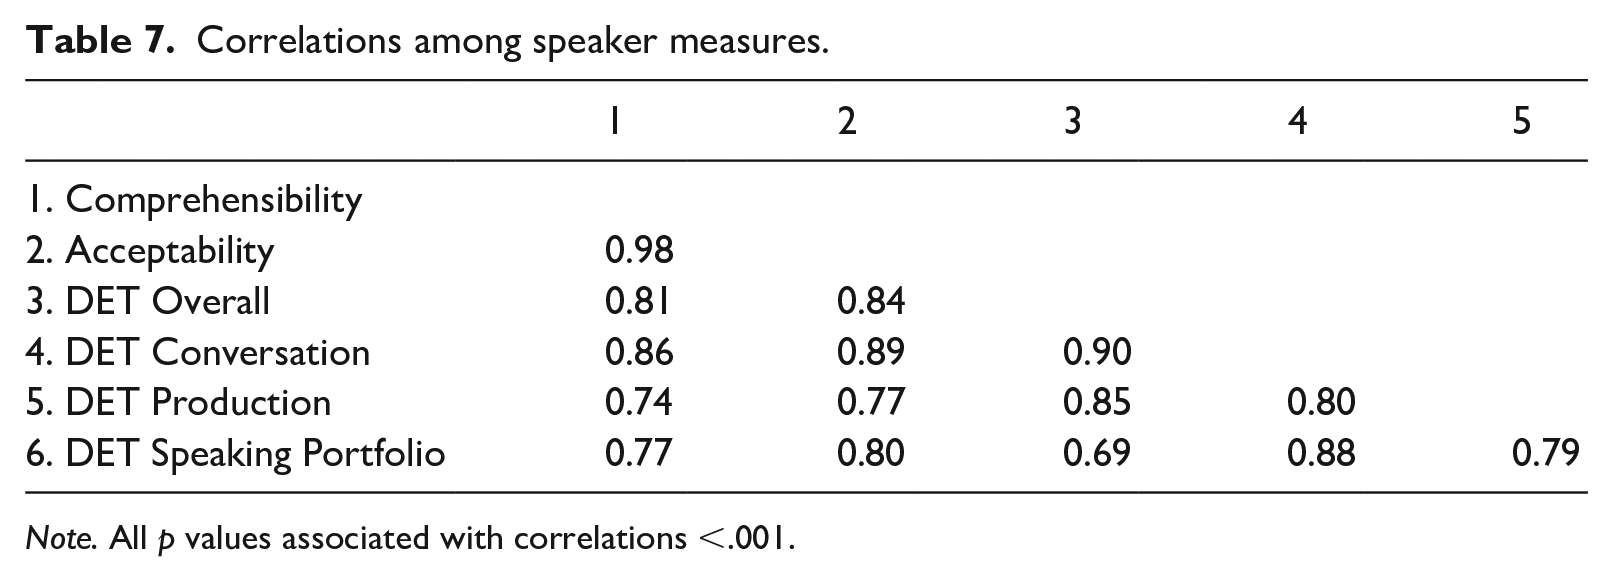
Table 7 displays Pearson correlation coefficients among listener judgments and DET scores. Notably, the correlation between comprehensibility and acceptability was nearly perfect, indicating that speakers who were more comprehensible were considered more acceptable in an academic context. The observed differences between the two constructs would appear to be a (virtual) constant, with comprehensibility having a higher standard compared to acceptability.
Correlations among speaker measures.
Note. All p values associated with correlations <.001.
All correlations between listener judgments and DET scores were substantial, with DET scores exhibiting slightly stronger relationships to acceptability than comprehensibility. Among the various DET scores, the Conversation subscore yielded the strongest correlations with comprehensibility and acceptability, followed by the DET overall score. Figure 6 provides a visual account of the relationships between DET Conversation subscores and (a) comprehensibility and (b) acceptability. Notably, there were a lack of very low (1.00–2.00) comprehensibility/acceptability scores or any DET Conversation scores below 50 (despite sampling from the lowest decile of overall DET scores).
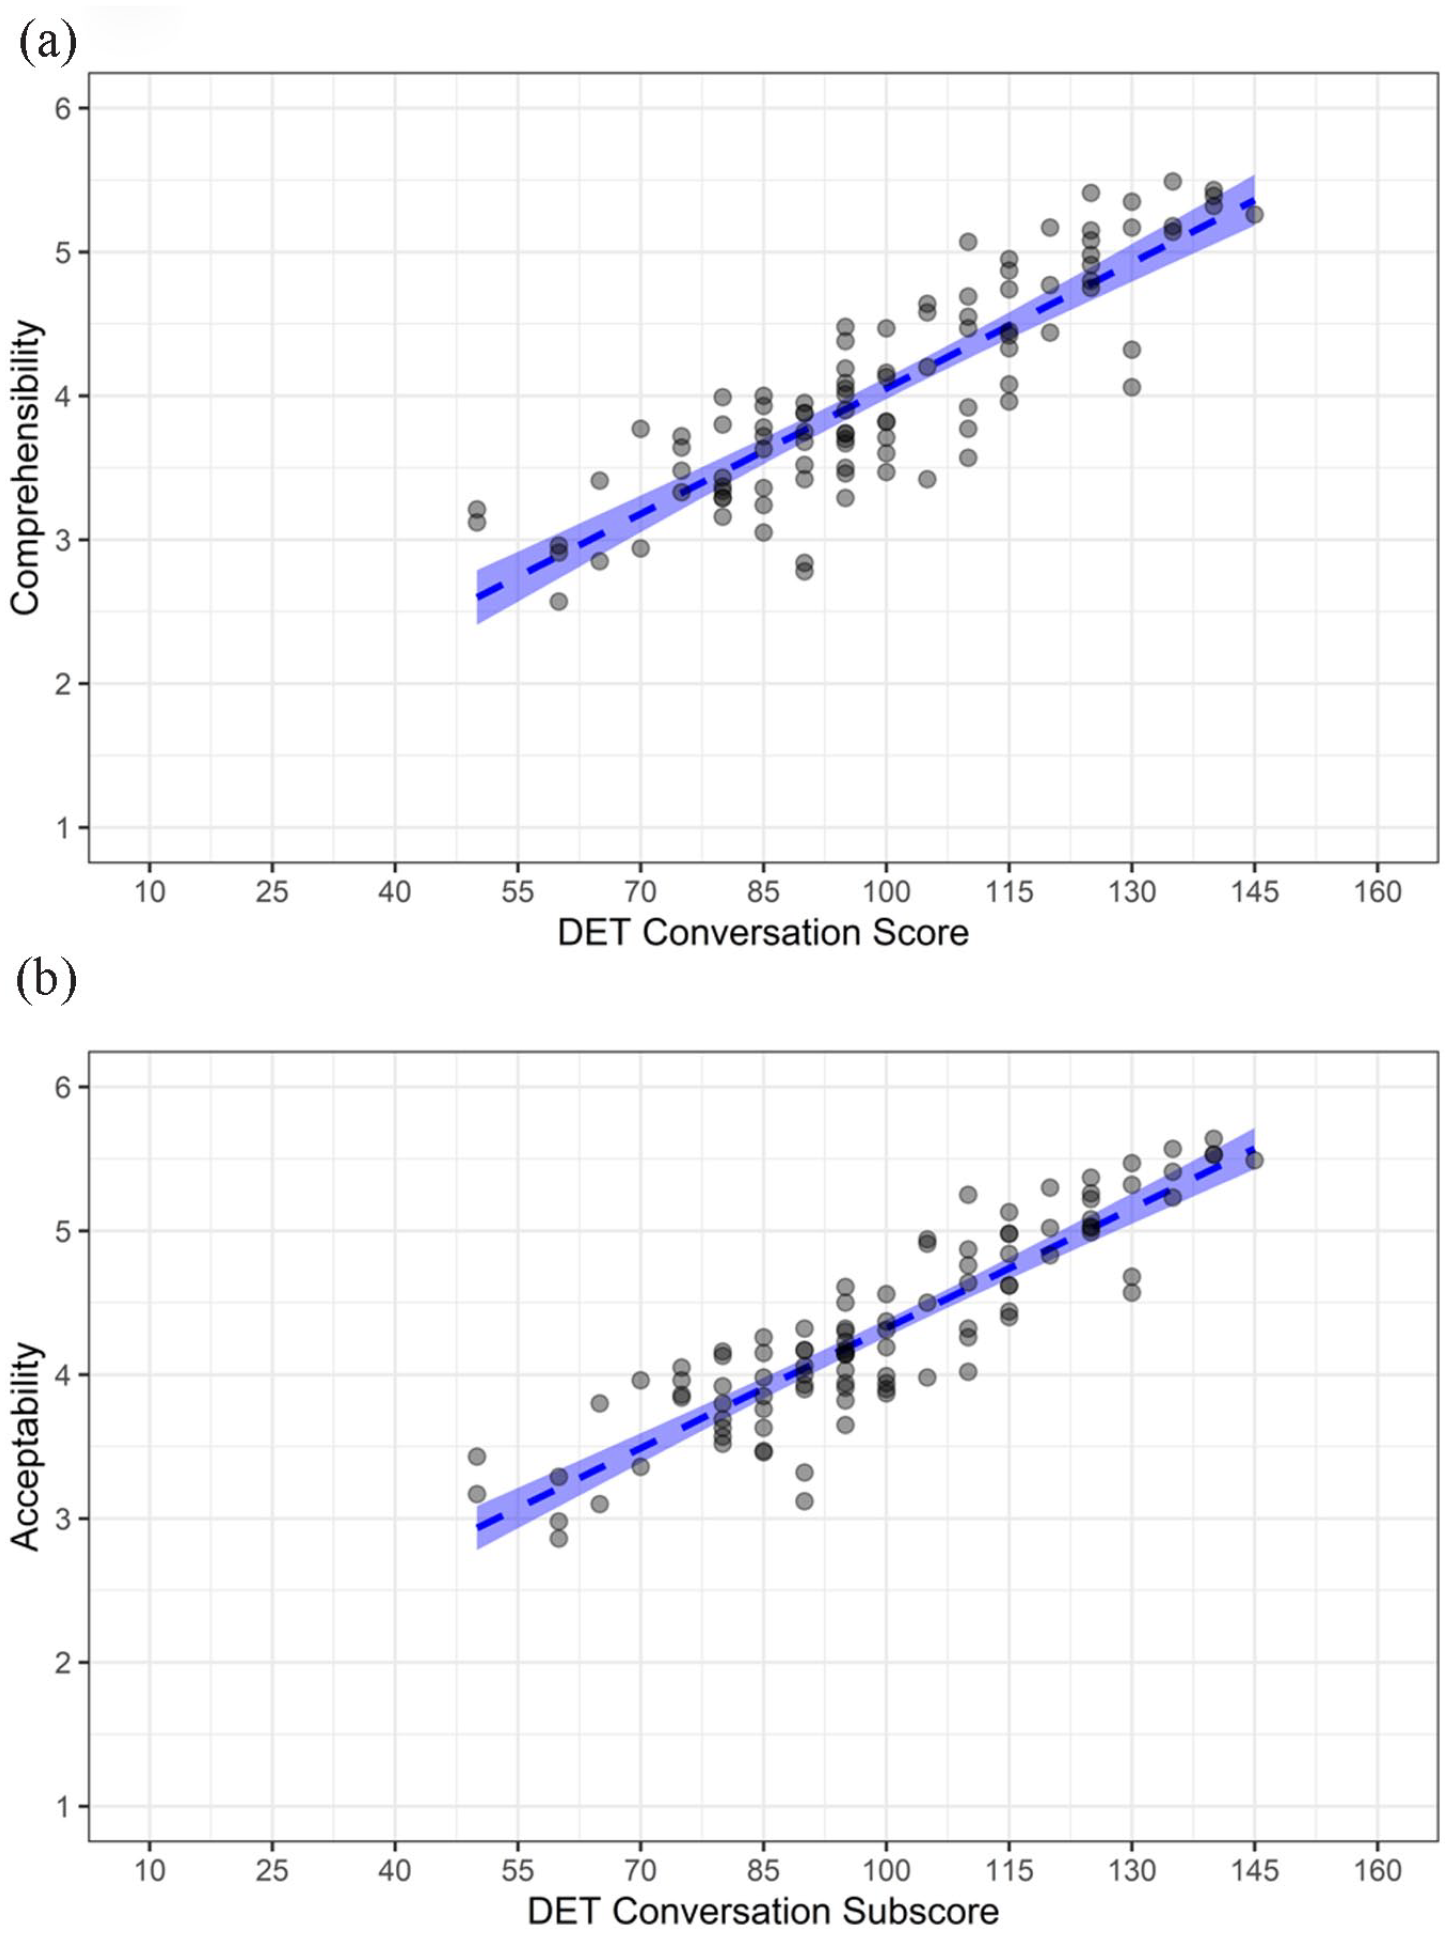
(a) DET conversation subscores and comprehensibility and (b) acceptability.
Acceptability by role
While speakers’ comprehensibility and academic acceptability to university stakeholders are both of interest, acceptability judgments are most directly relevant to the academic domain and specific questions can be linked to test score uses (i.e., specific decisions based on DET (sub)scores). Figure 7 shows the relationships between DET Overall scores (a) and Conversation subscores (b) and fair average scores for each acceptability question. The fair average scores for each question were calculated based on each speakers’ Rasch measure, question difficulty, and scale thresholds while controlling for listener severity and task function difficulty (i.e., restricting those measures to 0). A fair average greater than 4.50 (indicated by the dashed line and dots in Figure 6) means that a speaker would most likely be judged as largely or completely acceptable/effective/suitable in each role by an average listener when responding to a DET speaking task. Judgments of largely or completely are unambiguously positive (cf. somewhat, the qualifier used in the next step down on each acceptability question response scale) and might reflect a level of acceptability warranting a favorable decision. Due to the greater demands (difficulty) associated with some roles (e.g., teaching) and differences in where some scale thresholds lie, there are differences in the proportion of speakers predicted to be largely/completely acceptable for each role.
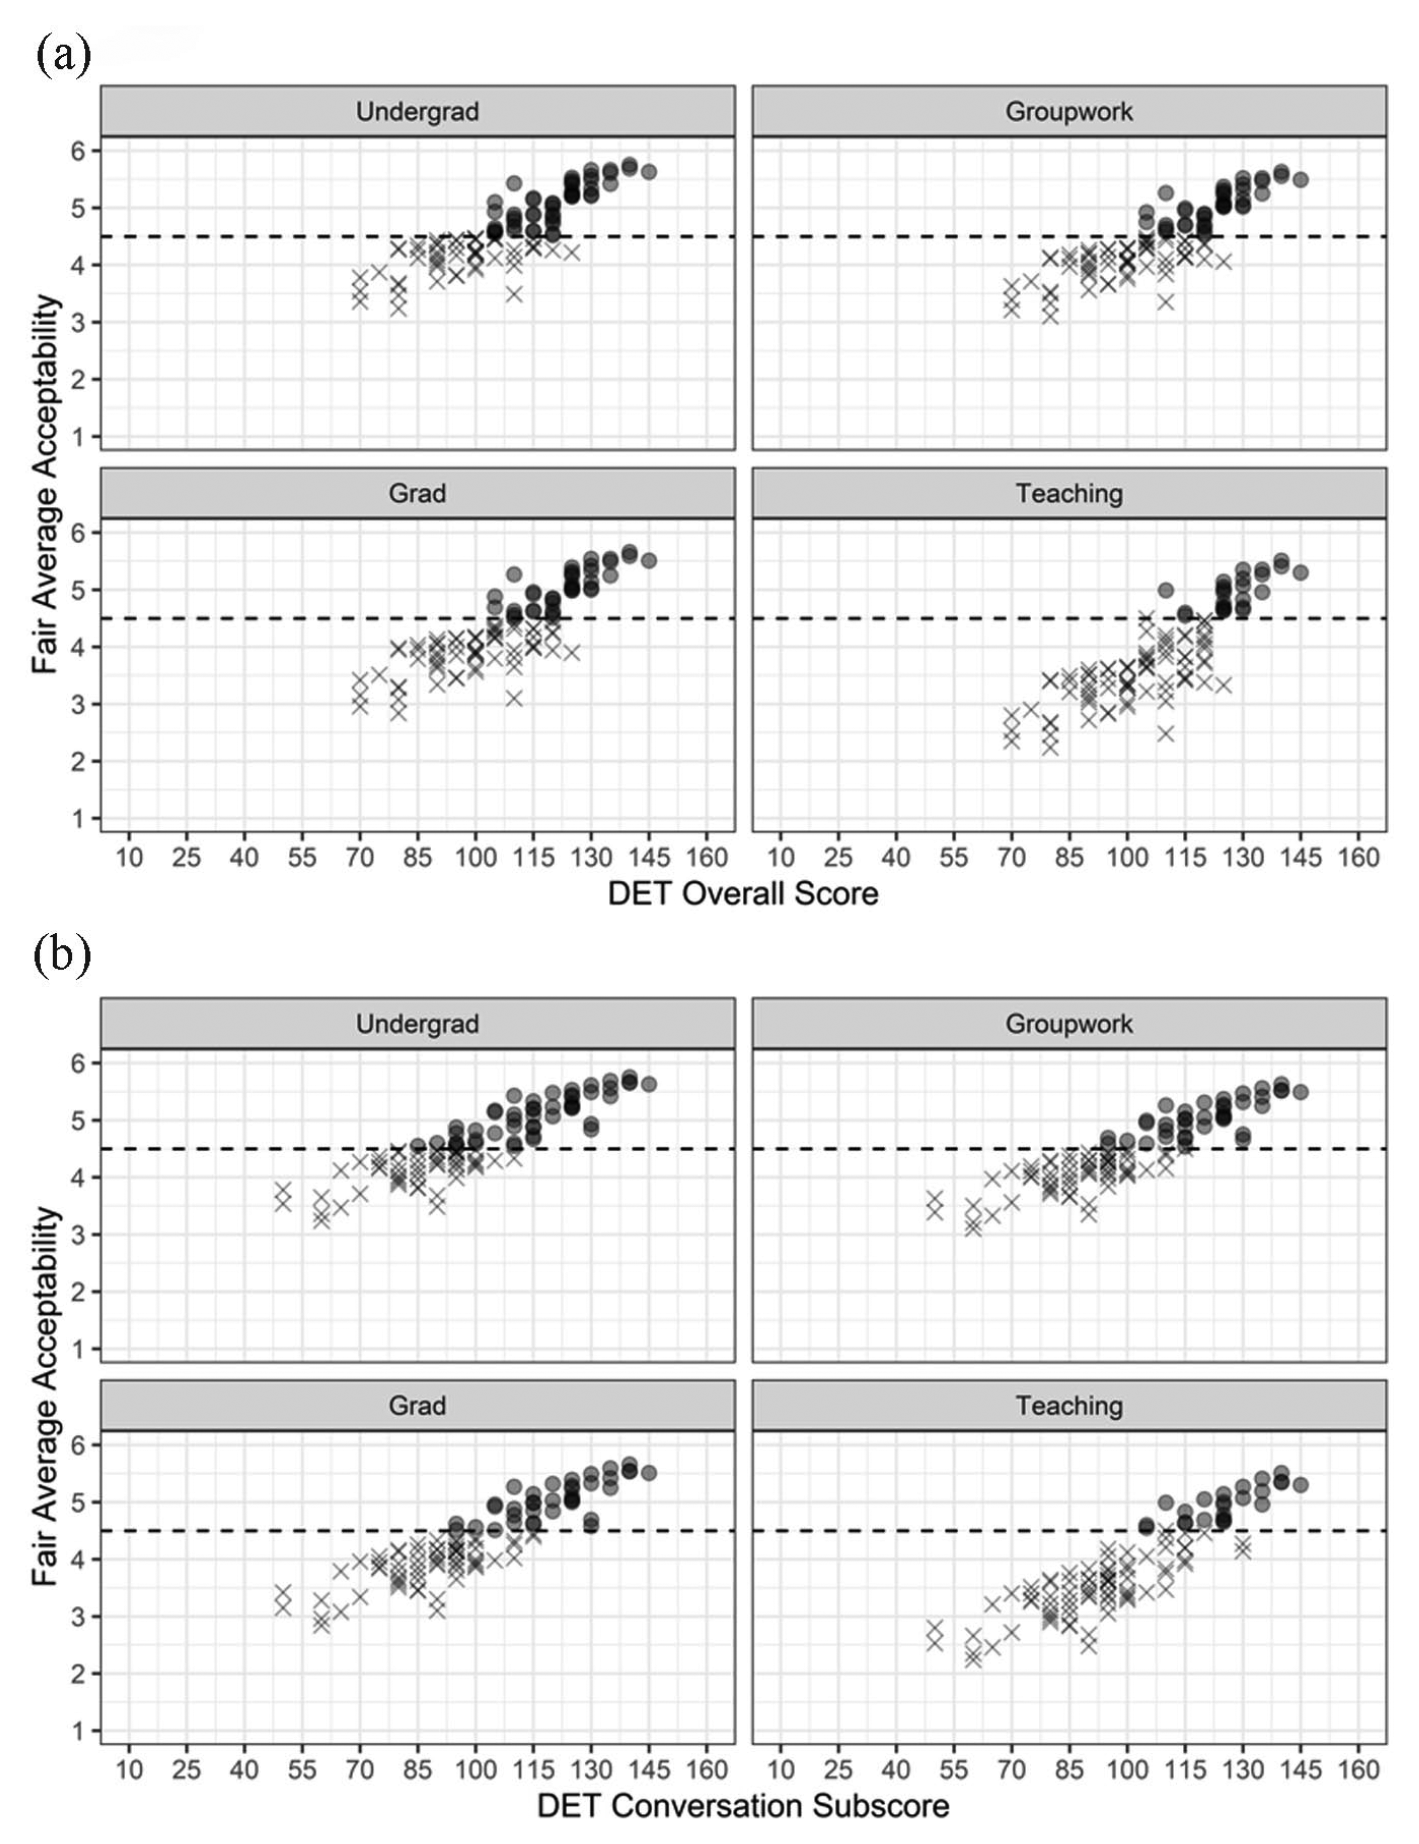
(a) Fair average acceptability scores by role and DET overall scores and (b) DET conversation subscores.
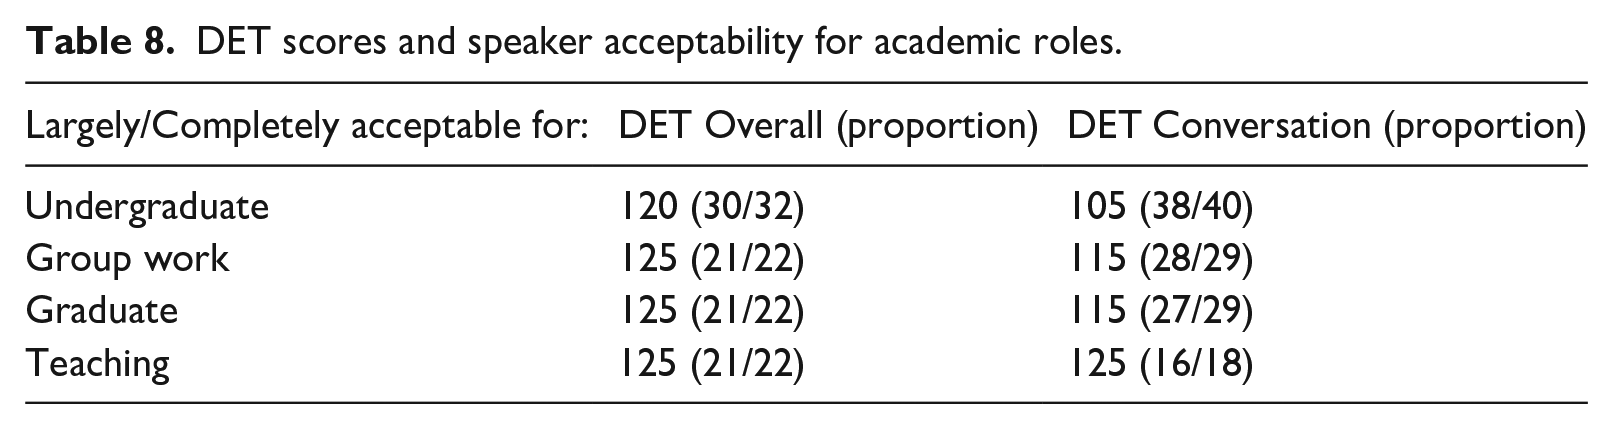
There were virtually no speakers judged to be largely/completely acceptable for any role who had DET Overall scores less than 100; for Conversation the comparable threshold was 85. Similarly, it was possible to informally identify thresholds above which nearly all speakers were deemed largely/completely acceptable for a role (Table 8). For DET Overall scores, nearly all (30/32) speakers with scores of 120 or more were judged to be largely/completely acceptable for undergraduate studies; the threshold was 125 for other roles. The thresholds based on DET Conversation scores varied more. For instance, those with Conversation scores greater than 105 were largely/completely suitable for undergraduate study. However, the Conversation threshold for teaching appeared to be 125, like the Overall score.
DET scores and speaker acceptability for academic roles.
Discussion
RQ1: Stakeholder perceptions of comprehensibility and academic acceptability in DET spoken performances
University stakeholders perceived comprehensibility and academic acceptability in similar ways, as indicated by a near perfect correlation between speakers’ measures on the two constructs—a stronger relationship than observed in previous studies (Dalman & Kang, 2021; see also Hosoda & Stone-Romero, 2010, for non-academic work settings). This finding is encouraging, as it may suggest that stakeholders in this academic context evaluate the suitability of speakers’ oral productions in terms of ease of understanding rather than other, less relevant criteria (Thomson, 2018). As one graduate student commented on the post-rating debriefing questions, “If the speech was generally comprehensible, I deemed it acceptable.” Moreover, the present findings showed that university stakeholders judged acceptability, in general, more leniently than comprehensibility, suggesting some tolerance of speakers whose speech may occasionally be difficult (though not impossible) to understand. However, stakeholders did indicate a higher acceptability standard for university teaching. Teaching is a role with substantial communicative demands, and the person doing the teaching bears much of the responsibility for ensuring the understanding of others, which might be considered a contrast to less authoritative roles where greater accommodation and collaboration in achieving understanding is normalized. These findings echo those of Dalman and Kang (2021), though extend perceptions beyond undergraduate listeners to include graduate, faculty, and staff listeners.
RQ2: Group differences in perceptions of comprehensibility and academic acceptability
Differences in severity among listener groups were evident, and it appeared that listeners with more experience in academia (graduate students, faculty) had more lenient comprehensibility and academic acceptability judgments. This finding is intuitive, as these listeners would also generally have more experience interacting with L2 speakers in academic settings, and aligns with previous research indicating that listeners more familiar with L2 speech tend to judge such speech more leniently (e.g., Kang et al., 2015). At the same time, after accounting for their overall levels of severity, the four listener groups did not substantially differ in their orientation to the various comprehensibility and acceptability questions (all statistically significant bias interactions were small/negligible in magnitude). This might be considered somewhat surprising, as neither student group were unexpectedly strict with their judgments for teaching, nor were faculty extra strict when it came to judgments of undergraduate or graduate acceptability. With respect to the acceptability questions, it thus appeared that there is a common understanding of differing levels of language demands and responsibilities associated with different academic roles, illustrated by one undergraduate’s debriefing comment: For undergraduate studies, it just mattered whether or not I felt they could convey information, assuming they have chances to reinforce certain points and respond to questions. For group work, it was roughly the same criteria. For graduate studies, I looked for the speaking to be more easily understood the first go around. For university teaching, I was looking for someone who did not leave the listener with any questions, I did not have to guess at any points, and they spoke clearly regardless of accent. They would have to get information across to many students from varying backgrounds.
RQ3: Relationships among DET scores, comprehensibility, and academic acceptability
Strong correlations between DET scores and listener perceptions of comprehensibility and acceptability were found, comparable in magnitude to Schmidgall and Powers’ (2020) analysis of TOEIC Speaking scores and listener perceptions of communicative effectiveness (r = .84) and Bridgeman et al.’s (2012) analysis of TOEFL iBT Speaking scores based on human ratings and undergraduate ratings of communicative effectiveness (r = .67–.79). Notably, DET scores used in this study are all produced by machine scoring; the correlations obtained are substantially larger than those reported for machine scoring in Bridgeman et al. (2012), which ranged from .28 to .47. We note that this machine scoring for TOEFL iBT was not operational; only scores from trained raters were used in official test results.
It is worth noting that Bridgeman et al.’s (2012) speakers were admitted university students, which could have excluded test-takers with very low speaking scores and thereby attenuated correlations. As a post-hoc analysis, we re-ran correlations based only on speakers likely to be admitted as undergraduates in US institutions. Currently, several large public universities in the United States, such as University of Washington and Rutgers University, use a DET Overall minimum of 105 in undergraduate admissions decisions (at the site of the present study, University of Hawaiʻi at Mānoa, 125 is the minimum for unconditional admission and 90 for conditional admission). Sixty-two speakers in our sample met or exceeded that cut score. Correlations with Overall scores were r = .71 for Comprehensibility and r = .72 for Acceptability, and correlations with Conversation scores were r = .79 for Comprehensibility and r = .83 for Acceptability (p < .001 in all cases).
These findings offer unambiguous, albeit limited, support for the extrapolation of DET scores to the university setting: Speakers’ DET scores were strongly associated with how university listeners evaluated their spoken English. Listener comments elicited from debriefing questions illustrated how these judgments were based on their own experiences in university settings, in line with Sato and McNamara (2019), as well as perceived academic/professional standards of the university and how other listeners might react to the speakers, as illustrated below: I tried to put the speaker in the context of the situation—undergrad, group work, grad student and faculty and what the expectations might be for language proficiency at these levels/tasks. In judging acceptability for a faculty, I considered how the accent and phrasing might make comprehension difficult for speakers with little or no experience with other languages. (Faculty)
While the support is clear, however, it is not comprehensive, and further support could be sought by comparing DET scores to evaluations of in situ academic oral discourse, for example, evaluations of lectures (or simulated lectures, Kang, 2012), oral assignments such as presentations, and interactive group work. As one faculty member stated when explaining how they imagined a speaker performing in a TLU task, “Being able to understand someone describing a picture is far different from having them teach calculus to a 19-year-old.”
DET Conversation subscores were more closely related to listener judgments of comprehensibility and academic acceptability than either overall DET scores, which draw more broadly on test-takers’ English competence, and the DET-internal speaking portfolio scores, which are based solely on DET spoken performances. It may be the case that the additional information contained in the Conversation score, from elicited imitation, dictation, and aural vocabulary tasks, captures something related to how university stakeholders form judgments of speech that is unaccounted for by DET’s AI speech scoring software. This finding adds some support for the interpretation of DET subscores in understanding test-takers’ ability in more fine-grained areas of language use, supplementing LaFlair’s (2020) psychometric analysis of subscores.
Analysis of role-specific acceptability scores and DET scores offer potentially helpful guidance for score users and further support for the interpretation and use of subscores. Although not a formal standard-setting study (cf. Wylie & Tannenbaum, 2006), our approach of dichotomizing the acceptability judgments for each candidate, rendered by “experts” in the use domain, shares some similarities. In turn, the thresholds we report, while not suitable for use as hard cut scores in any specific context, might offer test users some useful guidance for making holistic decisions about candidates (e.g., a candidate with a DET Conversation score of around 115 or greater has promise for meeting the demands of spoken English in graduate studies: see Farnsworth, 2013; Xi, 2008 for similar proposals in reference to TOEFL iBT speaking subscores).
Virtually all institutional users of DET scores use Overall scores in decision-making, but with respect to specific interpretations about academic speaking competence, the Overall score seemed less informative, with scores of 120–125 corresponding to thresholds for acceptability for all roles. This is perhaps unsurprising, as Overall scores incorporate a broad range of information about a candidate’s abilities. Conversely, the Conversation subscore highlighted different levels of oral abilities associated with acceptability for different roles, ranging from 105 for undergraduate study to 125 for university teaching. As previously indicated, such subscore use could potentially improve decision making when speaking ability is critical.
Limitations
The current study is not without limitations. As noted in the Method section, there was an error which led to an uneven distribution of speech files among listeners. Still, all speech files were judged by several listeners and MFRM leveraged the entire dataset to produce reliable measures of speaker comprehensibility and acceptability. More substantially, this study has some limits on the generalizability of its findings. First, although the DET spoken performances should be indicative of TLU domain performance in similar situations, the tasks used to elicit DET spoken performances do not capture the breadth of TLU domain tasks, many of which are more topically varied, interactive, extensive, and demanding. However, the use of test task performances allowed for the inclusion of lower-proficiency speakers who could not otherwise be recruited or observed in a university setting—a key consideration given that the primary use of the DET is to offer or deny admission. Second, while speakers sampled in this study represented a wide range of proficiency and common L1 backgrounds of DET test-takers (Cardwell et al., 2022), the listeners were a convenience sample that is less representative of stakeholders in English-medium universities in the United States, with nearly 1/5 being L2 English users and featuring more Asian and Hawaiian/Pacific Islander participants.
Conclusion
This study provides much-needed evidence related to the extrapolation of DET scores to spoken English in a university setting. The findings partially address some criticisms of the test and add some empirical support to arguments for DET use. While acknowledging that the DET Extended Speaking tasks may not share many specific characteristics of academic tasks nor elicit similar discourse, the tasks do elicit language samples that allow linguistic layperson university stakeholders to meaningfully distinguish test-takers with reference to the academic domain. In turn, those university stakeholder judgments are strongly associated with official DET scores.
Findings from this study related to our listener groups are more broadly relevant to investigations of tests used in academic decision-making. Namely, all listener groups appeared to have a shared understanding of relative difficulty/demands of academic roles, but differed in severity, with faculty providing the most lenient judgments for acceptability and comprehensibility. Although university faculty are more difficult to recruit than undergraduates, their experience (and decision-making authority) in the TLU domain should motivate their inclusion in future studies.
Supplemental Material
sj-pdf-1-ltj-10.1177_02655322231165984 – Supplemental material for Speaking performances, stakeholder perceptions, and test scores: Extrapolating from the Duolingo English test to the university
Supplemental material, sj-pdf-1-ltj-10.1177_02655322231165984 for Speaking performances, stakeholder perceptions, and test scores: Extrapolating from the Duolingo English test to the university by Daniel R. Isbell, Dustin Crowther and Hitoshi Nishizawa in Language Testing
Supplemental Material
sj-pdf-2-ltj-10.1177_02655322231165984 – Supplemental material for Speaking performances, stakeholder perceptions, and test scores: Extrapolating from the Duolingo English test to the university
Supplemental material, sj-pdf-2-ltj-10.1177_02655322231165984 for Speaking performances, stakeholder perceptions, and test scores: Extrapolating from the Duolingo English test to the university by Daniel R. Isbell, Dustin Crowther and Hitoshi Nishizawa in Language Testing
Footnotes
Acknowledgements
We thank Duolingo English Test personnel for reading and commenting on an earlier version of this article to verify our description of test content and procedures. We conducted all data collection and analysis described in this study independently, and any remaining errors are our own.
Data availability statement
Data from this study, which include official Duolingo English Test scores and speaking performances, are not available.
Declaration of conflicting interests
The authors declared no potential conflicts of interest with respect to the research, authorship, and/or publication of this article.
Ethics approval statement
This study was conducted in accordance with Language Testing informed consent guidelines. Study protocols were reviewed and approved by the University of Hawaiʻi Office of Research Compliance Human Studies Program (Protocol ID 2020-00996).
Funding
The authors disclosed receipt of the following financial support for the research, authorship, and/or publication of this article: Funding from Duolingo awarded to D.R.I. and D.C. supported this study.
Supplemental material
Supplemental material for this article is available online.
Notes
References
Supplementary Material
Please find the following supplemental material available below.
For Open Access articles published under a Creative Commons License, all supplemental material carries the same license as the article it is associated with.
For non-Open Access articles published, all supplemental material carries a non-exclusive license, and permission requests for re-use of supplemental material or any part of supplemental material shall be sent directly to the copyright owner as specified in the copyright notice associated with the article.