
Abstract
Research on assessing English as a foreign language (EFL) development has been growing recently. However, empirical evidence from longitudinal analyses based on substantial samples is still needed. In such settings, tests for measuring language development must meet high standards of test quality such as validity, reliability, and objectivity, as well as allow for valid interpretations of change scores, requiring longitudinal measurement invariance. The current study has a methodological focus and aims to examine the measurement invariance of a C-test used to assess EFL development in monolingual and bilingual secondary school students (n = 1956) in Germany. We apply longitudinal confirmatory factor analysis to test invariance hypotheses and obtain proficiency estimates comparable over time. As a result, we achieve residual longitudinal measurement invariance. Furthermore, our analyses support the appropriateness of altering texts in a longitudinal C-test design, which allows for the anchoring of texts between waves to establish comparability of the measurements over time using the information of the repeated texts to estimate the change in the test scores. If used in such a design, a C-test provides reliable, valid, and efficient measures for EFL development in secondary education in bilingual and monolingual students in Germany.
Introduction
Most research on literacy development deals with its foundation phase in monolingual contexts of teaching and learning. Interest in investigating and assessing language development in a second language has been growing recently (Barkaoui & Hadidi, 2021, p. 1). However, compared with other language domains, robust empirical evidence of proficiency development process in foreign languages is needed (Pae & O’Brien, 2018; Schoonen et al., 2011; van Gelderen et al., 2007). Findings from longitudinal analyses based on substantial samples, in particular, are rare (Barkaoui, 2014; Schrauf, 2009).
One challenge in measuring language development arises from the fact that tests used for cross-sectional measurements are not necessarily applicable to longitudinal designs. In settings with repeated measurements of theoretical constructs, such as language proficiency, tests must meet both: (1) standards of test quality such as validity, reliability, and objectivity (American Educational Research Association [AERA], 2014) and (2) longitudinal measurement invariance (MI) which allows for valid interpretations of the development in test scores over time (Barkaoui, 2014; Nagle, 2022). Development is defined as a change over time (Little, 2013). In order to capture language development, the assessment should measure the change in language proficiency. Interpreting change as reflecting development in the skills being assessed is only possible when the assessment measures the same abilities or constructs over time (Llosa, 2011). The establishment of the constructs’ reliability and validity at each point of measurement is crucial because both properties may change over time. Therefore, the assessments’ MI is required because only under this condition, change in a test score could be seen as having been caused by true development in the addressed language proficiency and not by the variation in the measurement conditions (Lord & Novick, 1968; Millsap, 2011).
Confirmatory factor analysis (CFA) proved to be the method of choice for MI analysis because it allows the explicit modeling of a test’s psychometric properties (Millsap, 2011). CFA is a widely used method for modeling theoretical constructs in educational measurement (Brown, 2015), especially in longitudinal designs (Little, 2013). However, in applied linguistics, there is a high demand for implementing this method to ensure the comparability of language test scores over time to recommend their usage in longitudinal research designs (Nagle, 2022).
The current study has a methodological focus and aims to examine the longitudinal MI of a C-test used to assess the development of foreign language skills in English as the first foreign language in secondary school students in Germany. By doing so, the applicability of the C-tests for longitudinal measurement of foreign language skills will be investigated. The current study intends to extend the growing body of research on the assessment of foreign language development by addressing an approach dealing with challenges unique to longitudinal measurements.
C-test
The C-test is a popular language testing instrument where a respondent has to fill gaps in short texts. The linguistic principle underlying C-test construction is the redundancy of any natural language, enabling a competent speaker to decode distorted information. The reconstruction of systematically deleted parts of words in a text indicates general language proficiency (Eckes & Grotjahn, 2006). In a C-test, the second half of every second or third word is deleted as opposed to Cloze tests in which whole words are missing. A C-test consists of 4–6 independent texts with 20–25 gaps each (Grotjahn, 2002), representing a testlet structure (or item bundles; Rosenbaum, 1988; Wainer & Kiely, 1987). The texts’ first and last sentences are completely intact to provide a semantic context for the task (Grotjahn, 2002, 2004).
Owing to this testlet structure, a C-test brings several benefits to language assessment (Alpizar et al., 2022): (1) it increases test time efficiency (Bradlow et al., 1999) by providing a quick performance estimation (Norris, 2018) based on much information gathered in a short time (Min & He, 2014); (2) it provides a more in-depth estimation than many traditional test formats (DeMars, 2006; Hamdi et al., 2018); and (3) it can be aligned to the Common European Framework of Reference for Languages (Council of Europe, 2020; see Eckes, 2012).
Eckes and Grotjahn (2006) conclude that this holistic measure of general language ability encompasses receptive and productive language skills offering insights into students’ literacy. They provide reliable estimates of the learners’ general language proficiency, especially in foreign language assessment (Grotjahn, 2002).
Concerning construct validity, C-tests highly correlate with other measures such as language tests, self-assessments, and students’ school grades, as shown by previous research (Daller et al., 2021; Eckes, 2012; Grotjahn, 2002; Harsch & Hartig, 2016; Hastings, 2002). According to theory, C-tests should also be suitable for language development testing (Aguado et al., 2007). However, to our best knowledge, the applicability of C-tests in a longitudinal design has not yet been empirically substantiated by previous research.
The C-test is used for various high-stakes educational assessments like screenings and placement testing (e.g., Harsch & Hartig, 2016; Mozgalina & Ryshina-Pankova, 2015 ; Norris, 2006) as well as a proficiency indicator in the second-language acquisition (SLA) research (e.g., Lee-Ellis, 2009; Norris, 2018; for details, see Alpizar et al., 2022).
Measurement invariance (MI)
If a construct is measured in multiple groups or at multiple time points, comparing these measurements requires MI. MI is the notion that a measurement instrument works in the same way in varied conditions, such as different data collection waves and groups of participants, given these conditions are irrelevant to the construct itself (see Millsap, 2011). Thus, a test score reflects a person’s true score on the addressed construct plus some random error. In turn, if measurements are systematically affected by concomitant conditions, it is referred to as measurement bias, and the comparability of the data is questionable. Latent variable models such as in the structural equation modeling (SEM) or item-response theory (IRT) frameworks provide measurement models that allow for evaluating an instrument’s psychometric properties supporting the comparability of data. In the SEM framework followed here, MI is evaluated by CFA and is a part of the model’s factorial invariance (e.g., Horn & McArdle, 1992; Little, 1997; Meredith, 1993). Routed in the common factor model (Thurstone, 1947), CFA (Bollen, 1989; Brown, 2015) uses observed test scores as an indication of unobserved theoretical constructs. One of the various virtues of this latent modeling approach is that psychometric properties are explicitly testable by imposing parameter restrictions on the measurement model’s factorial structure. Recalling the CFA measurement model for measurements at multiple time points

where

where
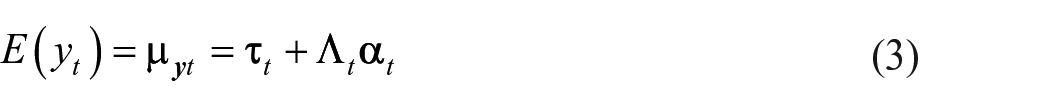
where
A measurement model’s MI depends on whether the model parameters are invariant across time points or groups. To what extent this is the case can be validated by testing invariance hypotheses through restrictions imposed on the models’ covariance and mean structures (see Equations 2 and 3). Four levels of factorial invariance are distinguished, imposing equality assumptions across time or groups (for an overview, see Cheung & Rensvold, 2002; see Table 1):
Formal definitions of factorial invariance levels (see Little, 2013).
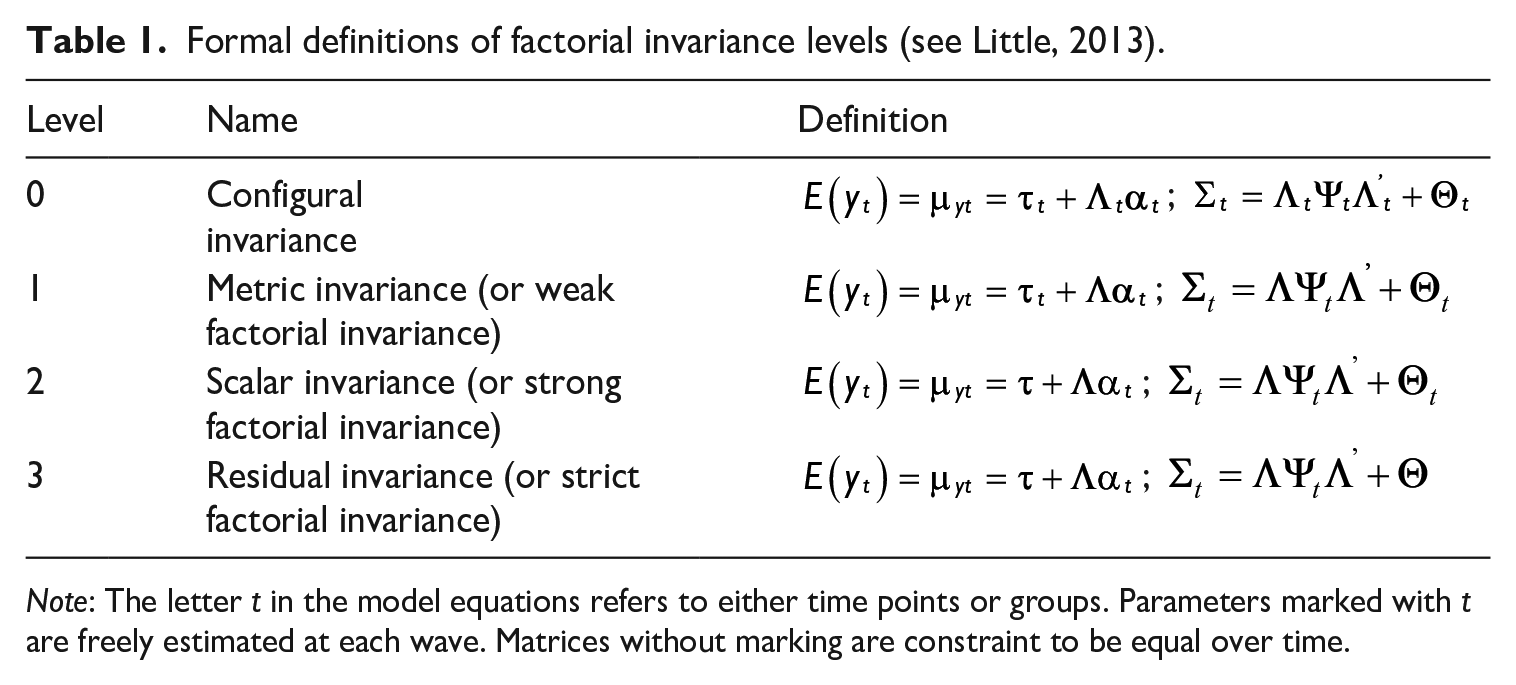
Note: The letter t in the model equations refers to either time points or groups. Parameters marked with t are freely estimated at each wave. Matrices without marking are constraint to be equal over time.
Configural invariance (e.g., Horn & McArdle, 1992; Meredith, 1993) means that structurally identical models fit the data, that is, the same number of latent factors are associated with the same indicators. Apart from that, all model parameters are freely estimated. If this is the case, it can be assumed that the theoretical construct was measured structurally invariant.
Metric invariance (also: weak factorial invariance, e.g., Horn & McArdle, 1992; Little, 1997; Steenkamp & Baumgartner, 1998) holds when the factor loadings are also the same across groups or time points, respectively. In the formal definition, this is expressed by dropping the index of
Scalar invariance (also: strong factorial invariance, e.g., Little et al., 2007; Meredith, 1993; Steenkamp & Baumgartner, 1998) holds if the latent intercepts are also identical across groups or time points, expressed by omitting the index of
Residual invariance (also: strict factorial invariance, e.g., Little et al., 2007; Meredith, 1993; Steenkamp & Baumgartner, 1998) means that the indicator-specific residual variances are also invariant, indicating equal reliability across groups or time points. In the formal definition, this is expressed by dropping the index of
MI is always tested for the whole model. However, if a certain level cannot be confirmed, this does not necessarily mean that all parts of the model are affected. In most cases, models suffer local invariance problems, with only some parameters affected. Therefore, in applied research, it is recommended to relax the invariance restrictions and estimate the affected model parameters freely. As a result, the tested level of MI can be assumed to be partially reached. If only a small part of the model is affected by this exception and no serious bias is to be expected, the comparison between groups and time points is acceptable (Bollen, 1989; Byrne et al., 1989; Cheung & Rensvold, 2002; Millsap, 2011; Wang & Wang, 2012).
The final level of MI is then identified by model comparisons, where the most restrictive model, which fits the data not poorer than the previous less restrictive model, sets the MI level (Millsap, 2011).
Research questions and analytical strategy
In this study, we seek to answer whether a C-test is applicable in a longitudinal research design to assess the development of general language proficiency in English as a foreign language (EFL) in secondary students in Germany, where English is the first mandatory foreign language, mostly learned from the first grade. For this aim, we used repeated measurements of a C-test in EFL from a large-scale dataset on secondary students’ multilingual development across secondary education in Germany. In our view, three major conditions have to be met to affirm the C-test’s applicability for longitudinal measurement:
The C-tests’ longitudinal MI is at least at the scalar level so that change in the latent means can be reliably interpreted as true construct development rather than variability in the measurement conditions (H1).
The C-test is invariant across age groups so that test scores are comparable across secondary education (H2).
The C-test is sensitive enough to detect English foreign language development at this stage of schooling (H3).
As an analytical strategy, we estimate a series of nested CFA models to test MI hypotheses and evaluate the latent means’ development over time based on unbiased parameter estimates.
Method
Study design
We applied data from the German panel study MEZ, funded by the German Federal Ministry of Education and Research (BMBF). 1 Within an interdisciplinary approach, MEZ investigated the development of multilingualism in German secondary students. The longitudinal cohort-sequence design comprised two starting cohorts with four data collection waves (2016–2018). The MEZ panel incorporated 2103 students with Russian, Turkish, and monolingual German language backgrounds in 78 schools in eight German federal states (Baden-Wuerttemberg, Bremen, Hamburg, Hesse, Lower Saxony, North Rhine-Westphalia, Rhineland-Palatinate, and Schleswig-Holstein).
The MEZ sampling design targeted students with the following characteristics (Klinger et al., 2022):
Students with German–Russian, German–Turkish, or monolingual German background who learned English as their first foreign language at school and, where applicable, French or Russian as a second foreign language;
Students from seventh (age 13+) or ninth (age 15+) grades;
Students attending school in Germany at least since the third grade and have learned English as their first foreign language at school;
Students attending Gymnasium 2 (at least 50% of the sample) to gather a sufficient number of high-performing students with multilingual literacy skills.
A two-step sampling strategy was conducted: First, schools were selected with student populations that met the sampling criteria. Second, students within these schools were selected based on the abovementioned criteria. Schools and students were not selected randomly. Sampling, ethics approval, and data collection were carried out by the International Association for the evaluation of educational achievement (IEA). 3
All students were tested in the majority language (German) and the first foreign language (English). Students with Russian or Turkish language backgrounds were also tested in their heritage languages. Furthermore, those students who learned either French or Russian as a second foreign language at school were tested in these languages as well. In addition, data were collected on individual (e.g., motivation, cognitive ability), contextual (e.g., social and ethnic background), as well as linguistic (e.g., typological characteristics of languages) aspects influencing language development.
In order to measure general language ability in EFL, the MEZ team developed eight C-tests based on curricula for the foreign language classes in secondary schooling; two texts were taken from the KESS 8 study 4 (Bos & Gröhlich, 2010). Each C-test consists of four texts per data collection wave. Training and motivation effects were to be minimized by alternating texts between waves. Thus, for the longitudinal C-test design applied in MEZ (see Table 2), 10 different texts were used, and they were distributed across the four waves of data collection as follows: Wave 1 (Y1, Y2, Y3, Y4), Wave 2 (Y5, Y3, Y4, Y6), Wave 3 (Y7, Y3, Y6, Y8), and Wave 4 (Y6, Y8, Y9, Y10). As seen for the first wave, the texts Y1 and Y2 were administered only once. In contrast, the text Y3 was repeated in the second and third waves and Y4 in the second wave. Two new texts were administered in the second wave: Y5 only once, Y6 was repeated in the third and fourth waves, Y7 and Y8 were introduced in the third wave, and Y8 was repeated in the fourth wave. Finally, Y9 and Y10 were added as new texts in the fourth wave.
Distribution of the 10 C-Test over the four waves of the longitudinal data collection.
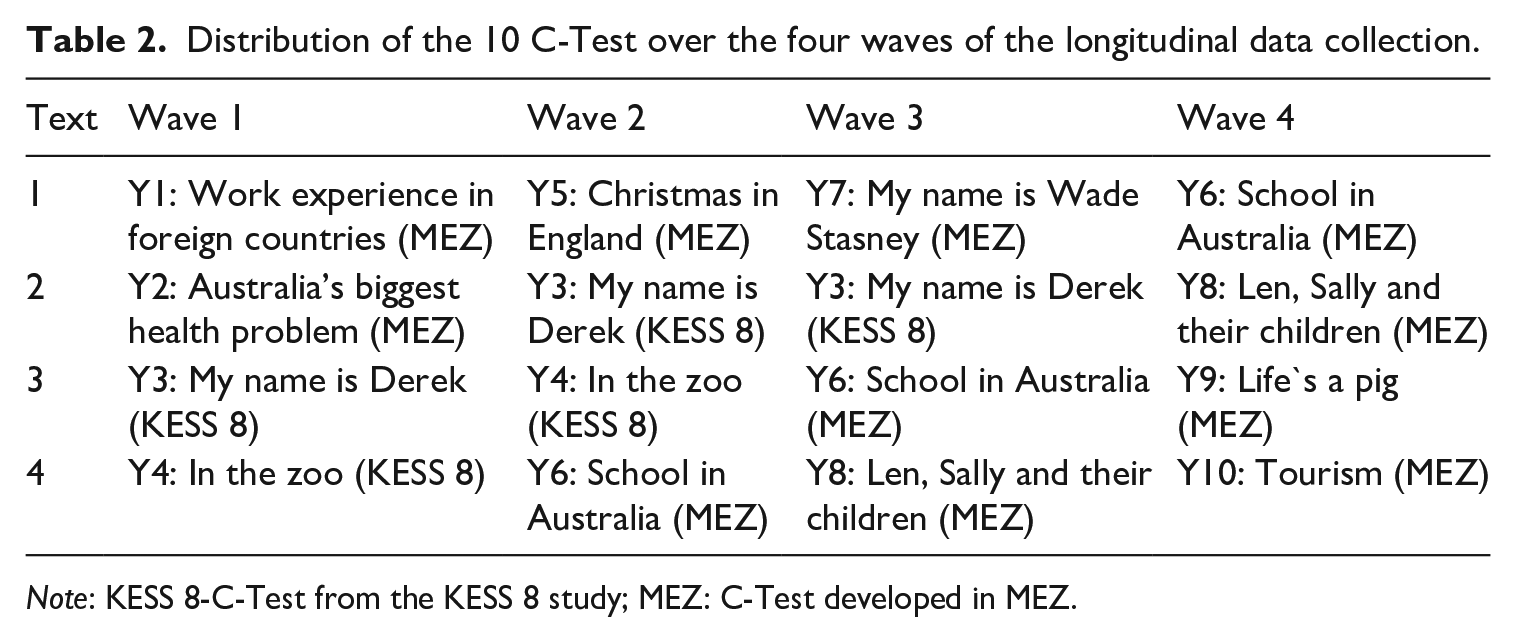
Note: KESS 8-C-Test from the KESS 8 study; MEZ: C-Test developed in MEZ.
In order to calibrate the different test versions for longitudinal measurement, we used the information of the repeated texts as an anchor to establish the measurement models’ longitudinal MI to produce comparable parameter estimates. The rotation of texts followed the rationale of repeating two texts from the previous wave and adding two new ones in each subsequent wave (see Table 2). Against this rationale, two texts were repeated over three waves each (Y3 and Y6) in a temporally lagged sequence to ensure longitudinal compatibility.
Sample statistics
We use data from all waves, starting cohorts, and language groups in the current study. We only excluded cases with no valid C-test score (n = 147) for any wave (complete missing) from the original MEZ sample (n = 2103). The longitudinal sample used for the current analysis consists of 1956 students (50.5% from the seventh-grade starting cohort and 49.5% from the ninth-grade starting cohort), including 990 monolingual German (98.0% born in Germany, 57.6% females, 47.7% Gymnasium), 364 German–Russian (98.0% born in Germany, 57.6% females, 47.7% Gymnasium), and 602 German–Turkish bilinguals (93.2% born in Germany, 57.0% females, 40.0% Gymnasium). Table 3 reveals students’ grades and mean age across the four waves of data collection. Since the students in our sample are mostly second-generation immigrants who attended German school for no later than the third grade and learned English as the first foreign language in compulsory education, we expect no differential functioning of the C-test in the Russian and Turkish language groups and, therefore, considered them jointly in the data analysis.
Students’ mean age and grade across four waves of data collection.
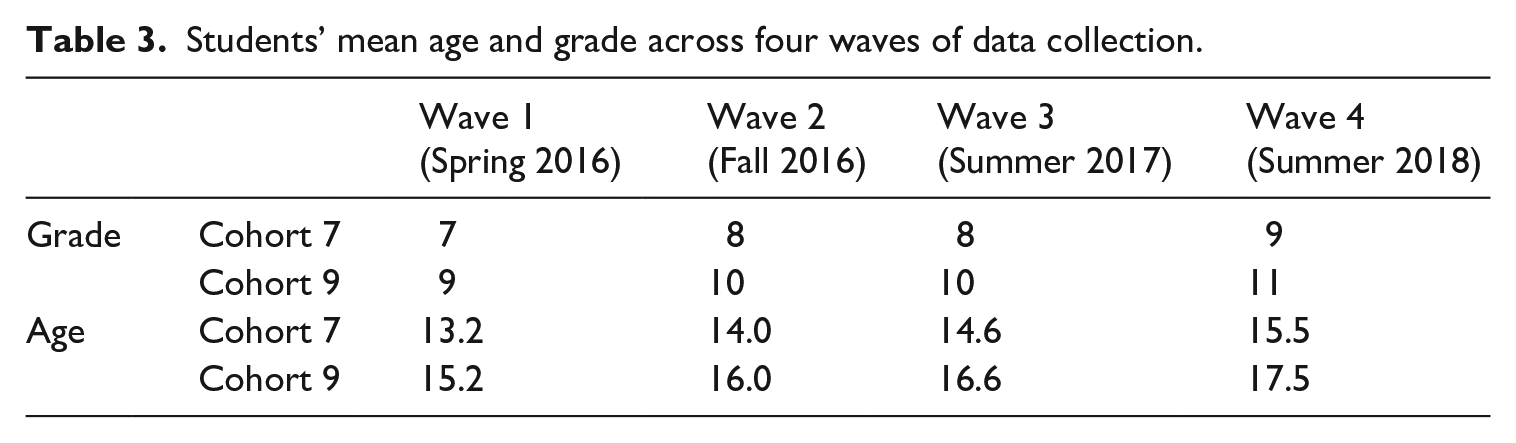
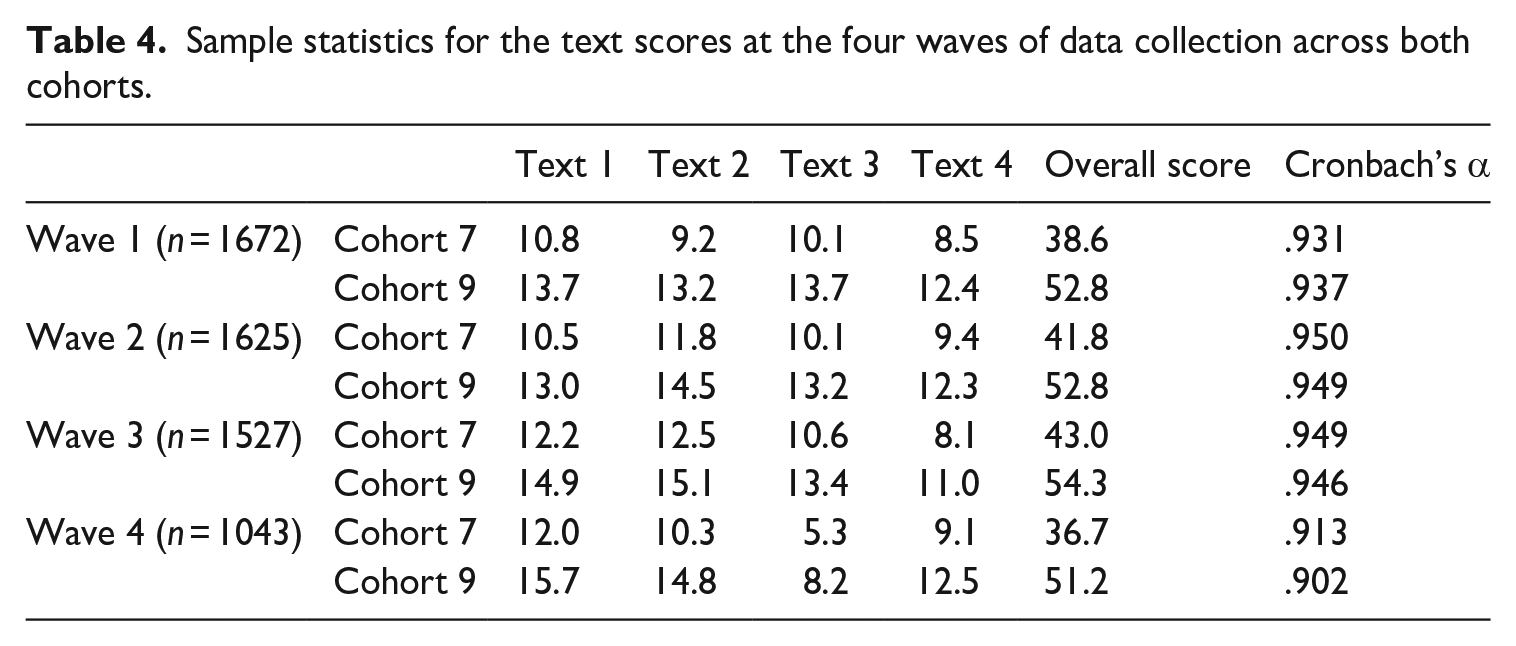
Table 4 shows the means and standard deviations of the raw C-test scores for four waves of data collection. Each C-test consists of four texts with a maximum of 20 points each. The C-test overall score for each wave is the unweighted sum of the scores for the four texts with a maximum of 80 points. Since texts differ in their number of gaps, all scores may be transformed to have 20 gaps [(score/number of items)*20]. Cronbach’s alpha is excellent at each wave, ranging from
Sample statistics for the text scores at the four waves of data collection across both cohorts.
Statistical analyses
Figure 1 shows a graphical representation of the applied CFA model to test for the C-tests’ longitudinal MI. The model represents the development in general language proficiency in EFL. The C-test scores are the models’ observed variables (Y1–Y10) that serve as indicators for the latent construct of general language ability in EFL.
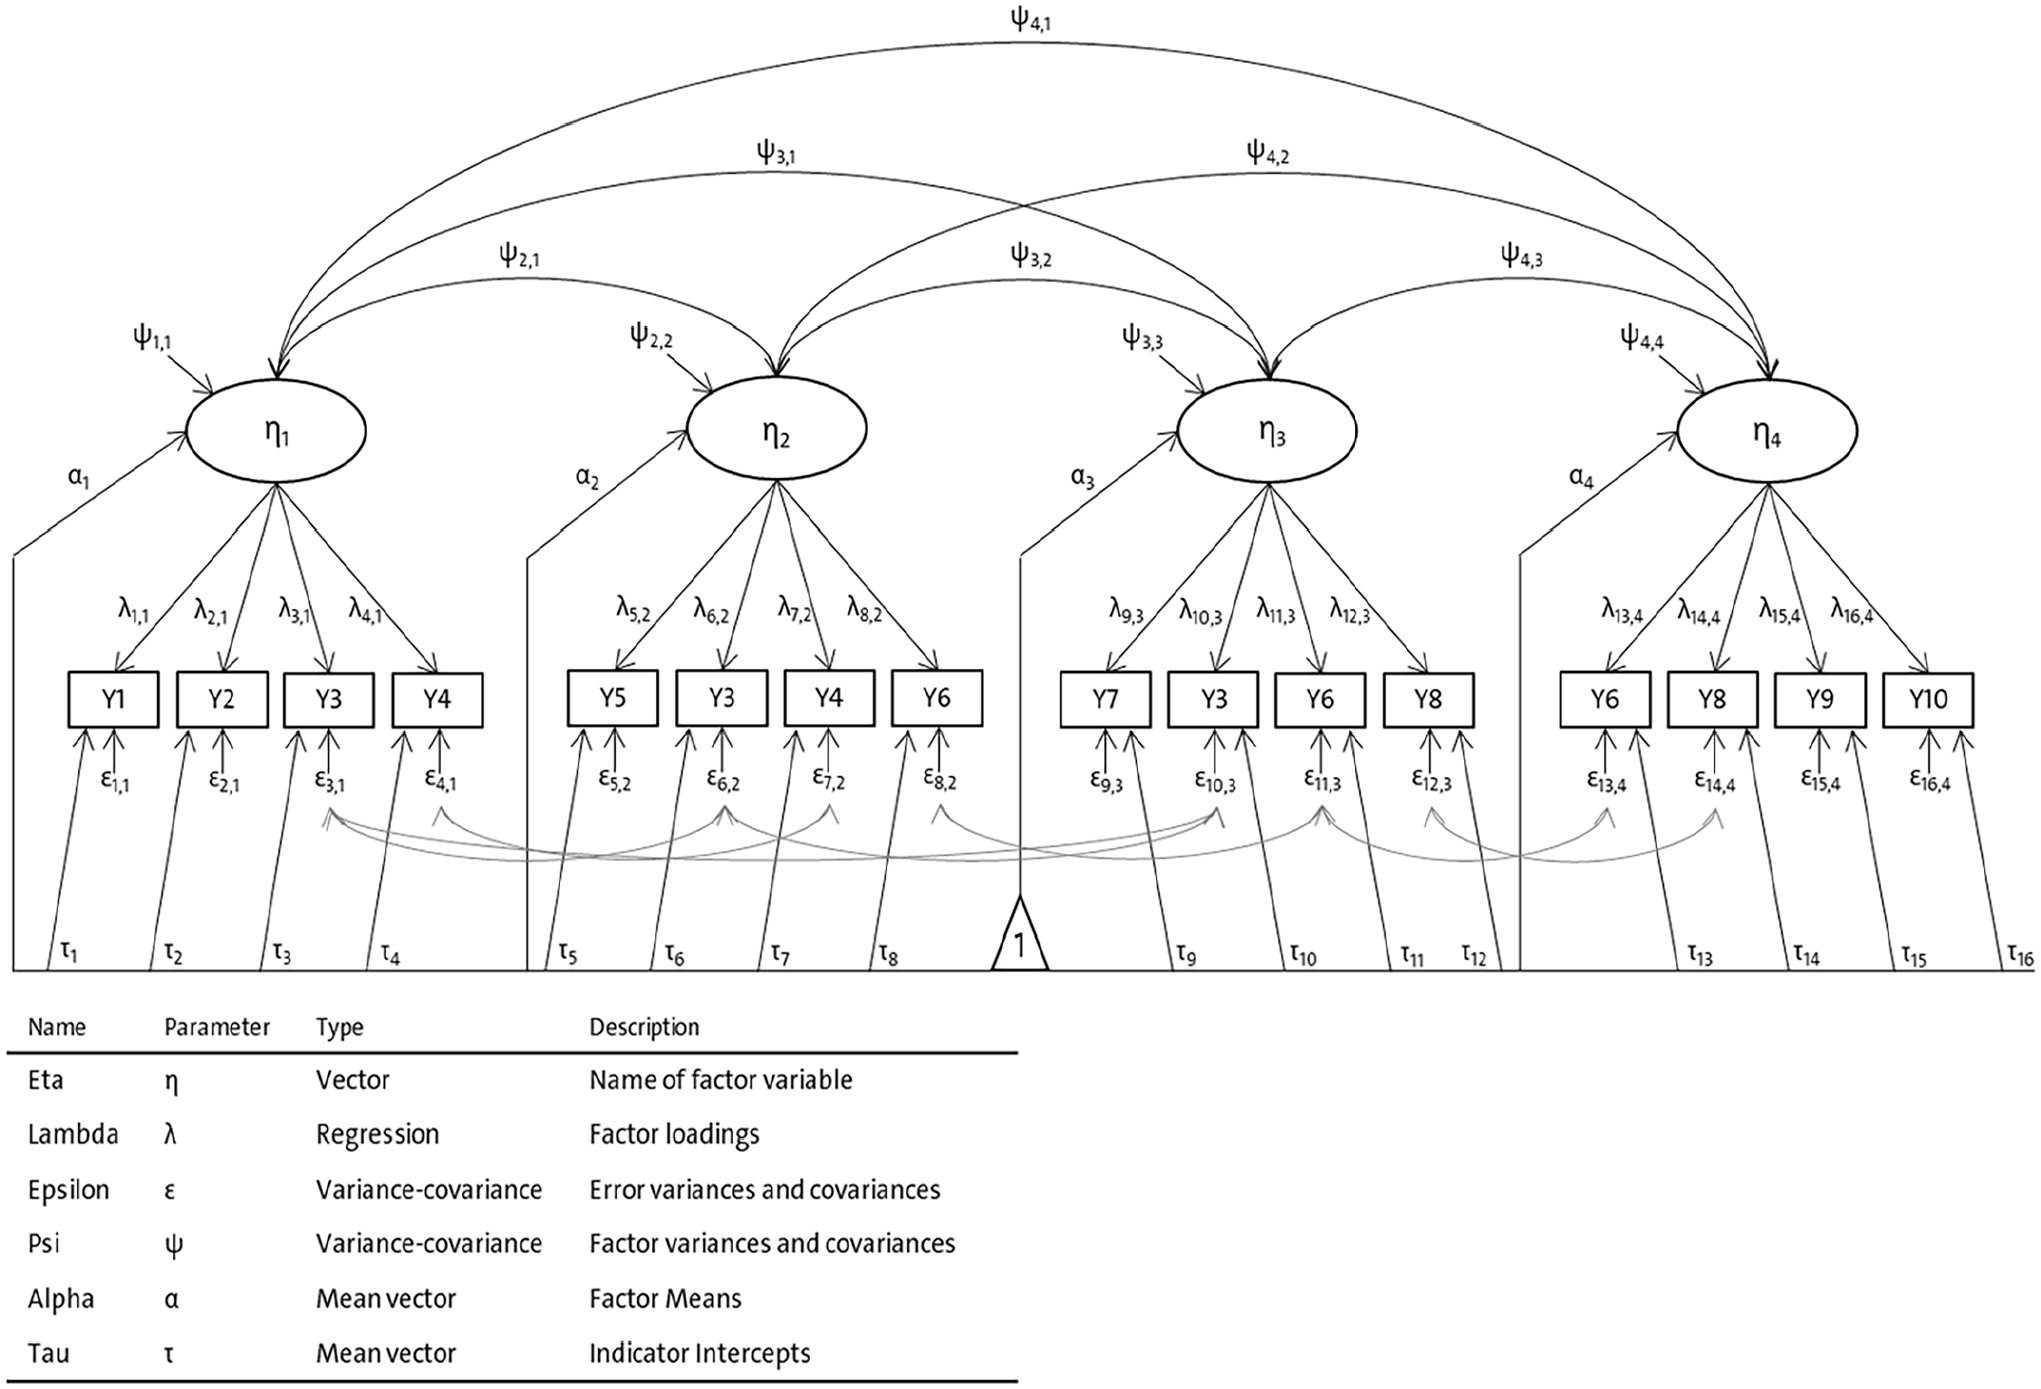
Longitudinal measurement model of general language skills in EFL.
Concerning latent variables, the model consists of four repeated measured factors (
We tested the measurement models’ MI in two steps. First, we test the models’ longitudinal MI for both cohorts separately to set the level of the measurements’ comparability over time. We estimated models with configural, metric, scalar, and residual longitudinal MI by restricting the related model parameters to be equal across the same tests. After establishing the level of longitudinal MI for both starting cohorts, we tested for the measurement models’ MI between the starting cohorts to ensure comparability between the age groups. Therefore, we used a multigroup CFA version of our measurement model and restricted the model parameters related to the MI levels to be equal. After establishing the models’ MI, we conclude with the students’ development in EFL by reporting the model-estimated means for both cohorts.
For model evaluation, we relied on the root mean square error of approximation (RMSEA; Steiger, 1998; Steiger & Lind, 1980) as a global measure (RMSEA < .01 “great fit;” < .05 “good/close fit;” < .08 “acceptable fit;” < .10 “mediocre fit;” > .10 “poor fit,” Little, 2013). It tests the degree of the models’ approximation to the data, thus accounting for models being always only approximations of the actual processes that gave rise to the data (Little, 2013, pp. 108 ff.). In contrast, the χ2-test, which tests the absolute fit of a model, is too strict for complex models with large samples due to the test power against the null hypothesis of perfect model fit. Thus, even trivial deviations from a perfect fit lead to model rejection (Brown, 2015; Little, 1997; Wang & Wang, 2012). We also used the standardized root mean square residual (SRMR; Bentler, 1995) as a global fit index that quantifies the deviation of the model-implied variance/covariance matrix compared with the empirical variance/covariance matrix in terms of residuals (SRMR < .08 “good fit;” < .10 “acceptable fit,” (Hu & Bentler, 1999; Kline, 2016). Concerning relative model fit indices, we applied the comparative fit index (CFI; Bentler, 1995) and Tucker–Lewis Index (TLI; Tucker & Lewis, 1973), which compares the specified model with its null model (>.99 “outstanding fit;” .95 to .99 “very good fit;” .90 to .95 “acceptable fit;” .85 to .90 “mediocre fit;” <.85 “poor fit;” Little, 2013). As a measure to compare nested models with different levels of parameter constraints, the difference in CFI is applied. If ΔCFI > 0.01, a substantial decrease in model fit has to be assumed, and the less restrictive model defines the level of MI to be confirmed (Cheung & Rensvold, 2002).
In order to deal with missing data, we used full information maximum likelihood estimation (FIML; Enders, 2010; B. O. Muthén et al., 1987) in the Mplus 8.2 software (L. K. Muthén & Muthén, 1998–2017) for model parameter estimation and used a maximum likelihood algorithm producing robust standard errors (MLR) to deal with nonnormality in the observed variables.
Results
The report of our analyses results on general language proficiency in EFL includes results of longitudinal MI for starting Cohort 7 (3.1) and starting Cohort 9 (3.2), MI between starting cohorts (3.3), and latent mean-development (3.4).
Longitudinal MI for starting Cohort 7
We estimated a series of model versions with increasing parameter restrictions corresponding to the levels of MI to test the models’ MI for starting Cohort 7. Table 5 contains the results of the model comparisons.
Invariance of the English C-tests’ longitudinal measurement model estimates (Cohort = 7, Waves = 1–4, n = 987).
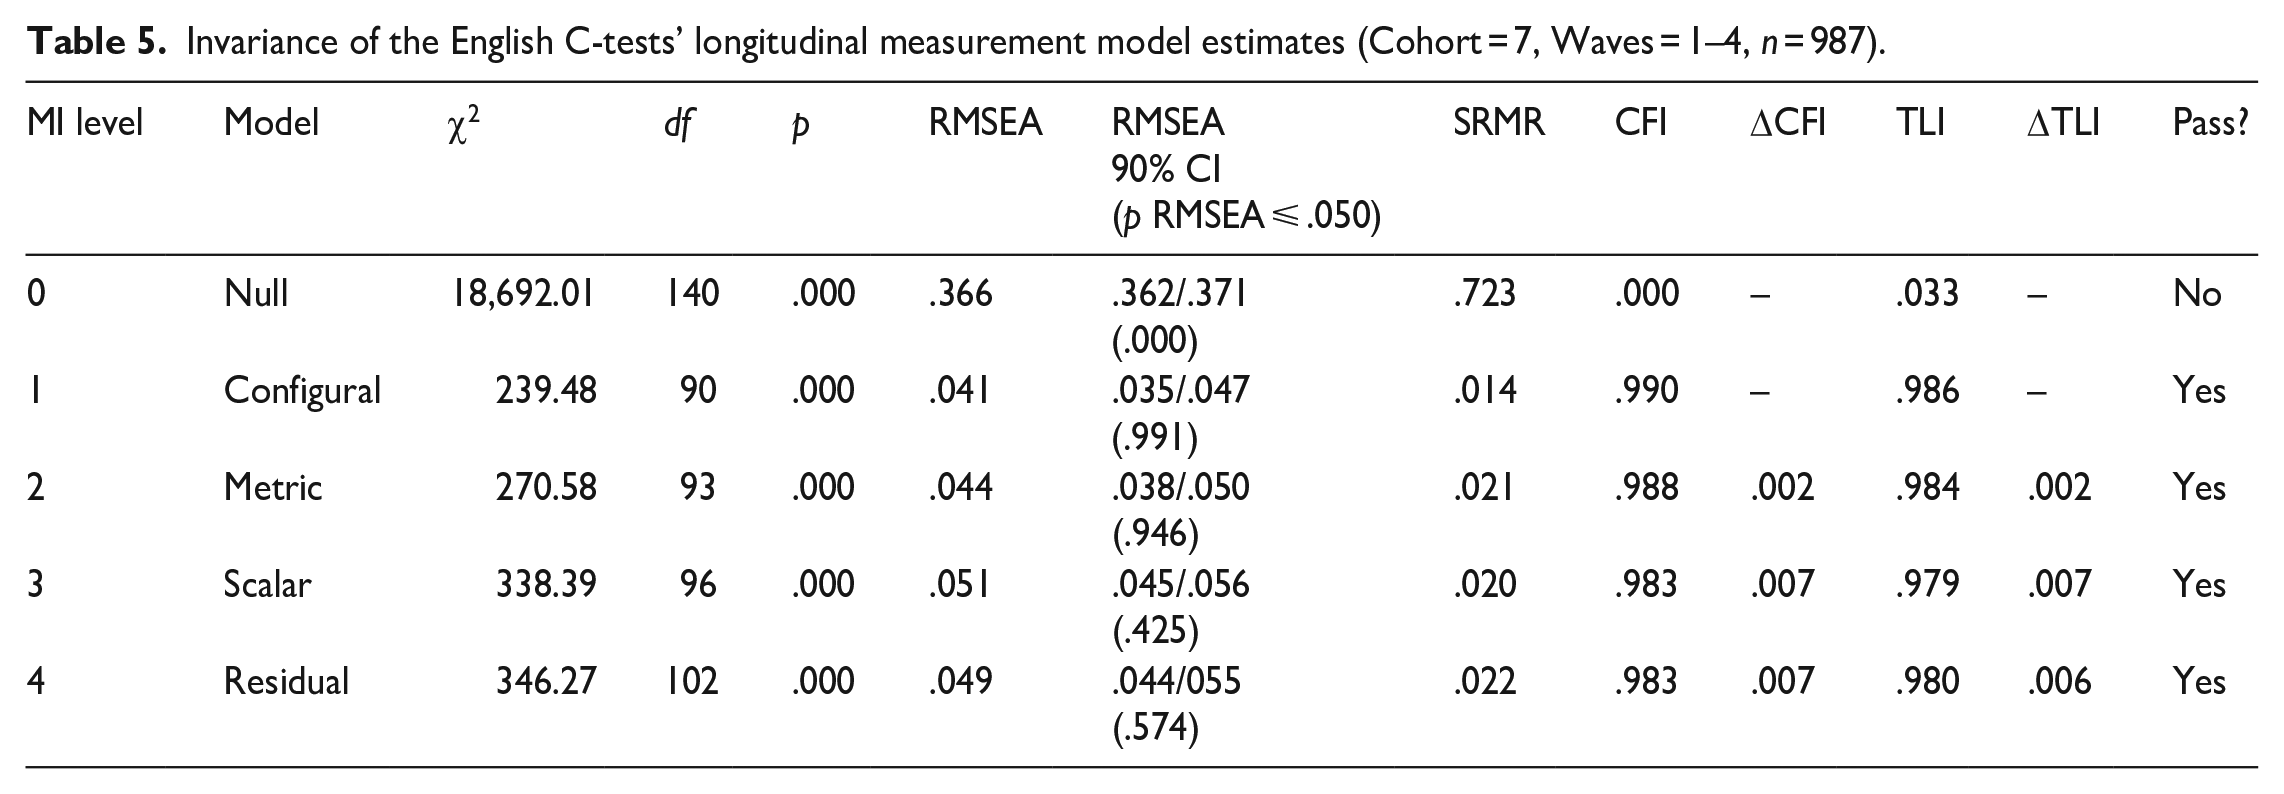
The null model served as a baseline revealing the maximum degrees of freedom for the parameter estimation provided by the observed data (df = 140). The configural model tested the structural invariance of the measurement model over time with a very good data fit. The metric model tested the measurements’ scale’s invariance over time with also a very good data fit. Comparing both models, the difference in the CFI was <.01 (
Figure 2 shows the structural model of the measurement model with longitudinal residual MI for the starting Cohort 7. The parameter estimates are reported in unstandardized metrics to demonstrate the imposed equality restrictions on factor loadings, intercepts, and residuals. For example, the text Y3 that was used in the first three waves has the same factor loading (
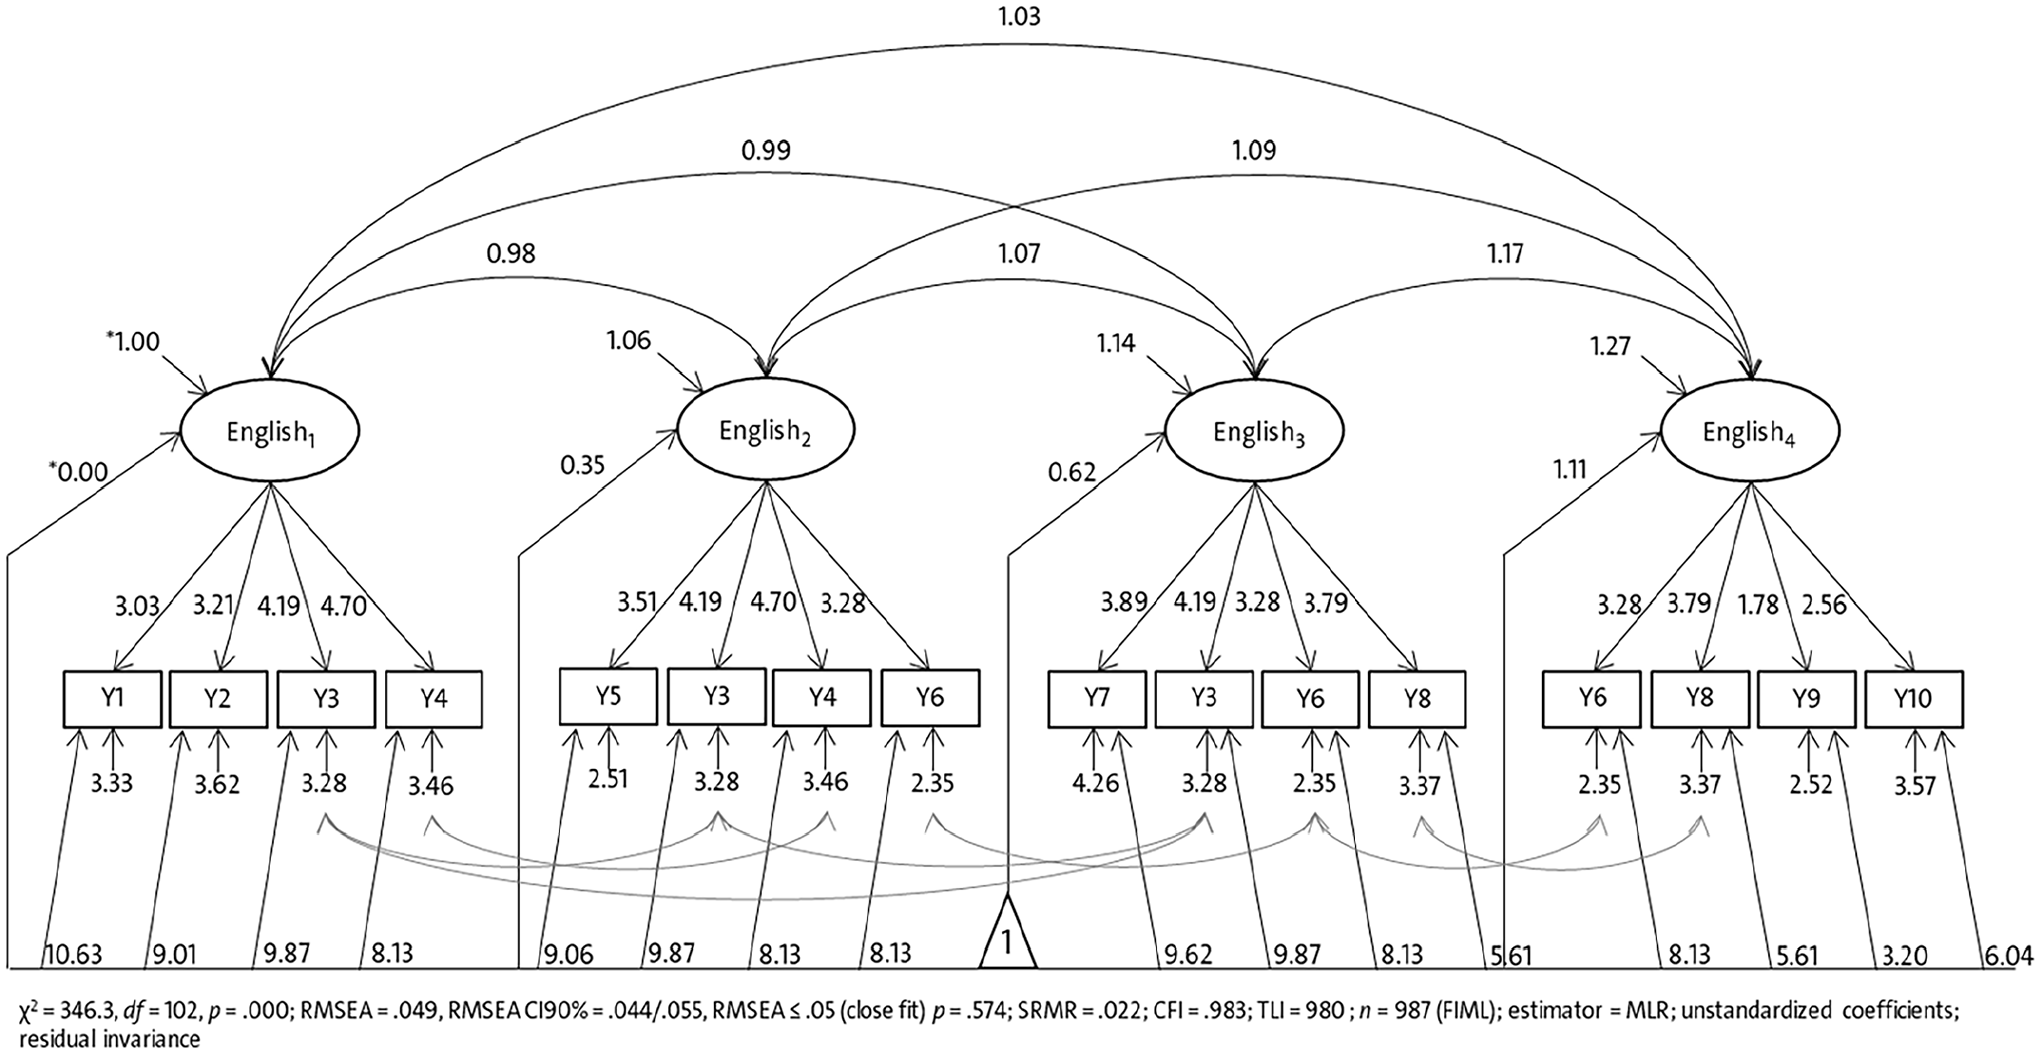
Longitudinal measurement model of general language development in EFL with longitudinal residual MI (starting Cohort 7, unstandardized coefficients).
Longitudinal MI for starting Cohort 9
Table 6 contains the model comparison results for the measurement models’ longitudinal MI testing for Cohort 9. The configural, metric, scalar, and residual models fit the observed data very well according to the referred thresholds. Compared with the configural model, neither the metric model (
Invariance of the English C-tests’ longitudinal measurement model estimates (Cohort = 9, Waves = 1–4, n = 969).
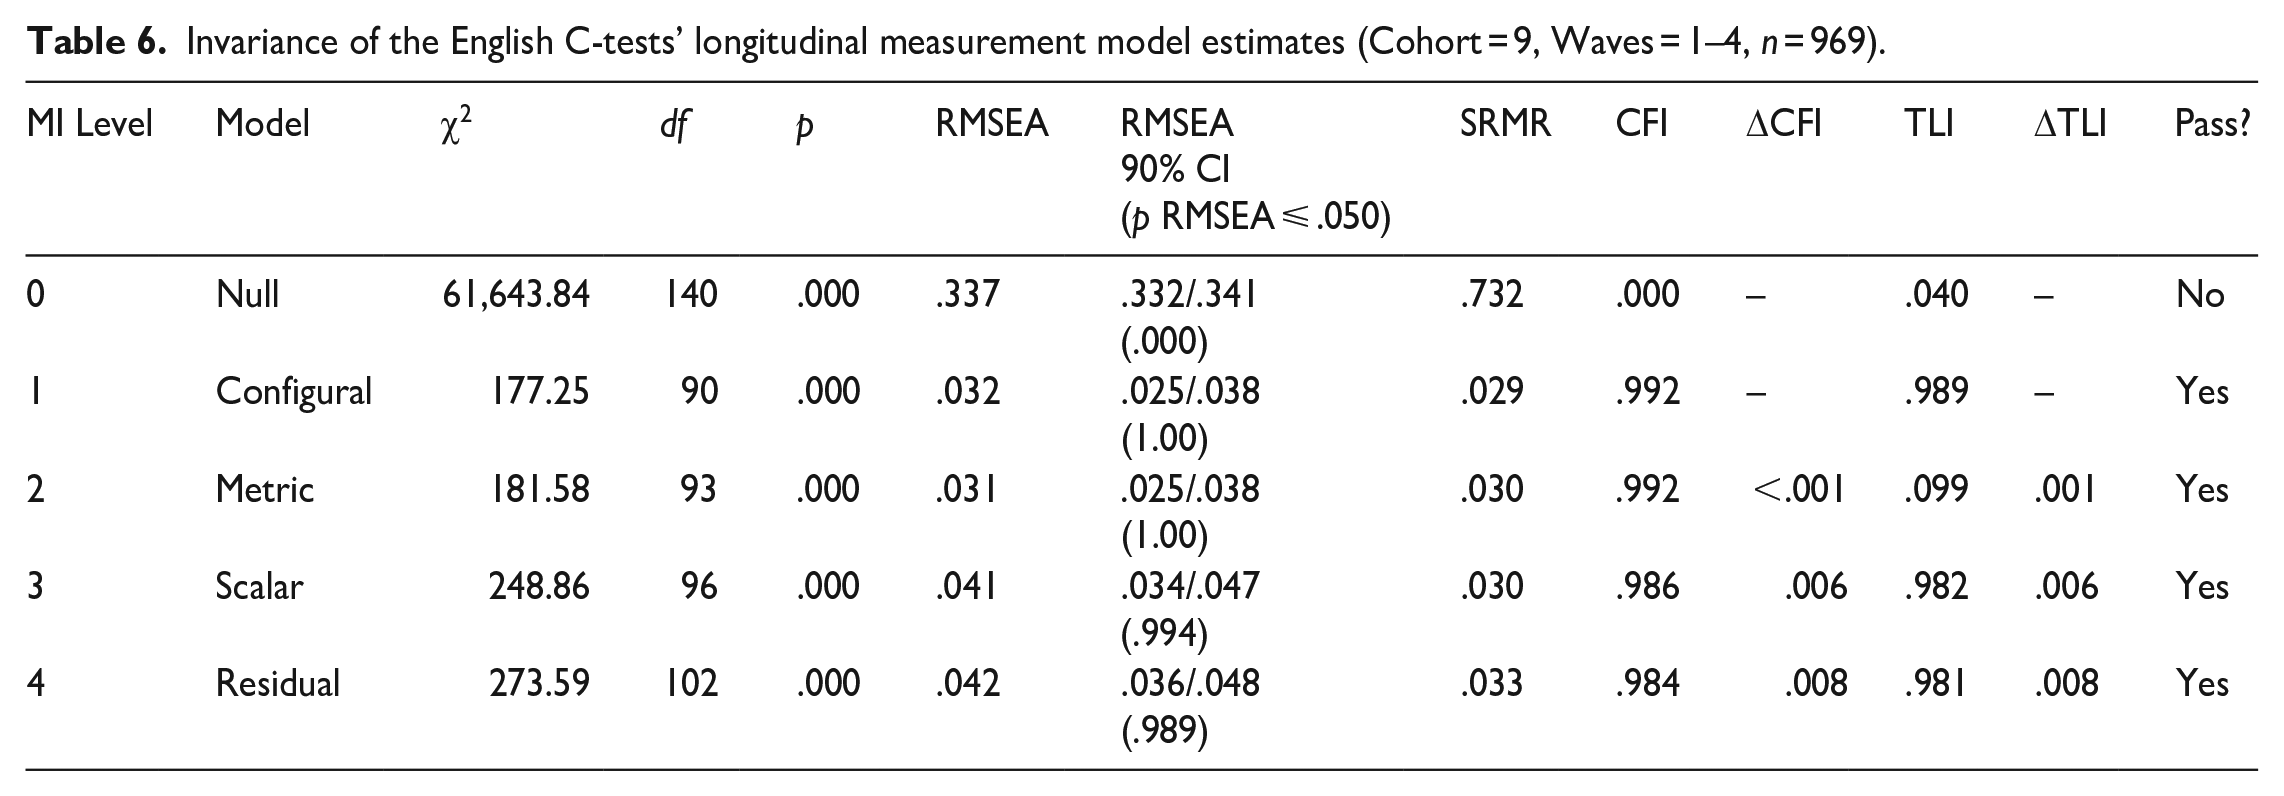
Figure 3 shows the structural model for Cohort 9 with unstandardized parameter estimates demonstrating the imposed equality restrictions to meet longitudinal residual invariance. The standardized factor loadings (not included in Figure 3) range from
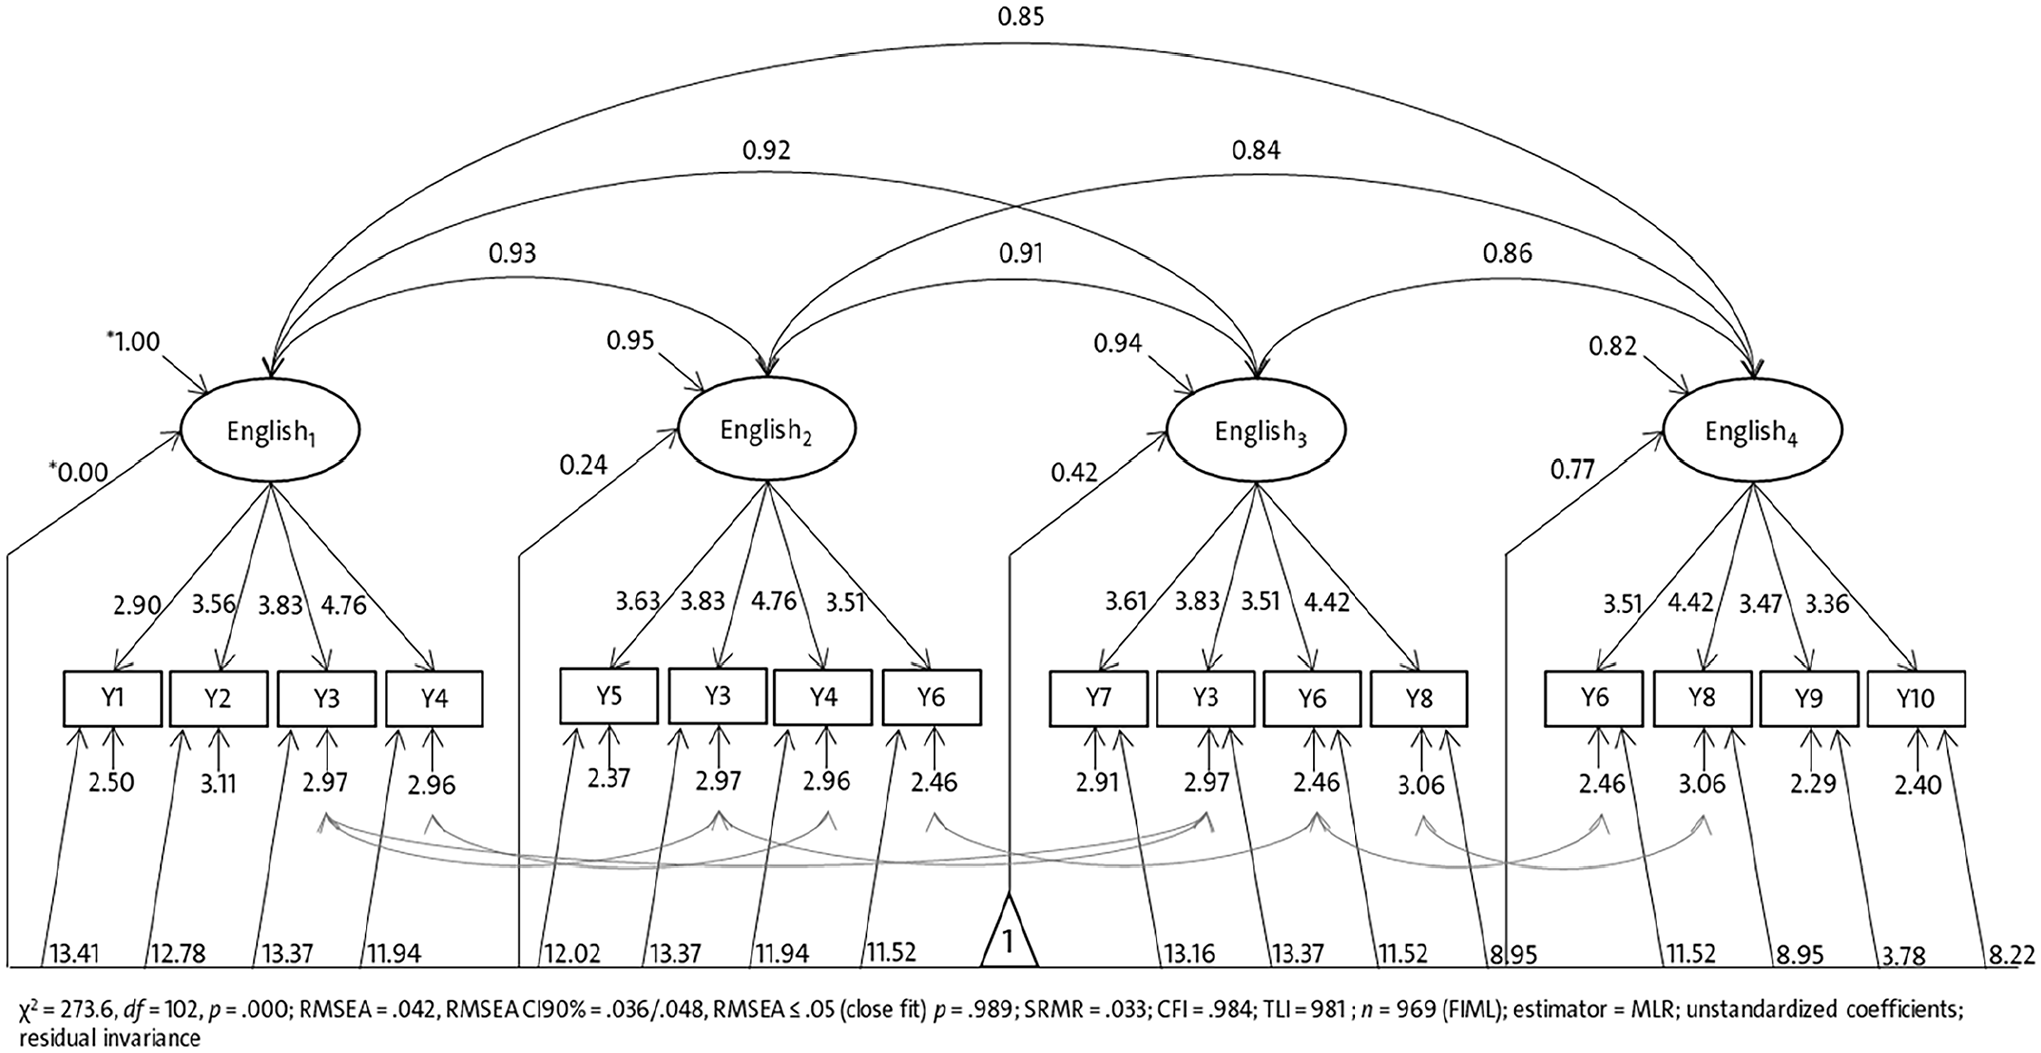
Longitudinal measurement model of general language development in EFL with longitudinal residual MI (starting Cohort 9, unstandardized coefficients).
MI between starting cohorts
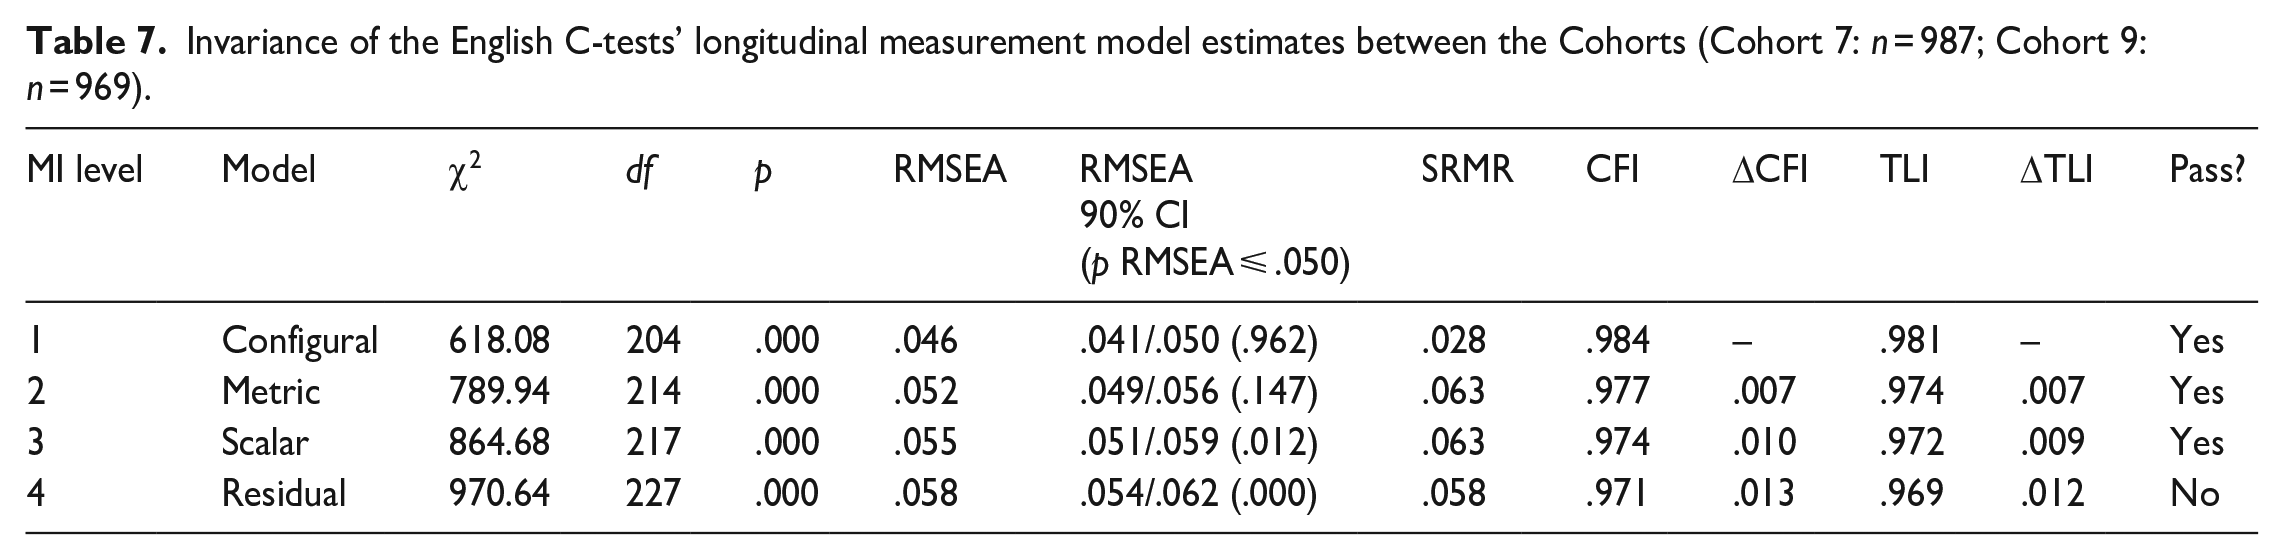
To this point, we ensured that the measurement of skills in EFL are comparable over time (across waves) in both starting cohorts. Next, we must clarify whether the measurement model is comparable between the starting cohorts. Table 7 contains the results of a multigroup comparison between the starting cohorts based on the previous measurement model with residual MI. The models for all MI levels fit the data very well, although the model comparison shows a significant decline in model fit in the residual model, that is,
Invariance of the English C-tests’ longitudinal measurement model estimates between the Cohorts (Cohort 7: n = 987; Cohort 9: n = 969).
Development in EFL
Our previous investigation of the measurement models’ MI revealed that the psychometric quality of our measurement is good enough to interpret students’ general language development in EFL regarding interindividual differences, that is, constructs’ longitudinal covariances as well as the development of the constructs’ means over time. Furthermore, the measurements are comparable between the age groups due to MI between the starting cohorts.
Concerning interindividual differences in English development, the strong factor correlations indicate a high degree of stability in interindividual differences in English foreign language skills over time (see Figures 2 and 3). In a standardized metric, these coefficients range from
Concerning mean differences in English development, the latent means presented in Figures 2 and 3 for both cohorts already show a significant increase in English foreign language skills across the four waves within each cohort. The multigroup model yields factor means on a common metric, with the mean of Cohort 7 at Wave 1 fixed to zero and all other means freely estimated. Those means are displayed in Figure 4. The factor means’ metric is standard deviations. The raw scores (see Table 4) are displayed as reference. It can be seen that the development is not reflected in the raw scores, as these are based on different texts and are not comparable across time. For Cohort 7, the mean development over time is
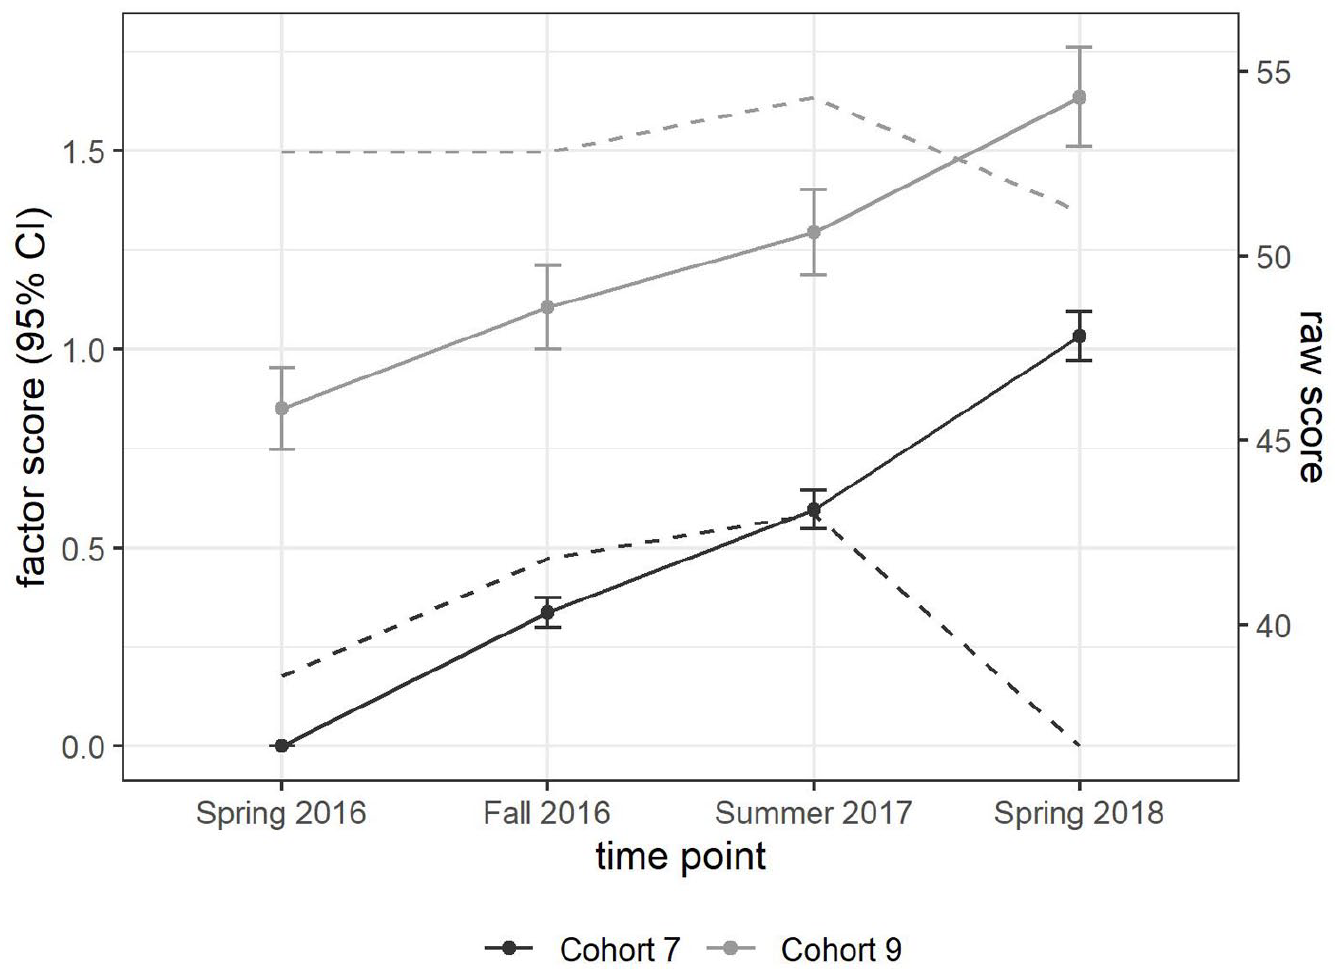
Latent mean development in EFL (Cohort 7, Wave 1 as reference).
The between-cohorts mean differences are also significant with
Discussion
The growing interest in investigating language development in educational assessment induced a high demand for measurement instruments suitable for longitudinal research designs (Gogolin et al., 2022; Schissel et al., 2019). Yet, tests used for cross-sectional measurements are not necessarily applicable to longitudinal designs. In such settings, tests for measuring language development must meet high standards of test quality such as validity, reliability, and objectivity, as well as allow for valid interpretations of change scores, requiring longitudinal MI. That is, test scores’ changes reflect the trait’s development only when a test measures the same construct over time, not just changes in measurement conditions.
In applied linguistics, there is a high demand to ensure test scores’ comparability over time to recommend certain instruments for usage in longitudinal research designs (Nagle, 2022). CFA proved to be the method of choice for longitudinal measurement modeling to investigate their longitudinal MI. A C-test is a widely used method for assessing general language proficiency because it offers considerable benefits: straightforward to construct, efficient test design, reduced test time, and holistic language proficiency measurement (for an overview, see Alpizar et al., 2022). However, there is a lack of empirical evidence supporting their valid use for assessing language development in longitudinal research designs.
Our study aimed to close this gap by investigating a C-test’s applicability to assess EFL development in secondary students in Germany. We analyzed longitudinal data from the German panel study MEZ. The analyzed sample subjected to secondary analysis consists of 1956 secondary students from the seventh- and ninth-grade starting cohorts with Russian, Turkish, or monolingual German language backgrounds.
The used C-tests consist of four texts at each wave. Ten different texts were administered in MEZ, some of which were repeated (see Table 2). The C-test overall score for each wave is the unweighted sum of the scores for the four texts. These raw scores are not comparable over time because they are not based on a common metric that accounts for the different difficulty levels of the texts.
We used longitudinal CFA to build a four-wave-longitudinal measurement model to address this issue. We used the information from the repeated texts as anchors to establish longitudinal MI and produce comparable parameter estimates over time. The aim was to gain proficiency estimates in general language proficiency in EFL that are comparable across time and age groups in secondary education in Germany. This scaling approach would allow the C-test to be applied in a longitudinal research design. The differences between the trends in the raw scores and the estimated means, displayed in Figure 4, demonstrate the benefit of the approach. While the development is clearly visible in the model-based scores, it is obscured in the raw scores by differences in text difficulty.
We investigated the measurement models’ psychometric properties concerning three hypotheses:
H1: The C-tests’ longitudinal MI is at least at the scalar level so that change in the latent means can be reliably interpreted as true construct development rather than variability in the measurement conditions. The results show the highest level of longitudinal MI (residual MI), exceeding the required minimum scalar level. This result supports the interpretation that change in the test scores over time is caused by the true change in the general language ability in EFL and not due to change in the measurement conditions.
H2: The C-test is invariant across age groups, so test scores are comparable across secondary education. As a result, the multigroup version of the previous measurement model revealed scalar MI between the seventh- and ninth-grade starting cohorts, allowing for score comparability across secondary education.
H3: The C-test is sensitive enough to detect English foreign language development at this stage of schooling. As a result, the test scores increased by 0.34 SD and 0.26 SD on average in Cohorts 7 and 9, respectively. This result is within the expected margin for the development within one school-year (Hattie, 2009).
Overall, our analyses support the appropriateness of altering texts in a longitudinal C-test design conducted by the MEZ study. This approach allows for the anchoring of texts between waves to establish comparability of the measurements over time using the information of the repeated texts to estimate the change in the test scores. If used in such a design, a C-test provides reliable, valid, and efficient measures for EFL development in secondary education in bilingual and monolingual students in Germany. The information a C-test provides about EFL levels and progress can be used for language diagnostics and subsequent language support in school settings.
We used SEM in our approach because our study aimed at testing MI hypotheses concerning construct validity. For this purpose, we favored SEM because it provides us with some crucial benefits: first, we could refer to a sizeable body of literature on MI testing in the SEM, developing an approach for the C-test design of the MEZ study. Second, SEM provides a set of model fit indices best suited for comparing hierarchically nested models. Alternatively, C-test data could have been scaled following IRT, which would be the preferred method for scoring a C-test when focusing on proficiency assessment. Since our main interest was in testing MI and less in the criterion-related interpretation of test scores, the SEM approach provided sufficient psychometric evidence supporting the applicability of the C-test in longitudinal settings. Our study assesses C-tests constructs’ factor structure and its comparability over time and age groups, closing the gap underscored in previous research (Alpizar et al., 2022). However, additional evidence is needed to validate the C-test’s applicability for measuring language development in languages other than English and contexts beyond school to further generalize our findings to other language learning settings.
Our study has several limitations. First, the longitudinal C-test design conducted in the MEZ study allows only for weak anchoring over time. The scheme was to repeat two texts from the previous wave and add two new ones in each subsequent wave. Under this rationale, two texts were repeated over three waves. No text was administered at all four waves. The weak anchoring over time was a consequence of the longitudinal survey design, which attempted to avoid typical effects of repeated test administration. As a result, not all texts (i.e., items) achieved longitudinal MI due to lack of comparability. Thus, the measurement of change here is made on the relatively narrow basis of the repeated items, while the other items contribute to the variance of the proficiencies per wave, but not to the measurement of their development over time. In this way, information for the development analysis remains unused, which ideally could put related statements on a more solid basis. On the contrary, the development of C-tests using nonrepeated but measurement-invariant comparable texts is highly time-consuming and costly, so that the strategy adopted here could be considered a worthwhile alternative.
Second, the generalizability of the results is limited to our studies’ sample of secondary students learning EFL in school. Our data do not allow us to substantiate more general conclusions on the MI of C-tests in other contexts and age groups. In order to be able to generate statements and best-practice recommendations concerning general trends and procedures, further studies on different target groups would be necessary. After all, one general finding follows from the results, which is the need for verification of MI when proficiency tests are used longitudinally, to avoid erroneous conclusions in the interpretation of test scores.
Footnotes
Declaration of conflicting interests
The authors declared no potential conflicts of interest with respect to the research, authorship, and/or publication of this article.
Funding
The author(s) disclosed receipt of the following financial support for the research, authorship, and/or publication of this article: This work was supported by the German Federal Ministry of Education and Research under Grant [MARE (01JG2101)].