
Abstract
It is general practice to use rater judgments in speaking proficiency testing. However, it has been shown that raters’ knowledge and experience may influence their ratings, both in terms of leniency and varied focus on different aspects of speech.
The purpose of this study is to identify raters’ relative responsiveness to fluency and linguistic accuracy in an occupational context, and to investigate whether professional and non-professional raters with a broad exposure to L2 speech demonstrate similar responsiveness to these two aspects. To this end, an experimental approach was applied. Fluency and accuracy were separated and systematically manipulated. As it is known that foreign accentedness of speech influences raters’ judgments, this factor was accounted for. Seventeen responses to a Dutch L2 exam in a vocational context were converted into four different versions manipulated for morpho-syntactical accuracy and/or fluency, and read by a Dutch L2 actor, resulting in 68 stimuli. Fifty-five professional raters and 41 non-trained, potential stakeholders holistically rated all stimuli. All raters had extensive prior exposure to spoken L2 Dutch.
Linear mixed modeling showed that improvement of either fluency or accuracy led to significantly higher ratings by both linguistically trained and non-trained raters. This finding confirms that both groups perceive these aspects to be important features of speaking proficiency. Raters seemed to be more responsive to improvement of accuracy than of fluency. The linguistically non-trained raters seemed to appreciate the fluency improvement more than linguistically trained raters. The linguistically trained raters rewarded morpho-syntactical improvement relatively higher than the non-trained raters. This latter effect was explained by the finding that the linguistically trained raters seemed to be more preoccupied with accuracy, according to their responses to a questionnaire. This result suggests that raters with linguistic expertise were more attentive to accuracy whereas non-trained raters were relatively more attentive to fluency.
Keywords
Introduction
L2 speaking proficiency tests are developed to determine how well L2 speakers can express themselves in a pre-defined task in a (more or less) pre-defined context. Speaking proficiency assessment involves four main factors: the speaker, the task, the speech and the listener. Although the capabilities of speakers determine their proficiency, only the resulting performance is observable, and even though increasing computer power progressively enables testers to apply objective measures of oral performances, speaking proficiency is still commonly measured by means of a human listener’s judgment of the speech produced. Which criteria does the listener-judge apply to evaluate an L2 speaker’s performance? In the process of language proficiency rating in general, the knowledge and experiences of the raters play a central role (Lumley, 2005). In restricting ourselves to the rating of speaking proficiency, the raters’ assignment of scores appears to be related to their leniency (Brown, Iwashita, & McNamara, 2005; Carey, Mannell, & Dunn, 2011; Hsieh, 2011; Kang, 2008; Rossiter, 2009). Furthermore, several studies have established that the raters’ backgrounds determine the language performance features on which they are apt to focus (Eckes, 2008; Hsieh, 2011; Zhang & Elder, 2011).
This study’s objective is to explore the importance of certain features to two different sets of listeners. More specifically, this study examines the relative responsiveness of raters to fluency and linguistic accuracy and investigates whether linguistically trained, professional and untrained, non-professional raters react similarly to the improvement of these features. As the raters’ prior exposure to L2 and foreign-accented speech has been shown to influence ratings, this factor is taken into account.
Two factors: Features of the speech and rater background
Features of the speech
When proficiency in speaking is not rated holistically, but analytically, the rater has to distinguish separate features of the speaking performance. The choice of features is more or less arbitrary, but not limitless. Test rubrics, as well as research into the perception of speaking proficiency, exhibit a relatively limited set of features. Traditionally, speech is judged for accuracy (i.e., grammar, grammar errors, sentence structure). Also, vocabulary (or word choice), pronunciation (including accentedness, intonation), and fluency (or speed) are often evaluated. In some studies, some formulation of social acceptability is addressed. For the purpose of this study, we focus on fluency and accuracy.
Speech fluency
The notion of “fluency” can be interpreted in two different ways, in a broad and in a narrow sense (Lennon, 1990). Fluency in the broad sense is generally used in everyday life, for example when describing someone as “fluent in Swedish.” In this sense, it is equivalent to overall speaking proficiency. In this study we are concerned with fluency in the narrow sense, where the construct is limited to the flow and smoothness of speech. Fluency in this sense has been defined as an “impression on the listener’s part that the psycholinguistic processes of speech planning and speech production are functioning easily and smoothly” (Lennon, 1990, p. 391), and has been investigated using both raters’ judgments and objective measures.
Three main clusters of fluency measures have been distinguished in the literature examining fluency: speed fluency, concerning the rate and density of speech delivery; breakdown fluency, concerning the extent to which a continuous speech signal is interrupted; and repair fluency, relating to the number of corrections and repetitions present in speech (Segalowitz, 2010; Skehan, 2003; 2009; Tavakoli & Skehan, 2005).
The fluency of speech plays a role in the judgment of raters. Judgments of general speaking proficiency have been shown to correlate with several general quantitative measures of speech production, as well as with measures of speed and breakdown fluency (Ginther, Dimova, & Yang, 2010; Iwashita, Brown, McNamara, & O’Hagan, 2008). More specifically, judgments of fluency have been found to correlate with several quantitative measures of speech production (Bosker, Pinget, Quené, Sanders, & de Jong, 2013; Kormos & Dénes, 2004; Pinget, Bosker, Quené, & de Jong, 2014; Rossiter, 2009).
Kormos and Dénes (2004) compared fluency ratings with temporal and linguistic measures. The judges were three native speakers of English, and three L1 Hungarian speakers; all were experienced L2 English teachers, while almost all were experienced in administering examinations. They rated 16 Hungarian learners of English at two distinct levels of proficiency, using speech samples of 2–3 minutes in length on average. Of the speed measures, Kormos and Dénes found “speech rate” (the number of syllables produced divided by the total production time), and the “mean number of syllables per run” to correlate highly with fluency judgments. In addition, the number of stressed words per minute was significantly correlated with fluency judgments (Kormos & Dénes 2004). Both Bosker et al. (2013) and Pinget et al. (2014) reported on an experiment in which fluency ratings and acoustic measures of pause, speed, and repair were collected. They analyzed the contribution of the acoustic measures to the prediction of fluency ratings of L2 Dutch speakers by 20 untrained raters (native Dutch speakers). Stimuli were 114 extracts of approximately 20 seconds, excerpted from three tasks performed by 15 English and 15 Turkish speakers, and eight Dutch speakers as a reference for the raters. “Mean length of syllables,” a component of speech rate, was shown to explain a moderate part of the variance of the fluency ratings (Bosker et al., 2013; Pinget et al., 2014).
Pertaining to the breakdown of fluency measures, the total number of silent pauses and the mean length of these pauses predicted fluency ratings in the experiment reported by Bosker et al. (2013) and Pinget et al. (2014), but not in Kormos and Dénes’ study (2004). Furthermore, the number of filled pauses per second of speech was a predictor of fluency ratings (Bosker et al., 2013; Pinget et al., 2014).
Regarding the repair measures, both the number of repetitions and the number of corrections per second of spoken time were correlated with fluency ratings. These measures, however, were not as strongly correlated as the speed and pause measures with fluency ratings (Bosker et al., 2013; Pinget et al., 2014). A broader measure including all repairs per minute did not correlate with fluency judgments (Kormos and Dénes, 2004).
These results suggest that raters are able to take objective features of fluency into account when rating speech. This applies to raters who are experienced in teaching and testing L2 speakers (Kormos and Dénes, 2004) as well as to untrained native or non-native speakers (Bosker et al., 2013; Pinget et al., 2014; Rossiter, 2009). These findings are corroborated by two more experimental studies in which speech samples are phonetically manipulated (Munro & Derwing, 1998; Bosker, Quené, Sanders & De Jong, 2014). Munro and Derwing (1998, Exp. 2) reduced the speech rate of the recordings of Mandarin speakers of English as a second language and native speakers of English and found that native listeners were negatively affected by the manipulation of speech rate. Bosker et al. (2014) conducted an experiment in which the number and length of pauses in native and non-native speech was manipulated. Natives were rated more fluent and speech with no pauses was also rated as more fluent than speech with short and long pauses, respectively. These manipulations of pauses affected native and non-native speech in a similar way. Features of the speed of speaking (i.e., articulation and speech rate) were manipulated in their second experiment and showed that when the speeds of native and non-native speech were equated the fluency scores were equal as well.
Accuracy of the speech
Accuracy refers to the extent to which a speaker uses the language according to a particular language norm and involves a wide array of features, including syntax, vocabulary and cohesion (see Fulcher, 2003). In testing L2 oral proficiency, accuracy is almost always regarded as a feature to be evaluated, even independent of context or embedded in communicative language testing contexts where language norms may vary (Luoma, 2004).
Generally, it is assumed that accuracy of L2 speech increases with proficiency. Several objectively measured aspects of accuracy have been shown to concur with proficiency level. One study with 200 speech samples investigated whether objective measures could predict the holistic ratings on a five-point scale for academic language proficiency (Brown et al., 2005; Iwashita et al., 2008). The researchers concluded that performance levels could be distinguished by grammatical features, although “as much if not more by production features such as fluency and pronunciation and by vocabulary knowledge” (Iwashita et al., 2008, pp. 46–47). Overall grammatical accuracy distinguished performance levels better than specific features, and not all specific features could predict ratings of performance levels. The results were fuzzy, however: differences between adjacent levels were not always distinguished by measures of the features under investigation (Iwashita et al., 2008, p. 43). It can be concluded that the raters involved seemed to use accuracy as one, but certainly not the only criterion. The extent to which ratings are affected by accuracy may be moderated by the raters’ background, as qualitative analysis of rater comments suggests (Rossiter, 2009).
Rater background
Research into the role of background characteristics of raters judging speaking proficiency has predominantly focused on ascertaining differences in raters’ leniency. These differences have been found in some studies (Barnwell, 1989; Brown et al., 2005; Carey et al., 2011; Fayer & Krasinski, 1987; Galloway, 1980; Kang, 2008). Other studies reported mixed outcomes (Brown, 1995; Hadden, 1991; Hsieh, 2012) or found no relationship between rater background and leniency (Huang, 2013; Jacoby & McNamara, 1999; Knoch, 2009; Lumley, 1998; Zhang & Elder, 2011). It has been shown that even when considerable effort is devoted to minimize rater effects by providing detailed instructions and by training raters to apply these instructions carefully, raters nevertheless seem to weigh features of speaking performances differently (Hsieh, 2011; Iwashita et al., 2008; Zhang & Elder, 2011). Most of the studies into the role of rater background do not allow exact comparison, owing to differences in methodology and in operationalization of the professional development and (teaching) experience of the raters, and of task, context, and language level of the speakers. Nonetheless, from these studies two background characteristics of raters have emerged as being important: linguistic expertise and exposure to L2 speech.
Linguistic expertise of raters
Several studies conducted for the development of tests of English for special purposes (ESP) have shown that occupational professionals do pay attention to different features than do language professionals (Brown, 1995; Hsieh, 2011), even if they are comparably lenient (Jacoby & McNamara, 1999; Knoch, 2009). Tour guides were harsher on “task fulfillment” than professional language raters on a task where they found interactional coping especially important, whereas linguistic experts were harsher on accuracy (Brown, 1995). Aircraft pilots mentioned technical knowledge, experience, and training level as a rationale for their judgments of effective communication of peers, and focused only on a selection of the prescribed linguistic criteria (Knoch, 2009). Thus, in these studies, the focus of occupational professionals seems to be more on interactional adequacy, whereas the linguistic professionals focus more on form. Hsieh has reported that “linguistically naive undergraduates” commented more often on accentedness and global proficiency of potential teaching assistants, as compared to ESL teachers, who commented more often on expressions, rhythm and stress, intonation, and task fulfillment. However, she noted that the undergraduates were “inguistically less sophisticated than the ESL teachers and were less able to describe, metalinguistically, such features” (Hsieh, 2011). In one study, no differences were found: veterinary professionals, applied linguists, and students, commenting on students’ interviewing skills, appeared to use comparable criteria (Douglas & Myers, 2000).
Studies comparing speaking proficiency more generally also confirm that linguistic professionals pay more attention to grammar-like features than non-professionals, who pay more attention to content or to task fulfillment. In Galloway’s study, 10 English learners of Spanish were rated by four different groups of raters, who were (non-)native speakers of Spanish and (non-)teachers. Although the average ratings of these groups did not differ significantly, she observed differences in the features to which raters attended. Among other things, non-native teachers “provided comments solely about grammatical forms … while, with few exceptions, the non-teaching native speakers noted the content of the student’s presentation” (Galloway, 1980, p. 431). Zhang and Elder reported that (both NS and NNS) ESL teachers commented on linguistic features more than on other categories (Zhang & Elder, 2011). Huang compared ratings by three different groups of raters who varied on two background characteristics: familiarity with Chinese-accented English as well as experience with teaching English as a foreign language. They rated 26 speakers of Chinese L1 who had taken the TOEFL iBT Speaking test. She found no differences between these groups in leniency on the Grammar & Vocabulary scale, but noted that not only are teachers more attentive to accuracy, “[c]ompared to non-teachers, ESL/EFL teachers were also better able to separate the analytical dimensions … when judging the overall proficiency or the content of their speech” (Huang, 2013, p. 770). From factor analyses of ratings of L2 English speech of eight Chinese speakers on 24 items by ESL teachers and undergraduate students, Hadden found some differences in the factors for each group. However, she concluded that the dimensions along which the speakers were evaluated were quite similar, although not identical (Hadden, 1991).
The studies mentioned here show that in an occupational context judges use certain other criteria for L2 proficiency than linguistic experts. However, these studies yield no decisive answer to the question of whether “more attention” leads to harsher ratings, and the relation is only shown in some studies.
Raters’ prior exposure to L2 speech
Cutler (2012) showed, in her comprehensive overview of research on speech recognition, that not only are listeners very well equipped to cope with pronunciation variability across L1 speakers, L1 listeners are also able to adapt to foreign-accented speech of an L2 speaker by adjusting their phoneme categories. According to Cutler, this adaptation is predominantly speaker-specific (Cutler, 2012, p. 425), which could imply that there is no general effect of L2 exposure on processing L2 speech. There is evidence, however, that listening to L2 speech causes a more general effect. First, listening to multiple speakers with a foreign accent facilitates listening to a new speaker with the same foreign accent, as has been shown by Bradlow and Bent (2008). Second, transcription studies conducted by Derwing and Munro (1997) and Gass and Varonis (1984) showed that listeners’ familiarity with a language was related to successful identification of speakers’ first language background and better comprehension of the speakers’ utterances. Gass and Varonis (1984) also found that familiarity with non-native speech in general facilitates comprehension (Gass & Varonis, 1984). Finally, it has been shown that students with more experience with international teaching assistants better understand accented speech (Rubin, 1992; Rubin & Smith, 1990).
If accent familiarity leads to easier understanding of accented speech, raters who are familiar with a certain accent might give higher ratings to speech with that accent. A recent study, in which 107 English L1 raters who studied Chinese, Spanish or Korean, holistically rated speech samples of English L2 speakers with L1 Chinese, Spanish or Korean, showed that the raters familiar with Chinese or Spanish were more lenient towards the Chinese and Spanish L2 speakers, respectively. The Korean bias was not significant. Familiarity with the L1s of L2 speakers may influence the rating of the L2 speech (Winke, Gass, & Myford, 2013). Other studies have found a similar effect for ratings of accentedness or pronunciation (Carey et al., 2011; Hsieh, 2011; for an exception, see Galloway, 1980).
Research questions
The study reported here, focuses on rater variability with respect to perception of certain features of L2 speech. As linguistic expertise and exposure to L2 speech are important factors in rater variability, these factors were taken into account. This study focuses on two important features of speech: fluency and accuracy. The research questions are the following:
Do professional and non-professional raters rate L2 speech in a similar way?
Are raters perceptive of changes in fluency or linguistic accuracy?
Do professional and non-professional raters react similarly to changes in fluency or linguistic accuracy?
In addressing these research questions, we will use an experimental approach as advocated by Bosker et al. (2014). Speech samples were manipulated with respect to fluency and accuracy (see below).
Method
This section first of all describes which participants acted as raters, and, second, which materials were used and how they were transformed into stimuli. Next the procedure for data collection is explained, and is followed finally by a description of the analyses that were applied.
Participants
A total of 96 raters, both professional and non-professional, participated in the experiment. The professional rater group (henceforth: PROF-group) consisted of 55 certified raters of the State Exam Speaking section for Dutch as a second language (STEX-DL2). The non-professional rater group consisted of 41 human resources managers (henceforth: HRM-group) who can be considered stakeholders of the STEX-DL2.
The certified raters of STEX-DL2 were recruited through the test administration. Most had extensive experience rating this exam: only 9% worked as certified rater less than 6 years (mean length of certification 12.7 years, median 14 years). In addition, a large proportion (84%) had experience rating other tests (standard tests and/or classroom assessments). Nearly all certified raters worked as Dutch L2 teachers (95%), and most of them were very experienced: 65% of the raters with teaching experience taught Dutch L2 for 11 years or more (mean 16.8, median 17 years, maximum 39 years; three missing). Ages ranged from 31 to 75 years (mean 56.0) and 84% were female.
The STEX-DL2 offers an examination that has been designed to qualify for work and study at an intermediate level. Company human resources managers supervising employees at this level are important stakeholders of this exam. Therefore, using LinkedIn, human resources managers experienced with L2-speaking employees were recruited for the non-professional rater group. One of the raters of the HRM-group did not fill out the survey; hence, the following figures concern 40 non-professional raters. All HRM-raters had occupational contact with Dutch L2 speakers, 75% of them at least 1–7 times per week. They had received no training in assessing language proficiency. Seventy percent of the HRM-group used no language tests at all at work. Five HRM-raters used only informal speaking tests, four were occasional users of formal language test results, and one alternated use of both; whereas two HRM-raters did not specify which test they used. Ages ranged from 22 to 60 (mean 41.5), and 68% were female.
Raters could choose between receiving a small fee and having its equivalent donated to a charity organization.
Materials
Original spoken responses were selected from the STEX-DL2 (Program I), a semi-direct speaking test consisting of 20 prompts. One picture-story-telling task requesting examinees to act as pre-school teachers, was selected from this exam; they were asked to describe a boy’s activities that day to his mother. The exam procedure is fully standardized and instructions are provided on tape. As this item was the exam’s 18th prompt, the examinees were familiar with the procedure. According to the standard procedure associated with the task, examinees first listen to the introduction, preparation time is then provided, and finally the actual instruction for speaking is given. Examinees are allowed 30 seconds to respond and all responses are recorded. Responses are assessed on analytic rating scales by two certified raters.
The STEX-DL2 has been in operation since 1992. The standard criterion for passing the exam was a standardized rating of 500. In a study linking this exam to the CEFR, the authors concluded that the “Program I-examination” measures approximately at CEFR level B1 (Bechger, Kuijper, & Maris, 2009; Kuijper, Bergsma, & Bechger, 2005). They established that a rating of 493 and up was equivalent to mastering level B1. A rating of 480 and lower corresponded to failing level B1. It is standard procedure to rate responses for each prompt analytically on content and grammar. Additionally, the responses for a selection of tasks are rated on pronunciation, fluency, and/or vocabulary. The starting point for the selection of responses for the current experiment were candidates who had failed B1, but who had received ratings for grammar as high as those who had passed B1. This selection was expanded with responses from candidates who received ratings just above the criterion for B1 (493): passers with the lowest scores, whose grammar ratings were the same or only just above those of the first selection. Because in Dutch, correct form and location of verbs are regarded as a signal of increasing proficiency (Van de Craats, 2009; Van de Craats & Van Hout, 2010; Verhagen, 2009), responses that showed at least one verb-finiteness error were chosen from the set of selected candidates for manipulation. Other, more practical criteria were also applied to the selection: enough loudness and clarity, 1 unmarked vocabulary, and a description of all three pictures in the prompt, and the task had to be finished in the time provided. In addition, responses were only selected if the two raters more or less agreed on the grammar rating (a maximum difference of one point was allowed). Seventeen responses that satisfied all criteria were selected. Extra responses were selected to serve either as practice examples or as the reference (anchor) in the rating procedure (see below).
Most of the responses selected were those of speakers originating from Afghanistan, Turkey, Morocco, and the former USSR; these were also the main countries of origin of the candidates of the STEX-DL2 at that time. The other selected responses were those of speakers from Indonesia and various African countries. The L1s of the speakers were the following: Farsi-Persian, Turkish, Kurdish, Arabic, Lithuanian, Indonesian, Portuguese, and Yoruba.
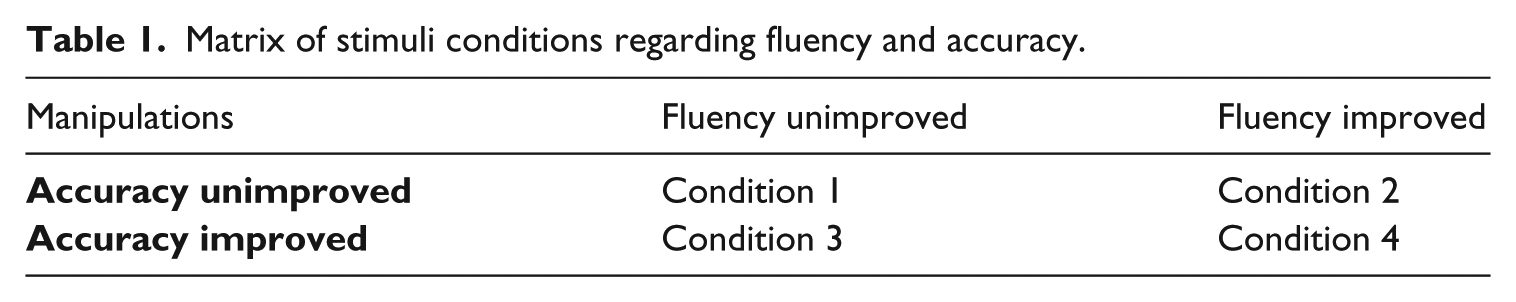
The selected original responses were literally transcribed in standard spelling. Of each of these scripts, four differently manipulated scripts were constructed (Table 1). The literal transcriptions provided the scripts for condition 1. All disfluencies were deleted in the scripts for condition 2. The deletion included all filled pauses at start-up and within phrases, all repairs (corrections and repetitions), and all silent pauses longer than 250 ms within phrases. In the scripts for condition 3, all verb-finiteness errors were corrected by adjusting form and location of the verbs, and inserting or correcting auxiliaries, when necessary. All other grammatical errors remained intact to maintain variance in the stimuli with respect to morpho-syntactic accuracy, and to enable comparison of the improvements. Silent pauses between phrases were kept to the extent they were part of a natural speech rate. In the condition-4 scripts, the manipulations of the scripts for conditions 2 and 3 were combined.
Matrix of stimuli conditions regarding fluency and accuracy.
A male Turkish actor with high proficiency in oral Dutch read all scripts. These included the literal renderings of the 17 original responses from the Dutch L2 exam. Recordings were made in a studio. Digital editing techniques were employed, using Goldwave (V5.58, 2011), and PRAAT (version 5.2.01; Boersma & Weenink, 2011), so that the lengths of filled and empty pauses in conditions 1 and 3 were equal to those of the original responses without leaving audible traces of the editing.
Based on the interviews and the open-ended questions answered after completing the ratings, it appears that most raters found the stimuli sufficiently natural. Two raters stated that the pronunciation was too good compared to the lack of accurateness. One rater took exception to a lack of “melody” in certain stimuli. Although seven raters noticed that the stimuli were “manipulated” in some way, no one identified the nature or the intention of the manipulations. One rater stated that the speech in some stimuli was less fluent because of “assembling,” and that she rated those lower because it affected intelligibility.
Fluency measures
To illustrate the differences between the conditions, fluency measures of the stimuli in all conditions were computed. The stimuli were analyzed using PRAAT (version 5.2.01; Boersma & Weenink, 2011). After the boundaries of all silent and filled pauses were determined, duration and number of pauses and duration of speech were extracted. Syllables were counted manually.
Fluency measures were selected that correlate best with fluency ratings. Speech Rate (SR) was selected as a measure for speed fluency. It was computed as the total number of syllables produced (including filled pauses) divided by the total response time, and as such is a general measure for fluency. The way the measure is designed implies that all manipulations that affect the total response time affect SR, even if the articulation rate has not changed.
Breakdown fluency of the stimuli was analyzed with Mean Silent Pause Time (MSP) and Number of Filled Pauses per minute (FP). MSP was calculated as the total length of silent pauses divided by the number of silent pauses (Bosker et al., 2013; Ginther et al., 2010; Kormos & Dénes, 2004; Pinget, 2011). FP was computed as the number of filled pauses per minute of spoken time (Bosker et al., 2013; Pinget et al., 2014).
Finally, two measures of repair fluency were computed, regarding repetitions and corrections. Hence, Number of Repetitions per minute (NR) was computed as the number of repetitions of exact words, syllables or phrases, divided by spoken time, and Number of Corrections per minute (CR) was computed as the number of false starts, reformulations and self-corrections, divided by spoken time (Bosker et al., 2013; Pinget, 2011).
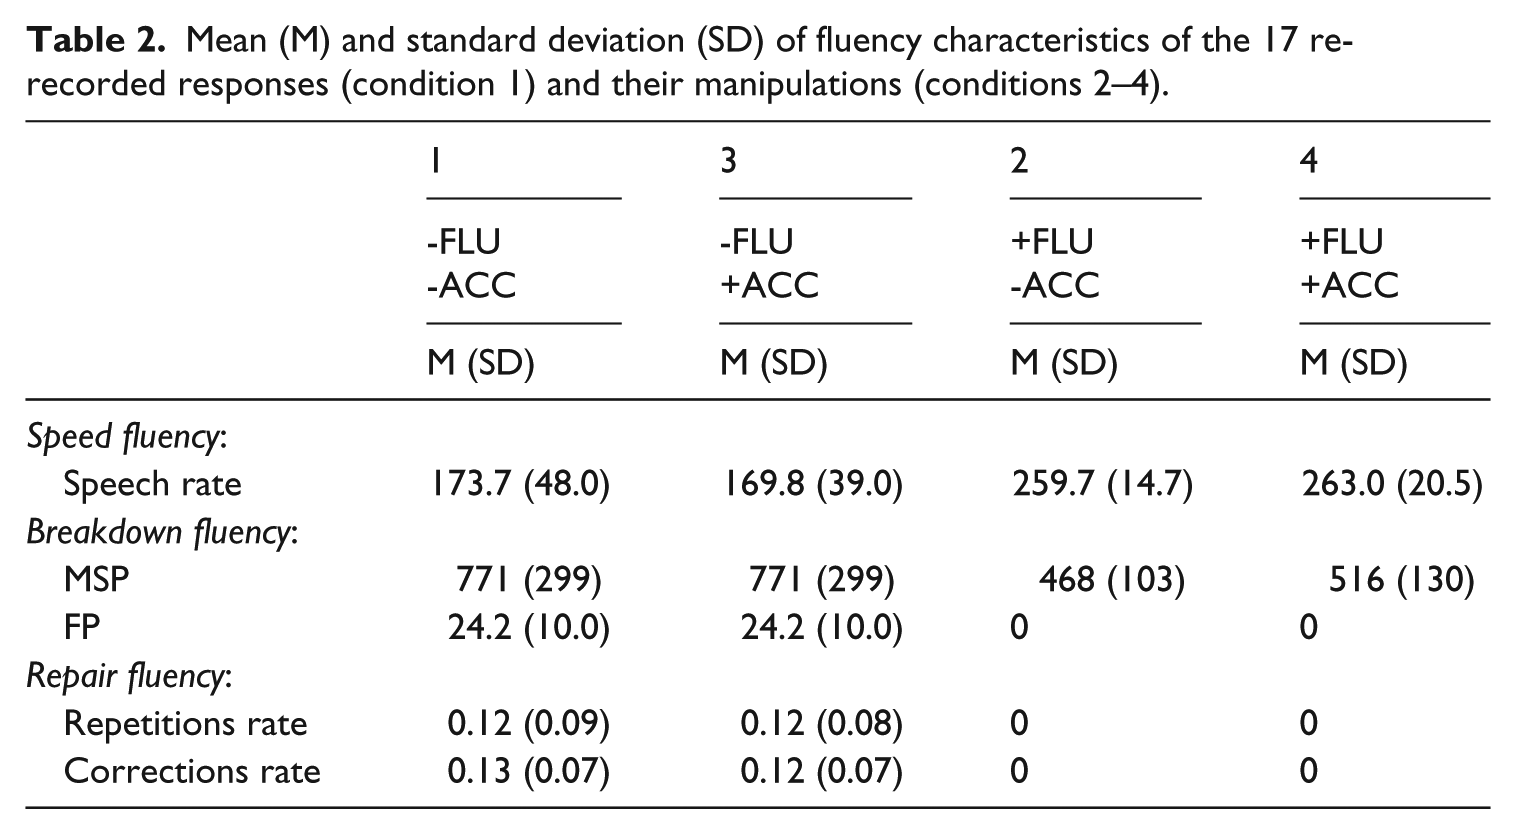
Descriptives show that removal of filled and silent pauses led to an increase of peech rate, as well as to a decrease of all other measures. Both effects were expected (Table 2). The silent pauses in conditions 2 and 4 are pauses between phrases. To examine the differences between conditions, factorial repeated-measures ANOVAs were performed for SR and MSP, with two factors with two levels each: improvement of the fluency measure (no–yes), and improvement of accuracy (no–yes) in which no change of the fluency measure was expected. The ANOVA showed, at a Bonferroni-adjusted significant level, significant and substantial effects of the fluency improvement on SR, F(1,16) = 72.7, p = .000, ηp2 = .820, and MSP, F(1,15) = 10.9, p = .005, ηp2 = .420. There were no statistically significant effects of accuracy improvement on the fluency measures (SR, F(1,16) = 0.13, p = .910, ηp2 = .001, and MSP, F(1,15) = 3.80, p = .070, ηp2 = .202), and no interaction effects (SR, F(1,16) = 1.38 p = .257, ηp2 = .079, and MSP, F(1,15) = 3.80, p = .070, ηp2 = .202). Because the improved conditions contained no filled pauses, repetitions or corrections, the ANOVA was not applicable to the other fluency measures.
Mean (M) and standard deviation (SD) of fluency characteristics of the 17 re-recorded responses (condition 1) and their manipulations (conditions 2–4).
Accuracy measures
Grammatical accuracy can be reported in terms of global accuracy or in specific types of error. For the purpose of this study, the stimuli were globally characterized to illustrate the difference between the conditions in which accuracy was not improved (−ACC: 1 and 2) and those in which it was (+ACC: 3 and 4). Two experienced linguists carried out the analyses, independently. Subsequently the differences were discussed and consensus was reached. The Analysis-of-Speech-Unit (AS-Unit) was the chosen basic syntactic unit of analysis (Foster et al., 2000). First, the stimuli were analyzed for the number of changes that had been necessary to correct all finiteness errors: number of words inserted (mean 2.2), number of words corrected/deleted (mean 2.8), and number of changes of word order (mean 1.5). The average total number of changes was 6.4. Second, the stimuli in the +ACC-condition were analyzed for remaining errors: lexical errors (mean 2.9), morphological errors (mean 0.2), and syntactical errors (mean 1.2). The average total number of errors remaining was 4.4 (Table 3).
Mean (M) and standard deviation (SD) of accuracy characteristics of stimuli grouped by condition. Mean number of AS-Units 3.6 (0.8).
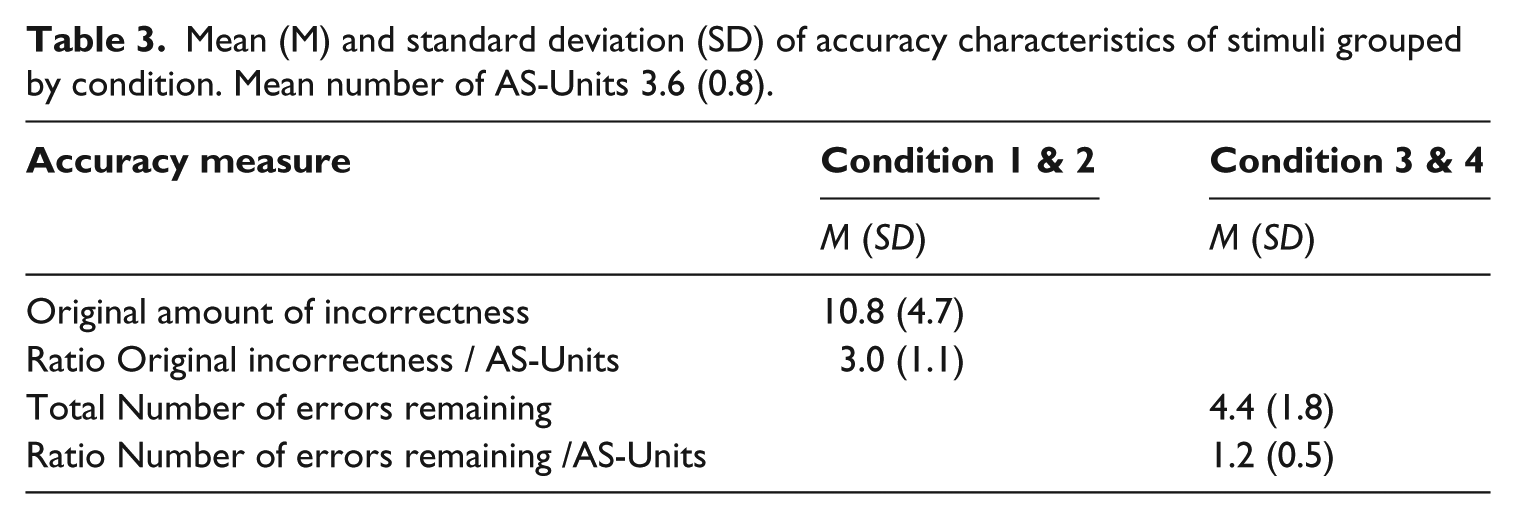
The sum of both analyses shows the original amount of incorrectness of the stimuli in condition −ACC. To correct for the length of stimuli, ratios of the accuracy measures and the number of AS-Units per stimulus were computed. A one-factorial repeated-measures ANOVA of the ratio indices was performed to investigate the differences between conditions, comparing the improved condition (+ACC) to the baseline of the unimproved condition (−ACC). The analysis indicated a large and, at a Bonferroni-adjusted significant level, significant main effect of improvement, F(1,16) = 78.095, p = .000, ηp2 = .830.
Procedure
Raters were requested to give a holistic judgment, that is, they had to answer the following question: “How well did the speaker perform the task”? The stimuli were rated in a procedure derived from magnitude estimation. Raters provided their judgments by assigning a score relative to a given anchor performance, the value of which was set to 100. The score was to reflect the ratio to the anchor; that is, a performance twice as good as the anchor should receive 200, and a performance half as good should receive 50. Raters could give, in principle, any positive number as a score. However, the middle 95% of the ratings ranged from 30 to 370. The anchor was carefully selected (Sprouse, 2011). The selected anchor met all above-mentioned criteria regarding speech sample selection. The anchor preferably is of “average quality,” leaving enough space for higher and lower scores. Consequently, the anchor forms the center of the scale (Sprouse, 2011), and will be (arbitrarily) labeled 100. A speaking performance that was assigned an overall rating just above criterion in the original exam was selected to be the anchor. In order to facilitate raters to replay the anchor as often as they considered necessary, the shortest of the suitable responses was selected. Based on the above criteria the following response was selected as the anchor, and recorded by the actor. Since condition 1 provided stimuli closest to the original responses, we used a condition-1 version of the performance as anchor.
Anchor and English (literal) translation.
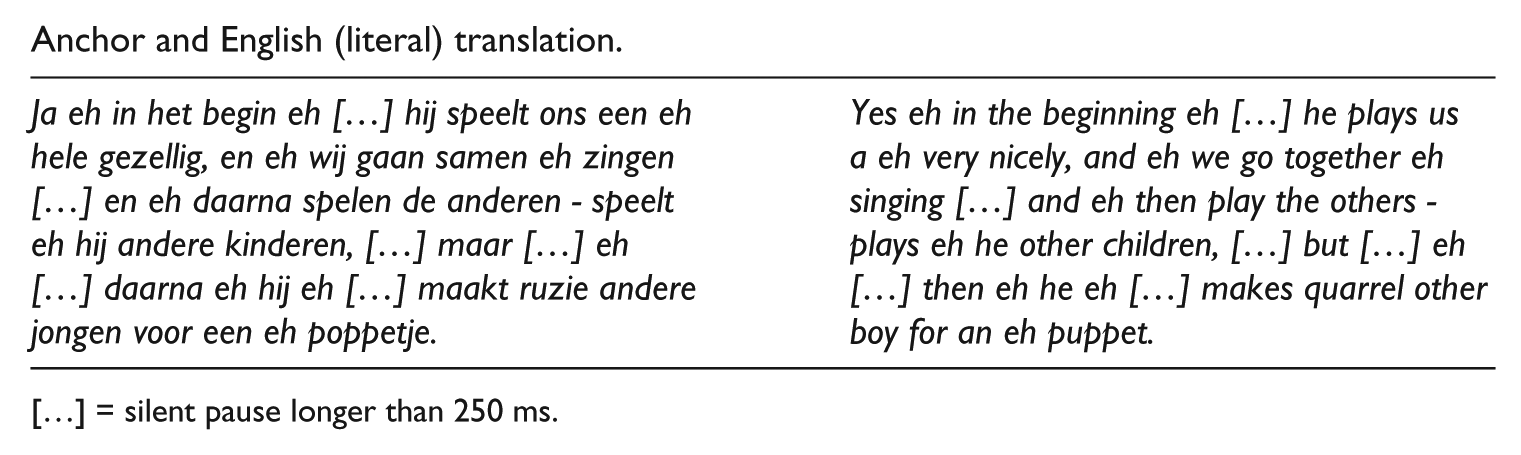
[…] = silent pause longer than 250 ms.
As this performance was uncorrected, it contained both correct and incorrect verb forms and verb placement, as well as fluency errors. Performances in conditions 2–4 are improved in one or both aspects, accuracy and/or fluency; therefore we can expect that the average level of the full set of stimuli will be somewhat above the selected anchor (100).
In the rating procedure, the raters were first familiarized with the anchor; subsequently, before the actual rating started, they rated two practice examples to familiarize with the rating task and also with the range of performances. The practice examples were selected from responses of two different speakers. Within the bandwidth of performances on the B1 exam, the first speaker was of relatively low level, the second one of relatively high level (i.e., clearly failing and passing the exam, respectively). To increase the difference between these practice examples, the first one was presented in condition 1, and the second in a condition-3 version.
The target stimuli were arranged in four blocks, in a repeated Latin square design (Rosnow & Rosenthal, 2013). Stimuli appeared in one condition only in each block. All conditions were included four or five times in each block. Each rater judged all stimuli in all conditions, a total of 68 (17 × 4) ratings per rater. 2 Afterwards the raters were then requested to answer open-ended questions regarding the rationale behind their rating behavior, the procedure, and regarding their background. All data collection from the raters was conducted with a Web-based, password-protected program that was developed to present the stimuli auditorily and to record each rating on a server after the “next” button was clicked. Raters could listen to the stimuli and the anchor as often as they chose to, but once the rating was recorded they could not return to previous ratings. The instructions made clear that the “voice in the performances was standardized” and performances could reoccur. On each screen, progress was shown relative to the total number of ratings required. Pausing was an option at any moment and there were no time limits. To prevent a sequence effect, both the blocks and the stimuli within blocks were presented in a random order. To make the program run as fast as possible, the recordings were set to mono, sample rate 22050 Hz.
Analysis
A total of 6460 ratings (17 × 4 × 95) were analyzed. Because of a flaw in the software some ratings were missing, namely .5% of the total amount of observations, scattered over stimuli and raters. One outlier was determined, with a value of over three times the interquartile range; its value was set to missing. Missing values were imputed with SPSS’s multiple imputation procedure (MCMC); each missing value was replaced with the mean value of 25 imputation runs. For each stimulus, the mean rating was computed; these means did not substantially diverge from a normal distribution (skewness = .582, SE = .291 and kurtosis = −.249, SE = .574). However, the individual scores of raters, that is the 6460 ratings, did not show a normal distribution (skewness = 2.108, SE = .030 and kurtosis = 7.083, SE = .061). Therefore, the data were transformed to their log values, which normalized the distribution to a large extent (skewness = −.448, SE = .030 and kurtosis = 2.277, SE = .061). If the ratings were really ratios in comparison to the anchor, these ratios turn into intervals.
Raters’ judgments of the 68 stimuli 3 were, as expected, intercorrelated and, to evaluate rater reliability, we computed the internal consistency of the ratings (cf. Cronbach’s Alpha) and the ‘absolute’ agreement (see Heuvelmans and Sanders, 1993). The 96 raters behaved consistently, α = .975 (agreement = .960). No rater showed a negative correlation with the rest of the raters (cf. ‘item-rest’ correlation’). Despite its sensitivity to the number of raters, Cronbach’s α remained high for just the PROF-group (k = 55): .968 (agreement = .943), and for the HRM-group (k = 41): .928 (agreement = .896). These panel reliabilities are relatively high due to the large number of raters in each group; individual raters’ ratings correlated on average .35 and .24 respectively. General consistency and agreement were sufficient for further analyses.
The questionnaire contained an open-ended question about the criteria raters used to rate the stimuli. The answers were analyzed according to the categories that were developed by Brown et al (2005), and subsequently two variables were derived: whether or not raters mentioned one or more aspects of accuracy as a feature they focused on (attention-to-accuracy) and whether or not they mentioned fluency (attention-to-fluency). One non-expert rater was removed from the analysis, because of missing questionnaire data.
A linear mixed-effects model analysis was performed in SPSS (version 23), with (log transformed) ratings as the dependent variable and three factors with two levels each: fluency improved (or not), accuracy improved (or not), and rater type (professional or human resources manager). The effects of two covariates 4 were explored: attention-to-accuracy and attention-to-fluency. Variance of stimuli, and raters were analyzed as random effects. Parameters were estimated according to the maximum likelihood (ML) method.
Results
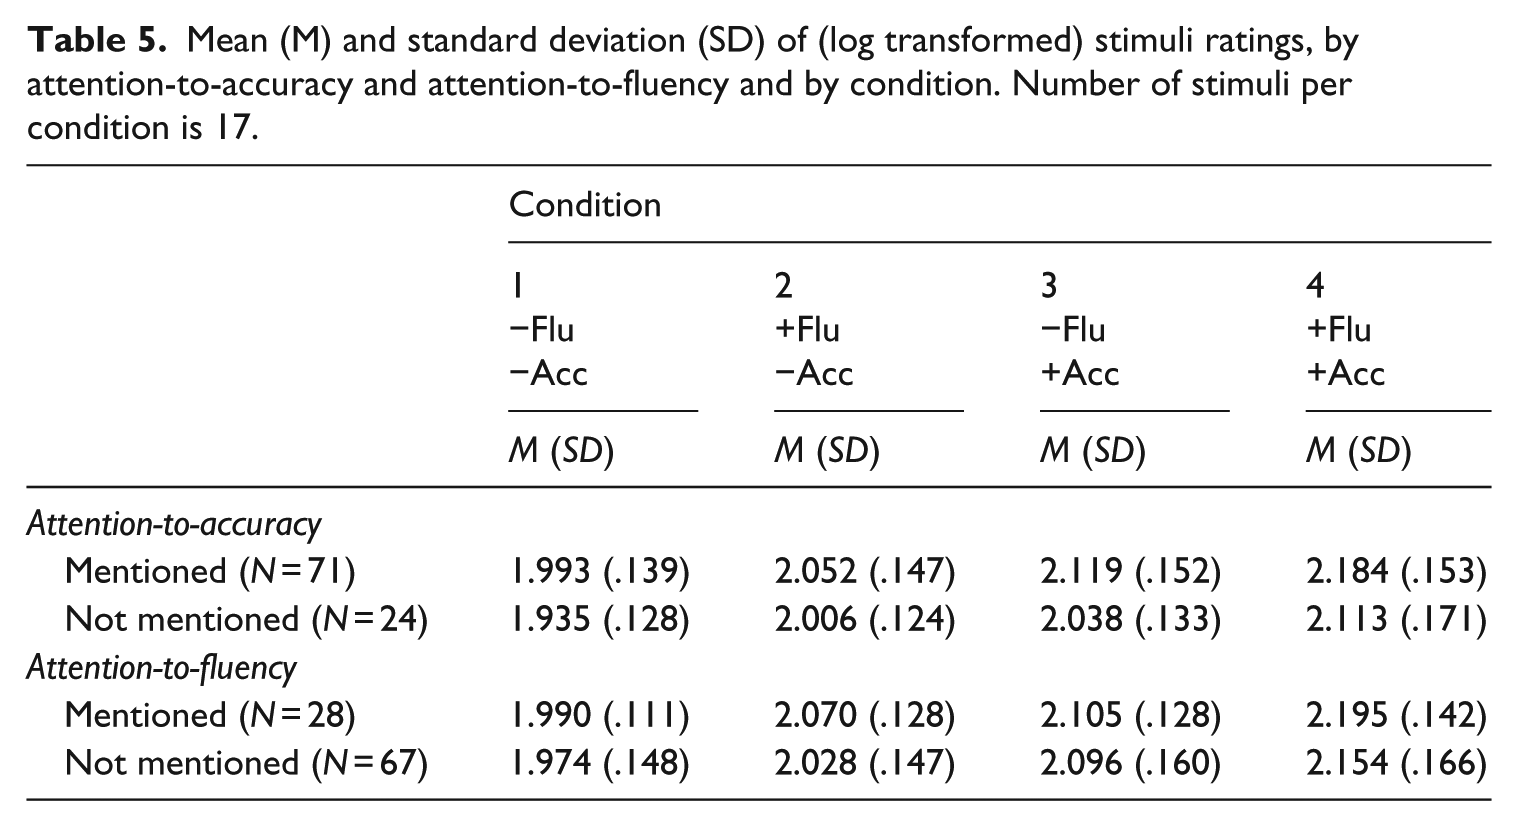
We examined whether speech sample fluency and accuracy improvement predicted holistic ratings, and whether linguistic experts rated similar to non-experts who nevertheless maintain extensive L2 contact. Table 4 shows the mean rating values per stimulus category. The mean of ratings across all stimuli was over 2.00; that is, the given value of the anchor (100 to the raters, but 10log(100) being 2). The mean of the stimuli of condition 1 (no improvement) was estimated just below 2 (1.979 being 95.3 in raw scores). The mean ratings increased with the improvements: whereas the stimuli of condition 1 (no improvement) were rated lowest, the mean rating of the stimuli in condition 4 (both fluency and accuracy improved) was highest (2.166 or 146.6). In more detail, all but one of the stimuli were rated lower in condition 1 than in condition 2 (improvement of fluency), while each of the stimuli showed increase comparing condition 3 to condition 1 (improvement of accuracy) (see also Figures 1 and 2 5 ). The descriptive statistics for the breakdown with the covariates can be found in Table 5 (log transformed) and these are graphically represented in Figure 3 and 4 (original ratings).
Mean (M) and standard deviation (SD) of (log transformed) stimuli ratings by rater type and condition. Number of stimuli per condition is 17.
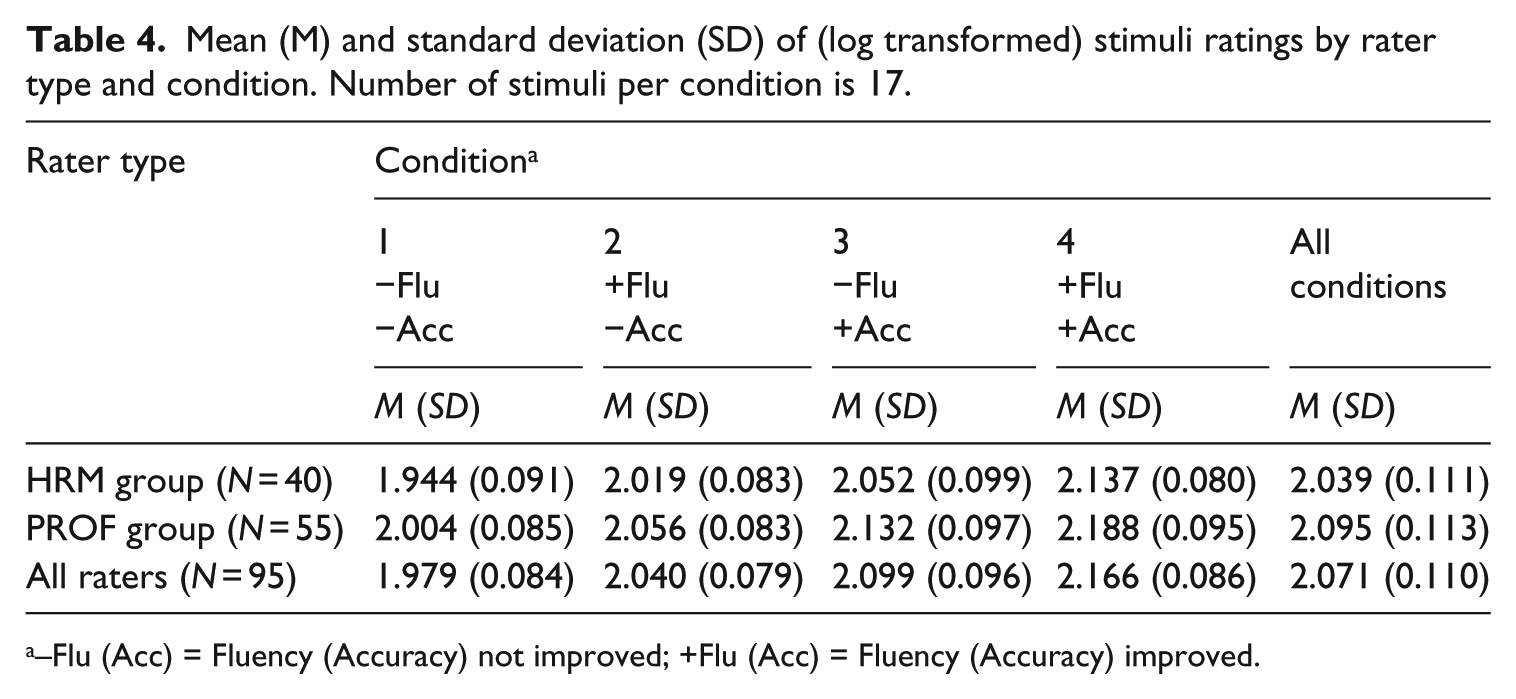
–Flu (Acc) = Fluency (Accuracy) not improved; +Flu (Acc) = Fluency (Accuracy) improved.
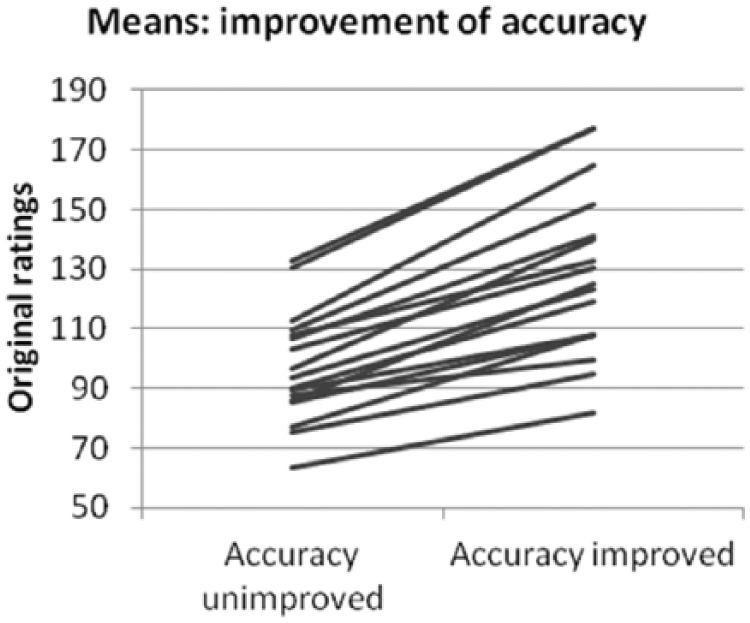
Mean ratings: Accuracy improved (conditions 1 + 2) versus not improved (conditions 3 + 4) (N = 17).
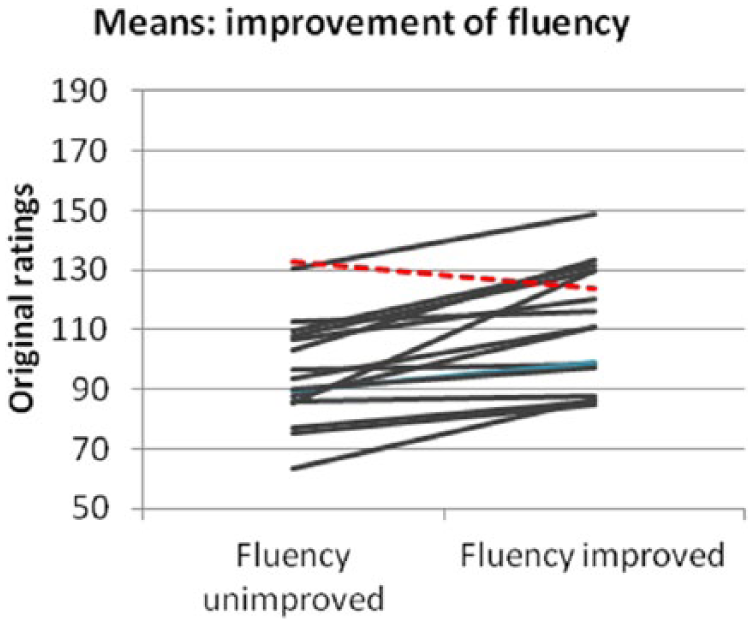
Mean ratings: Fluency improved (conditions 1 + 3) versus not improved (conditions 2 + 4) (N = 17).
Mean (M) and standard deviation (SD) of (log transformed) stimuli ratings, by attention-to-accuracy and attention-to-fluency and by condition. Number of stimuli per condition is 17.
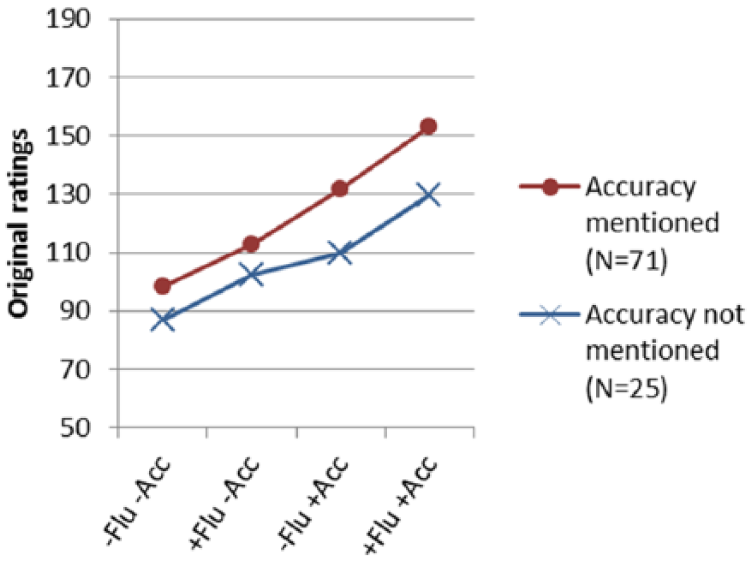
Mean ratings per condition for attention-to-accuracy mentioned or not.
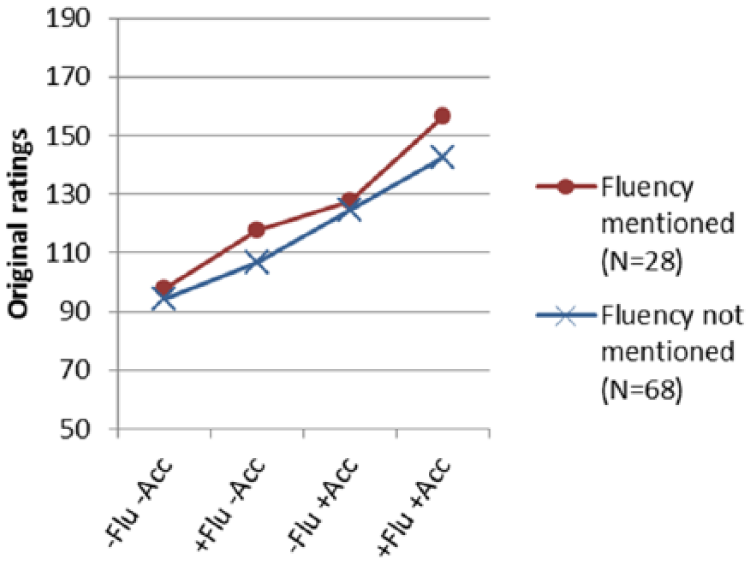
Mean ratings per condition for attention-to-fluency mentioned or not.
When asked which criteria they used to rate the stimuli, more professional raters mentioned accuracy as an important criterion than did human resources managers: 83% and 65%, respectively. Fluency seemed to be less important to both groups, but of more importance to the HRM-group (46%) than the PROF-group (37%).
Model selection
The linear mixed-effects model (LMM) analysis was initiated with a ‘null model’ to test the validity of labeling ‘raters’ and ‘stimuli’ as random effects (Table 6, Model I). This model included none of the predictor variables. The intercept of the random effects varied significantly between the stimuli (σ²stimuli = .0062, SE .0022) as well as between the raters (σ²raters = .0186, SE = .0028), as expected. Thus, these effects were included in the predictor model as random effects.
Linear mixed models: comparison of model fit (6460 observations).
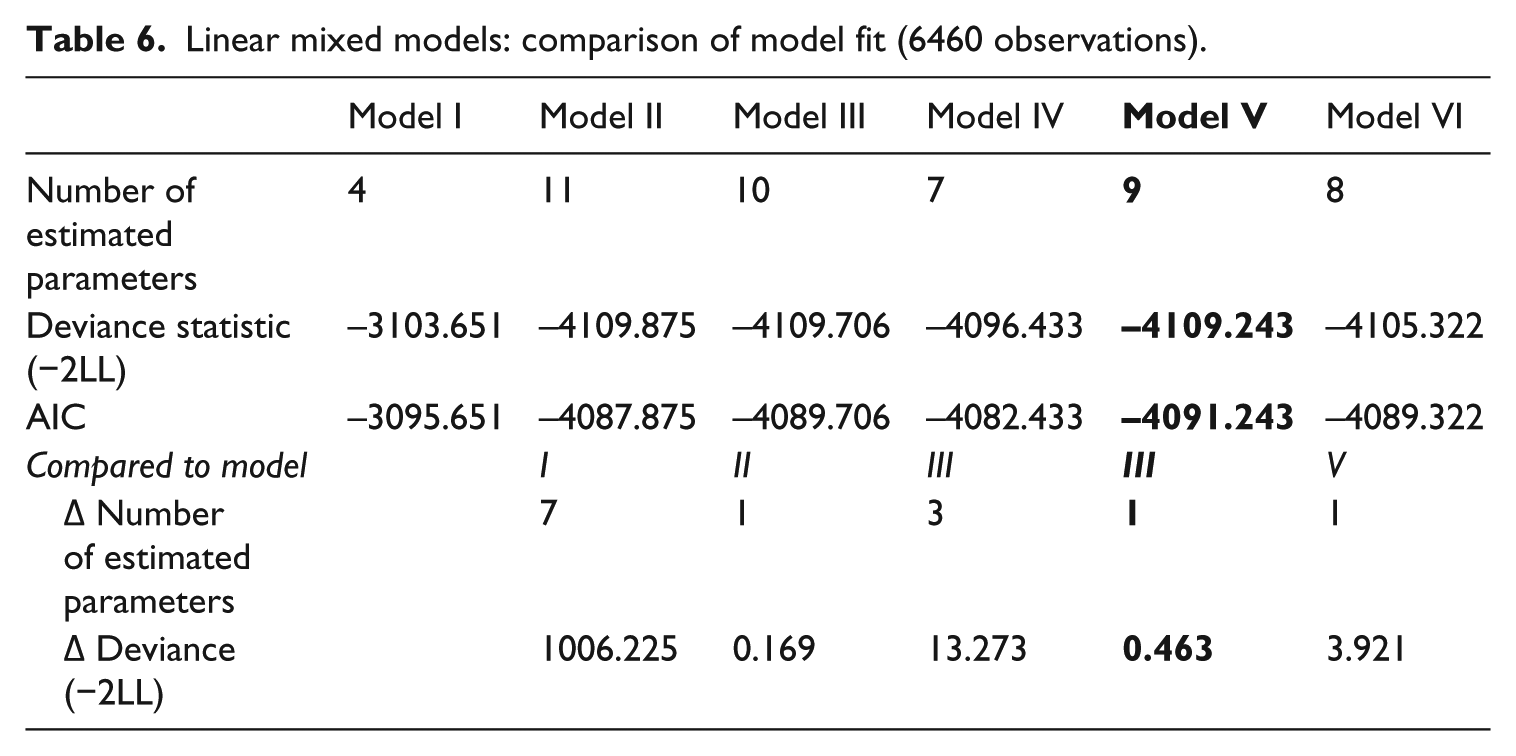
We used the LMM analysis to test whether raters’ linguistic expertise, and fluency and accuracy improvement of the speech samples helped predict observed holistic ratings. Expanding the ‘null model’ with all fixed effects and their interactions (Model II) led to improvement of the model (Δ −2LL = 1006.23 Δdf = 7 p < .001). Excluding the three-way interaction (Model III) did not affect the results (Δ −2LL = .169 Δdf = 1 ns). However, when all two-way interactions were excluded as well (Model IV), this led to a poorer fit of the model (Δ −2LL = 13.273 Δdf = 3 p < .001). Therefore, in the next step (Model V) only one of the two-way interactions was dropped, namely fluency by accuracy, which showed no significant effect in either of the prior models. This model showed the same fit as Model III (Δ −2LL = .463 Δdf = 1 ns). Lastly, the smaller of the two remaining two-way interactions was deleted, namely rater type by accuracy (Model VI). Deletion of rater type by accuracy led to a poorer model fit (Δ −2LL = 3.921 Δdf = 1 p < .05), so this interaction effect and rater type by Fluency were maintained. To sum up, Model V fitted best; that is, the model that incorporated the main effects of fluency, accuracy, and rater type, and two two-way interactions, namely rater type by fluency and rater type by accuracy. The residual variance of the “null model” (.0340) was reduced with 14.6% to .0290 in Model V. The random variance of stimuli remained the same in both models (.0062), while the random variance due to raters decreased from .0186 to .0179, a reduction of 3.9%.
Parameter estimates
The parameter estimates of model V are shown in Table 8. Both random effects of raters and stimuli remained significant, as were the main effects of fluency and accuracy, as well as their interactions with rater type. The main effects read as follows: stimuli with fluency unchanged received on average lower ratings: −.0793 (SE = .0065) than fluency-improved stimuli. Stimuli with accuracy unchanged showed effect in the same direction: −.1130 (SE = .0065). These main effects are modified by the interactions with rater type. HRM-raters responded with higher ratings than professional raters to improvement of fluency: .0256 (SE = .0086), whereas PROF-raters gave higher ratings to accuracy-improved stimuli than HRM-raters: −.0170 (SE = .0086).
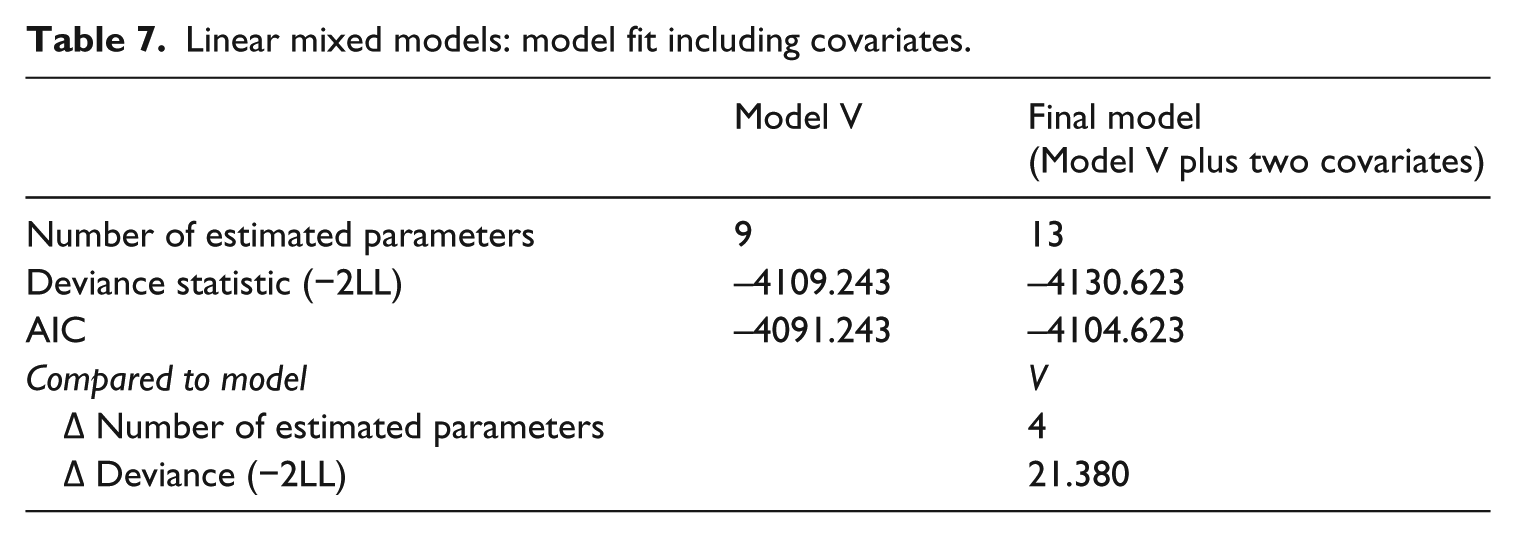
Covariates were evaluated one-by-one in Model V. First, attention-to-accuracy and its interaction with accuracy (i.e. the reaction to improvement of accuracy of the speech sample) were included, which led to a slight improvement of the model (Δ −2LL = 7.336 Δdf = 2 p < .05). Second, the addition of attention-to-fluency and its interaction with fluency led to a larger improvement of the model (Δ −2LL = 13.967 Δdf = 2 p < .01). Thus, as these variables and their above-mentioned interactions appeared to contribute to a better model fit, we concluded to a final model that includes both covariates and their relevant interactions. Table 7 shows the final model’s improvement compared to Model V (Δ −2LL = 21.380 Δdf = 4 p < .001).
Linear mixed models: model fit including covariates.
The final model’s parameters are shown in Table 8. The parameter estimates of both models were very similar, but the effect of accuracy*rater type is no longer significant, as opposed to the newly added interaction effects, probably because attention-to-accuracy was confounded with rater type. In Figures 5–8 the two-way interactions are plotted. Raters who noted fluency as important, gave higher ratings to improvement of fluency than raters who did not note fluency: .0349 (SE = .0094). Raters who mentioned the importance of accuracy, responded with higher ratings to improvement of accuracy (.0213 [SE = .0099]) than the raters who did not mention accuracy as an important rating criterion. Both random effects of raters and stimuli remained significant.
Linear mixed models: parameter estimates and standard error (SE).
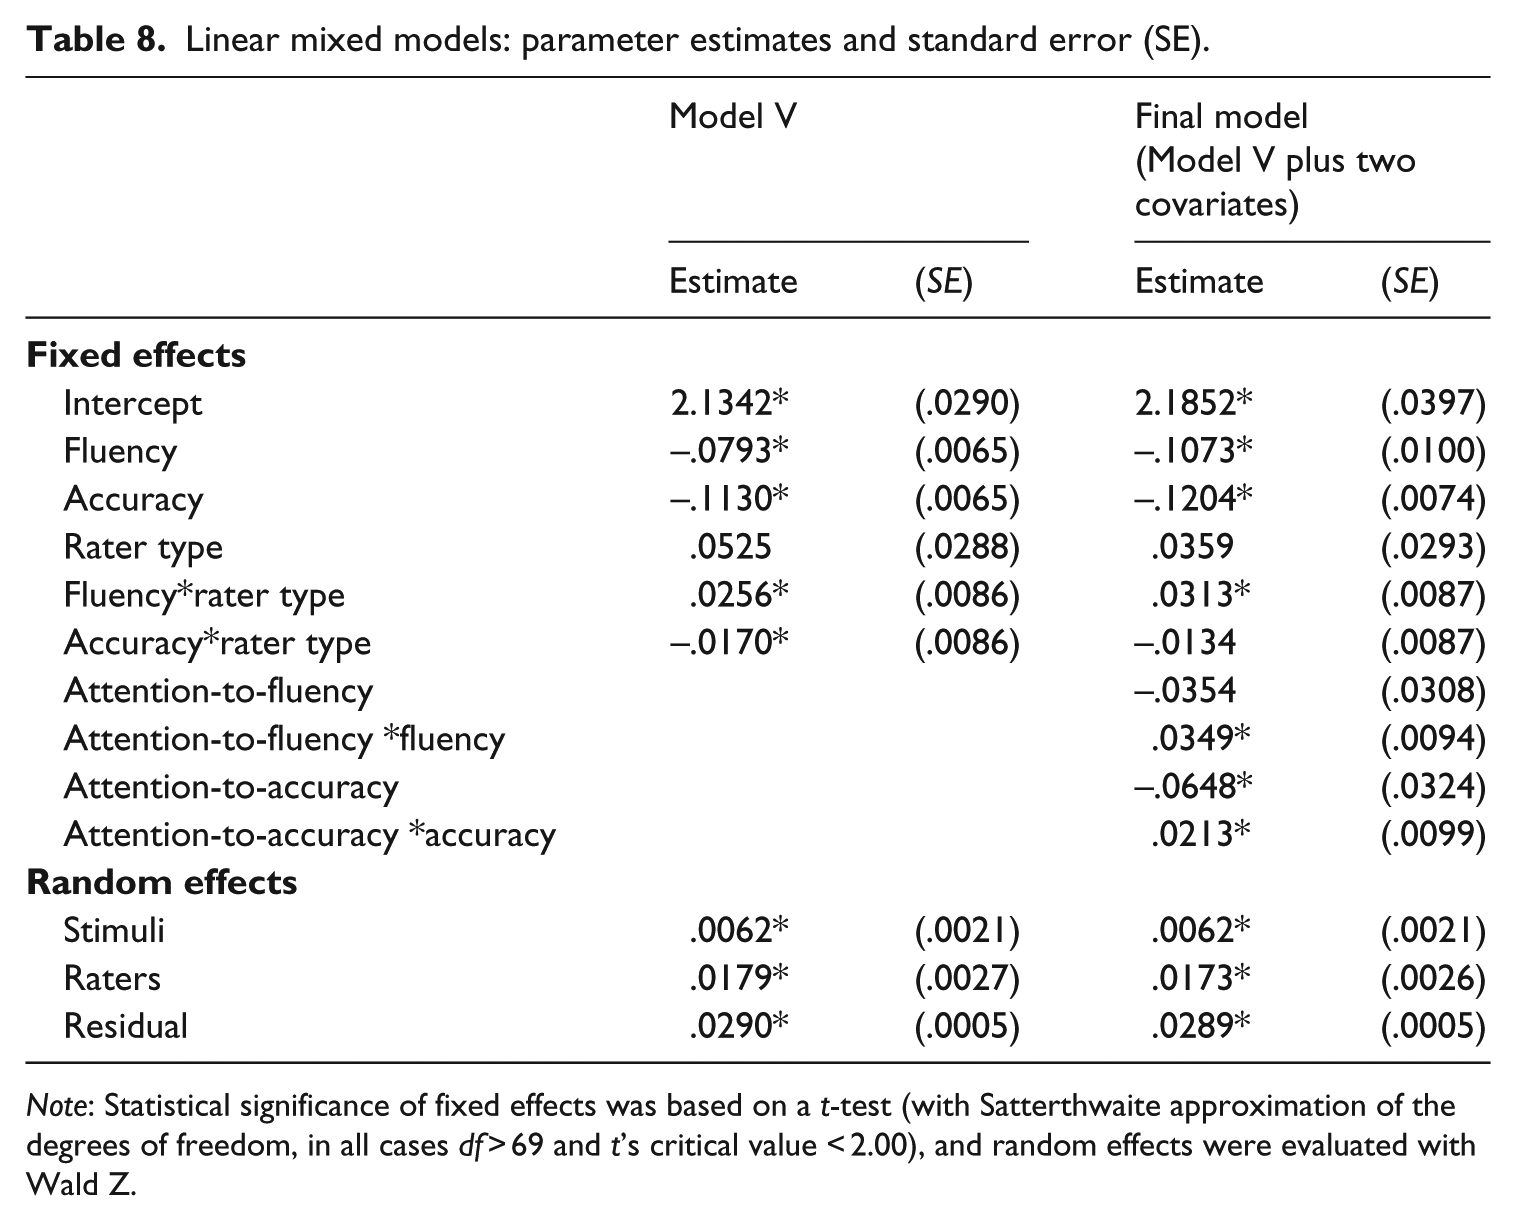
Note: Statistical significance of fixed effects was based on a t-test (with Satterthwaite approximation of the degrees of freedom, in all cases df > 69 and t’s critical value < 2.00), and random effects were evaluated with Wald Z.
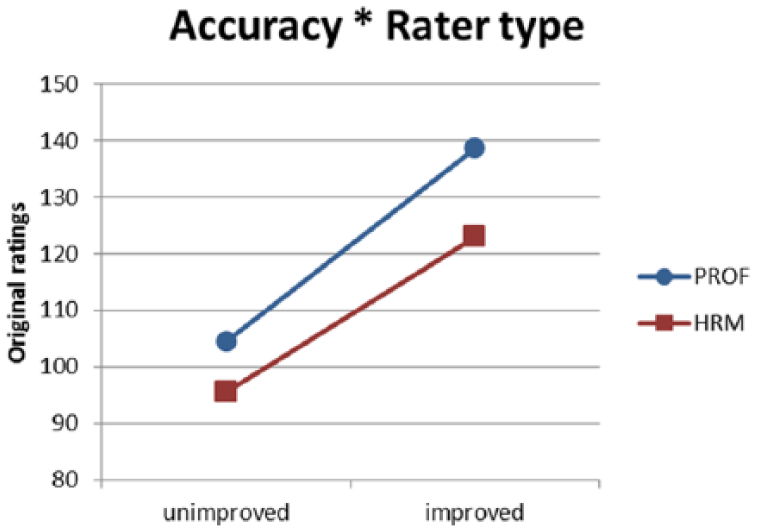
Interaction of accuracy and rater type.
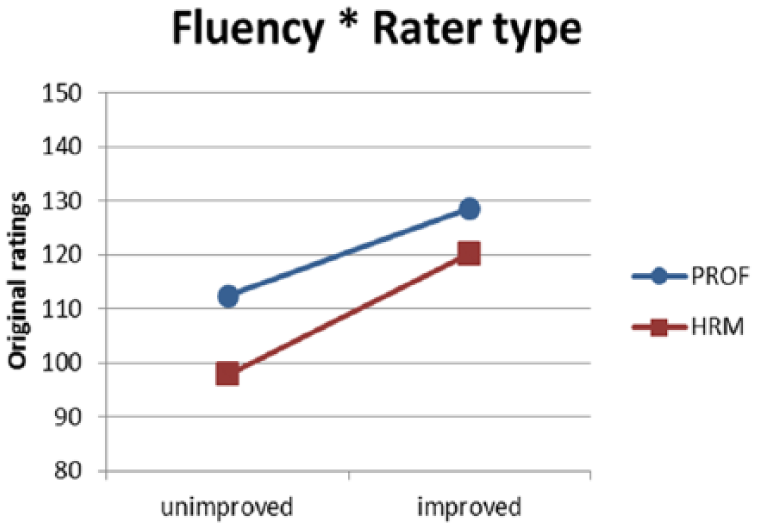
Interaction of fluency and rater type.

Interaction of accuracy and attention-to-accuracy.
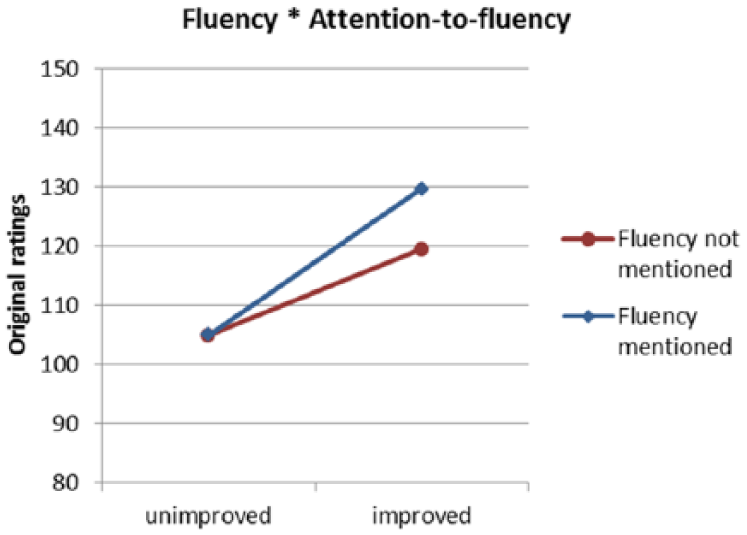
Interaction of fluency and attention-to-fluency.
Discussion
This study focused on rater variability with respect to perception of certain features of L2 speech, and the role of linguistic expertise, while accounting for exposure to L2 speech. In this study, Dutch L2 speaking responses that were manipulated for fluency and/or morpho-syntactic accuracy were rated for global proficiency by two groups of raters: experienced professional L2 raters and linguistically untrained human resources managers. All raters had had extensive exposure to Dutch L2 speech. This study used an experimental approach which allowed us to investigate separately two features of speech that are often confounded. Furthermore, deploying an actor helped us to control for voice and pronunciation.
A linear mixed-effects model analysis showed a random effect for raters as well as for stimuli. This can be taken to mean that raters individually differ in what they regard as linguistically better performances, and that the stimuli differed from each other in perceived level of performance according to the ratings. Notwithstanding these individual differences, groups of raters appeared to have preferences in common and manipulations of speech samples have systematic effects on their ratings. Comparing the amount of variance explained by the “null model” and that of the final model (including the covariates) showed that the manipulations and the rater characteristics contributed to the explanation of some of the variance. The residual variance of the “null model” was .0340, the residual of the final model .0289, a reduction of 14.8%. The stimuli variance remained the same in both models (.0062), whereas the raters’ variance decreased from .0186 (null model) to .0173 (final model), a reduction of 7.0%. These results allow us to address our initial research questions.
Research questions
Do professional and non-professional raters rate L2 speech similarly? More professional raters mentioned accuracy as an important criterion than did human resources managers, resp. 83% and 65%. Fluency seemed to be less important to both groups, but is relatively often mentioned by the HRM-group (46%) as compared to the PROF-group (37%). This confirms findings from earlier studies that found differences in criteria applied by linguists and other relevant groups of raters (Brown, 1995; Galloway, 1980; Hsieh, 2011; Huang, 2013; Jacoby & McNamara, 1999; Knoch, 2009; Rossiter, 2009; Zhang & Elder, 2011). Huang (2013) also found, using questionnaire data, that teachers were relatively more focused on grammatical errors and less so on SR than non-teachers. For studies that found that assessment criteria are used in a more or less similar way, see Douglas and Myers (2000) and Hadden (1991).
The initial statistics ostensibly suggested that the professional raters gave higher ratings than the human resources managers in all conditions (Table 4). This finding seems to support Hsieh’s suggestion that the differences she found between professional and non-professional raters are due to differences in prior exposure to L2 speech rather than to their professional field (Hsieh, 2011, p. 63), thus supporting findings of earlier studies regarding familiarity with L2-accented speech (Derwing & Munro, 1997; Gass & Varonis, 1984; Rubin, 1992; Winke, Gass, & Myford, 2011). However, in our study both rater groups maintained abundant contact with L2 speakers, and therefore exposure to L2 speech does not seem to be a likely explanation. The linear mixed-model analysis showed that rater type interacts with features of the stimuli, that is, fluency and accuracy. These interactions qualify the non-significant main effect of Rater type and possibly findings of other studies that did not find an effect of rater type (cf. Galloway, 1980; Huang, 2013; Jacoby & McNamara, 1999; Knoch, 2009; Zhang & Elder, 2011).
Are raters sensitive to changes in fluency or linguistic accuracy? In certain speech samples breakdowns and repairs were eliminated. These fluency-improved speech samples received significantly higher ratings, thus confirming that this aspect is critical to speaking proficiency ratings. This finding corroborates earlier findings (Bosker et al., 2013, 2014; Kormos & Dénes, 2004; Munro & Derwing, 1998; Pinget et al., 2014). In addition, morpho-syntactically improved speech samples received significantly higher ratings, thus further confirming this aspect to be important to speaking proficiency raters; this affirms the study reported by Brown et al. (2005) and Iwashita et al. (2008).
Do professional and non-professional raters react similarly to improvement of these features of L2 speech? The HRM-group seemed to be more sensitive to fluency improvement than the professional raters, whereas professional raters awarded morpho-syntactical improvement more than the human resources managers. The latter interaction was no longer statistically significant when the variable ‘attention-to-accuracy’ was included. ‘Attention-to-accuracy’ refers to raters who had reported using accuracy as a criterion and they were indeed more responsive to accuracy improvement. For a large number of professional language raters accuracy was a prominent criterion, this number was smaller among the HRM raters. It seems that this prominence of the accuracy criterion causes the PROF-group to react stronger to morpho-syntactical improvement, rather than being a professional rater per se. Although a number of HRM-raters showed valuing accuracy, and demonstrably awarded morpho-syntactical improvement, there were fewer of them in the HRM-group than in the PROF-group.
Accuracy versus fluency
Accuracy and fluency are two features of speech that are difficult to compare because they do not have a common underlying scale. In this study accuracy-improved speech samples were not entirely without accuracy errors, as they were improved for verb finiteness errors only. Fluency-improved speech samples were in a sense “perfectly fluent”: all breakdown and repair instances were eliminated and they were spoken at normal pace. Nevertheless, the accuracy-improved stimuli were rated higher than the fluency-improved stimuli in our sample. Although the degree of improvement on the two features may differ, it seems that raters are more sensitive to the improvement of accuracy we established than to the improvement of fluency. This corroborates the finding that raters more often mentioned accuracy than fluency as an important factor.
Raters who mention fluency to be important gave higher ratings to fluency-improved stimuli than to non-improved stimuli; the same goes for raters who mentioned accuracy to be important; they gave higher ratings to speech performances that had improved accuracy. Therefore, we might conclude that raters recognize and value improvement of a feature with significance for them. This result corresponds to the findings of Brown (1995), but does not support Galloway (1980) and Hadden (1991).
Limitations of the study and further research
This research was carried out with software that enables participants to rate online. Although this method has the advantages of relatively simple logistics, complete freedom for participants to choose time and place to perform the task, and fast recruitment of specific groups through online communities, it also has drawbacks (Dandurand, Shultz, & Onishi, 2008). First, it is obvious that this method allows less control over the experimental environment. In order to prevent noise and technical aspects causing variability, we instructed participants to choose a quiet timeslot and to check their computer equipment’s functioning (especially speakers/headphones) before starting the experiment. Moreover, by checking for outliers we reduced (the risk of) possible effects of this variability. Second, the final sample of raters may be biased, because only motivated participants may start and complete the experiment (Reips & Funke, 2008). However, this disadvantage would not be excluded by conducting the experiment in the lab: both online and lab experiments using volunteers encounter the issue of self-selection (Dandurand et al., 2008). Lastly, dropout rates as high as 80% are reported for online experiments (O’Neil, Penrod, & Bornstein, 2003). The dropout in our experiment was comparatively low; only 11% of the raters who reached the first page (after login) did not complete the experiment. This suggests that our precautions against dropout were effective, and the remaining number of raters seem to warrant generalizations. In addition, the small fee the participants received after completing the task may have stimulated their motivation. Intrinsic motivation may also have been a positive factor: several of the raters explicitly expressed appreciation that research was carried out in this field.
In our study we worked with an actor who performed the scripts that were designed to represent the four experimental conditions. This approach has the advantage of ‘control over the speaker’ and his voice and accent, and by design control over the content of the speech samples in the four conditions. Of course, this kind of experimental control might affect rating behavior, and raters might focus on differences between speech performances and seek to be consistent. However, all raters were instructed that the voice was standardized and that some performances could reoccur. We also checked our effects by analyzing data from only block 1 in which (original) performances had occurred once. 6 We fitted model V (see Table 6) again to this subset of our data and it turned out that all three main effects showed up again as statistically significant. The two interaction effects pointed in the same direction but were no longer statistically significant, which might be caused by a substantial reduction in statistical power. Furthermore, both rater groups got the same instruction and could not go back to previous scorings. There is no reason to assume that the two groups are affected differently by the experimental setting.
Earlier research has established that, besides fluency and accuracy, at least pronunciation, vocabulary/content, and sociolinguistic adequacy are basic components of speaking proficiency. For reasons of practicality, our experiment concerns only fluency and accuracy. However, further research into the relative importance of other important features is required.
Our aim was to compare the judgments of professional and non-professional raters. For this last group, human resources managers with experience with L2-speaking employees were recruited. In practice, however, more stakeholders can be identified. First, all human resources managers with employees on an intermediate level can be considered stakeholder of the exam concerned (STEX-DL2). Consequently, this includes those with little or no experience with L2 speakers. Second, this exam is designed for individuals aspiring to qualify for study at an intermediate level as well as for employment. Therefore, (subject) teachers and tutors in schools at intermediate level are important stakeholders. To enable generalization of the results to all stakeholders, these groups should be involved in follow-up studies.
Conclusions and implications
This study showed that an experimental approach can provide useful insights into the relative responsiveness of raters to features of speech. Our finding that improvement of fluency leads to significantly higher ratings shows that raters are sensitive to this feature. Similarly, accuracy improvement also leads to higher ratings, even when speech is not fluent. It is important to notice that these effects appeared to be additive, as there was no interaction effect of accuracy and fluency. Differences in leniency between L2-experienced HR managers and experienced language raters could be explained by different inclinations. Linguistic experts are more often inclined to use accuracy as a criterion, while HR managers more often mentioned fluency to be an important criterion. The results showed that the raters also acted accordingly. An average accuracy-improved speaking performance gains on average 35 points rated by a professional rater and 28 points rated by a HRM rater (see Figure 5). An average fluency-improved speaking performance gains 17 points rated by a professional rater and 22 if rated by an HRM rater (see Figure 6). However, if we look at the prominence of certain criteria to raters the differences between raters are much larger. Raters who claim to attend to accuracy reward improvement in this respect with 36 points, whereas those who do not make this claim increase their rating – on average – with 26 points (see Figure 7). The counterparts for fluency improvement are 25 and 14 (see Figure 8). These differences in appreciation of features of the speaking performance can make a difference between pass and fail on a test. Therefore, these kinds of results are relevant for language assessment, more specifically for rater recruitment and training. Language assessors should be aware of possible differences between rater groups in prioritizing features of a speaking performance in their ratings. For language learners it may be reassuring to know that raters are sensitive to improvements in the accuracy and fluency of a speaking performance and thus it might be very worthwhile to seek improvement of these features in one’s speaking.
Footnotes
Acknowledgements
We wish to acknowledge the raters who participated in this experiment for help in making our research possible. Thanks are also due to colleagues at the Amsterdam Center for Language and Communication for their valuable feedback. We also would like to thank Judith Janssen of Cito (Netherlands), and Simon Verhallen from the Dutch Board of Examinations for their support and cooperation. We also would like to thank anonymous reviewers for their comments on previous versions of the paper.
Declaration of Conflicting Interest
The author(s) declared no potential conflicts of interest with respect to the research, authorship, and/or publication of this article.
Funding
The author(s) disclosed receipt of the following financial support for the research, authorship, and/or publication of this article: This work was supported by the Amsterdam Center for Language and Communication (University of Amsterdam).