
Abstract
Many people believe that “living happily ever after” involves finding a romantic partner. Regardless, it seems obvious that at least some single people are happier than some coupled people. But how likely is it, and what factors predict whether singles will be as happy as their coupled peers? The present paper addressed these questions via a secondary analysis of an existing cross-sectional dataset (N = 2,000) of coupled (n = 1,438) and single (n = 562) adults. We identified 10 candidate predictors of life satisfaction, seven of which were significant in multiple regression models. Using the seven significant predictors as indicators in latent profile analysis (LPA), we identified four distinct profiles (or groups) of coupled adults and six distinct profiles of single adults. We then further conceptualized these profiles in terms of interpersonal indicators (friend satisfaction, closest friend intimacy, family satisfaction, and romantic satisfaction) and intrapersonal indicators (self-esteem, perceived stress, and physical health). Some profiles had very favorable levels of interpersonal and intrapersonal indicators and some had very unfavorable levels, while several profiles fell in between the two extremes with a range of nuances. Overall, people with favorable levels were happier than those with unfavorable levels—regardless of their relationship status, but disadvantages in one area (e.g., self-esteem) could be offset by advantages in another area (e.g., friendship satisfaction). Most importantly, in comparing single and coupled profiles directly, we found that the vast majority of single adults follow a range of life satisfaction patterns (from happy to unhappy) that is nearly identical to that of their coupled peers.
“And then the prince and Briar Rose were married, and the wedding feast was given; and they lived happily together all their lives long.” – The Brothers Grimm (from the fairy tale, Briar Rose). “People do fall in love. People do belong to each other, because that's the only chance that anyone’s got for true happiness.” – George Axelrod (from the movie, Breakfast at Tiffany’s)
People frequently fall for the “myths of happiness” by thinking that certain accomplishments (such as getting married) will bring lasting joy, while certain setbacks (like not finding a spouse) will lead to constant misery (Lyubomirsky, 2013). Western culture—as evidenced by popular fairy tales and romantic movies—cleaves strongly to the belief that “living happily ever after” involves finding a romantic partner. Additionally, a large body of empirical research shows that, on average, coupled people tend to be happier than those who remain single (Stutzer & Frey, 2006). However, it seems obvious that at least some single people are as happy as—or even happier than—some coupled people. But how likely is it, and what percentages of single and coupled people share high, average, or low levels of happiness? Further, what factors (e.g., friendship satisfaction, self-esteem) explain variations in happiness for both single and coupled adults?
Considering well-documented biases and discrimination against single people (i.e., singlism) may better inform these questions (DePaulo & Morris, 2006; Kislev, 2019). Americans often view singles negatively and couples positively. For example, the U.S. government offers several advantages to spouses they do not offer to singles, including special tax breaks, social security benefits, and health insurance coverage (DePaulo, 2014). Moreover, research shows that prejudice against singles is generally considered more socially acceptable than prejudice against other groups, such as foreign, gay, and bisexual people (Fisher & Sakaluk, 2020). Single people are often perceived as immature, insecure, self-centered, unhappy, lonely, and unattractive, and these negative stereotypes tend to worsen as singles age (DePaulo & Morris, 2006).
Notably, the past few decades have seen a substantial shift in romantic relationship trends. Among those who choose to couple, many eschew traditional marriage in favor of unmarried long-term partnerships (Horowitz et al., 2019). Others have actively explored alternatives to aspects previously considered a natural part of couplehood, such as sexual exclusivity (Haupert et al., 2017) and cohabitation (Connidis et al., 2017). Beyond that, however, many are forgoing long-term romantic relationships altogether. In recent decades, the proportion of single people has grown, both in Western countries and the world at large (Fry & Parker, 2021; Ghaznavi et al., 2020). In the U.S., 29% of adults ages 25 to 54 were single in 1990, but that increased to 38% in 2019 (Fry & Parker, 2021).
However, psychological science has not yet fully caught up to the increasing importance of singledom in modern life. In many studies, singles are treated as a comparison group whose primary purpose is to serve as the unhappy contrast to their coupled peers. DePaulo (2014, 2017) argued that relationship science would benefit from studying singles as a group unto themselves. Such research provides a necessary counterpoint to prevailing cultural norms and existing empirical literature, which favor pro-marriage views. Answering this call, a small group of researchers have begun to study singles, but much work remains to be done (Fisher et al., 2021; Girme et al., 2016; Kislev, 2018; Park et al., 2021; Walsh et al., 2022).
In the present paper, we argue that predominant variable-centered methodological approaches favor mean comparisons of single versus coupled people to conclude that singles (on average) are less happy than couples (on average). Although psychologists frequently use the average to represent a group (or subpopulation), means may look very different from any or all of the individuals in a given sample (Morey, 2016). Of course, mean-based analyses focusing on central tendency are useful. However, such analyses may not show the full picture that many single individuals live full and happy lives comparable to their coupled peers. One way to expand this view involves examining the heterogeneity within subpopulations of single and coupled adults. In other words, are there distinct groups of single and coupled people that vary in terms of their happiness levels?
Psychological researchers have offered different group typologies (or categorizations) of singles in the past (Apostolou et al., 2019; Hostetler, 2009; Kislev, 2019, 2021; Long, 2016; Reynolds et al., 2007; Slonim et al., 2015; Slonim & Schütz, 2015; Stein et al., 2022). For example, some studies group singles into categories of people who have never been married versus those who are separated or divorced and show that never married people tend to be happier than separated/divorced people (Kislev, 2018, 2021). Other studies distinguish singles by choice (those who voluntarily decided to forego romantic partnership) versus singles by circumstance (those who report “it just didn’t happen”; e.g., Reynolds et al., 2007; Slonim et al., 2015). Singles by choice tend to be happier than singles by circumstance (Slonim et al., 2015; Slonim & Schütz, 2015), and singles by circumstance who expect to partner in the future tend to report higher levels of shame and embarrassment (Long, 2016).
Recent advancements in statistical methods may provide another way to examine distinct groups of people. Person-centered (or group-differential) analyses examine the heterogeneity within a population by identifying groups of similar people based on combinations of several variables (Johnson, 2021; Woo et al., 2018). One such person-centered tool is latent profile analysis (LPA), which is the approach we use in the present study. Using interpersonal and intrapersonal predictors of well-being as indicators in LPA, we divided single and coupled adults into groups (or profiles) for further study.
Below, we review the relationship literature bearing on our main research questions. Our review suggests that: (1) many past studies find that single adults are less happy than coupled adults, but more recent work challenges these findings; (2) few studies address how many single adults achieve levels of happiness comparable to coupled adults, due largely to researchers’ overfocus on variable-centered analyses, which may be augmented by person-centered analyses; (3) for single adults, happiness may be predicted by a variety of factors (e.g., friendship satisfaction, self-esteem), at least some of which differ from coupled adults. Overall, our review suggests the present study is both timely and useful.
Comparisons of single versus coupled adults
Historically, research suggests that there is a significant gap in well-being between single versus coupled people. Across countries and time periods, most studies using variable-centered approaches find that: (1) married people are happier than single people (whether they have been widowed, divorced, separated, or never married); (2) coupled/cohabitating people (who are unmarried) are happier than single people; and (3) married and unmarried couples may have similar levels of happiness, with some studies finding married couples are happier than unmarried couples, other studies finding the reverse, and a few studies suggesting there are no differences between the groups (Coombs, 1991; Kislev, 2018; Kurdek, 1991; Musick & Bumpass, 2012; Myers & Diener, 1995; Purol et al., 2020; Stack & Eshleman, 1998; Stutzer & Frey, 2006; Waite & Gallagher, 2001). These findings apply to both men and women. Since both married and unmarried couples tend to be happier than singles, and the literature does not suggest there is a strong distinction between them, we treat those in romantic relationships as one group, referring to them as “coupled.”
In sum, most variable-centered studies have shown that, on average, coupled people tend to report higher levels of happiness than single people. However, in recent years, a handful of variable-centered studies have provided conflicting evidence that single and coupled people may be similarly happy (Greitemeyer, 2009; Musick & Bumpass, 2012). Other researchers have taken more nuanced approaches (e.g., moderation analysis) to show that singles with specific characteristics (e.g., low relationship desire, conflict avoidance goals, or individualistic, post-materialistic values) can be just as happy as coupled people (Girme et al., 2016; Kislev, 2018, 2020). Other scholars argue single versus coupled studies are flawed for several reasons, such as self-selection effects (i.e., people choose to marry) and societal pro-couplehood biases, among others (Byrne & Carr, 2005; DePaulo, 2014). Such issues may inflate the benefits of marriage. We argue comparison studies are incomplete because they rely heavily on variable-centered approaches and neglect person-centered approaches.
Variable-centered versus person-centered analyses
How likely it is that a single person will wind up as happy as a coupled person? In essence this is a question of distributions of happiness within single and coupled populations. We assumed at the outset that, regardless of whether a person is single or coupled, that their happiness levels will fall into similar categories, such as high, moderate, or low happiness. The question, then, is how comparable the numbers in these categories are between single and coupled adults. Indeed, the degree to which similarities exist between singles and couples may be illustrated by how much overlap there is between the distributions. What percentage of singles report the highest levels of happiness? What percentage are in the middle? What percentage are unhappy? How does this compare to those who are coupled?
This question is not something that can be accurately answered by computing and comparing the mean happiness scores for subpopulations of single versus coupled adults, as studies using traditional variable-centered approaches often do. Such variable-centered techniques “assume that all individuals from a sample are drawn from a single population for which a single set of ‘averaged’ parameters can be estimated” (Morin et al., 2016, p. 8). In contrast, person-centered approaches “relax this assumption and consider the possibility that the sample might include multiple subpopulations characterized by different sets of parameters.” Overall, variable-centered approaches (e.g., correlation, multiple regression) examine relations among one or two variables, while person-centered (aka group-differential) approaches (e.g., cluster analysis, LPA) identify subgroups of people based on their similarities on several variables (Bergman & Magnusson, 1997; Johnson, 2021; Woo et al., 2018). These arguments are not meant to rebuke variable-centered approaches, but merely point out that person-centered approaches may add additional information and uncover novel findings. Indeed, person- and variable-centered approaches are best viewed as complementary, rather than competing (Marsh et al., 2009).
Accordingly, some recent work has used LPA to examine the heterogeneity of singles only. First, Walsh et al. (2022) used five indicators (friendship satisfaction, family satisfaction, self-esteem, neuroticism, and extraversion) to identify ten profiles of American singles (N = 4,835). Half of these single profiles exhibited above-average happiness, while the other half showed below-average happiness. The happiest profile had the highest friendship satisfaction, family satisfaction, self-esteem, and extraversion, paired with the lowest neuroticism; conversely, the unhappiest profile showed the reverse pattern. In between these two extremes, there were interesting nuances. For example, one relatively happy profile in the middle had high friendship satisfaction but low family satisfaction, while an adjacent profile showed the opposite pattern.
Second, Park et al. (2023) used eight fundamental social motive indicators (self-protection, disease avoidance, group affiliation, concerns about being excluded, independence, social status, mate seeking, and kin care) to identify three profiles across three samples that included American, European, and Korean singles (cumulative N = 3,195). The profiles differed as to whether they had (1) strong independence motives, (2) strong social motives (e.g., wanting high social status and not to be excluded), or (3) little interest in self-protection or disease avoidance (i.e., low safety focus), but moderate interest in social connection (e.g., group affiliation, mate seeking). Outcome analyses suggested that the singles in the independence-oriented profile were relatively more satisfied with their singlehood overall, while the singles in the low safety focus profile were the most satisfied with their lives.
In the present study, we build on these studies by using LPA to examine the heterogeneity within subgroups of both coupled and single adults. Our goal was to better understand how combinations of variables differentially relate to single and coupled adults’ happiness. Once coupled and single individuals were grouped according to profiles, we used established approaches to compare how profiles differed on multiple variables, including the predictors used for classification (i.e., indicators) and happiness outcomes (Spurk et al., 2020).
Happiness and its predictors in single and coupled adults
Finally, what factors must be considered for singles to be as happy as their coupled peers? Below, we describe how our primary outcome of happiness was operationalized, as well as which variables were selected as candidate predictors of it.
Measuring happiness
The terms “happiness,” “life satisfaction,” and “well-being” are often used interchangeably (e.g., Christoph, 2010). Diener and colleagues (1984; 1999) defined subjective well-being as a broad construct consisting of a cognitive component composed of life satisfaction (a global evaluation of one’s life) and domain satisfaction (evaluations of specific life domains such as work and health), as well as an affective component consisting of both positive emotions (e.g., joy) and negative emotions (e.g., anger). Because emotions tend to be relatively transient in day-to-day life, we assessed happiness using the relatively more stable cognitive components of life satisfaction and domain satisfaction.
Predictors of happiness in single versus coupled adults
Using a preexisting dataset, we selected 10 candidate variables that past meta-analytic work suggests are among the strongest predictors of well-being (Lyubomirsky et al., 2005; Margolis et al., 2021). These variables included friendship satisfaction and closest friend intimacy (meta-analytic r = .31), self-esteem (r = .31), family satisfaction (r = .32), perceived stress (r = −.56), romantic satisfaction (r = .36), physical health (r = .64), social support (r = .37), loneliness (r = .50), and neuroticism (r = −.46). We would have included additional important predictors of well-being (e.g., meaning in life [r = .47], optimism [r = .43], extraversion [r = .37]), but these variables were not available in the dataset used.
Notably, one predictor—romantic relationship satisfaction—was unique to the coupled group, while the other nine were common to both. Because single adults are not in long-term romantic relationships, their romantic relationship satisfaction cannot, by definition, contribute to their well-being. To compare the happiness of single versus coupled adults, then, it was necessary to account for this key difference. Therefore, we treated single and coupled adults as two separate groups within the same sample. We then conducted a series of regression models to identify which of the 10 variables were significant predictors of life satisfaction. The significant predictors were used as indicators in our LPA, but we determined the best fitting model for single and coupled adults separately. As the present analysis is exploratory, we did not formulate hypotheses about the distribution or comparability of the profiles, or which of the candidate variables would emerge as significant and unique predictors of well-being.
Method
Participants and procedure
The present study is a secondary analysis of a preexisting cross-sectional dataset collected using Dynata (https://www.dynata.com), one of the largest first-party global data platforms (see Study 2, Kaufman et al., 2021). An existing panel of American participants were invited to complete a 20-min survey for cash compensation or its equivalent in rewards and/or discounts. To ensure a nationally representative sample, the data were collected using a stratified random sampling approach designed to match targets from the 2010 U.S. Census and the 2018 American Community Survey. In total, 3,699 participants were recruited to complete an online survey. Five engagement checks were included to ensure participant attention, and participants who did not pass all five checks were excluded from the dataset. The final sample consisted of 2,000 participants. All data collection and screening procedures were approved by the local institutional review board.
Sample demographics by partnership status with census targets.
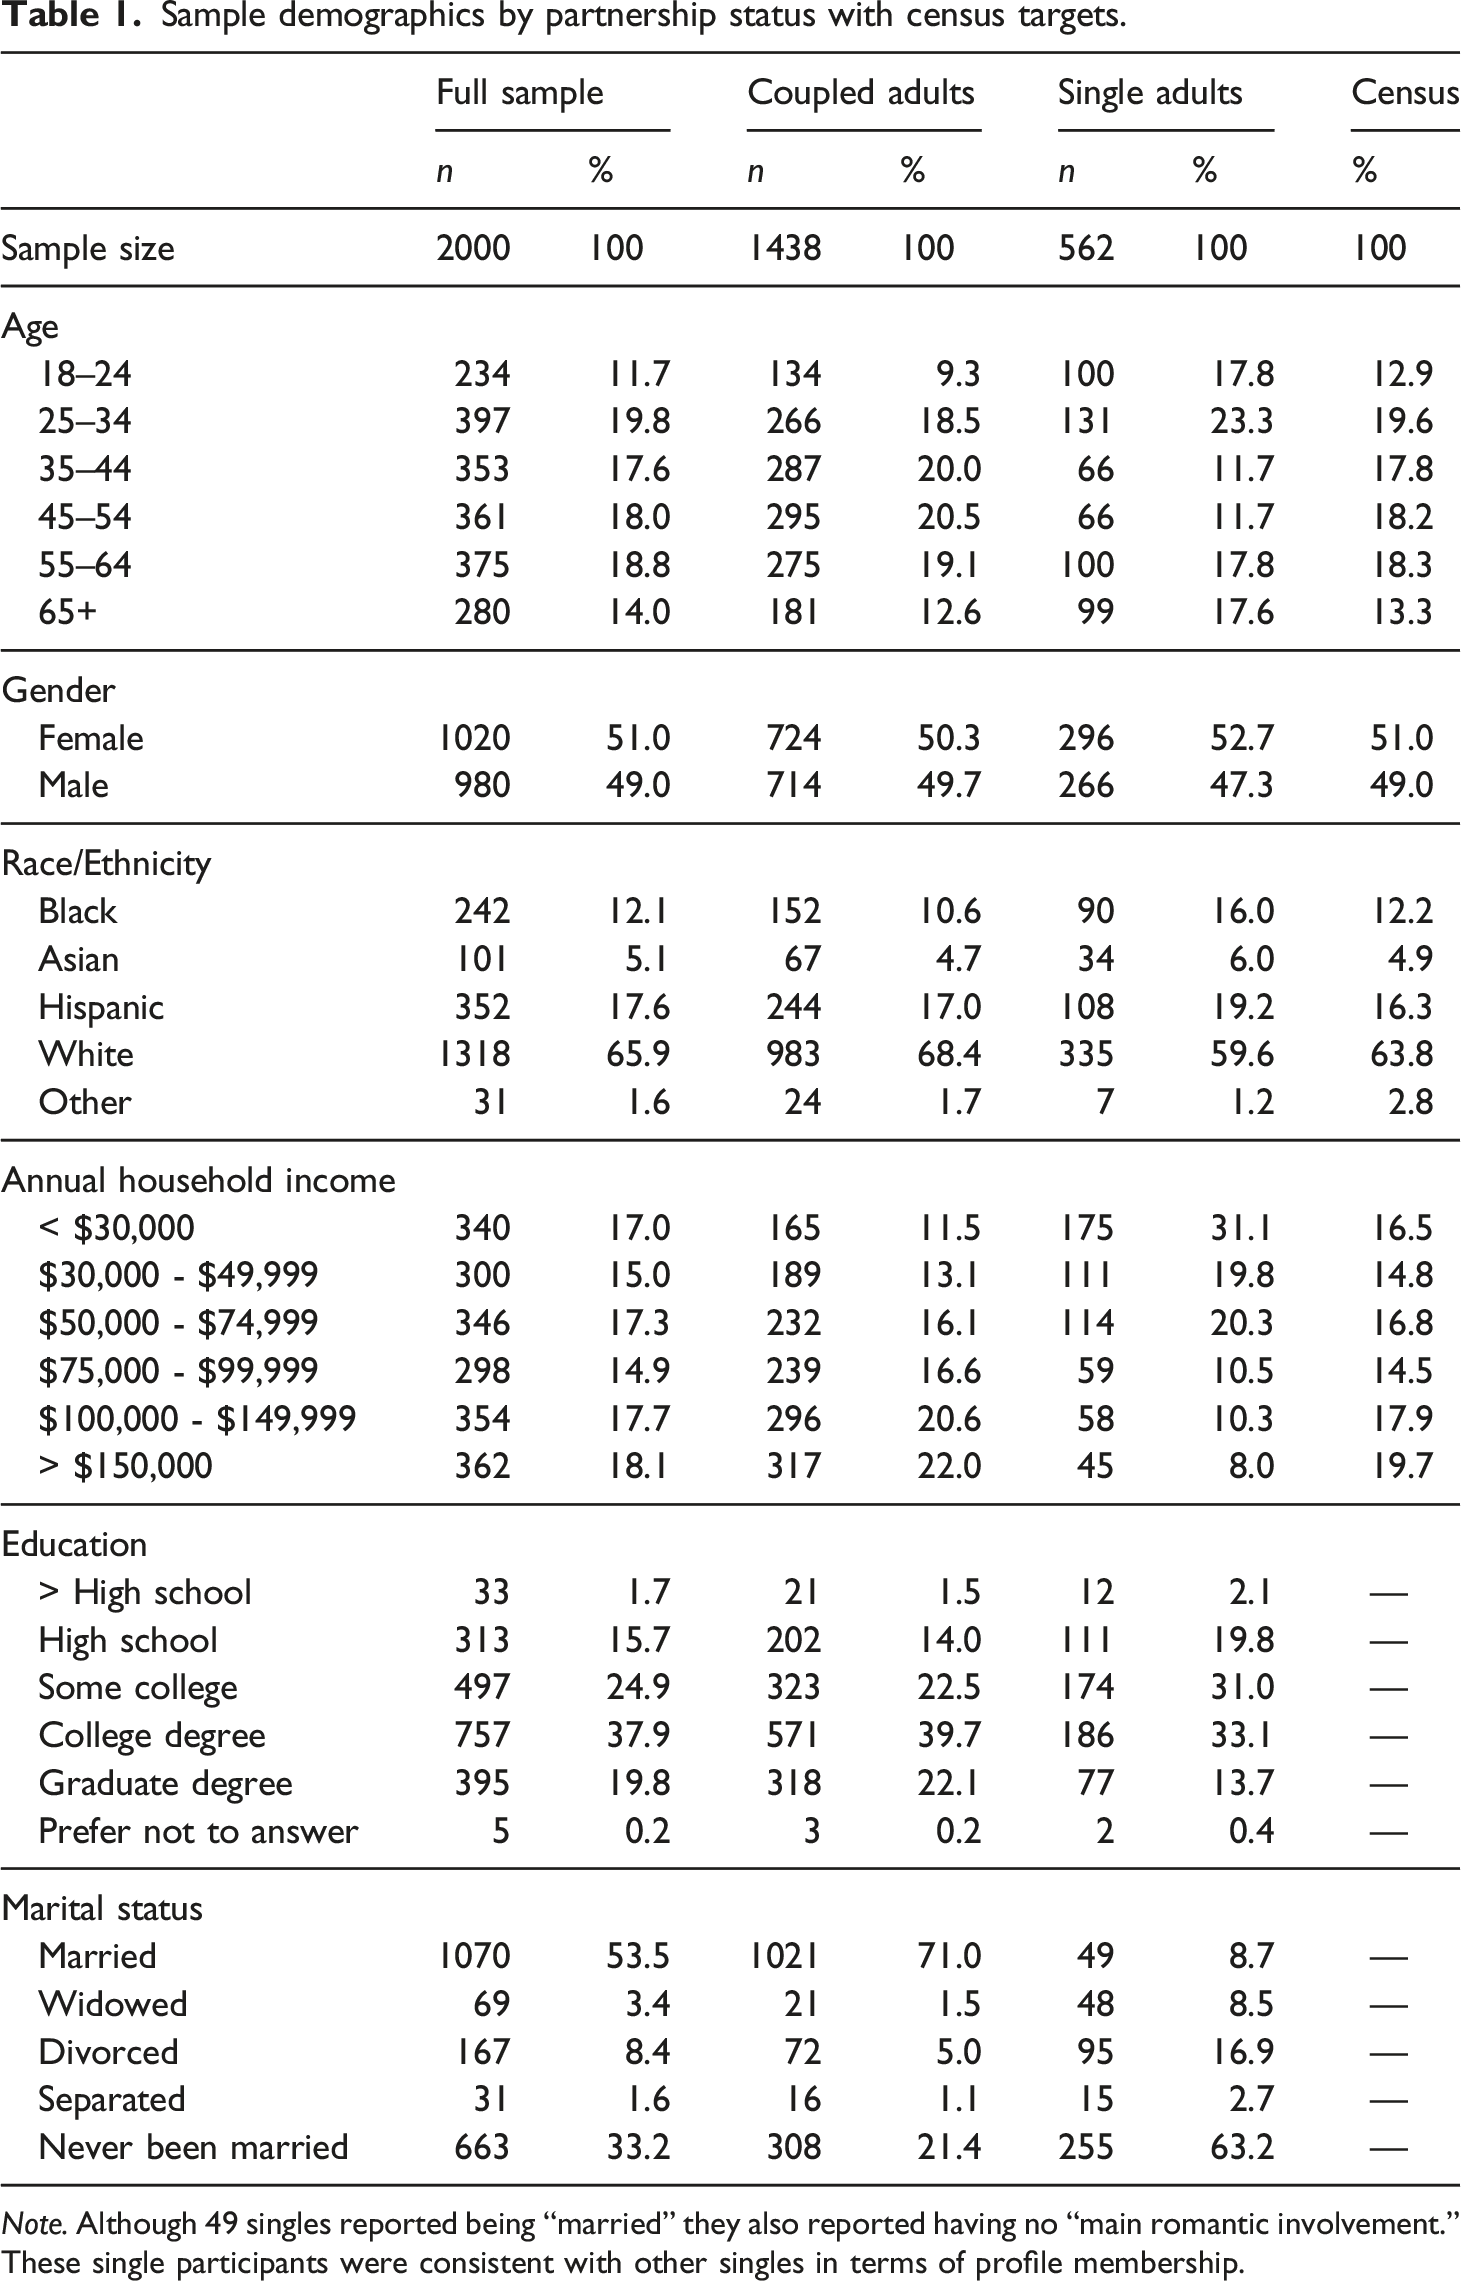
Note. Although 49 singles reported being “married” they also reported having no “main romantic involvement.” These single participants were consistent with other singles in terms of profile membership.
Measures
Primary outcome: Life satisfaction
We used two measures to assess well-being. The first, the Satisfaction with Life Scale (SWLS; Diener et al., 1985) consists of five items (α = .91) that evaluate global life satisfaction (e.g., “In most ways my life is close to ideal”). Participants indicated how much they agreed with each statement from 1 (completely disagree) to 6 (completely agree). The second measure, the Personal Wellbeing Index (PWI; The International Wellbeing Group, 2013) consists of eight items (α = .93) that evaluate domain satisfaction across multiple areas (e.g., standard of living, health, spirituality). Participants rated their satisfaction from 1 (not at all satisfied) to 6 (completely satisfied). Given recent research suggesting the SWLS and PWI are essentially unidimensional (Kaufman et al., 2022), as well as the high correlation between them (r = .75, p < .001), we aggregated the thirteen items to obtain a summed score, which we have termed “life satisfaction” (α = .94).
Proposed predictors of life satisfaction
Friendship satisfaction
Participants’ satisfaction with their friends was assessed using the Friendship Network Satisfaction Scale (FNSS; Kaufman et al., 2021). The FNSS consists of 14 items (α = .94; e.g., “I feel close to my friends”) rated from 1 (not at all agree) to 5 (completely agree).
Closest friend intimacy
We assessed how connected participants felt to their closest friend using a friendship-specific version of the Social Intimacy Scale (SIS; Miller & Lefcourt, 1982). The SIS consists of 17 items (α = .94; e.g. “How close do you feel to him/her most of the time?”) rated from 1 (very rarely) to 10 (almost always).
Self-Esteem
To gauge the extent that participants evaluated themselves positively or negatively, we used the Rosenberg Self-Esteem Scale (RSES; Rosenberg, 1965). The RSES consists of 10 items (α = .91; e.g., “On the whole, I am satisfied with myself”) rated from 1 (strongly disagree) to 4 (strongly agree).
Family satisfaction
We assessed how satisfied participants were with their family members using the Family Satisfaction Scale (FSS; Olson, 1982). The FSS consists of 10 items (α = .96; e.g., “the degree of closeness between family members”) rated from 1 (very dissatisfied) to 5 (extremely satisfied).
Perceived stress
The extent to which participants felt they could control their lives and handle personal problems was assessed using the Perceived Stress Scale (PSS; Cohen et al., 1983). The PSS consists of four items (α = .77; e.g., “In the last month, how often have you felt that you were unable to control the important things in your life?”) rated from 0 (never) to 4 (very often).
Romantic satisfaction
We assessed coupled participants’ satisfaction with their romantic relationship using the Couples Satisfaction Index (CSI; Funk & Rogge, 2007). The CSI consists of 10 items (α = .98; e.g., “How well does your partner meet your needs?”) rated from 0 to 6. The specific scale anchors depended on the question, with higher ratings indicating greater romantic satisfaction.
Physical health
Participants’ physical health was assessed using a single self-reported question (“In general, would you say your health is …”). Participants rated their health from 1 (excellent) to 5 (poor), reverse coded.
Social support frequency
We assessed how frequently people received social support from their closest friends and family members using the Multidimensional Support Scale (MSS; Winefield et al., 1992). The MSS consists of seven items (α = .90; e.g., “How often did they really make you feel loved?”) rated from 1 (never) to 4 (usually/always).
Loneliness
Feelings of social isolation and lack of support (i.e., loneliness) were measured using the UCLA Loneliness Scale (Russell et al., 1980). This scale consists of eight items (α = .87; e.g., “There is no one that I can turn to”) that ask participants to rate how often they experience lonely feelings from 1 (never) to 4 (often).
Neuroticism
We assessed the personality trait of neuroticism using the Eysenck Personality Questionnaire Neuroticism Subscale (Goldberg, 2019), which consists of 23 items (α = .93; e.g., “Does your mood often go up and down?”) rated either 1 (yes) or 2 (no).
Analytic plan
There were four main steps to the analysis. In the first step, we ran a multiple regression model on the full sample of adults, with the 10 candidate variables predicting life satisfaction. Our aim was to determine which variables were significant and unique predictors of happiness, and thus best suited for use as indicators in latent profile analysis (LPA). Nonsignificant predictors were dropped, and the regression model was retested to see if this produced a change in model fit. This was repeated for each group (single and coupled adults), with romantic satisfaction omitted from single adult models.
In the second step, before constructing our latent profiles, we tested for measurement invariance using differential item functioning (DIF) on the multi-item scales that both single and coupled adults completed and would be used in the profile construction. DIF happens when items do not assess the same construct equally well between different groups, such that the probability of endorsing an item varies due to another external variable (e.g., being coupled/single) while controlling for the underlying trait level (e.g., friendship satisfaction; Embretson & Reise, 2013). For example, an item displays DIF if participants from different groups (e.g., single vs. coupled), but with the same levels of a trait (e.g., friendship satisfaction), have unequal probabilities of endorsing an item. Accordingly, DIF is flagged when there is meaningful variability in IRT-calibrated item parameters across groups. In order to make comparisons among groups, it is important to first establish that the psychometric properties are invariant.
In the third step, after evaluating DIF, significant predictors from the first step were used as indicators to create latent profiles. This was done separately for both singles and couples so that the solutions could be compared. To determine the best latent profile model fit, we examined the following fit statistics: −2 Log Likelihood (-2LL), Akaike Information Criterion (AIC), Bayesian Information Criterion (BIC), sample size-adjusted Bayesian Information Criterion (aBIC), Lo-Mendell-Rubin Test (LMRT), Vuong-Lo-Mendell-Rubin Likelihood Ratio Test (VLMRT), and Entropy. Solutions with lower -2LL, AIC, BIC, and aBIC represent better fit. In the event of ambiguous solutions, the decision to estimate further profiles was based on theoretical and content-related considerations (Spurk et al., 2020). In the final step, we labeled and described the profiles using standardized descriptive statistics, and further analyzed the profiles using the manual three-stem auxiliary Bolck, Croon, and Hagenaars (BCH) approach (Asparouhov & Muthén, 2014; Bolck et al., 2004; Vermunt, 2010). We first conducted BCH analyses on the coupled and single profile solutions separately to examine profile differences on the outcome and indicators. For analyses where we wanted to compare coupled versus single profiles directly, we combined the class probabilities for both profile solutions, wherein the class probabilities from a given solution were kept while the class probabilities for the other solution were given a weight of zero (Galovan et al., 2022; James et al., 2022). In other words, individuals in coupled profiles would have a zero probability of being in any of the single profiles and vice versa. From there, the final combined class probability block was used to conduct combined BCH analyses to compare single versus coupled profiles’ life satisfaction using Wald chi-square tests. Statistical programs used included R (version 4.3.0) for multiple regression and DIF analyses, as well as Mplus (Version 8.1; Muthén & Muthén, 1998-2018) to create latent profiles and run BCH analyses.
Results
Predictors of life satisfaction
Regression models predicting life satisfaction from candidate variables for full sample.
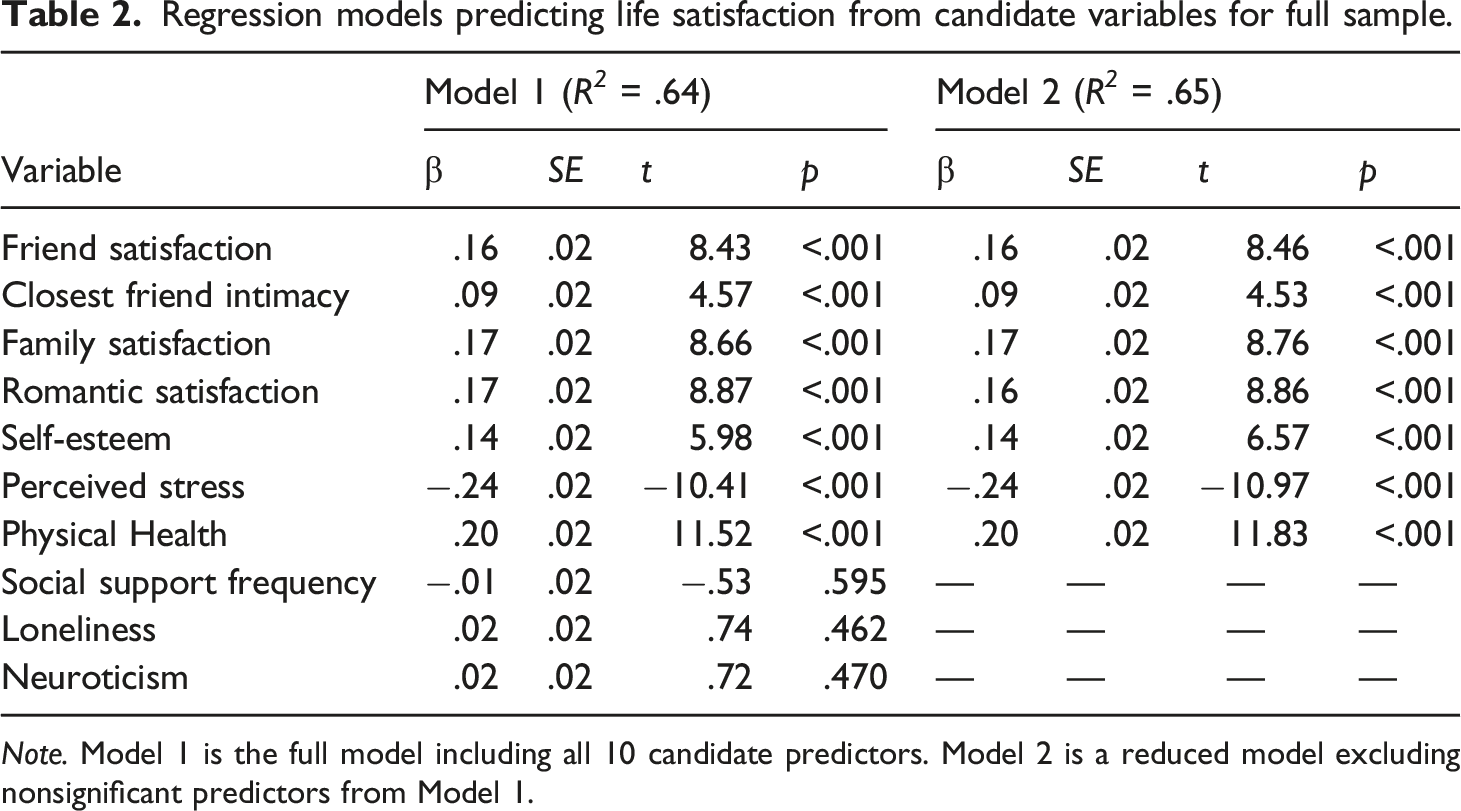
Note. Model 1 is the full model including all 10 candidate predictors. Model 2 is a reduced model excluding nonsignificant predictors from Model 1.
Measurement invariance
The purpose of creating profiles of coupled and single adults with the selected indicator variables was to differentiate them in terms of life satisfaction and make relevant comparisons. To ensure the relative comparability of cross-group comparisons, we tested for measurement invariance using item response theory differential item functioning (DIF) on the multi-item scales that both single and coupled adults completed (Rodriguez et al., 2023). These scales included: friendship satisfaction, closest friend intimacy, family satisfaction, self-esteem, and perceived stress. We did not test for measurement invariance on romantic satisfaction (because it only applied to coupled adults) or physical health (because it was a single item measure, and testing for DIF requires multiple items for anchoring purposes). For all items/scales tested, there was no evidence of DIF, as indicated by all McFadden’s R2 values <.02 (see Supplemental Materials Table S6). Thus, the DIF results suggested that item/scale invariant and derived scores could be compared between single and coupled adults.
Latent profile analyses
Latent profile solutions based on best predictors of life satisfaction by relationship status.
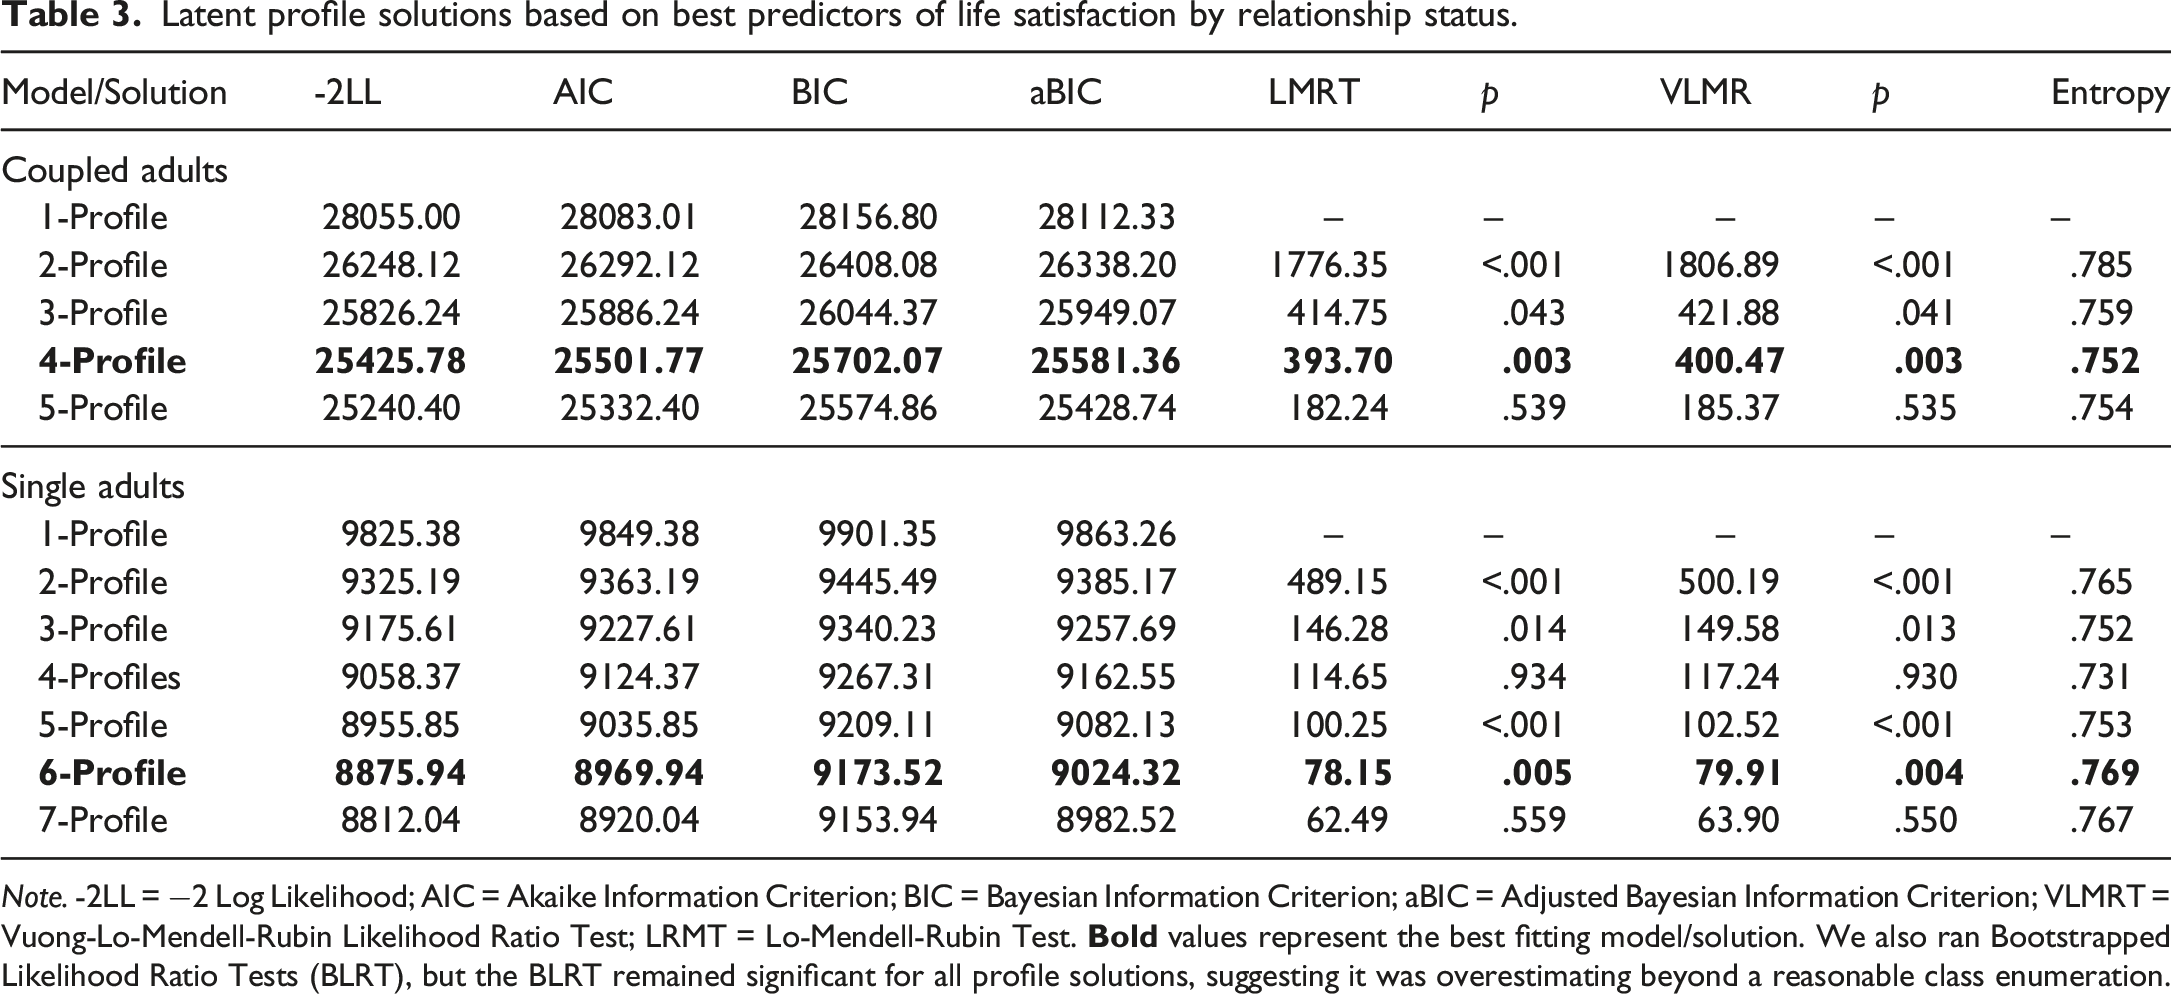
Note. -2LL = −2 Log Likelihood; AIC = Akaike Information Criterion; BIC = Bayesian Information Criterion; aBIC = Adjusted Bayesian Information Criterion; VLMRT = Vuong-Lo-Mendell-Rubin Likelihood Ratio Test; LRMT = Lo-Mendell-Rubin Test.
Standardized descriptive statistics by relationship status and profile.
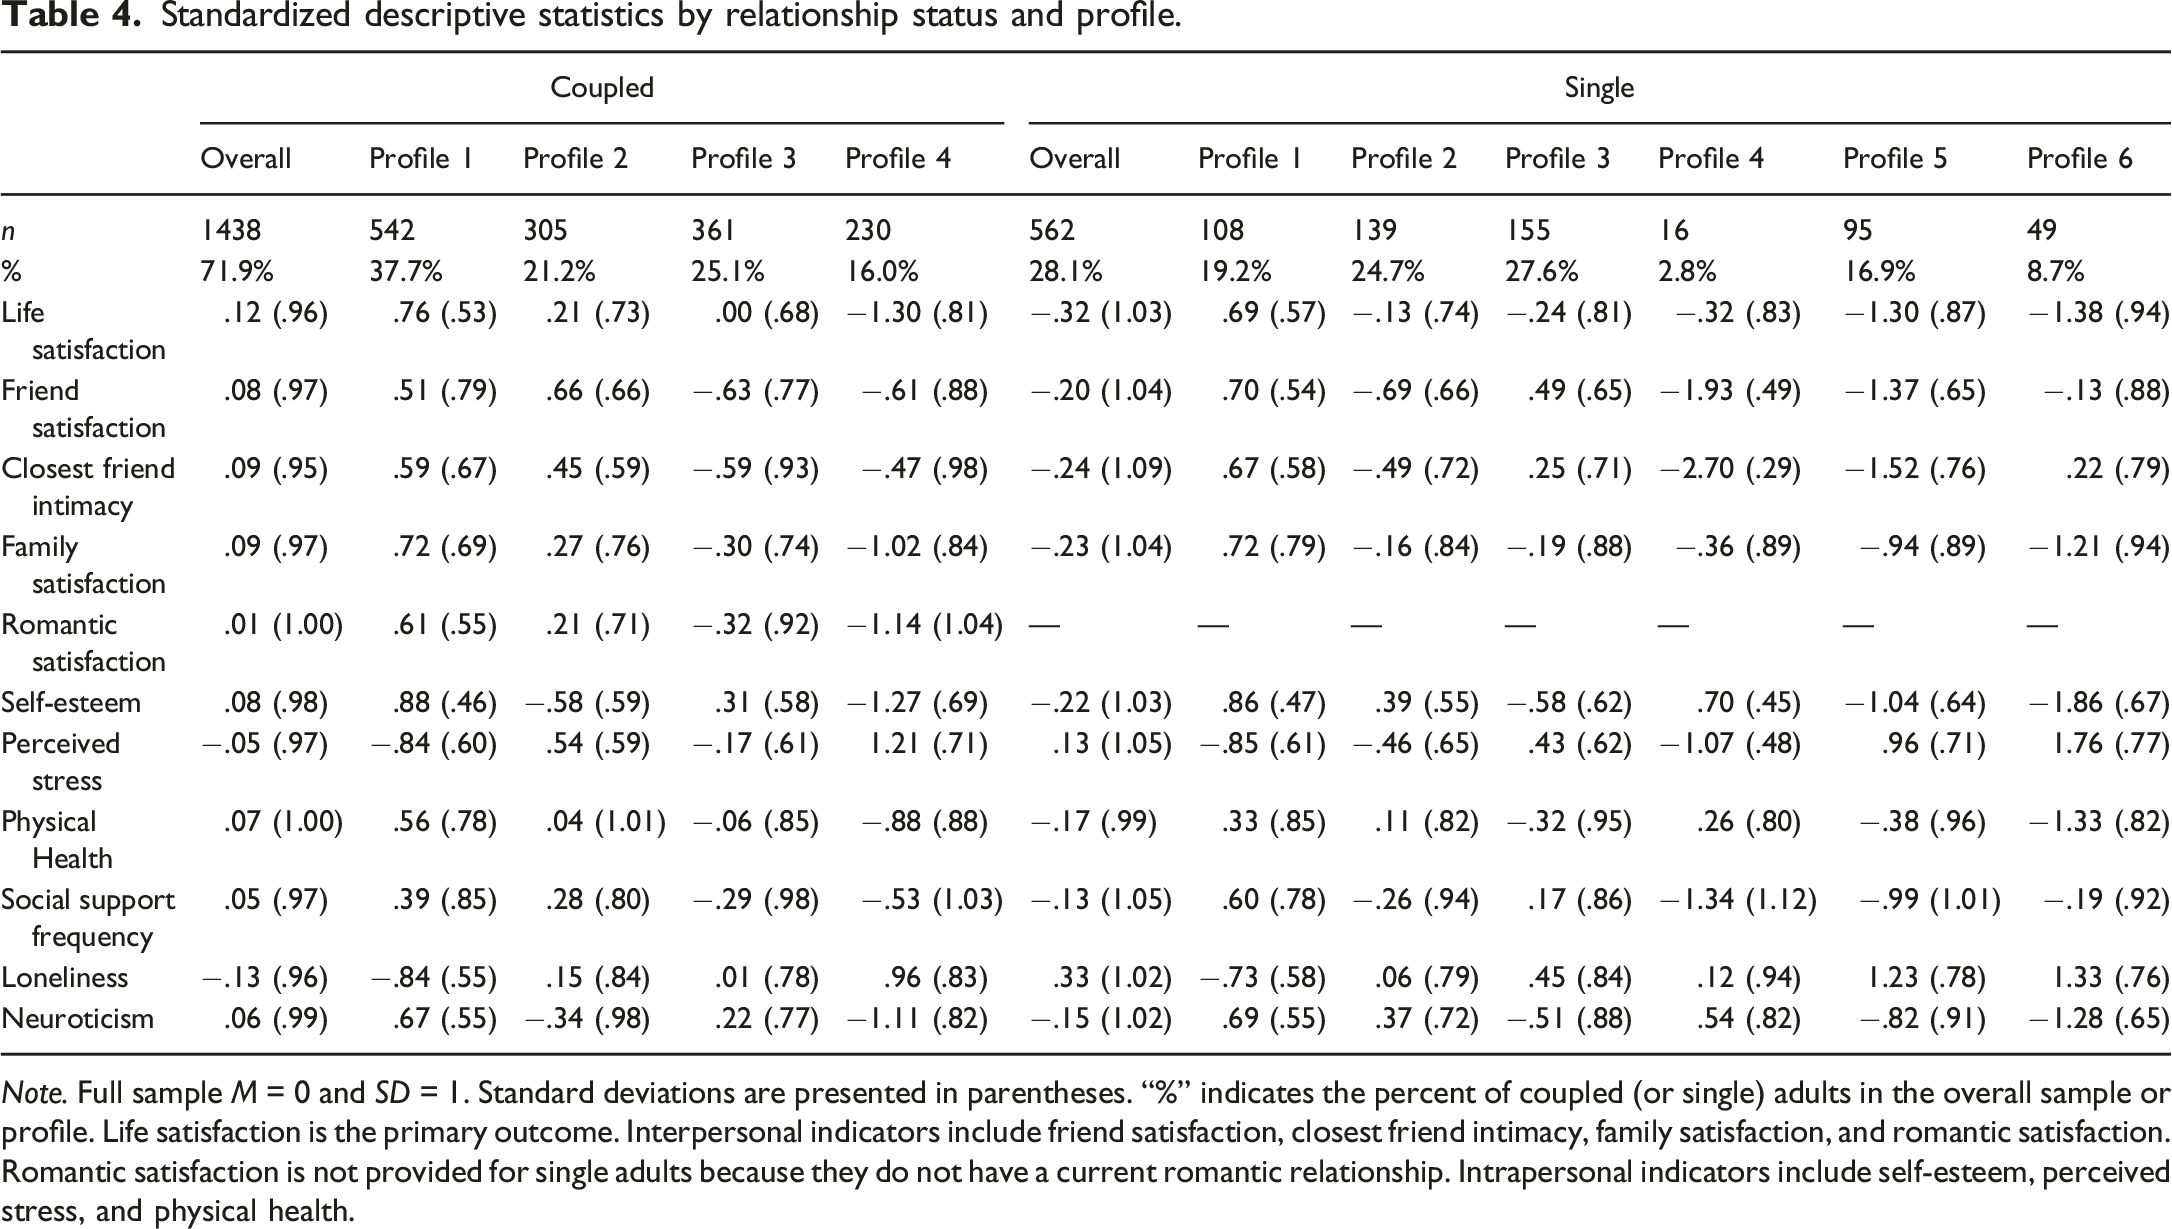
Note. Full sample M = 0 and SD = 1. Standard deviations are presented in parentheses. “%” indicates the percent of coupled (or single) adults in the overall sample or profile. Life satisfaction is the primary outcome. Interpersonal indicators include friend satisfaction, closest friend intimacy, family satisfaction, and romantic satisfaction. Romantic satisfaction is not provided for single adults because they do not have a current romantic relationship. Intrapersonal indicators include self-esteem, perceived stress, and physical health.
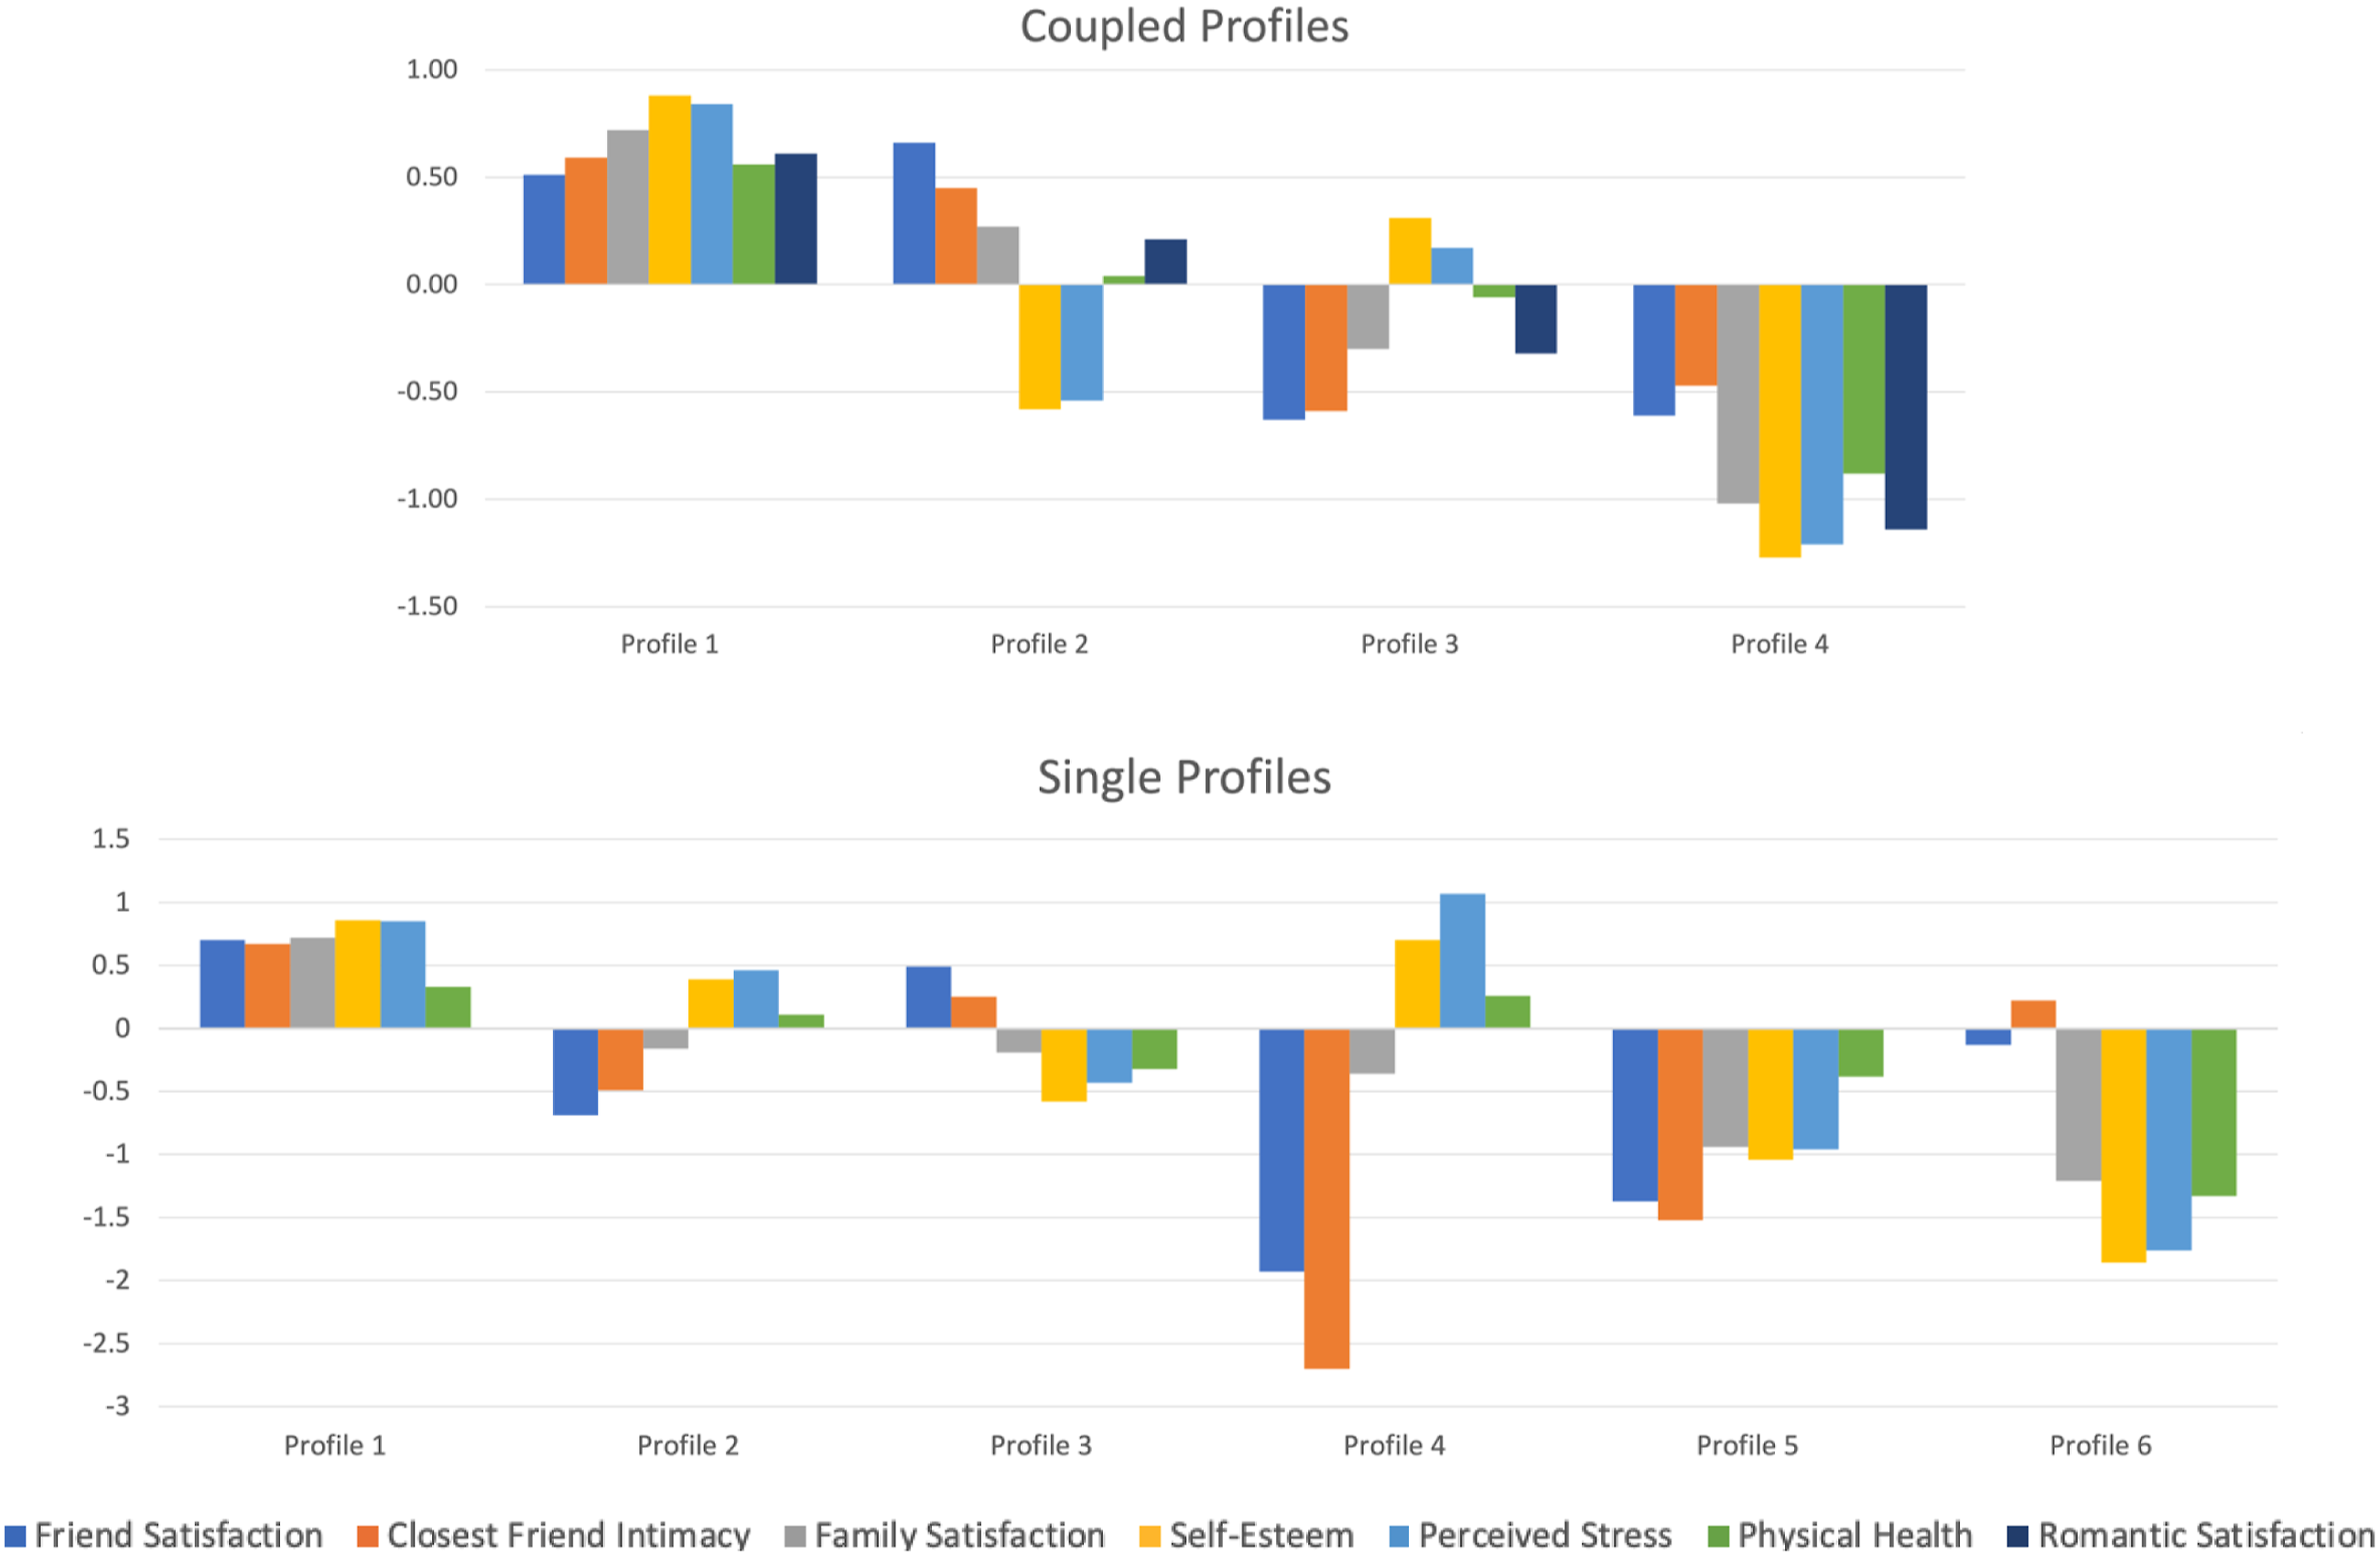
Predictor Patterns by Relationship Status and Profile. Note. Standardized means for predictor variables used in LPA by relationship status and profile. Interpersonal indicators include friend satisfaction, closest friend intimacy, family satisfaction, and romantic satisfaction. Romantic satisfaction is not provided for single adults because they do not have a current romantic relationship. Intrapersonal indicators include self-esteem, perceived stress, and physical health. For ease of interpretation, perceived stress is reversed so positive means indicate lower levels and negative means indicate higher levels.
Coupled profiles
Coupled profile 1: Favorable interpersonal and intrapersonal indicators
Descriptively, Coupled Profile 1 (n = 542; 37.7% of coupled adults) had favorable levels and patterns among all seven indicators. In terms of interpersonal relationships, coupled adults in this profile had high friend satisfaction (M = .51), high closest friend intimacy (M = .59), high family satisfaction (M = .72), and high romantic satisfaction (M = .61). In terms of intrapersonal attributes, this profile had very high self-esteem (M = .88), very low perceived stress (M = −.84), and high physical health (M = .56).
Coupled profile 2: Favorable interpersonal and mixed intrapersonal indicators
Coupled Profile 2 (n = 305; 21.2%) had relatively favorable interpersonal indicators and mixed intrapersonal indicators. Interpersonally, this profile had high friend satisfaction (M = .66), slightly high closest friend intimacy (M = .45), slightly high family satisfaction (M = .27), and slightly high romantic satisfaction (M = .21). Intrapersonally, this profile had low self-esteem (M = −.58), high perceived stress (M = .54), and average physical health (M = .04).
Coupled profile 3: Unfavorable interpersonal and favorable intrapersonal indicators
Coupled Profile 3 (n = 361; 25.1% of coupled adults) had unfavorable interpersonal relationships and favorable intrapersonal attributes. Interpersonally, this profile had low friend satisfaction (M = −.63), low closest friend intimacy (M = −.59), slightly low family satisfaction (M = −.30), and slightly low romantic satisfaction (M = −.32). Intrapersonally, this profile had slightly high self-esteem (M = .31), average perceived stress (M = −.17), and average physical health (M = −.06).
Coupled profile 4: Unfavorable interpersonal and intrapersonal indicators
In contrast to Coupled Profile 1, Coupled Profile 4 (n = 230; 16.0%) showed unfavorable patterns among all seven indicators. Interpersonally, this profile had low friend satisfaction (M = −.61), slightly low closest friend intimacy (M = −.47), very low family satisfaction (M = −1.02), and very low romantic satisfaction (M = −1.14). Intrapersonally, this profile had very low self-esteem (M = −1.27), very high perceived stress (M = 1.21), and very low physical health (M = −.88).
Single profiles
Single profile 1: Favorable interpersonal and intrapersonal indicators
Like Coupled Profile 1, Single Profile 1 (n = 108; 19.2% of single adults) had favorable levels and patterns among all the significant indicators, excluding romantic satisfaction because single people were not in romantic relationships. Interpersonally, adults in Single Profile 1 had high friend satisfaction (M = .70), high closest friend intimacy (M = .67), and high family satisfaction (M = .72). Intrapersonally, this profile had very high self-esteem (M = .86), very low perceived stress (M = −.85), and slightly high physical health (M = .33).
Single profile 2: Mixed interpersonal and favorable intrapersonal indicators
Single Profile 2 (n = 139; 24.7%) had mixed interpersonal relationships and favorable intrapersonal attributes. Interpersonally, this profile had low friend satisfaction (M = −.69) and closest friend intimacy (M = −.49), but average family satisfaction (M = −.16). Intrapersonally, this profile had slightly high self-esteem (M = .39), slightly low perceived stress (M = −.46), and average physical health (M = .11).
Single profile 3: Favorable interpersonal and unfavorable intrapersonal indicators
Single Profile 3 (n = 155; 27.6%) had favorable interpersonal relationships and unfavorable intrapersonal attributes. Interpersonally, this profile had slightly high friend satisfaction (M = .49), slightly high closest friend intimacy (M = .25), and average family satisfaction (M = −.19). However, they also had unfavorable intrapersonal attributes, including low self-esteem (M = −.58), slightly high perceived stress (M = .43), and slightly low physical health (M = −.32).
Single profile 4: Unfavorable interpersonal and favorable intrapersonal indicators
Notably, Single Profile 4 (n = 16; 2.8% of single adults) was the smallest group. They also had unfavorable interpersonal relationships and favorable intrapersonal attributes. Interpersonally, they had very low friendship satisfaction (M = −1.93), very low closest friend intimacy (M = −2.70), and slightly low family satisfaction (M = −.36). Intrapersonally, they had high self-esteem (M = .70), very low perceived stress (M = −1.07), and slightly high physical health (M = .26).
Single profile 5: Unfavorable interpersonal and intrapersonal indicators
Like Coupled Profile 4 and in contrast to Single Profile 1, Single Profile 5 (n = 95; 16.9%) showed unfavorable patterns among all relevant indicators. Interpersonally, single adults in this profile had very low friend satisfaction (M = −1.37), closest friend intimacy (M = −1.52), and family satisfaction (M = −.94). Intrapersonally, they had very low self-esteem (M = −1.04), very high perceived stress (M = .96), and slightly low physical health (M = −.38).
Single profile 6: Mixed interpersonal and unfavorable intrapersonal indicators
Finally, adults in Single Profile 6 (n = 49; 8.7%) had mixed interpersonal relationships and unfavorable intrapersonal attributes. Interpersonally, they had relatively average levels of friendship satisfaction (M = −.13) and slightly high closest friend intimacy (M = .22), but very low family satisfaction (M = −1.21). Intrapersonally, they had very low self-esteem (M = −1.86), very high perceived stress (M = 1.76), and very low physical health (M = −1.33).
How happy are coupled versus single profiles?
Comparable happiness of coupled and single adult profiles.
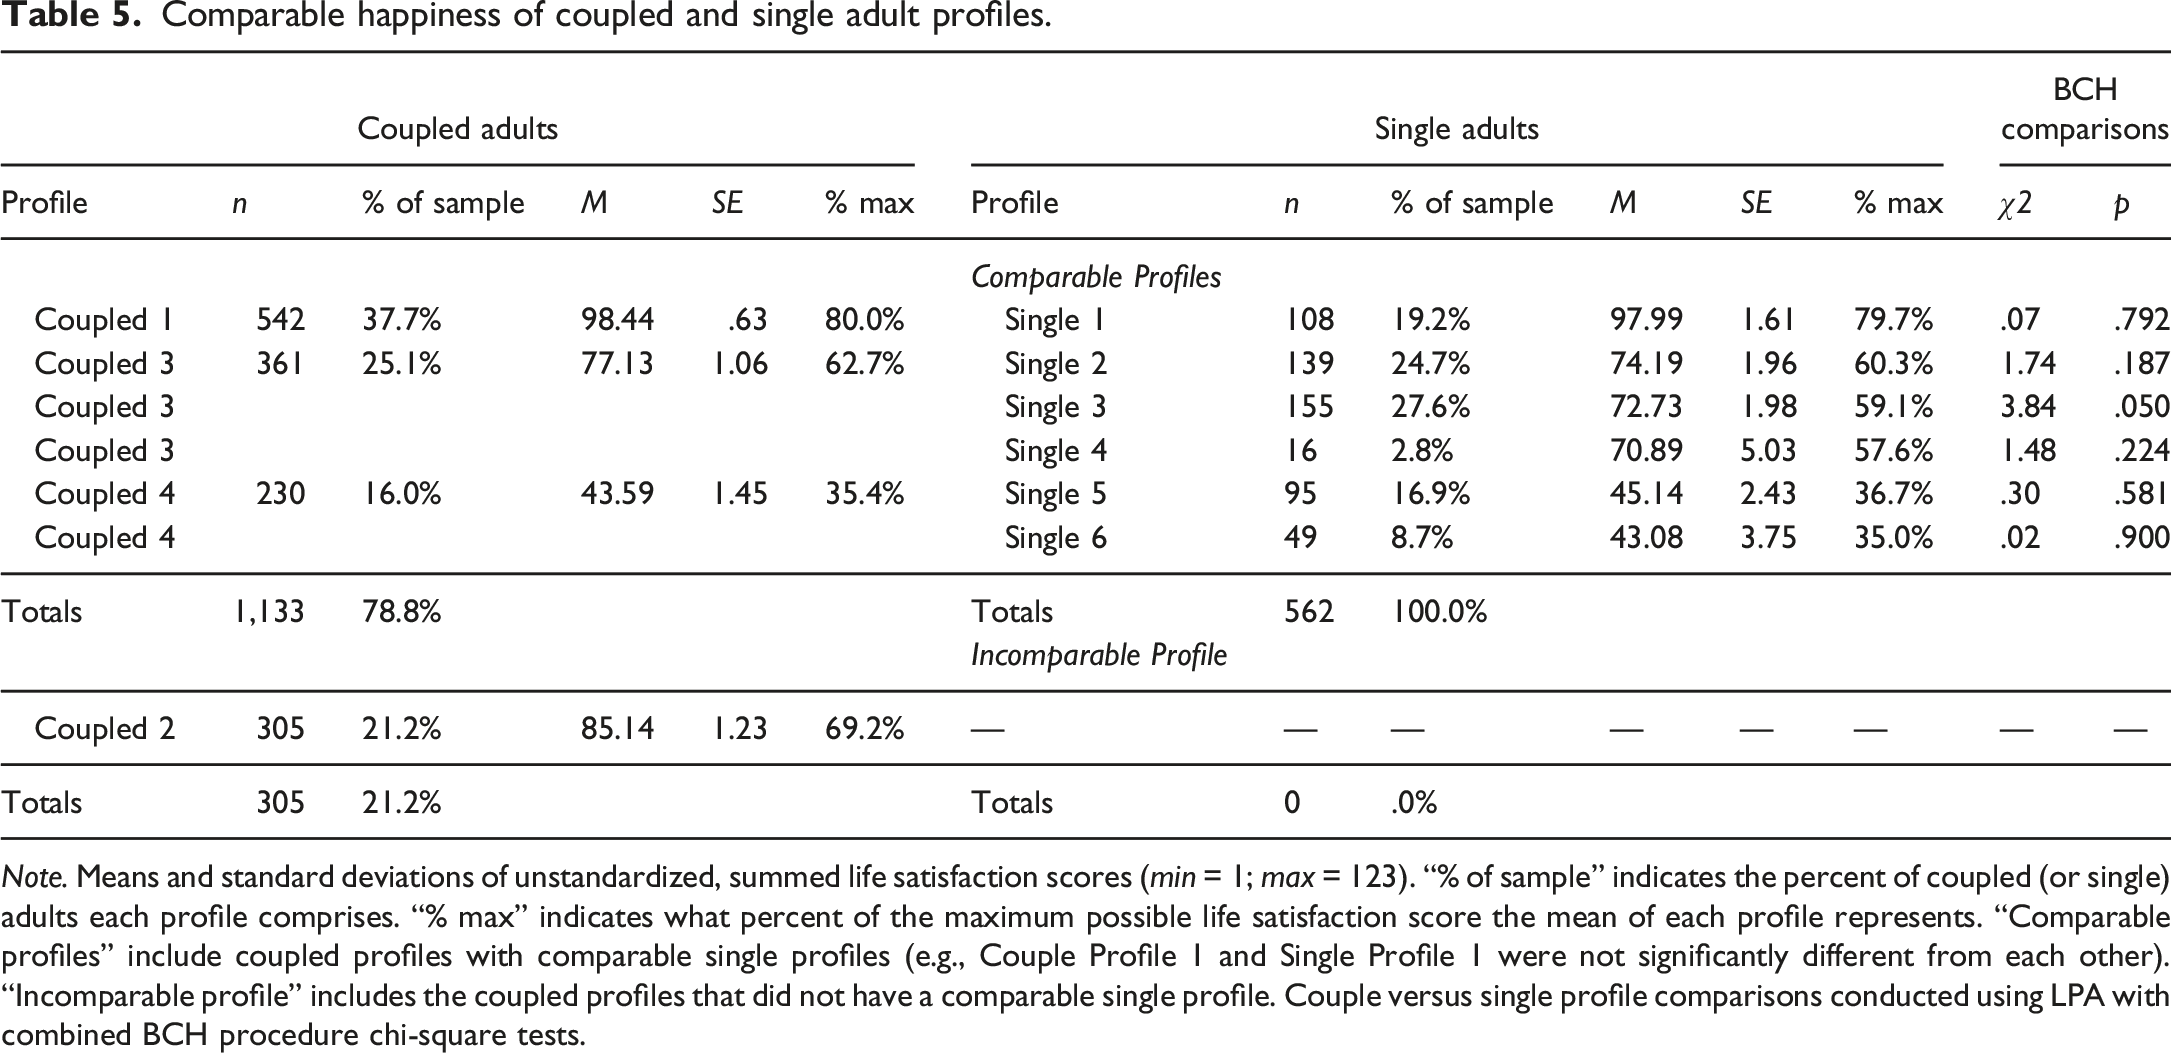
Note. Means and standard deviations of unstandardized, summed life satisfaction scores (min = 1; max = 123). “% of sample” indicates the percent of coupled (or single) adults each profile comprises. “% max” indicates what percent of the maximum possible life satisfaction score the mean of each profile represents. “Comparable profiles” include coupled profiles with comparable single profiles (e.g., Couple Profile 1 and Single Profile 1 were not significantly different from each other). “Incomparable profile” includes the coupled profiles that did not have a comparable single profile. Couple versus single profile comparisons conducted using LPA with combined BCH procedure chi-square tests.
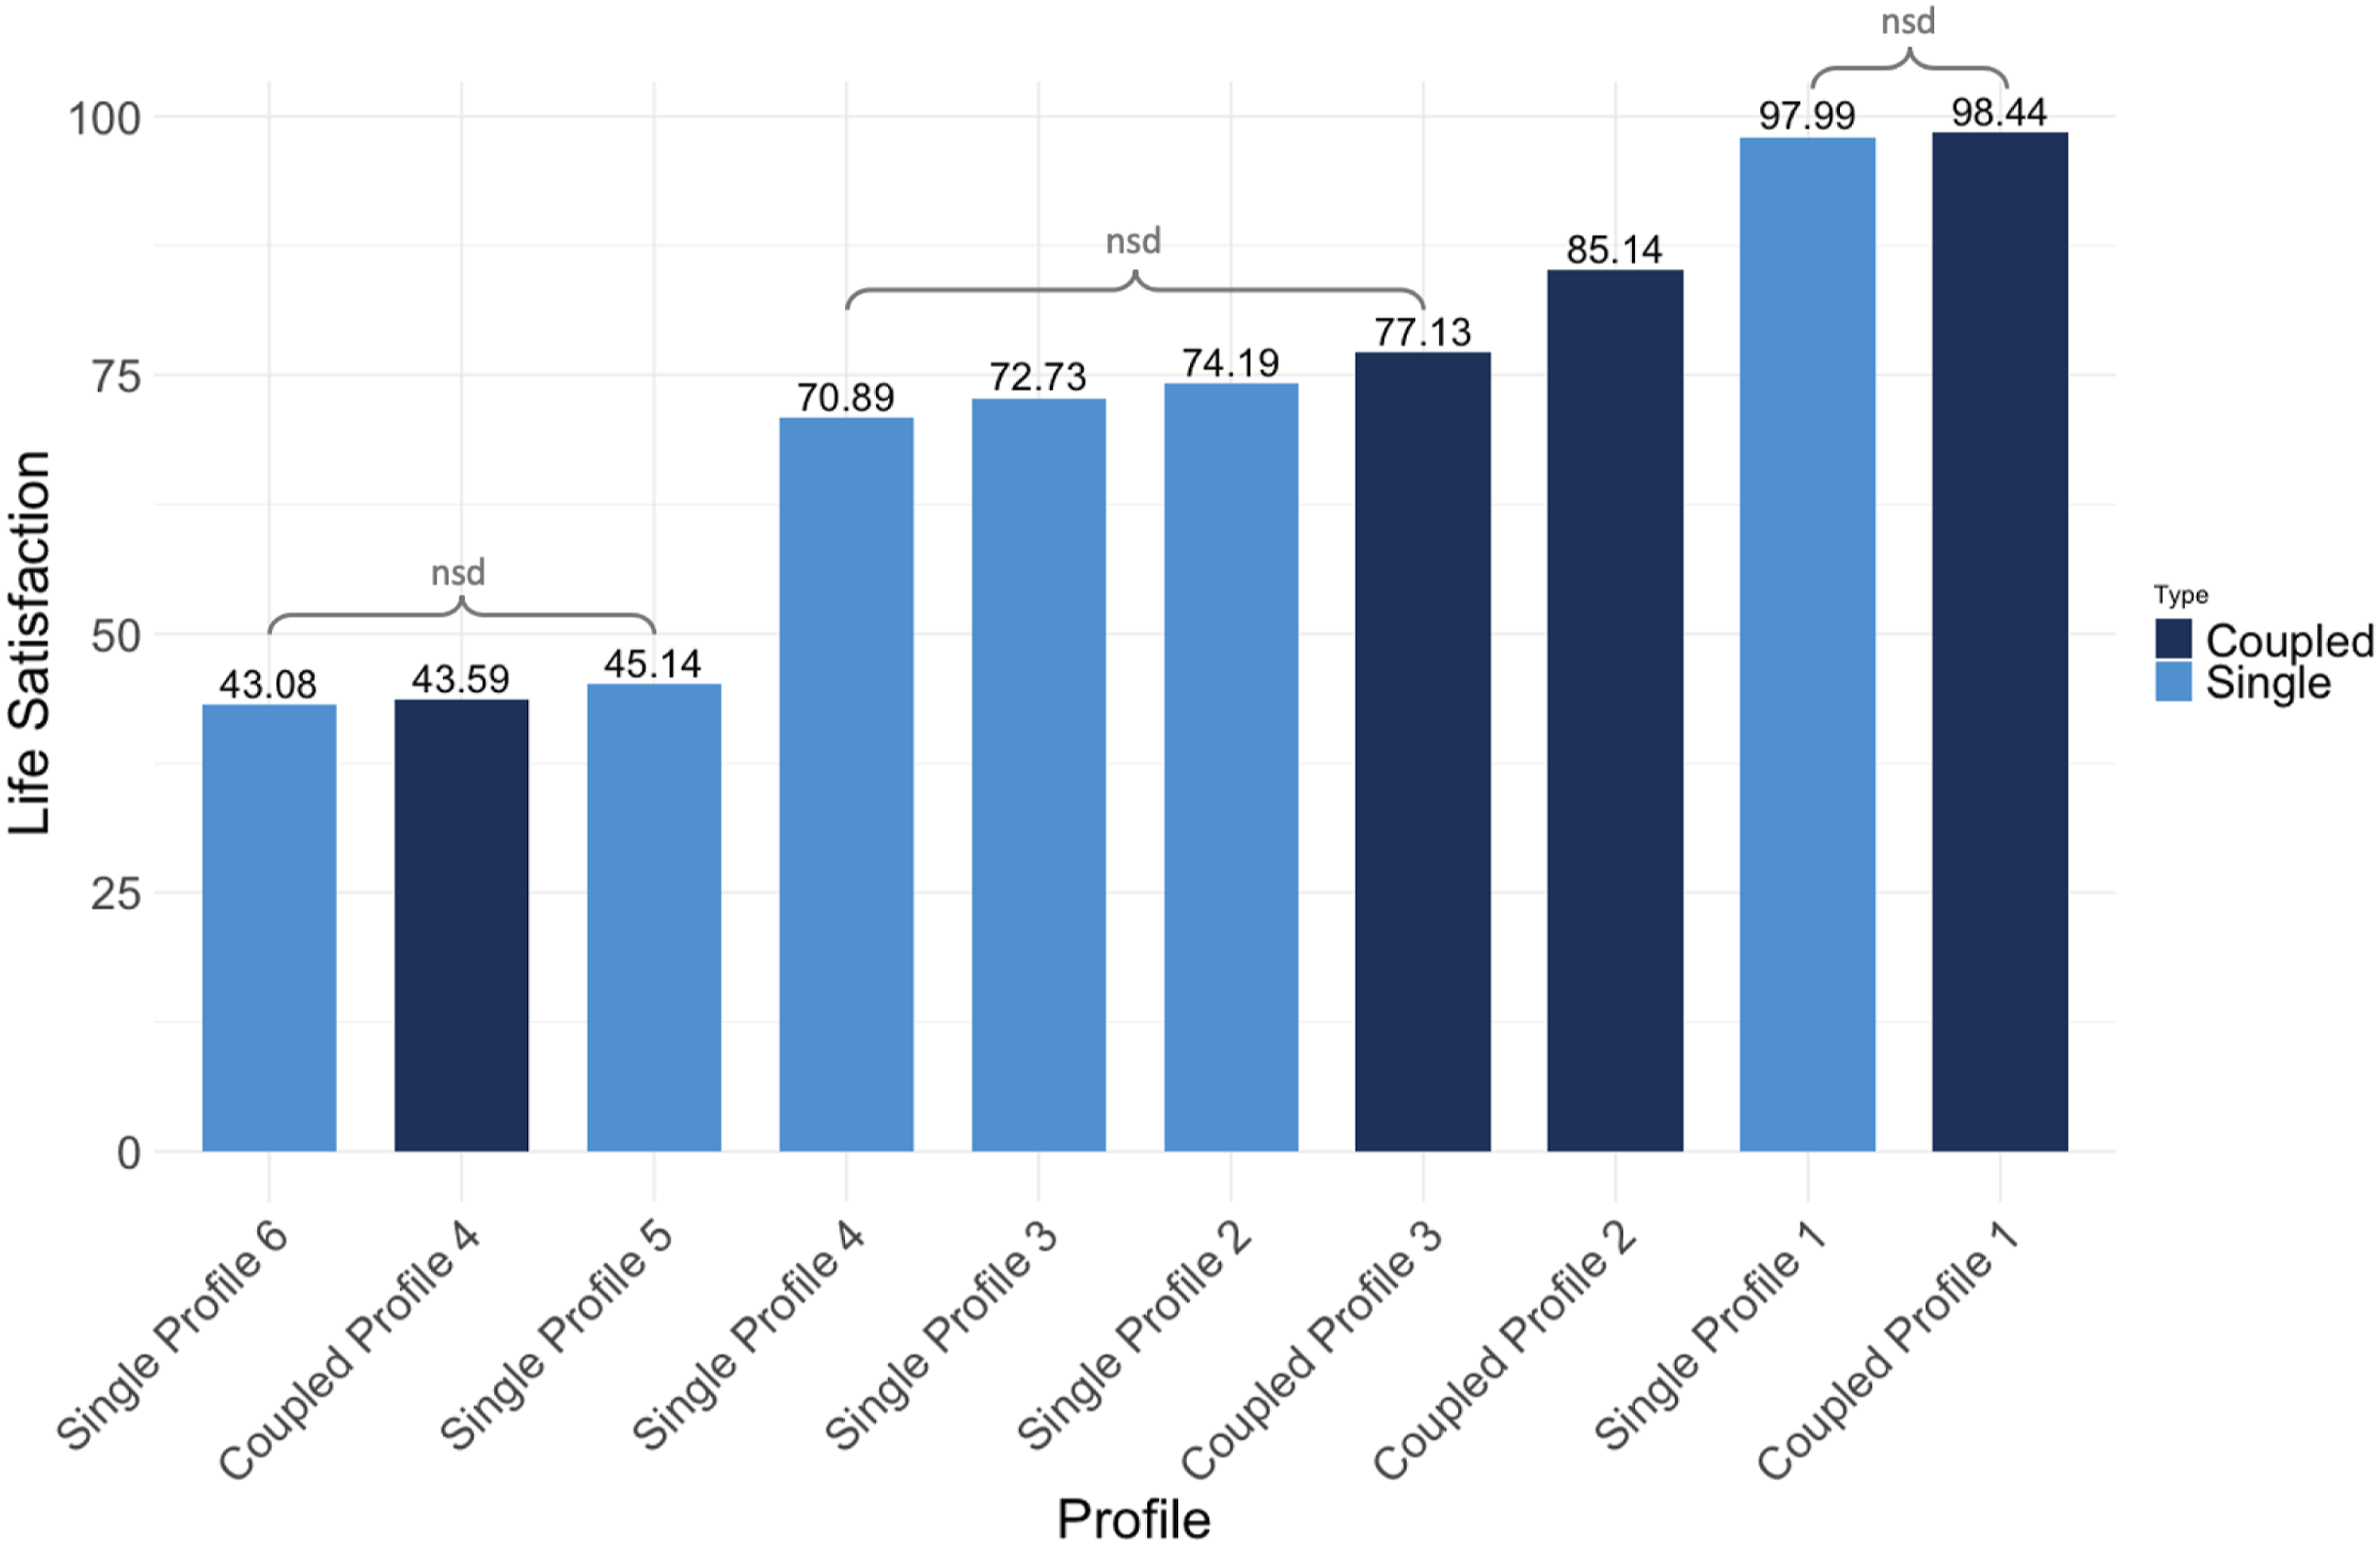
Unstandardized Life Satisfaction Means by Relationship Status and Profile. Note. “nsd” = nonsignificant difference.
It is also worth noting that the happiest profiles (Coupled Profile 1 and Single Profile 1) had very favorable levels of both interpersonal and intrapersonal indicators. Conversely, the least happy profiles (Single Profile 5, Coupled Profile 4, and Single Profile 6) had unfavorable (or in one case mixed) levels of the interpersonal and intrapersonal indicators. The profiles in the middle (with average life satisfaction) demonstrated varying levels of favorable, mixed, and unfavorable interpersonal and intrapersonal attributes.
Finally, we ran BCH comparison tests on the combined sample of couple and single adults to determine whether some coupled profiles and single profiles had similar levels of happiness (see Table 5 and Figure 2). We found six pairs of profiles that did not have significantly different levels of life satisfaction (i.e., they had similar levels of happiness): (1) Coupled Profile 1 was not significantly different from Single Profile 1 (χ2 = .07, p = .792); (2) Coupled Profile 3 was not significantly different from Single Profile 2 (χ2 = 1.74, p = .187); (3) Coupled Profile 3 was not significantly different from Single Profile 3 (χ2 = 3.84, p = .05); (4) Coupled Profile 3 was not significantly different from Single Profile 4 (χ2 = 1.48, p = .224); (5) Coupled Profile 4 was not significantly different from Single Profile 5 (χ2 = .30, p = .581); and (6) Coupled Profile 4 was not significantly different from Single Profile 6 (χ2 = .02, p = .90). Overall, 78.8% of coupled adults had profiles with happiness levels that corresponded to 100% of single adults, with life satisfaction scores that ranged from low to high. See Supplemental Materials Table S7 for all combined BCH tests, as well as Tables S8 and S9 for separate single and coupled profile BCH tests.
Discussion
A persistent happiness myth suggests that living “happily ever after” involves finding a romantic partner (Lyubomirsky, 2013), but this is probably not true for most people. How likely is it for single people to be as happy as their coupled peers? What factors indicate having a happier (or less happy) life for both coupled and single people? Using seven significant predictors that explain most of the variance in life satisfaction (friendship satisfaction, closest friend intimacy, family satisfaction, romantic satisfaction, self-esteem, perceived stress, and physical health) as indicators in LPA, we identified four distinct profiles (or groups) of coupled adults (Couple Profiles 1–4) and six distinct profiles of single adults (Single Profiles 1–6). We then labeled, described, and conceptualized each profile in terms of its interpersonal (friendship satisfaction, closest friend intimacy, family satisfaction, and romantic satisfaction) and intrapersonal (self-esteem, stress, and health) indicators.
Past research has categorized singles by their romantic history (never married vs. divorced; e.g., Kislev, 2018) or determinants (choice vs. circumstance; e.g., Slonim et al., 2015). Our study extends this work by conceptualizing and categorizing people in terms of their unique profiles of interpersonal relationships and intrapersonal attributes—ranging from favorable to unfavorable. Such an approach enabled us to map each profile pattern onto life satisfaction, which revealed that happiness and unhappiness looks rather similar for both single and coupled people.
Overall, people in the happiest profiles had favorable interpersonal relationships (e.g., high friend and family satisfaction) and intrapersonal attributes (e.g., high self-esteem, low stress), while those in the unhappiest profiles showed the reverse pattern — regardless of whether they had a romantic partner or not. This pattern was not uniform, however. For the people who fell in between the two extremes (i.e., they had average levels of happiness), we found nuanced patterns and tradeoffs. For example, Coupled Profile 3 had unfavorable interpersonal relationships (e.g., low friend satisfaction and slightly low family satisfaction), but was able to compensate for these detriments with favorable intrapersonal attributes (e.g., slightly high self-esteem and average health). Conversely, Single Profile 3 had unfavorable intrapersonal attributes (e.g., low self-esteem and slightly high stress), but favorable interpersonal relationships (e.g., slightly high friend satisfaction and average family satisfaction). Both of these profiles reported relatively average levels of life satisfaction. Thus, both single and coupled adults may compensate for disadvantages in one area with advantages in another.
Most importantly, in comparing single and coupled profiles directly, we found that single adults follow a range of life satisfaction patterns (from happy to unhappy) that is highly similar to most of their coupled peers. In other words, these adults occupy happiness profiles that are analogous and not significantly different in terms of happiness. Coupled Profile 1, which reported the highest levels of life satisfaction, was not significantly different from Single Profile 1. Coupled Profile 3, which reported relatively average levels of life satisfaction, was not significantly different from Single Profiles 2, 3, and 4. Coupled Profile 4 was not significantly different from Single Profiles 5 and 6, and these profiles were dissatisfied with their lives. There was only one coupled profile (Coupled Profile 2) with high, average happiness that did not have a cross-group single equivalent. These person-centered findings add nuance to previous variable-centered studies and provide evidence that many single individuals live full and happy lives comparable to their coupled peers.
Some readers may observe that our 6-profile solution for singles differs from the 10-profile solution found by Walsh et al., 2022 and the 3-profile solution found by Park et al., 2023. These variations likely stem from the fact that LPA results hinge on the particular indicator variables entered into the model (Ferguson et al., 2020). Compared to the Walsh et al., 2022 study, the present study used three common indicators (friendship satisfaction, family satisfaction, and self-esteem) and three unique indicators (closest friend intimacy, perceived stress, and physical health) for singles, which likely explains the difference in profile solutions. Here, we used indicators that accounted for a substantial proportion of the variance of life satisfaction, whereas Walsh et al., 2022 focused on a narrower subset of variables, with a particular emphasis on personal relationships and personality. Furthermore, variations in profile enumeration may also be due to it being easier to detect more profiles in larger samples because there is more statistical power to do so (Nylund et al., 2007). To illustrate, Walsh et al., 2022 identified 10 profiles in a sample of 4,835 singles, while the present study identified 5 profiles in sample of 562 singles.
Interestingly, despite the different number of profiles, our study partially replicated the patterns found in Walsh et al., 2022. In both studies, single adults in the happiest profiles scored high in friendship satisfaction, family satisfaction, and self-esteem. Meanwhile, those in the unhappiest profiles displayed opposite patterns. Also, both studies detected similar variations and trade-offs between the extreme endcap profiles — what Morin and Marsh (2015) refer to as “shape” and “level” differences.
As for Park et al., 2023, the researchers used an entirely different set of social motive indicator variables, which unsurprisingly led to a distinct profile solution. When conducting LPA, researchers pick indicator variables to serve a particular purpose, and different indicators often create different profile solutions (Ferguson, 2009; Spurk et al., 2020). In sum, the differences between the current study, Walsh et al. (2022), and Park et al. (2023) reflect the unique combinations of data, methods, and indicators employed in each study. Our study offers a novel contribution as, to the best of our knowledge, it is the first to explore and compare latent profiles of both single and coupled adults.
Overall, our findings support a simple conclusion that can be summarized succinctly: the range of joy for single and coupled adults is similar. Accordingly, singles should know that they have the potential to reach levels of happiness that are comparable to their coupled counterparts. Nonetheless, there are some differences between coupled and single profiles worth addressing. The proportions at the high end and low end of life satisfaction do differ by relationship status. Relative to singles, a larger proportion of coupled adults report high life satisfaction. Conversely, a larger proportion of single adults report low life satisfaction than their coupled peers. In other words, there are more couples who are happy, as well as more singles who are unhappy. Taken together, the evidence supports thinking about singledom and happiness in probabilistic terms. A coupled adult is more likely to be happy than a single adult, but singles still follow a surprisingly similar probabilistic pattern. Regardless, adults who make the choice to remain single still have a good chance at living a happy life.
Strengths, limitations, and future directions
Our study has a few notable strengths. First, we collected a high-powered and nationally representative sample. Large sample sizes tend to yield more accurate effect sizes (Funder & Ozer, 2019), and U.S. Census-matching increases generalizability to the larger American population. Second, we applied person-centered, group-differential analyses to examine the unique heterogeneity of both coupled and single adults. Specifically, our use of LPA highlights several nuances that traditional variable-centric methods typically overlook.
However, there are several limitations worth noting. First, our study was exploratory (not confirmatory). As such, our findings are merely a first step and need to be interpreted in this light. Future studies replicating and extending our results with preregistered hypotheses are necessary before drawing firm conclusions. Second, because we used a previously collected dataset, we were somewhat limited in terms of the predictor variables available. Different researchers may select different indicators of well-being (e.g., meaning in life, attachment style, desire for a romantic partner) in future studies that may provide additional meaningful information. Third, because we used single time point, cross-sectional data, we cannot infer the direction of causality among the variables examined. For example, it could be that higher friendship satisfaction causes increased life satisfaction, or vice versa. Fourth, because we collected data in the U.S., a “WEIRD” (Western, Educated, Industrialized, Rich, and Democratic) nation (Henrich et al., 2010), our results may not generalize to other countries. Future research exploring whether associations are influenced by culture-level variables such as individualism and/or collectivism would make for interesting future studies.
Finally, we combined never married, widowed, divorced, and separated individuals into one “singles” category for analysis. Additionally, some adults who reported being single (i.e., having no main romantic partner) also reported that they were married. Notably, the practice of aggregating different types of singles together for analysis has received some criticism, as people who tried marriage and did not enjoy it (e.g., separated and divorced people) may differ from those who never married at all (DePaulo, 2014; Kislev, 2018). Regardless, the present study shows that singles are capable of high levels of happiness, comparable to that of their coupled peers. Nevertheless, the question of how never married, widowed, divorced, and separated individuals are uniquely distributed, and what factors differentially influence their well-being, is a necessary next step in this line of research.
Conclusion
Everyone deserves a fair chance at happiness, and the present study shows that coupled and single adults can attain similarly high levels of life satisfaction. Indeed, it bears repeating that single adults in our study followed a range of life satisfaction patterns (from happy to unhappy) that was highly similar to most of their coupled peers. Further, people who had favorable interpersonal relationships and intrapersonal attributes tended to be the happiest—regardless of whether they had a romantic partner or not. Albeit people with disadvantages in some areas (e.g., low self-esteem) were able to compensate with advantages in others (e.g., high friendship) to live their own version of the good life. This knowledge may be useful to clinicians, as they probe the relative strengths and weaknesses of their patients’ interpersonal relationships and intrapersonal attributes to target areas for improvement. Customizing treatments to the type of person being treated (single vs. coupled, high vs. low friendship satisfaction) may be efficacious. Overall, the present study provides evidence that undermines the happiness myth that single adults need a romantic partner to live “happily ever after.” Given the growing population of singles, researchers and clinicians would do well to meet them where they are and explore how to maximize their well-being regardless of their relationship status.
Supplemental Material
Supplemental Material - Happily ever after for coupled and single adults: A comparative study using latent profile analysis
Supplemental Material for Happily ever after for coupled and single adults: A comparative study using latent profile analysis by Lisa C. Walsh, Calen Horton, Anthony Rodriguez and Victor A. Kaufman in Journal of Social and Personal Relationships.
Footnotes
Acknowledgements
We would like to acknowledge the UCLA Marriage and Close Relationships Lab for funding this work.
Author contribution
The authors confirm contribution to the paper as follows: study conceptualization and design: V.A.K. and A.R.; data collection: V.A.K.; analysis: V.A.K., A.R., and L.C.W.; writing and revising: C.H., V.A.K and L.C.W. All authors reviewed the results and approved the final version of the manuscript.
Declaration of conflicting interests
The author(s) declared no potential conflicts of interest with respect to the research, authorship, and/or publication of this article.
Funding
The author(s) disclosed receipt of the following financial support for the research, authorship, and/or publication of this article: This study is supported by UCLA Marriage and Close Relationships Lab for funding this work.
Open research statement
As part of IARR’s encouragement of open research practices, the authors have provided the following information: This research was not pre-registered. The data and materials used in the research are not available but can be obtained by emailing
Supplemental Material
Supplemental material for this article is available online.
References
Supplementary Material
Please find the following supplemental material available below.
For Open Access articles published under a Creative Commons License, all supplemental material carries the same license as the article it is associated with.
For non-Open Access articles published, all supplemental material carries a non-exclusive license, and permission requests for re-use of supplemental material or any part of supplemental material shall be sent directly to the copyright owner as specified in the copyright notice associated with the article.