
Abstract
Sexual satisfaction has been robustly associated with relationship and individual well-being. Previous studies have found several individual (e.g., gender, self-esteem, and attachment) and relational (e.g., relationship satisfaction, relationship length, and sexual desire) factors that predict sexual satisfaction. The aim of the present study was to identify which variables are the strongest, and the least strong, predictors of sexual satisfaction using modern machine learning. Previous research has relied primarily on traditional statistical models which are limited in their ability to estimate a large number of predictors, non-linear associations, and complex interactions. Through a machine learning algorithm, random forest (a potentially more flexible extension of decision trees), we predicted sexual satisfaction across two samples (total N = 1846; includes 754 individuals forming 377 couples). We also used a game theoretic interpretation technique, Shapley values, which allowed us to estimate the size and direction of the effect of each predictor variable on the model outcome. Findings showed that sexual satisfaction is highly predictable (48–62% of variance explained) with relationship variables (relationship satisfaction, importance of sex in relationship, romantic love, and dyadic desire) explaining the most variance in sexual satisfaction. The study highlighted important factors to focus on in future research and interventions.
Sexual satisfaction (i.e., “an affective response arising from one’s subjective evaluation of the positive and negative dimensions associated with one’s sexual relationship”; Lawrance & Byers, 1995, p. 268) is considered for relationships and is closely associated with relationship satisfaction (Joel et al., 2020; McNulty et al., 2016; L. M. Vowels & Mark, 2020b) and stability (Sprecher, 2002; Yeh et al., 2006) as well as individual well-being (Davison et al., 2009; Del Mar Sánchez-Fuentes et al., 2014). While many variables have been investigated as potential predictors of sexual satisfaction (for a review see Del Mar Sánchez-Fuentes et al., 2014), previous research has not compared the different predictors to understand which variables are the most, or least, likely to contribute to sexual satisfaction. Comparing the relative importance of different factors is important to understand which predictors are the most likely to change the outcome and thus the most useful for potential interventions. Therefore, the aim of the present study is to add to the literature by comparing a large number of potential factors on how well they each predict sexual satisfaction.
The biopsychosocial model suggests that there are biological, psychological, and sociocultural factors that affect individual’s functioning. Determinants of sexual satisfaction can also be examined from this perspective. However, because sometimes it is difficult to clearly categorize variables into these three categories (e.g., to what extent is one’s gender a biological factor and to what extent is it a social one), we have focused on describing the previous literature in terms of individual and relational factors. This division is in line with other previous research examining relationship processes using machine learning (Joel et al., 2020).
Individual factors
Results for demographic variables such as gender, age, race, socioeconomic status, and education generally show mixed findings with some studies finding one group has a higher satisfaction than another group with other studies either finding no significant difference or a difference in the opposite direction (Del Mar Sánchez-Fuentes et al., 2014). For example, several studies have found no significant difference between men and women in their level of sexual satisfaction (Mark et al., 2018; McClelland, 2011) whereas others found that men were consistently higher in sexual satisfaction compared to women (Laumann et al., 2006). Many other individual factors such as mental and physical health (Laumann et al., 2006), contraception (Toorzani et al., 2010), attachment (Mark et al., 2018), self-esteem (Higgins et al., 2011), body image (Zhaoyang & Cooper, 2013), trait mindfulness (Leavitt et al., 2019), and sexual trauma (Berlo & Ensink, 2017) have also been associated with sexual satisfaction.
Relational factors
Relational variables also play a role in sexual satisfaction. People in romantic relationships are generally more satisfied sexually than single people (Higgins et al., 2011; Schmiedeberg & Schröder, 2016); in long-term relationships, partners are more likely to know each other’s likes and dislikes making it easier to satisfy one’s partner, and especially women are less likely to orgasm in casual encounters compared to established relationships (Armstrong et al., 2012). Furthermore, relationship and sexual satisfaction are closely linked with the association generally thought to be bidirectional in nature (Byers, 2005; McNulty et al., 2016; L. M. Vowels & Mark, 2020b). Love, commitment, intimacy, and relationship stability have all also been associated with greater sexual satisfaction (Sprecher, 2002; L. M. Vowels & Mark, 2020a). Therefore, we would expect relational variables such as relationship satisfaction, dyadic sexual desire, and love to be important for sexual satisfaction.
In romantic relationships, individuals’ sexual satisfaction can be associated with both their own as well as their partners’ variables. For example, if one partner has issues with sexual functioning, this is likely to be associated with both the individual’s own sexual satisfaction as well as that of their partner’s. In fact, a recent study showed that women’s low desire and difficulty having an orgasm and men’s erectile dysfunction predicted lower sexual satisfaction for both partners (Pascoal et al., 2018). Therefore, in addition to examining how self-reported individual and relational variables predict one’s own sexual satisfaction (actor effects), we also examine whether these variables predict one’s partner’s sexual satisfaction (partner effects). Previous research has shown that partner variables tend to explain less variance and be less important for relationship satisfaction and commitment (Joel et al., 2020) and sexual desire (L. M. Vowels et al., 2021) but these have not been systematically examined for sexual satisfaction. Sexual behaviors in relationships are also likely to predict both partners’ sexual satisfaction. For example, one member of the dyad may really enjoy oral sex but if their partner does not wish to engage in the sexual act this can predict both partners’ sexual satisfaction regardless of whether oral sex occurs or not. Therefore, in addition to examining individuals’ own variables, we also included data from a sample of couples where we examined both actor and partner effects.
Using machine learning to predict sexual satisfaction
Traditional linear regression models are ill-equipped to examine many predictors simultaneously as they suffer from issues of multicollinearity, cancellation, and suppression effects (Breiman, 2001a; Lundberg et al., 2020). They are highly sensitive to the choice of control variables and thus often do not provide meaningful estimates of the effect of predictor variables on the outcome essentially leaving the models uninterpretable (Breiman, 2001a; Lundberg et al., 2020; Yarkoni & Westfall, 2017). Furthermore, linear models rely on parametric assumptions and often assume that there is a linear (or pre-specified non-linear) relationship between the predictors and the outcome. This is problematic because complex real-world phenomena may vary according to both unknown and arbitrary functional relationships (van der Laan & Rose, 2011; van der Laan & Starmans, 2014; M. J. Vowels, 2020).
Because of the problems with traditional methods, a move toward more predictive modeling with machine learning has been advocated by Yarkoni and Westfall (2017). A few studies in relationship science to date have used machine learning to predict relationship outcomes from self-report variables (Großmann et al., 2019; Joel et al., 2017; 2020; L. M. Vowels et al., 2021). Most notably, Joel et al. (2020) used a random forest algorithm (i.e., a form of decision tree that can estimate a large number of predictors simultaneously and can handle highly non-linear relationships and complex interactions without overfitting to the data) to analyze data across 43 dyadic samples of over 11,000 couples to examine individual and relational predictors of relationship satisfaction and commitment. However, the study was only able to establish which factors contributed “meaningfully” to the outcome and in how many samples. This does not necessarily mean that all the variables that contributed meaningfully to the outcome are equally important. For example, if two variables were both classified as meaningful in 90% of the samples but one variable explained 30% of the variance and another only 5%, the study would have classified them as equally robust, but this does not help us understand the relative predictive power of each, which is the focus of the present study.
There has been a great deal of development recently on making machine learning algorithms explainable (Lundberg et al., 2017, 2019). This work is particularly interesting because it allows social scientists to combine the use of powerful machine learning algorithms and state-of-the-art model explainability 1 tools that can provide accurate predictions, an understanding of which factors the model uses to predict the outcome, and the size and direction of the effect. Given social scientists are usually interested in explaining and understanding phenomena, the latter is of particular importance. In the present study, we took advantage of this new development in machine learning by using Shapley values (Lundberg et al., 2017, 2019, 2020) to interrogate the results from the random forest algorithm. The Shapley value approach involves systematically evaluating changes in model performance in response to including or excluding the influence from different combinations of predictors. It provides an estimate of the effect size, direction of the effect, and evaluates any interactions in the predictor variables.
The current research
Except for Laumann et al. (2006), previous research has focused only on examining a small number of predictors rather than comparing different factors. Laumann et al. (2006) examined several correlates (demographic variables, physical and psychological health, sexual functioning, relationship characteristics, sexual behaviors, and sexual attitudes) of sexual satisfaction and provides a comprehensive overview of sexual well-being across many countries and participants. However, because of the issues with traditional linear models discussed above, the results of the study are difficult to interpret, a comparison of the relative importance between variables is not possible, and the model is limited to estimating only linear effects. However, it is possible that the association between some (or all) of the variables and sexual satisfaction is non-linear and thus might appear non-significant despite a high non-linear correlation.
Therefore, to address these gaps in the literature, the primary aims of the present study were to determine (a) how much variance in sexual satisfaction can we explain, (b) which variables contribute the most, and least, amount of variance in sexual satisfaction, (c) whether these variables differ for men and for women, and (d) whether partner variables explain additional variance beyond actor effects. We used a random forest algorithm with Shapley values to evaluate individual and relational predictors of sexual satisfaction across two samples (one individual and one dyadic sample).
Method
Sample 1
Participants and procedure
The data were collected as part of a larger cross-sectional study. Participants were recruited through mTurk and were asked to complete an online survey and paid 30 cents for the task. Recruitment was also conducted through social networking sites (e.g., Facebook, Twitter), email list servs, and targeted recruitment for sexual minority participants on online forums. Participants recruited from these mediums were entered into a draw to win one of four US$40 Amazon gift cards. Participants were eligible for the study if they were over 18 years of age and had experience with at least one romantic relationship. Ethical approval was obtained from the University of Kentucky institutional review board and all participants received a written informed consent at the start of the baseline survey.
A total of 1097 participants consented to participate (See supplemental Table 1 for full demographics). Participants who had not completed the study (n = 198) or were missing the outcome variable (n = 8) were removed from the analyses and any remaining missing data were imputed 2 . The final sample consisted of 891 participants: 557 (62.5%) cis-gender women, 279 (31.3%) cis-gender men, and 25 (2.8%) genderqueer. Around half of the participants were straight (n = 483; 53.9%), 189 (21.2%) identified as bisexual, 101 (11.3%) gay, and 60 (6.7%) lesbian. Majority of the participants were white (88.4%), married or cohabiting (62.7%), had no children (75.5%), had at least some level of college (95.8%), and did not identify with any religion (54.5%). The average age of the participants was 32.70 years (SD = 9.63) and the average relationship length for those who were in a relationship was 6.21 (SD = 7.12).
Measures
Because the variables included in the study were selected for their relevance to sexual satisfaction, we included all measures as predictor variables that were collected in the study, a total of 93 variables included recoded categorical variables into dummy variables. The full list of the variables can be found in the codebook on the OSF project page. These included demographic questions on age, race/ethnicity, gender, partner’s gender, sexual orientation, relationship status, children, country, religion, and education. Participants also completed questions around their contraceptive use (their or their partner’s), sexual behaviors (e.g., masturbation, oral sex, intercourse participants had engaged in either in the past week or ever in the current or most recent relationship), desire discrepancy, sex regularly (at least once a week), communicate regularly about sex (at least once a week), whether they wanted sex or communication more or less than they were currently engaging in, and mental and physical health (“Would you say in general your mental/physical health is,” scored from 1 = excellent to 5 = poor). The following constructs were assessed using previously validated questionnaires:
Sexual satisfaction was assessed using the General Measure of Sexual Satisfaction Scale (GMSEX; α = .95; Lawrance & Byers, 1992). The GMSEX is a 5-item measure used to assess satisfaction with the sexual relationship. Relationship satisfaction was assessed using the General Measure of Relationship Satisfaction (GMREL; α = .97; Lawrance & Byers, 1992). Both GMREL and GMSEX are scored on a 7-point semantic differential scale and higher scores are indicative of greater sexual satisfaction. Sexual desire was assessed using the Sexual Desire Inventory (SDI; Spector et al., 1996). The scale was used as both a single scale (13 items) as well as divided into dyadic (nine items; α = .77) and solitary desire (four items; α = .91) and assesses an individual’s interest sexual activity over the past month with higher scores being indicative of higher sexual desire. Sexual desire was also assessed using the Halbert Index for Sexual Desire (HISD; α = .95; Yousefi et al., 2014) which measures sexual desire using 25 items with higher scores being indicative of higher sexual desire. Dispositional mindfulness was measured using the Five Facet Mindfulness Questionnaire—Short form (FFMQ-SF; Bohlmeijer et al., 2011). The scale comprises of a total of 24 items that are divided into five subscales: being non-reactive (α = .80), observant (α = .74), acting with awareness (α = .85), describing feelings (α = .86), and non-judgmental attitude (α = .83). The items are scored on a 5-point Likert scale with higher scores indicating participants’ agreement with the statement. Attitudes Toward Sexuality Scale (ATSS; α = .84; Fisher & Hall, 1988) was used to assess participants’ attitudes toward sexuality. The scale comprises of 13 items that are measured on a 5-point Likert scale with higher scores indicating the participant is more liberal, lower more conservative. The Perception of Love and Sex Scale (PLSS; Hendrick & Hendrick, 2002) measures one’s perception of love and sex comprising of four subscales: love is most important (six items; α = .76), sex demonstrates love (four items; α = .79), love comes before sex (four items; α = .81), and sex is declining (three items; α = .67). The items are measured on a 5-point Likert scale with higher scores indicating lower agreement. Attachment style was assessed using the Experience in Close Relationships Scale–Short form (ECR-S; Wei et al., 2007). The ECR-S consists of two 6-item Likert scales: one for anxiety (α = .75) and one for avoidance (α = .80). Higher scores indicate higher levels of insecure attachment.
Sample 2
Participants and procedure
The second sample used a combined dataset across two studies on mixed-sex couples. The couples for both studies were recruited through various list servs, websites, and social media (e.g., Facebook, Twitter). Participants who were 18 years of age or older, in a mixed-sex relationship for a minimum of 3 years, currently living with that partner, with no children under the age of one, and not pregnant at the time, met the inclusion criteria and were directed to provide their partner’s email address. For the second dataset, one member of the couple had to also be bisexual to be eligible due to a broader aim of that study to examine the dynamics of bierasure in mixed-sex relationships. The respondent first completed the online survey in which they provided an email address for their partner who was then contacted to complete the survey. Ethical approval was obtained from the University of Kentucky institutional review board and all participants received a written informed consent at the start of the baseline survey.
Participants who had not completed the study (n = 14) 3 or were missing the outcome variable (n = 6) were removed from the analyses. The final sample consisted of 955 participants (377 intact mixed-sex couples and 201 individuals 4 ); 538 (56.3%) cis-gender women, 405 (42.4%) cis-gender men, and 12 (1.3%) genderqueer (See in supplemental Table 1 for full demographics). The participants were either straight (n = 534; 55.9%) or bisexual (n = 397; 41.3%). Majority of the participants were white (87.4%), married (60.4%), had at least some level of college (90.8%), and did not identify with any religion (51.9%). The average age of the participants was 30.50 years (SD = 8.01) and the average relationship length was 7.41 years (SD = 6.22).
Measures
Sample 2 had a total of 69 variables. The full list of the variables including the dummy coding of the categorical variables can be found in the codebook on the OSF project page. Most of the variables were the same in Sample 2 as in Sample 1. The following questionnaires were not available in the sample: attachment styles (ECR-S), attitudes toward sexuality (ATSS), trait mindfulness (FFQM-SF), and perception of love and sex (PLSS). The study had an additional scale measuring romantic love, the Romantic Love Scale (α = .89; Rubin, 1970). The scale consists of 13 items that are meant to measure affiliative and dependent need, a predisposition to help, and orientation of exclusiveness and absorption. The scale is scored on a 9-point scale with higher scores indicating higher romantic love. For dyadic analyses, both dyad members’ scores were included as predictors.
Data analysis
Data preparation
All categorical variables were dummy coded (0 and 1) with each option included in the models (e.g., ethnicity was coded into “Asian,” “black,” “white,” and “multiracial”). Less than 0.1% of the data were missing, and any missing data points were imputed using the scikit-learn package Iterative Imputer (Pedregosa et al., 2011) with a Bayesian ridge estimator.
Analyses
The data from individuals and dyads (in which both members of the couple had responded to the questionnaire) were analyzed for all participants, just men, and just women 5 . We ran the dyadic models with actor effects only, partner effects only, and both actor and partner effects to determine where the source of the variance was coming from. The code for the analysis was written in Python 3.7 and can be found on the OSF project page: https://osf.io/ehzkm/. We analyzed each dataset using a random forest regressor (Breiman, 2001b). A random forest is a type of decision tree that trains on bootstrapped sub-samples of the data to avoid overfitting. Because it uses bootstrapping to estimate a subset of predictors at once, it does not require large sample sizes (Joel et al., 2017), and is relatively robust to multicollinearity in the predictor variables. Each model is tested on a randomly selected out of bag sample (i.e., a sample that the model has not seen before). The use of this out of bag sample is what helps to mitigate overfitting during the training process, and this is what makes it a convenient choice, particularly when the number of variables is high in relation to the sample size. By taking a subset and out of bag sample testing thousands of times (i.e., by bootstrapping), the random forest can derive the best “average” decision tree for the training data. The tree can model highly non-linear relationships, and therefore represents a significantly more flexible model than a linear regressor. While there is some concern that in cases where two predictors are similar and equally predictive, random forests can arbitrarily latch onto one predictor variable over the other (Tolosi & Lengauer, 2011), we found our results to be robust to the removal of highly correlated variables and random initializations.
There are many machine learning algorithms to choose from, but we chose to use random forests because they have been shown to perform well with default settings, without the need for extensive hyperparameter tuning (Probst et al., 2019). Hyperparameters are settings which determine the algorithm’s behavior, and their selection generally requires the use of a separate dataset, thus reducing the quantity of data available for testing. We used the default “scikit learn” random forest regressor with k-fold cross-validation (Pedregosa et al., 2011).
A ten-fold cross-validation scheme was used to train and test the model. This means the total dataset is randomly split into 10 equally sized folds. The model is trained on nine out of 10-folds, tested on the 10th, and the test fold performance is recorded. This is repeated until all 10-folds have been used as a test set. The average performance, as well as the standard error across the 10-folds, provides an estimate of model performance on unseen data. The metrics for test data model performance are the mean squared error (which is the averaged squared difference between the prediction and the observed value), the R 2 , and the variance explained. The last model to be trained was then saved and interpreted using the “SHapley Additive exPlanations” package (SHAP) (Lundberg et al., 2017, 2019, 2020).
The SHAP package is based on game theory (Shapley, 1952) and can be used for model explanation; the framework conceives of predictors as collaborating agents seeking to maximize a common goal (i.e., the regressor performance). The approach involves systematically evaluating changes in model performance in response to including or restricting the influence from different combinations of predictors. Traditional approaches (e.g., using the coefficients from a linear model, or importances from a random forest) are unreliable and “inconsistent,” and the Shapley approach has been shown to provide interpretations which are coherent with human intuition (Lundberg et al., 2020). The SHAP TreeExplainer function provides estimations of the per-participant, per-predictor impact on model output, as well as the average predictor impacts. It produces estimates that show how much impact and in which direction each variable, and each interaction, has on the model outcome, for each individual (i.e., it provides per-individual, per-predictor estimations of impact). For the analysis, the default settings of the SHAP package TreeExplainer were used on the entire dataset.
Results
All scale items were summed together prior to data acquisition in Sample 1 whereas they were averaged in Sample 2. The mean for sexual satisfaction in Sample 1 was 36.11 (SD = 8.84, range 5–45; women: M = 36.51, SD = 8.67; men: M = 35.71, SD = 8.74). In Sample 2, the mean was 7.30 (SD = 1.65, range 1–9; women: M = 7.23, SD = 1.65; men: M = 7.44, SD = 1.69). In Sample 1, we used a total of 94 variables and in Sample 2, we used 71 variables (142 when partner effects were considered) to predict sexual satisfaction. In Sample 2, we performed the analyses first at the individual level (N = 955) and then at the dyadic level (N = 377). A full list of variables included in each model with descriptions of the variables as well as all results can be found on the OSF project page: https://osf.io/ehzkm/.
Total variance explained 6
The overall prediction results for sexual satisfaction for study 1 and study 2.
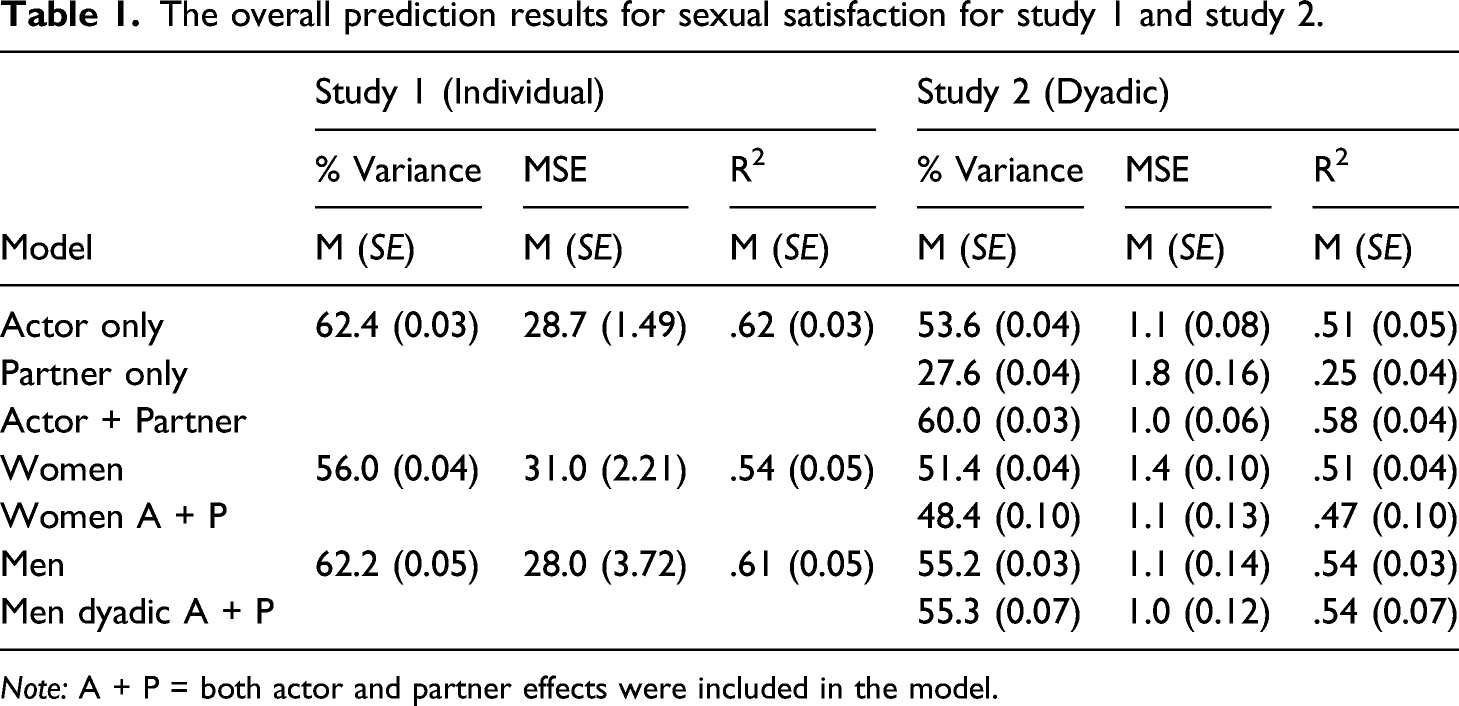
Note: A + P = both actor and partner effects were included in the model.
Most predictive variables 7
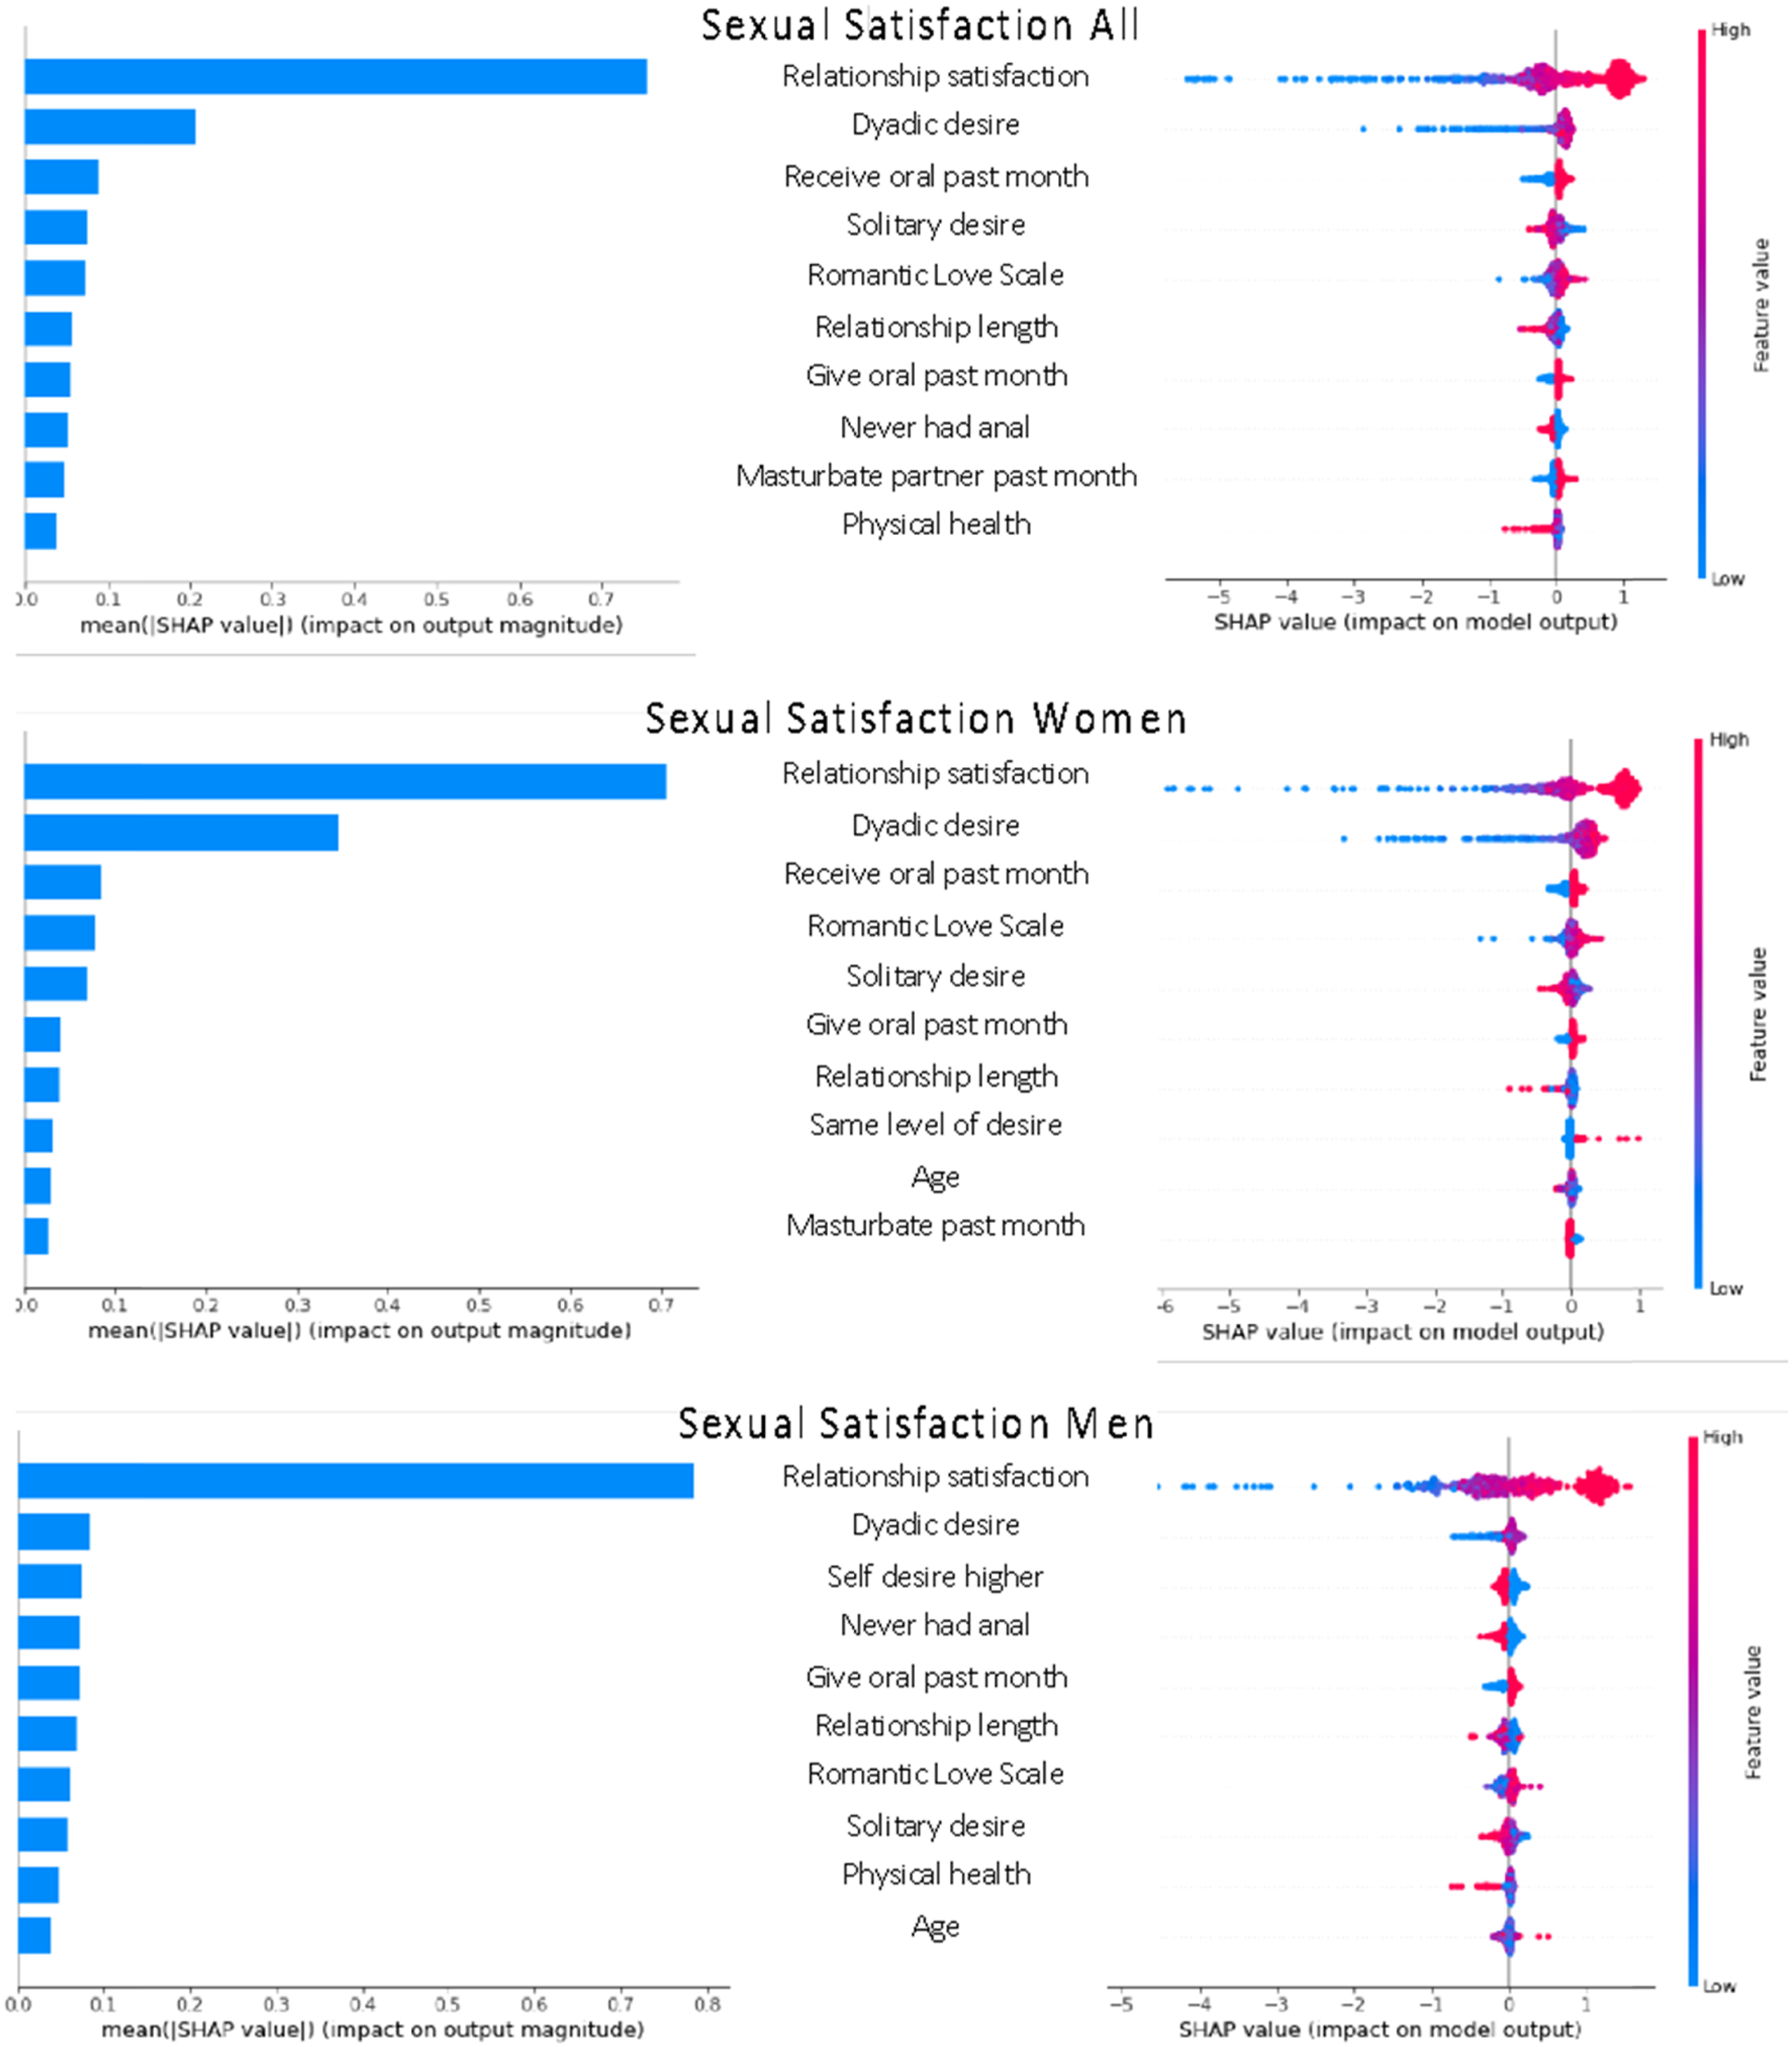
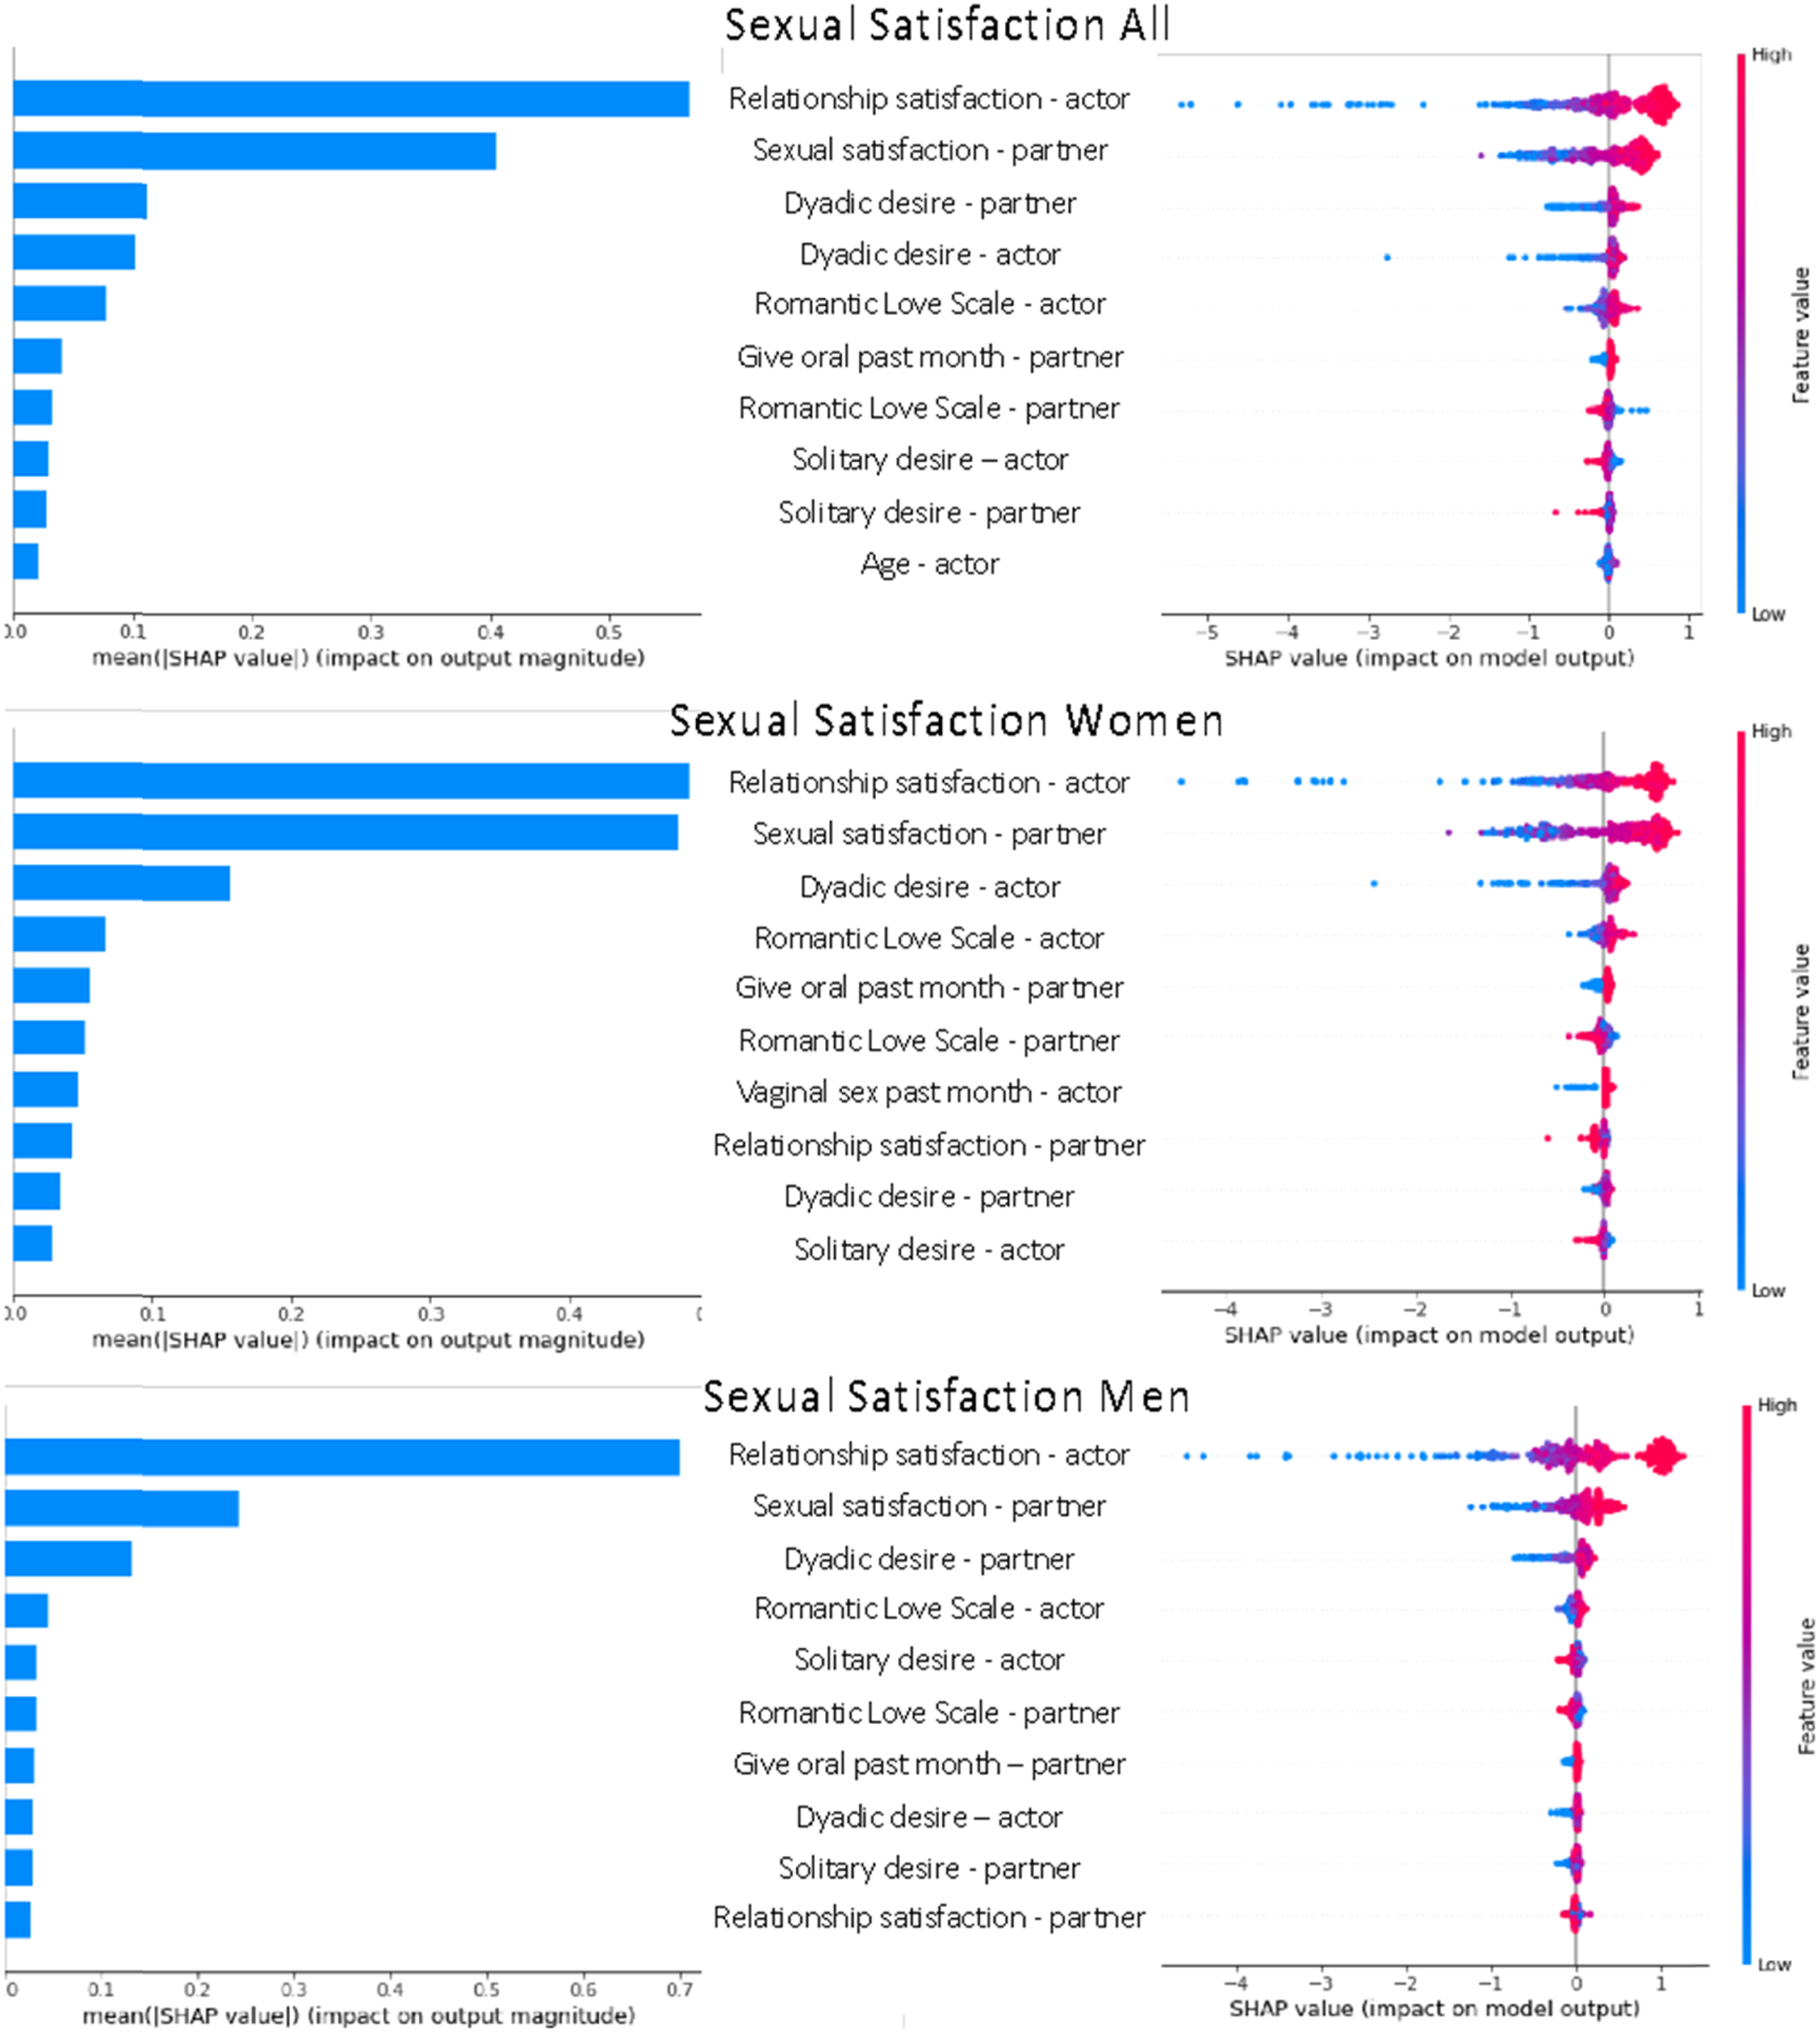
In most of the models, the predictive importance of the variables decreased rapidly beyond a small set of primary predictors. The rest of the predictors contributed only a small amount of variance into the model individually. Therefore, we only present the top-10 variables for each model in the figures (see Figures 1–3 for the results). In the figures, the left side provides the mean effect of each variable on the model outcome. The right side of the figure provides the estimates for each individual participant, which allows for estimation of the effects for each individual. Red indicates a higher value of the predictor variable and blue indicates a lower value. For example, red is equal to 1 and blue is equal to 0 for binary variables. It is important to note that Shapley values project the results from the random forest into a pseudo-linear space to aid interpretation of the results. This does not, however, mean that the relationships are linear. It is possible to interrogate each variable individually against the outcome to identify any non-linearity that the model used to predict the outcome. For the sake of interpretability, we have discussed the results in accordance with a typical linear interpretation. The top-10 most important predictors for sexual satisfaction in Sample 1. Note. The left graph presents the mean effect size for each variable and the right graph shows the size and direction of the effect for each data point. SDI = Sexual Desire Inventory, HISD = Hurlbert Index for Sexual Desire, Sex not declining = Participants stated that their sexual frequency with their partner was not declining. The top-10 most important predictors for sexual satisfaction in Sample 2 with only actor effects. Note. The left graph presents the mean effect size for each variable and the right graph shows the size and direction of the effect for each data point. Variables including “never” compare participants who have never engaged in the activity with participants who have. The top-10 most important predictors for sexual satisfaction in Sample 2 with actor and partner Effects. Note. The left graph presents the mean effect size for each variable and the right graph shows the size and direction of the effect for each data point.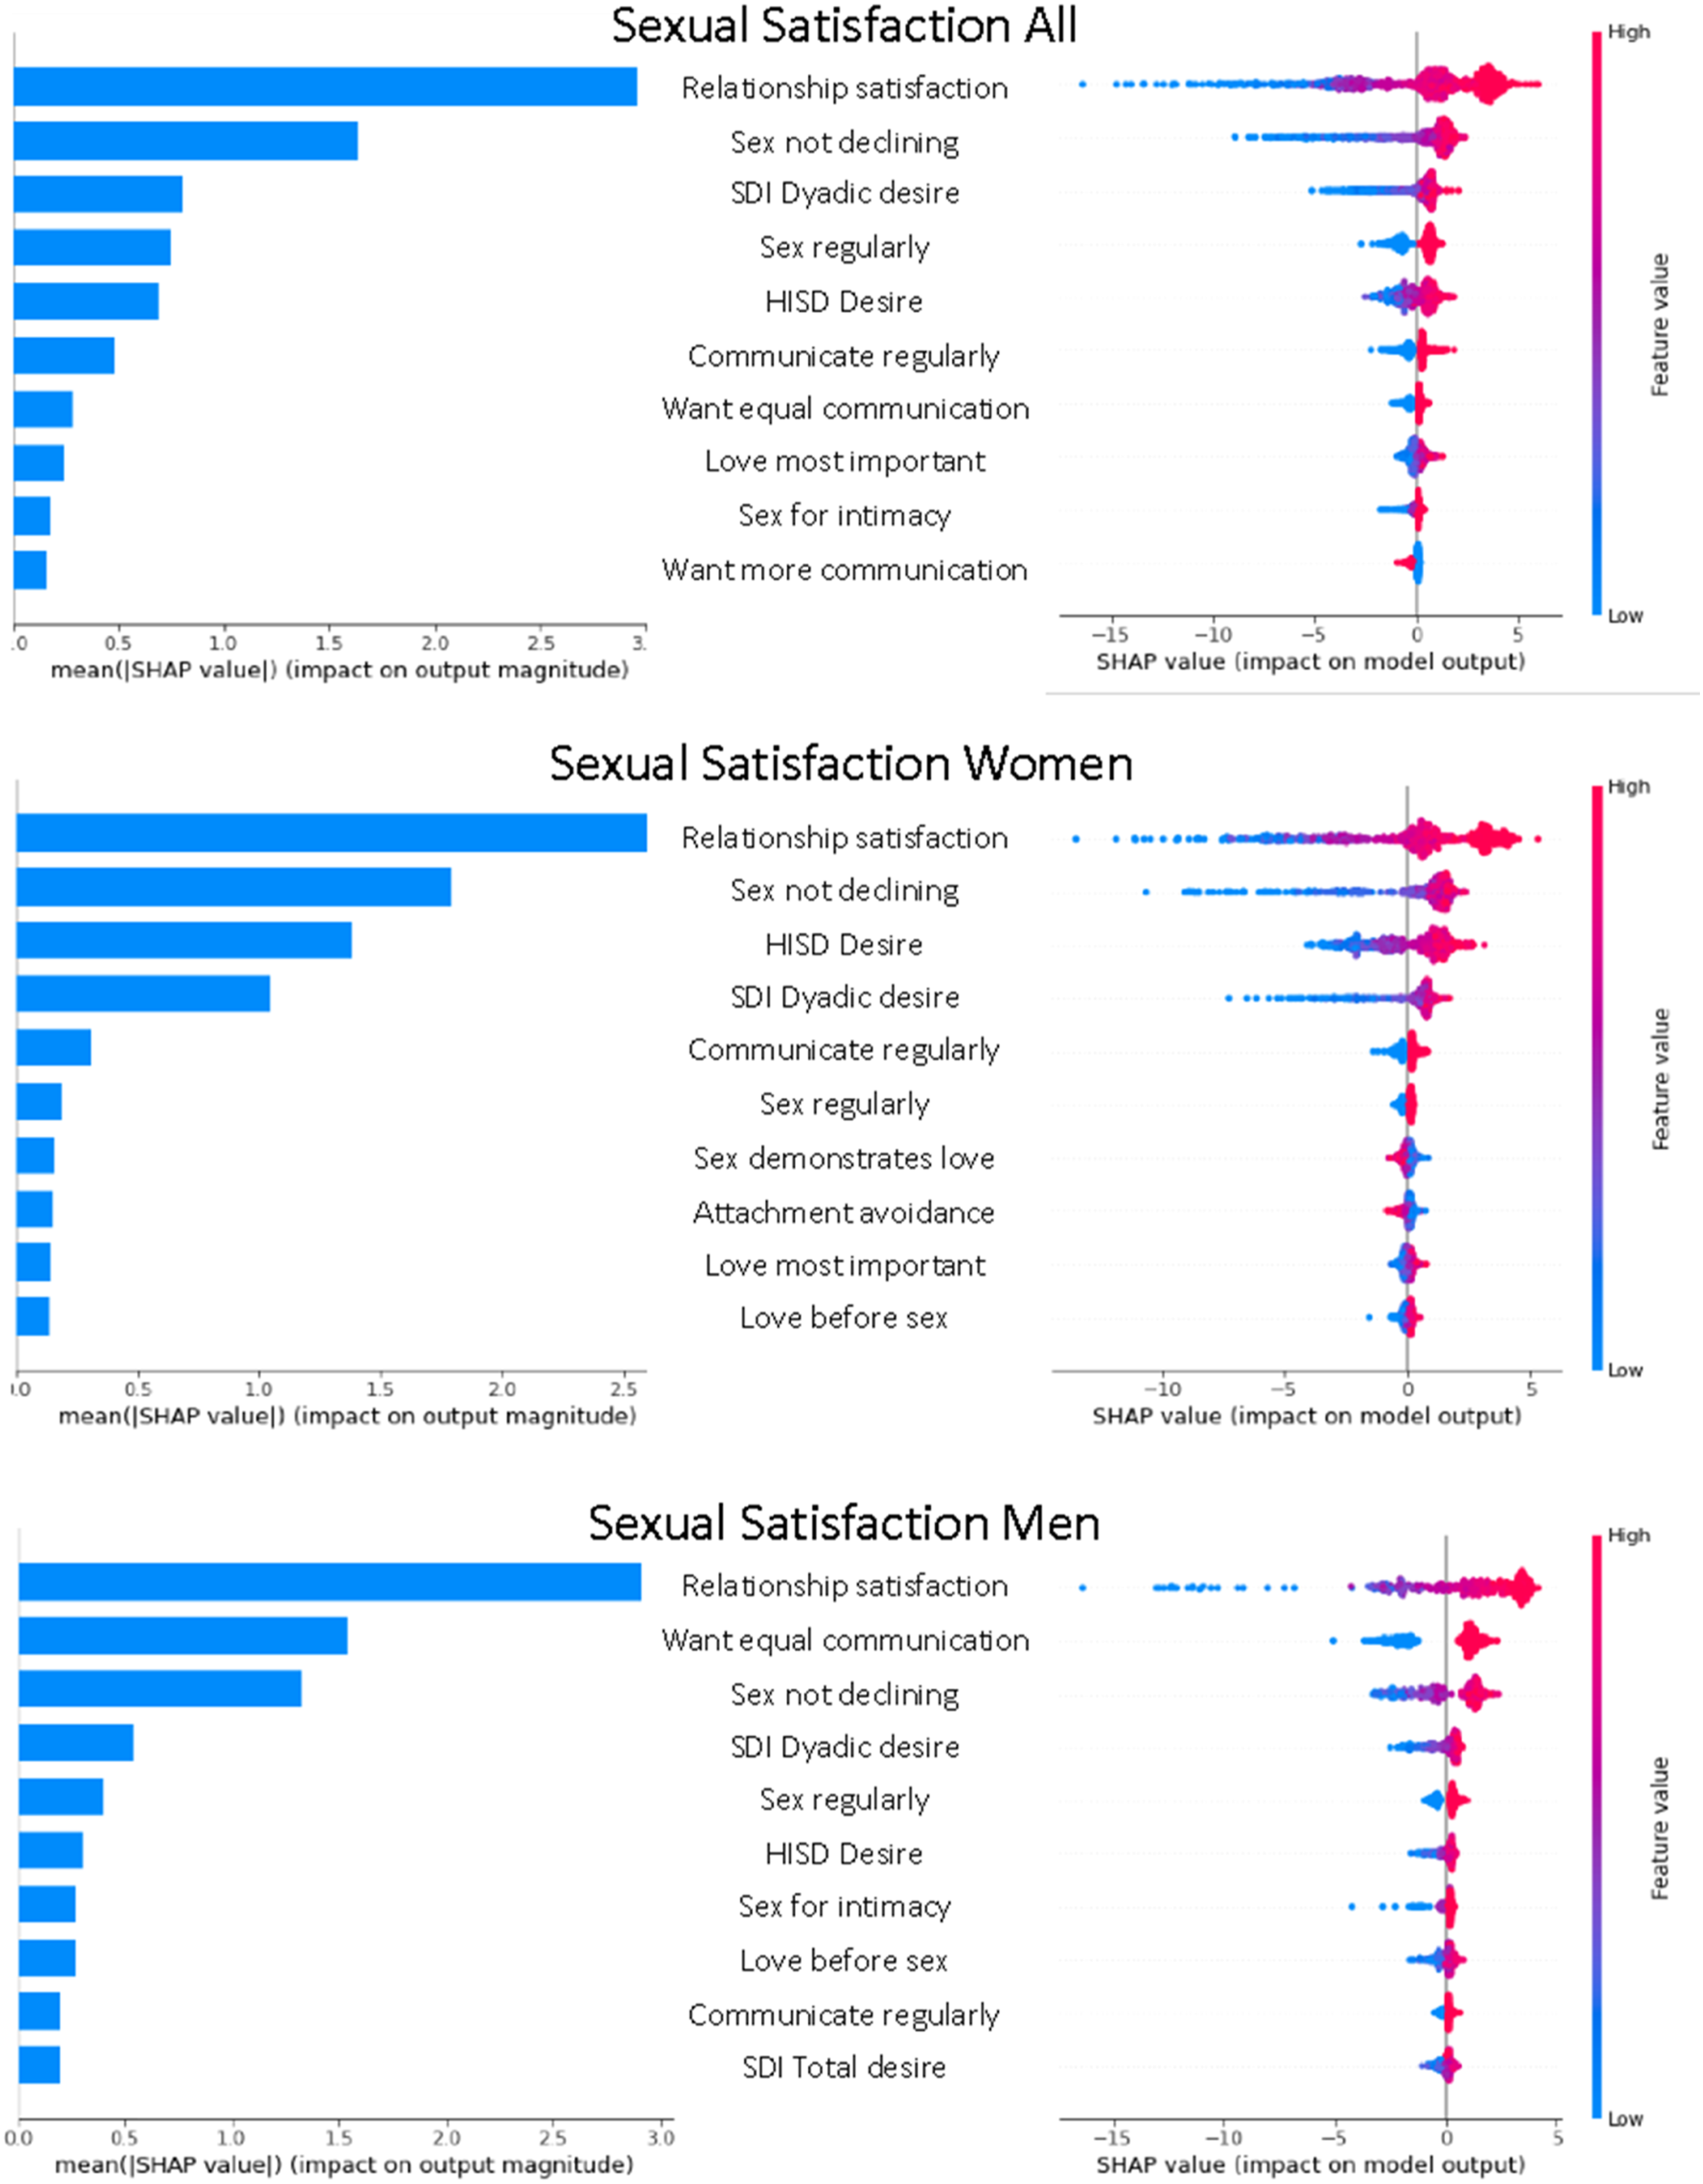
The two samples differed somewhat in the predictor variables that were available and therefore the results for the most important predictors vary somewhat across the two samples. Consistently across the two samples (See Figure 1 for results for Sample 1 and Figure 2 for individual results for Sample 2), relationship satisfaction was the strongest predictor of sexual satisfaction. In Sample 1, for example, relationship satisfaction contributed to a three-point increase in sexual satisfaction on average. Participants who scored high in relationship satisfaction scored up to five-points higher in sexual satisfaction compared to those with average relationship satisfaction. In contrast, individuals who scored low in relationship satisfaction, scored up to 15-points lower in sexual satisfaction compared to those with average level of relationship satisfaction. Both dyadic and solitary desire also contributed to sexual satisfaction in both samples.
In Sample 1, all subscales from the perception of love and sex scale were in the top-10 predictors of sexual satisfaction. The results showed that when participants were still having sex regularly (or it was not declining) they reported higher sexual satisfaction. Participants who believed that sex demonstrates love, highly valued sex (love was not most important) and did not believe that love came before sex also reported higher sexual satisfaction. Interestingly communication was only among the top-10 predictors for men: men who communicated regularly (at least weekly) and felt they communicated as much as they wanted to reported higher levels of sexual satisfaction.
Neither communication nor perception of love and sex were measured in Sample 2. In Sample 2, romantic love scale contributed to sexual satisfaction; participants who reported greater romantic love toward their partner reported higher sexual satisfaction. Several sexual behaviors including receiving or giving oral sex or masturbating with partner predicted higher levels of sexual satisfaction in Sample 2. Relationship length was in the top-10 variables in Sample 2 (12th in Sample 1) with participants who had been in a relationship for longer reporting lower levels of sexual satisfaction. Men’s reports of poorer physical health predicted lower levels of sexual satisfaction. In the dyadic analyses (Figure 3), both actor and partner variables were in top-10 with partner’s sexual satisfaction, romantic love, dyadic desire, and relationship satisfaction all contributing to the actor’s sexual satisfaction. For women, partner’s sexual satisfaction was almost as predictive of women’s sexual satisfaction than their own relationship satisfaction. For men, this association was much smaller.
Discussion
Our results showed that we could predict between 48 and 62% of the variance in sexual satisfaction using a random forest algorithm, up to two to three times more than previous studies even after deleting relationship satisfaction from the model (Byers & Macneil, 2006; Laumann et al., 2006). The algorithm is also explainable because it does not suffer from suppression and cancellation effects or multicollinearity. The results show that using machine learning can help move psychological research into a new era of highly predictive and accurate models that generalize better to the population and have a higher utility in practice (Yarkoni & Westfall, 2017).
The strongest predictors
Because of the importance of sexual satisfaction on relationship quality (Joel et al., 2020; McNulty et al., 2016; L. M. Vowels & K. P. Mark, 2020b) and overall well-being (Davison et al., 2009; Del Mar Sánchez-Fuentes et al., 2014), understanding factors that are the most, and the least, strongly associated with sexual satisfaction is important. This can enable researchers and practitioners to target individuals who may be at a particular risk of poor sexual satisfaction and helps to address factors that are the most likely to induce changes in sexual satisfaction while ignoring those that are the least likely to produce change. Thus, we added to the literature by examining which factors were the most, and least, predictive of sexual satisfaction in two samples.
Several variables that have previously been identified as important predictors of sexual satisfaction were included in the top-10 predictors: relationship satisfaction (Joel et al., 2020; McNulty et al., 2016; L. M. Vowels & K. P. Mark, 2020b), dyadic desire (Kim et al., 2020; Mark, 2012, 2014), romantic love (L. M. Vowels & K. P. Mark, 2020a), sexual communication (Impett et al., 2019), and perception of love and sex (Hendrick & Hendrick, 2002). Importantly, when relationship satisfaction was low, it had up to three times higher impact on the model outcome compared to when relationship satisfaction was high. Furthermore, participants in Sample 1 who viewed sex as an important part of their relationship and those who had sex regularly also had higher sexual satisfaction compared to participants who placed less importance on sex and more on love and had sex less frequently. Similarly, participants who reported a higher frequency of more varied sexual behaviors such as giving and receiving oral sex and mutual masturbation in Sample 2 reported higher levels of sexual satisfaction. These results suggest that frequency and value of sex as well as a more varied sexual repertoire in relationships are important predictors of sexual satisfaction. More varied sexual repertoire is also likely to lead to more satisfying sexual experiences, especially for women given that women have a higher likelihood of orgasm from clitoral stimulation than from intercourse. These results confirm earlier findings using traditional statistical models (Haavio-Mannila & Kontula, 1997; Laumann et al., 2006).
Gender was not an important predictor of sexual satisfaction suggesting that men and women overall had similar levels of sexual satisfaction in both samples which is consistent with some studies (Mark et al., 2018; McClelland, 2011) and inconsistent with others (Laumann et al., 2006). Men’s sexual satisfaction was overall more predictable than women’s. This may be because women’s sexuality is thought to be more complex than men’s (Basson, 2001). There were also some notable differences in the top-10 predictors for men and women. Attachment avoidance was only in the top-10 predictors for women’s sexual satisfaction (18th for men changing the outcome very little). Women who were higher in attachment avoidance reported lower sexual satisfaction compared to women lower in attachment avoidance. Attachment avoidance is associated with fear of closeness and intimacy, which tend to be more strongly tied to sexuality for women than men (Péloquin et al., 2014), which may explain why attachment avoidance was particularly important for women.
Consistent with previous studies using both traditional analyses (Rubin et al., 2012; L. M. Vowels & K. P. Mark, 2020a) and machine learning (Joel et al., 2020; L. M. Vowels et al., 2021), including partner effects added little additional variance. However, both actor and partner variables were among the top-10 most important predictors. Partner effects alone could also explain around half as much variance as only actor effects. Important partner variables included partner’s sexual satisfaction, romantic love, relationship satisfaction, and dyadic desire. Interestingly, for women, their male partner’s sexual satisfaction was just as important a predictor for their own sexual satisfaction than their relationship satisfaction. This is consistent with several studies finding that women partnered with men tend to answer questions of sexual satisfaction relative to their partner’s satisfaction as much as their own (McClelland, 2011, 2014; Pascoal et al., 2014) and may be due to there being a societal expectation on women to prioritize men’s pleasure. For men, their female partner’s sexual satisfaction only accounted for about third as much change in sexual satisfaction compared to their own relationship satisfaction. These findings suggest that while we may be able to predict actor’s sexual satisfaction relatively well using only their own variables, accounting for both partners’ variables can provide important additional insights.
The present study also provided an important addition to the literature by evaluating which factors were unimportant for sexual satisfaction. Many of the variables that have previously been associated with sexual satisfaction in traditional analyses were less important compared to other predictors. These included variables such as gender, sexual orientation, children, religiosity, attitudes toward sexuality, and mental health (Del Mar Sánchez-Fuentes et al., 2014; Laumann et al., 2006). This suggests that even though differences in demographic variables may be statistically significant in some studies especially when sample sizes are large (e.g., Laumann et al., 2006), this does not mean that the differences are meaningful. In fact, the present study suggests the opposite; couple’s overall relationship and sexual behaviors are more proximal to sexual satisfaction and appear more important than who the person is. Understanding which variables are less related to the outcome is important, so that researchers and practitioners do not waste their time and resources on factors that are less likely to change the outcome.
Implications for research, theory, and practice
The study has several strengths as well as important implications for research, theory, and practice. We used explainable machine learning and cross-validation in which the model performance is tested on unseen data to avoid overfitting and thus improve the generalizability of the results. The code used in the study is readily available and provides a pipeline to relationship researchers to conduct more robust and predictable science. The results showed that dyadic level variables are the most likely to contribute to sexual satisfaction while individual predictors are less important. Furthermore, examining individuals’ perceptions of love and sex (Hendrick & Hendrick, 2002), keeping sex as a central element of relationships, and broadening couple’s sexual repertoire may enhance their sexual satisfaction. Finally, we expect many of these variables to have a bidirectional association with sexual satisfaction meaning that improving one (e.g., introducing more varied sexual behaviors) may produce a positive change in the other (e.g., enhanced sexual satisfaction) which will in turn improve the first variable (e.g., increased desire to try new things).
Limitations and future directions
The study also has several limitations that should be considered when interpreting the results. While the study included many predictors that have been associated with sexual satisfaction in previous research, there are other variables that we did not account for, that predict sexual satisfaction (e.g., responsiveness, self-esteem, personality, sociocultural variables). We also only had access to self- and partner-report measures. Thus, the algorithm could only make the predictions based on the variables that were available in the dataset. Therefore, future research should consider a greater number of individual, relational, and societal factors and include behavioral measures to predict sexual satisfaction. We also used data from two relatively large samples including a large subset of couples, the data were convenience samples and limited in their generalizability; most of the participants were white and well-educated and all participants in Sample 2 were in mixed-sex relationships, albeit nearly half the participants were bisexual. We also did not ask participants about any disabilities which may have contributed to their sexual satisfaction. Therefore, future research is needed to examine predictors of sexual satisfaction in a more representative sample. Random forests are a powerful tool that will take advantage of any correlations and interactions in the data, no matter how non-linear, it cannot be used to estimate causality. However, in the absence of a means to reliably estimate causality when examining factors relating to sexual satisfaction, we believe that using a predictive model is perhaps the best option. There are limitations to the Shapley method which have been discussed elsewhere (Kumar et al., 2020), and the notion that the human-interpretable Shapley model sufficiently explains our model suggests that a simpler model may be adequate to begin with, even if the simpler model is harder to identify (Rudin, 2019).
Furthermore, the data were cross-sectional and therefore we could not examine which predictors may account for the most change in sexual satisfaction over time, or indeed whether sexual satisfaction is predictable over time. Joel et al. (2020) found that they could predict little relationship satisfaction longitudinally. Cross-sectional self-report measures are also prone to shared method variance which results in higher correlation among variables collected at the same point in time. We attempted to overcome some of these issues by testing the models without relationship satisfaction given its high correlation with sexual satisfaction and only using partner effects to predict actor’s sexual satisfaction. The models with relationship satisfaction excluded were still predictive but predicted less variance. The models with partner effects alone could predict nearly 30% of the variance in actor’s sexual satisfaction which is higher than most other previous studies using actor or actor and partner effects. Future longitudinal and behavioral research is needed to understand whether the self-report variables measured in this study are predictive over time or whether behavioral measures could also be predictive. Finally, we examined whether men and women differed in the predictors that were important for their sexual satisfaction and future research could also examine whether the predictors of sexual satisfaction differ by sexual orientation.
Conclusion
In conclusion, the present study showed that sexual satisfaction is highly predictable with relationship variables (relationship satisfaction, dyadic desire, romantic love, perception of love and desire) explaining the most variance in sexual satisfaction. We used explainable machine learning allowing us to not only estimate variables that may contribute meaningfully, by some undeterminable amount, to the outcome but to also estimate the direction and size of the effect of each predictor variable. As such, the study enables researchers, policymakers, and practitioners to target variables that may be the most likely to improve sexual satisfaction.
Supplemental Material
sj-pdf-1-spr-10.1177_02654075211047004 – Supplemental Material for Identifying the strongest self-report predictors of sexual satisfaction using machine learning
Supplemental Material, sj-pdf-1-spr-10.1177_02654075211047004 for Identifying the strongest self-report predictors of sexual satisfaction using machine learning by Laura M. Vowels, Matthew J. Vowels and Kristen P. Mark in Journal of Social and Personal Relationships
Footnotes
Funding
The author(s) disclosed receipt of the following financial support for the research, authorship, and/or publication of this article: This research was supported by research grants from the Patty Brisben Foundation for Women’s Sexual Health and the American Institute of Bisexuality awarded to Kristen P. Mark.
Availability of data and material
Supplemental material
Supplemental material for this article is available online.
Open research statement
As part of IARR’s encouragement of open research practices, the author(s) have provided the following information: The main project was not pre-registered. The data used in the research can be accessed by emailing Dr. Kristen Mark at ![]() .
.
Notes
References
Supplementary Material
Please find the following supplemental material available below.
For Open Access articles published under a Creative Commons License, all supplemental material carries the same license as the article it is associated with.
For non-Open Access articles published, all supplemental material carries a non-exclusive license, and permission requests for re-use of supplemental material or any part of supplemental material shall be sent directly to the copyright owner as specified in the copyright notice associated with the article.