
Abstract
Deafblindness refers to a functional restriction of both hearing and vision, and presents at all ages. Determining prevalence of deafblindness, particularly in children, is challenging. The aim of this review was to explore and assess methodologies previously used to determine the prevalence of childhood deafblindness in both peer-reviewed and grey literature. Five databases were included in the search – Medline (OVID), PubMed, Scopus, CINAHL, and PsycINFO. Thirteen peer-reviewed articles and 11 documents from the grey literature met inclusion criteria for the review. In exploring the literature on deafblindness in children, it is evident that the characteristics and needs of this population are not well described. Approaches adopted by researchers show inconsistencies in how deafblindness is defined, assessed and diagnosed, making comparison challenging. To understand the needs of this group, it is critical that the childhood deafblind population is accurately described. Recommendations are made for the assessment of the population of children with deafblindness.
Introduction
Deafblindness is a complex disability involving restriction of both hearing and vision to varying degrees. Deafblindness is characterised and investigated according to aetiology and several categories, including age of onset, that is, congenital or acquired. However, a global understanding of deafblindness is complicated by the lack of a consistent universal definition. The aetiologies of deafblindness in children are attributed to over 70 conditions, including genetic disorders, prematurity, prenatal or congenital complications, and postnatal or acquired complications (Admiral & Huygen, 2000; Dalby et al., 2009; Dammeyer, 2012; Matsunaga, 2021). Despite a broad range of aetiologies, the estimated prevalence of children with deafblindness remains relatively low, placing this population at risk of under-representation, being misunderstood and remaining under-researched and under-serviced. This exacerbates the developmental risk for children with deafblindness if they are denied support for their early learning and development (National Center on Deaf-Blindness [NCDB], 2020; World Federation of the Deafblind [WFDB], 2022). In exploring the literature concerning childhood deafblindness, it becomes evident that the characteristics and needs of this population are not well described. Approaches to estimating the prevalence of deafblindness in children show discrepancies in identification, assessment, and diagnosis of deafblindness, making comparison challenging.
The identification of children with deafblindness also varies regarding age of onset; it may be based upon chronological age, such as ‘from birth’ or ‘before two years of age’ (Dammeyer, 2009; Möller, 2003; Prain et al., 2012) or by onset prior to language acquisition (Dalby et al., 2009; Guthrie et al., 2011). Here, individuals with Usher syndrome – a genetic condition where hearing impairment develops early, typically in childhood, and prior to progressive vision impairment – do not fall neatly into these categories and risk further under-representation. Identifying children with deafblindness is the first step towards establishing their needs and providing support (Wittich & Simcock, 2019). Consistency in definition and methodology can aid this.
The lack of a consistent universal definition is a significant complicating factor (Ask Larsen & Damen, 2014; Saunders & Echt, 2007). Definitions of deafblindness vary widely and tend to be either medical or functional (Dammeyer, 2014). A medical definition considers deafblindness on the grounds of clinical measures of hearing and vision impairment and aligns with medico-legal definitions and international standards of diagnosis (Ask Larsen & Damen, 2014). A functional definition addresses the capacity of the individual in regard to information access, communication, and mobility (Dammeyer, 2012). For example, the Nordic definition of deafblindness states; Deafblindness is a combined vision and hearing impairment of such severity that it is hard for the impaired senses to compensate for each other. Thus, deafblindness is a distinct disability. (Centre for Welfare and Social Issues, 2016)
Significant work has been done to clarify these disparate terminologies, however, a consensus is yet to be reached (Dammeyer, 2014; Wittich et al., 2013).
The aim of this scoping review was to address the following research questions:
Based upon the challenges and previous methodologies identified within the peer-reviewed and grey literature, this article will offer recommendations for future approaches to establishing the prevalence of childhood deafblindness.
Method
In answering the research questions posed, the scoping review framework outlined by Arksey and O’Malley (2005) was applied, guided by the Preferred Reporting Items for Systematic Reviews and Meta-Analyses (PRISMA) reporting statement for scoping reviews (Tricco et al., 2018).
Search strategy
The review included a systematic search of five databases – Medline (OVID), PubMed, Scopus, CINAHL, and PsycINFO. Variations on the term deafblindness, including ‘deafblind’, ‘dual sensory loss/impairment’, and ‘combined vision and hearing loss/impairment’ were applied. ‘Usher syndrome’ and ‘CHARGE syndrome’ were included as conditions that represent a significant proportion of the childhood deafblind population (Matsunaga, 2021). These terms were combined with ‘prevalence’, ‘demographic’, ‘data collection’, ‘methodology’, and ‘incidence’.
To ensure the inclusion of reports and estimates commissioned by various government, and non-government agencies, a systematic search of grey literature was also conducted using similar search terms (Canadian Agency for Drugs and Technologies in Health, 2022). Additional reports that met the inclusion criteria, (1) written in English, (2) included children with deafblindness, and (3) stated a methodology for determining prevalence, were sourced through authors of this article and snowballing (Sayers, 2007)
Eligibility criteria
Papers and reports written in English that included people < 18 years and described deafblindness as a single diagnosis or considered deafblindness to be present when participants had separate vision and hearing impairment, were reviewed by Authors 1 and 3 to determine whether the article met the inclusion criteria. Any publications meeting the inclusion criteria published prior to the search conducted in July 2023 were considered for inclusion in this scoping review.
Study selection, data collection, and charting
Titles and abstracts from reports and estimates were independently screened by Authors 1 and 3 in consultation with the other authors when discrepancies arose. Data were collected and charted in a spreadsheet, including the publication record, study location and population, any reported prevalence estimate or count, and any adopted definitions of deafness, and blindness and/or deafblindness. Where a prevalence estimate, or count was not provided, one was calculated based upon the information in the report and, if relevant, a matched population. The reports’ aims and methodologies were noted.
Results
Peer-reviewed literature
A search of the peer-reviewed literature provided 1367 total results (Figure 1). After removal of duplicates, 832 records were screened at title and abstract levels, 12 of which met the inclusion criteria. Screening at a full-text level excluded a further three studies as they did not contain information that allowed calculation of a prevalence estimate for childhood deafblindness. Throughout the review process, four studies (Huebner et al., 1996; Lindén-Boström & Persson, 2015; Minhas et al., 2022; Rogers, 1996) were identified via a snowballing approach. The final 13 included studies are outlined in Table 1.
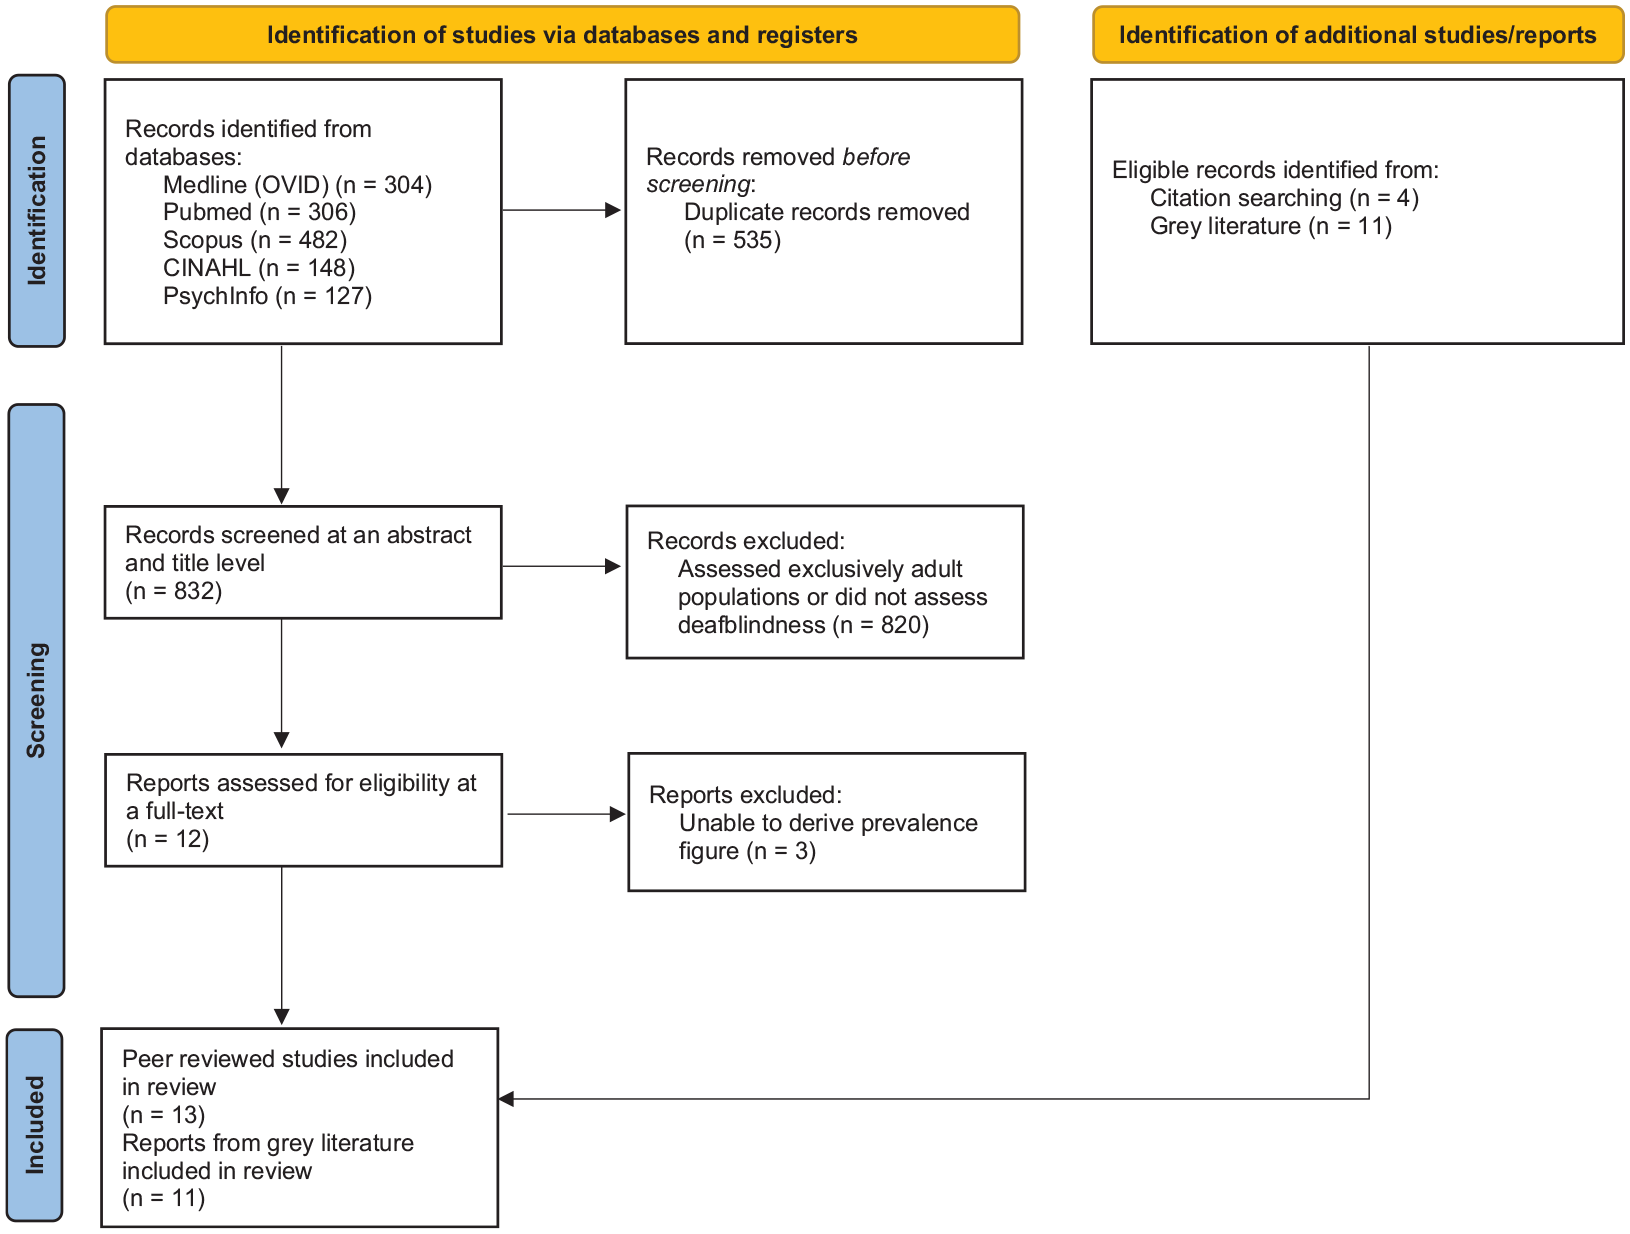
Search flowchart.
Peer-reviewed studies meeting the literature review inclusion criteria.
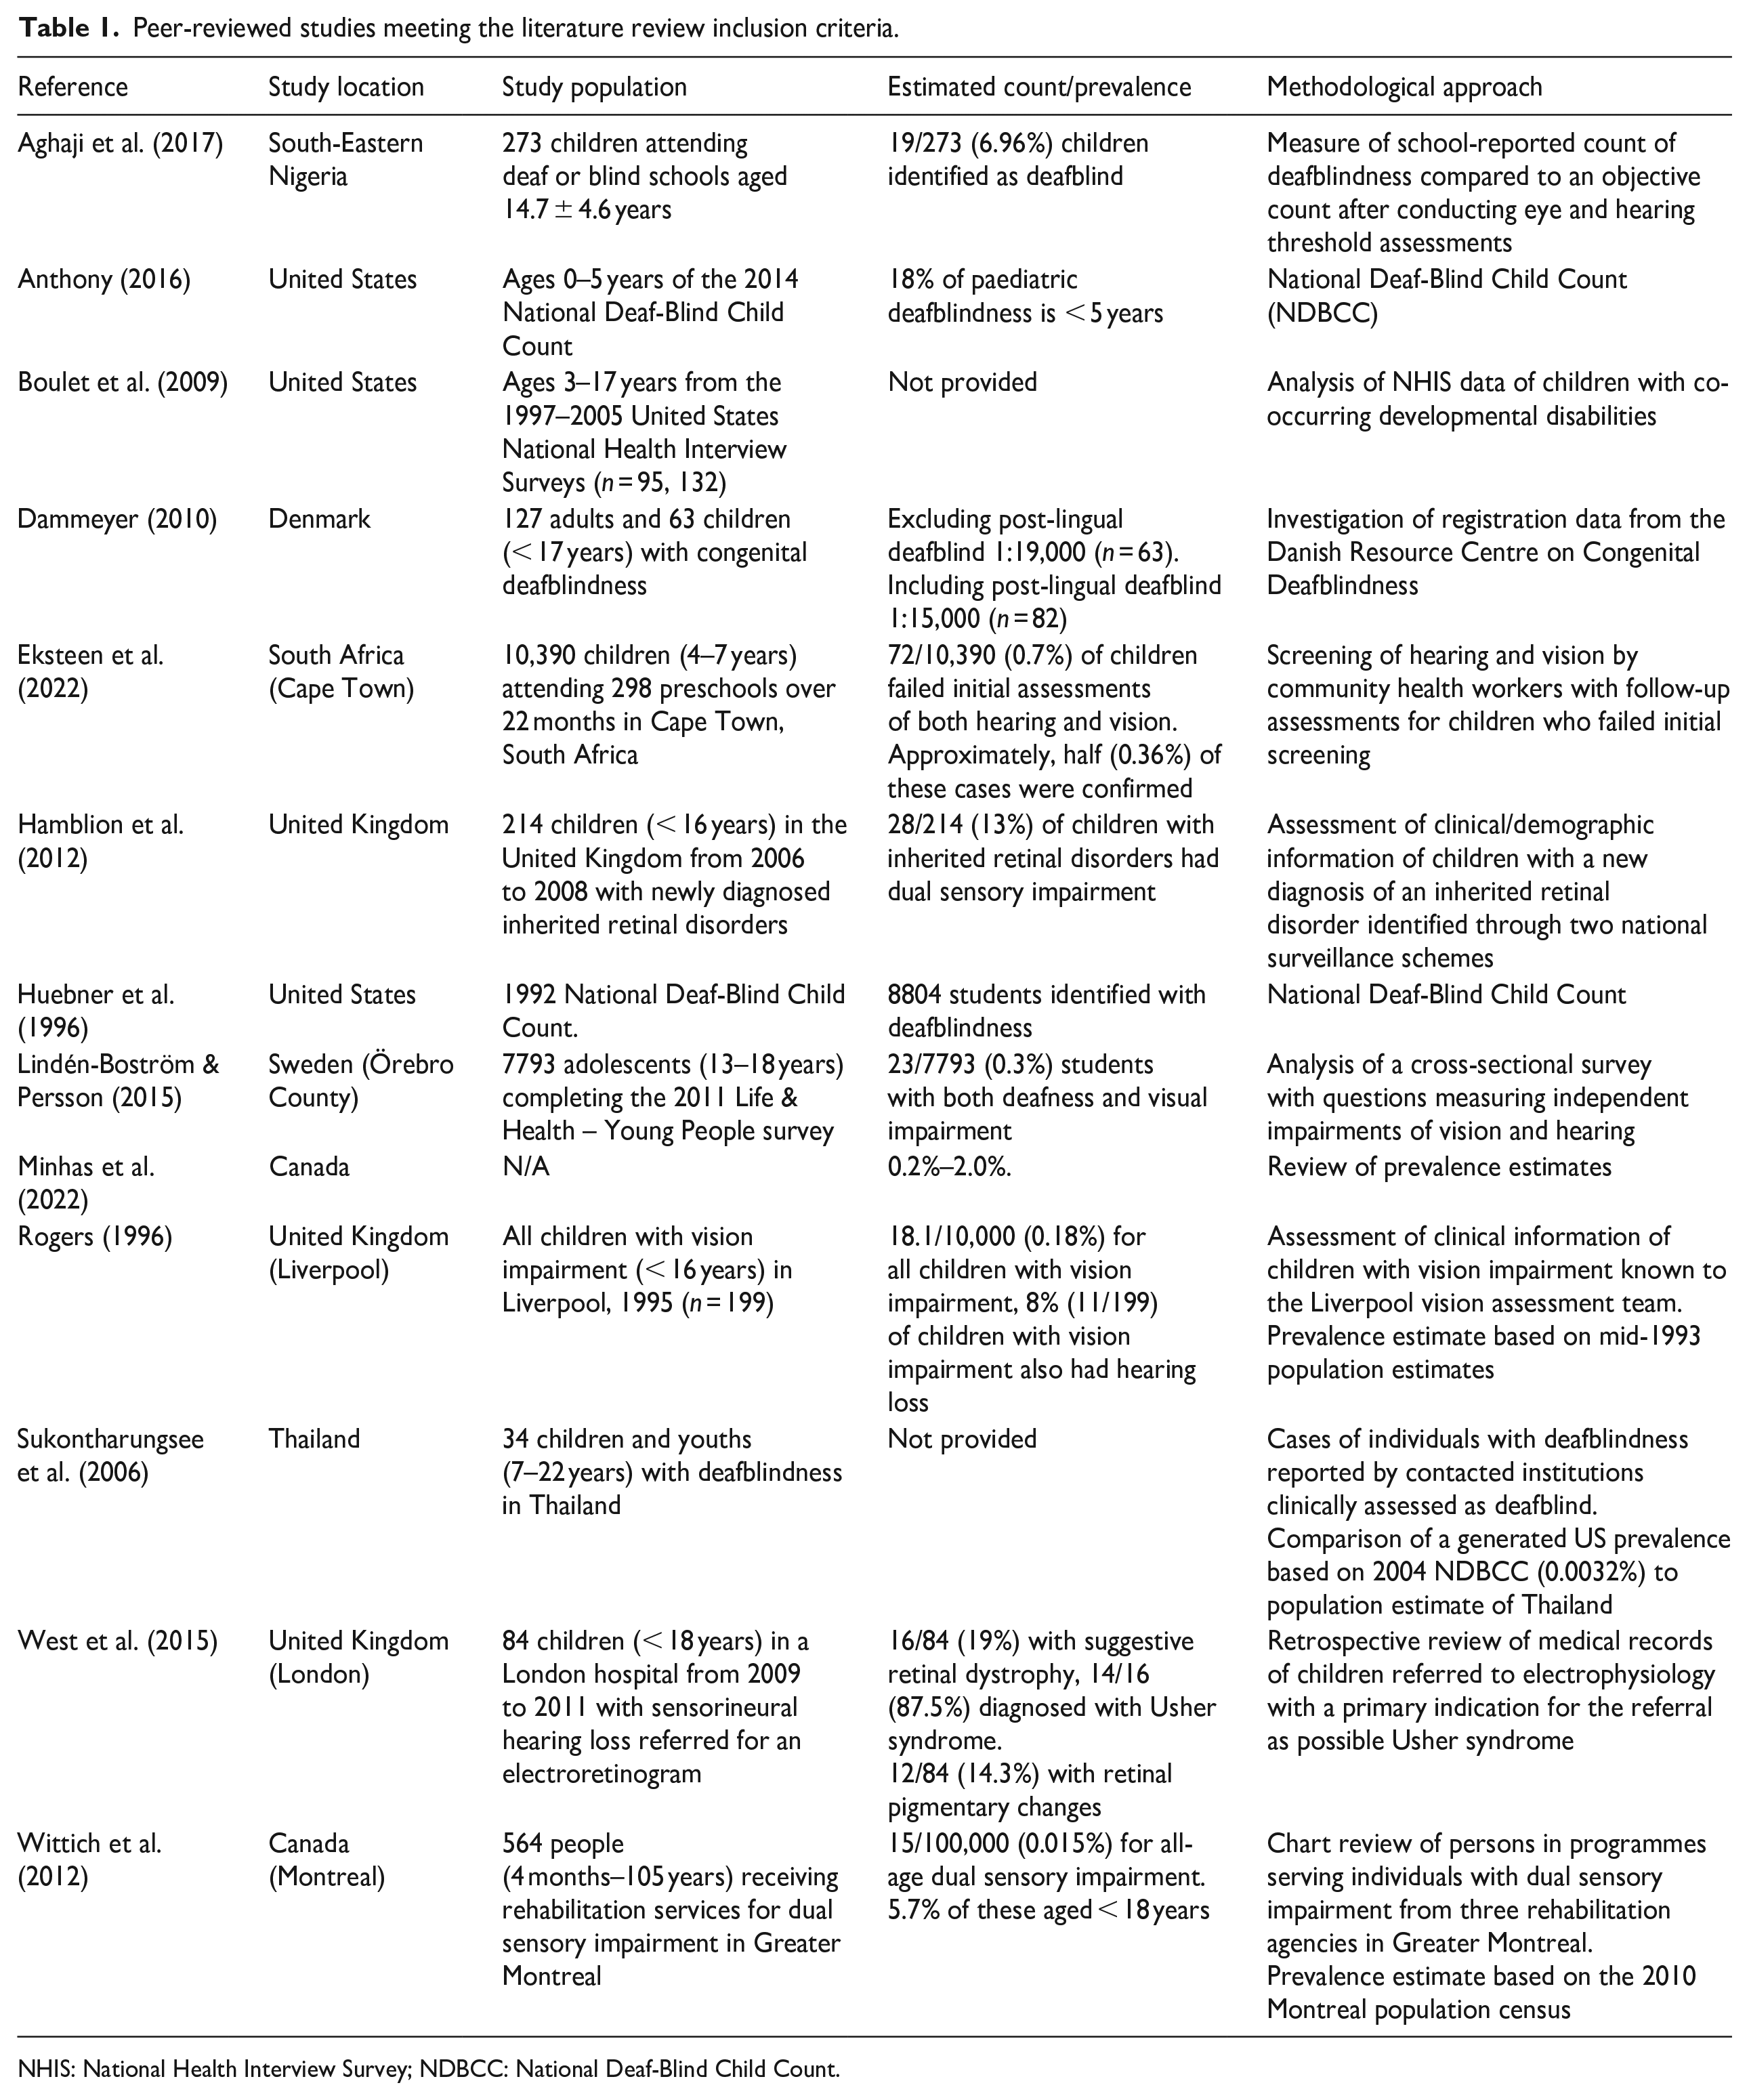
NHIS: National Health Interview Survey; NDBCC: National Deaf-Blind Child Count.
Several approaches to reporting data on childhood deafblindness were evident in the peer-reviewed literature. These included use of data from a variety of sources, including point-in-time counts, health surveys, and pre-existing health and service provider records (Table 1). In addition to a range of methodologies, the reports generally demonstrated a lack of consistency in definitions, measurement of deafblindness, and participant inclusion criteria (Table 2). A review from Minhas et al. (2022) assessed 19 papers and reports; however, of these, only two studies (Dammeyer, 2010; Wittich et al., 2012) represented childhood populations, with a further six papers using estimates from populations assessed in the 2018 WFDB global report. More recently, in a scoping review, Bright et al. (2023) assessed 197 reports with only one of these including children (Lindén-Boström & Persson, 2015).
Peer-reviewed studies definitions and inclusion criteria.
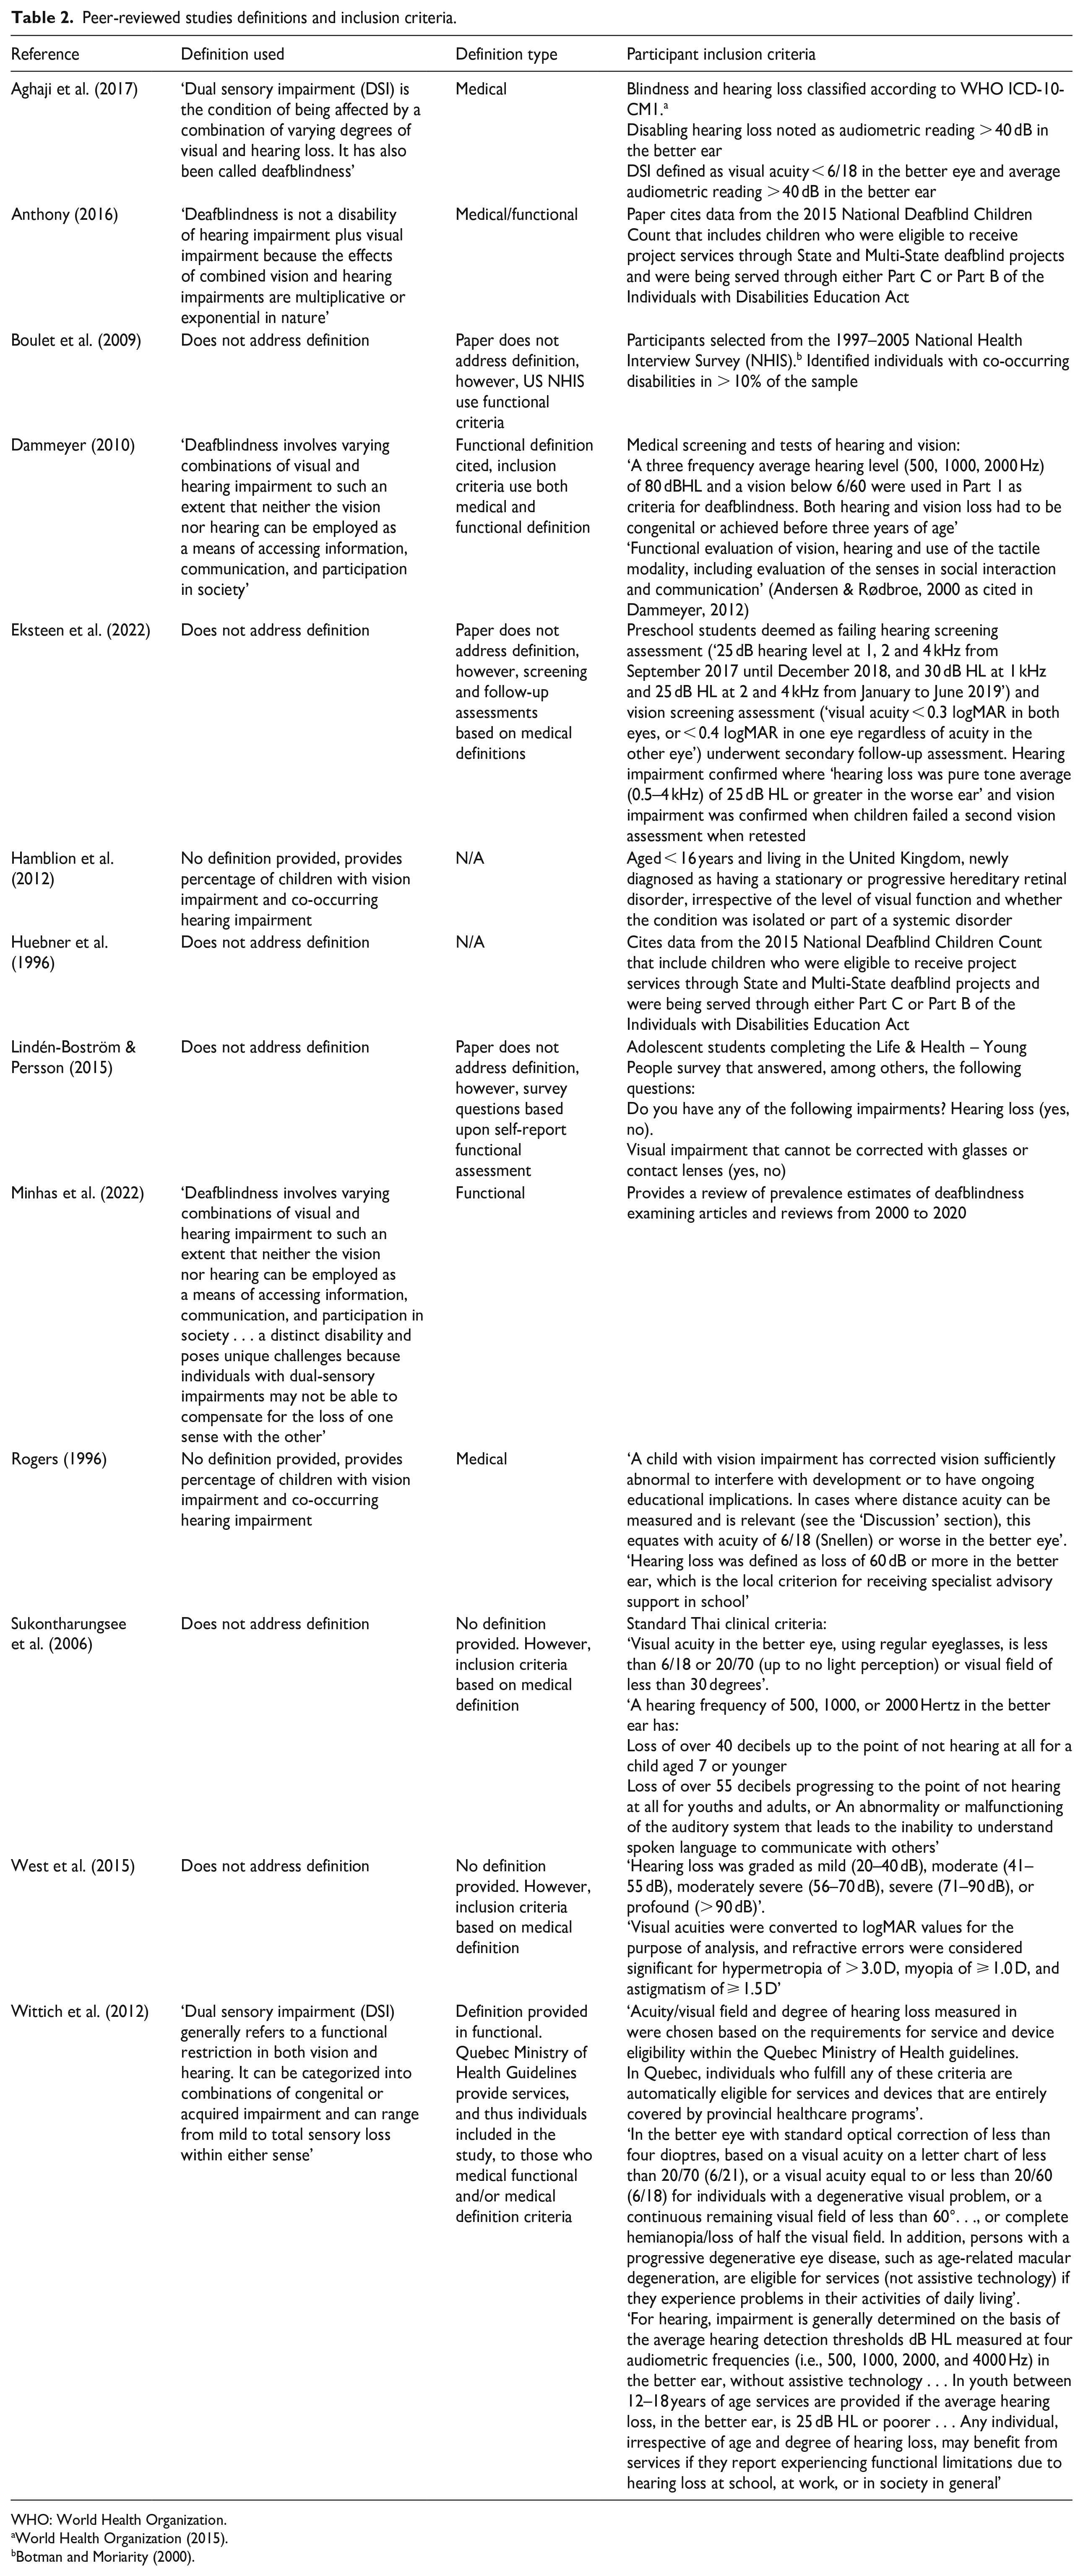
WHO: World Health Organization.
World Health Organization (2015).
Three peer-reviewed papers (Anthony, 2016; Huebner et al., 1996; Sukontharungsee et al., 2006) cited counts from the National Child Count of Children and Youth who are Deaf-Blind, published annually by the US NCDB. The count is a point-in-time snapshot of children (aged 0–21 years) eligible for state deafblind services. The 2020 count reported 11,407 children (NCDB, 2020). Huebner et al. (1996), in citing data from the 1992 count, reported on 8804 students, and commented that this figure was likely an underestimation, but did not provide a prevalence estimate. The results of the 2004 count were used by Sukontharungsee et al. (2006) to suggest a prevalence figure of 0.0032% as a comparison point for the proportionally smaller Thai population. Anthony (2016) quoted the 2014 count with 1726 children aged 0–5 years, as representing 18% of the childhood population (<21 years). These authors did not provide independent counts or estimates of the childhood deafblind population.
Health surveys were also used as a source of data on deafblindness. Boulet et al. (2009) utilised data from the US National Health Interview Survey 1997–2005 (Blewett et al., 2022) to report multiple developmental disabilities in more than 10% of children. Co-occurring deafness and blindness was not reported as this was below the authors’ defined threshold demonstrating the difficulty of assessing rare populations even when using population-scale data. Not all data sets fail to include these individuals. For example, analysis of self-reported data from a Swedish national survey of student wellbeing (based on the World Health Organization [2007] classification of functioning) identified 0.3% of students with some form of both vision and hearing impairment (Lindén-Boström & Persson, 2015).
Three sources explored pre-existing health records. Hamblion et al. (2012) conducted surveillance for inherited retinal disorders (IRDs) over 18 months, utilising a combined national ophthalmological surveillance programme and independent data collection from genetic centres in the United Kingdom. The presence of an IRD was considered necessary for inclusion and at the time of identification, 34% of patients were not considered to have vision impairment despite the presence of an IRD. Two hundred and forty-one patients with an IRD were eligible for inclusion, with 13% having a hearing impairment.
Over a period of 3 years, West et al. (2015) retrospectively reviewed medical records of children < 18 years with sensorineural hearing loss suspected of Usher syndrome. This cohort had been referred to two paediatric retinal clinics in the United Kingdom for electrophysiology, specifically an electroretinogram. Of the 84 children, 15.5% (13/84) were identified with rod-cone dysfunction and diagnosed with Usher syndrome. A further 15 children were identified to have other ocular pathologies, typically refractive error (66%, 10/15).
Several studies reported the number of children known to local health or support organisations. Rogers (1996) included all children living in Liverpool, UK with hearing loss who were also known to a vision assessment team. The study reported 8% of children with vision loss as also having hearing loss.
Dammeyer (2010) examined the prevalence of deafblindness using a national Danish survey started in 2000. Information was gathered by the Danish Resource Centre on Congenital Deafblindness and included medical and functional evaluations. Dammeyer (2010) identified 63 children and 127 adults with congenital deafblindness, or a prevalence of approximately 1:29,000, with 35 aetiological causes of congenital deafblindness.
Aghaji et al. (2017) measured the prevalence of deafblindness in schools for the deaf and schools for the blind in South-Eastern Nigeria. Of the 273 participants, 7 had been previously identified by the schools as having deafblindness. Further measures conducted by Aghaji et al. (2017) identified an additional 12 ‘objective cases’ (found when World Health Organization (2007) classifications were applied) arriving at a prevalence of 7% (n = 19). Similarly, Eksteen et al. (2022) when screening 10,390 South African preschool children (aged 4–7 years) for sensory impairments found 0.7% of children to have both vision and hearing impairment upon initial screening. Follow-up hearing and vision tests (otoscopy, air conduction threshold pure tone audiometry, and visual acuity measurement) were performed on 88% of children who failed the initial screening. Hearing loss and vision impairment were confirmed in 54% and 58% of cases, respectively. Though not provided by the authors, this would suggest a prevalence of combined vision and hearing impairment of 0.36%.
Wittich et al. (2012) analysed demographic and sensory information of individuals receiving rehabilitation through one of the three deafblind programmes in Montréal, Canada. Using this method, they identified 564 individuals with deafblindness aged 4 months to 105 years, with 5.7% of the sample under 18 years of age. The portion of this population found to have Usher syndrome was significant at 20.9%. The authors also identified individuals with rarer congenital conditions, such as CHARGE syndrome and Norrie disease (Wittich & Simcock, 2019).
Grey literature
The grey literature search yielded 11 records addressing the prevalence of childhood deafblindness (Table 3). Some of these reports contained overlapping data. In addition to this, some reports generated outcomes by extrapolating prevalence estimates beyond the populations in which the data collection originally took place. Counts or estimates of prevalence were often derived from data collected in primary reports from the WFDB (2018), Robertson and Emerson (2010) and the annual National Child Count of Children who are Deaf-Blind (NCDB, 2020).
Grey literature meeting the literature review inclusion criteria.
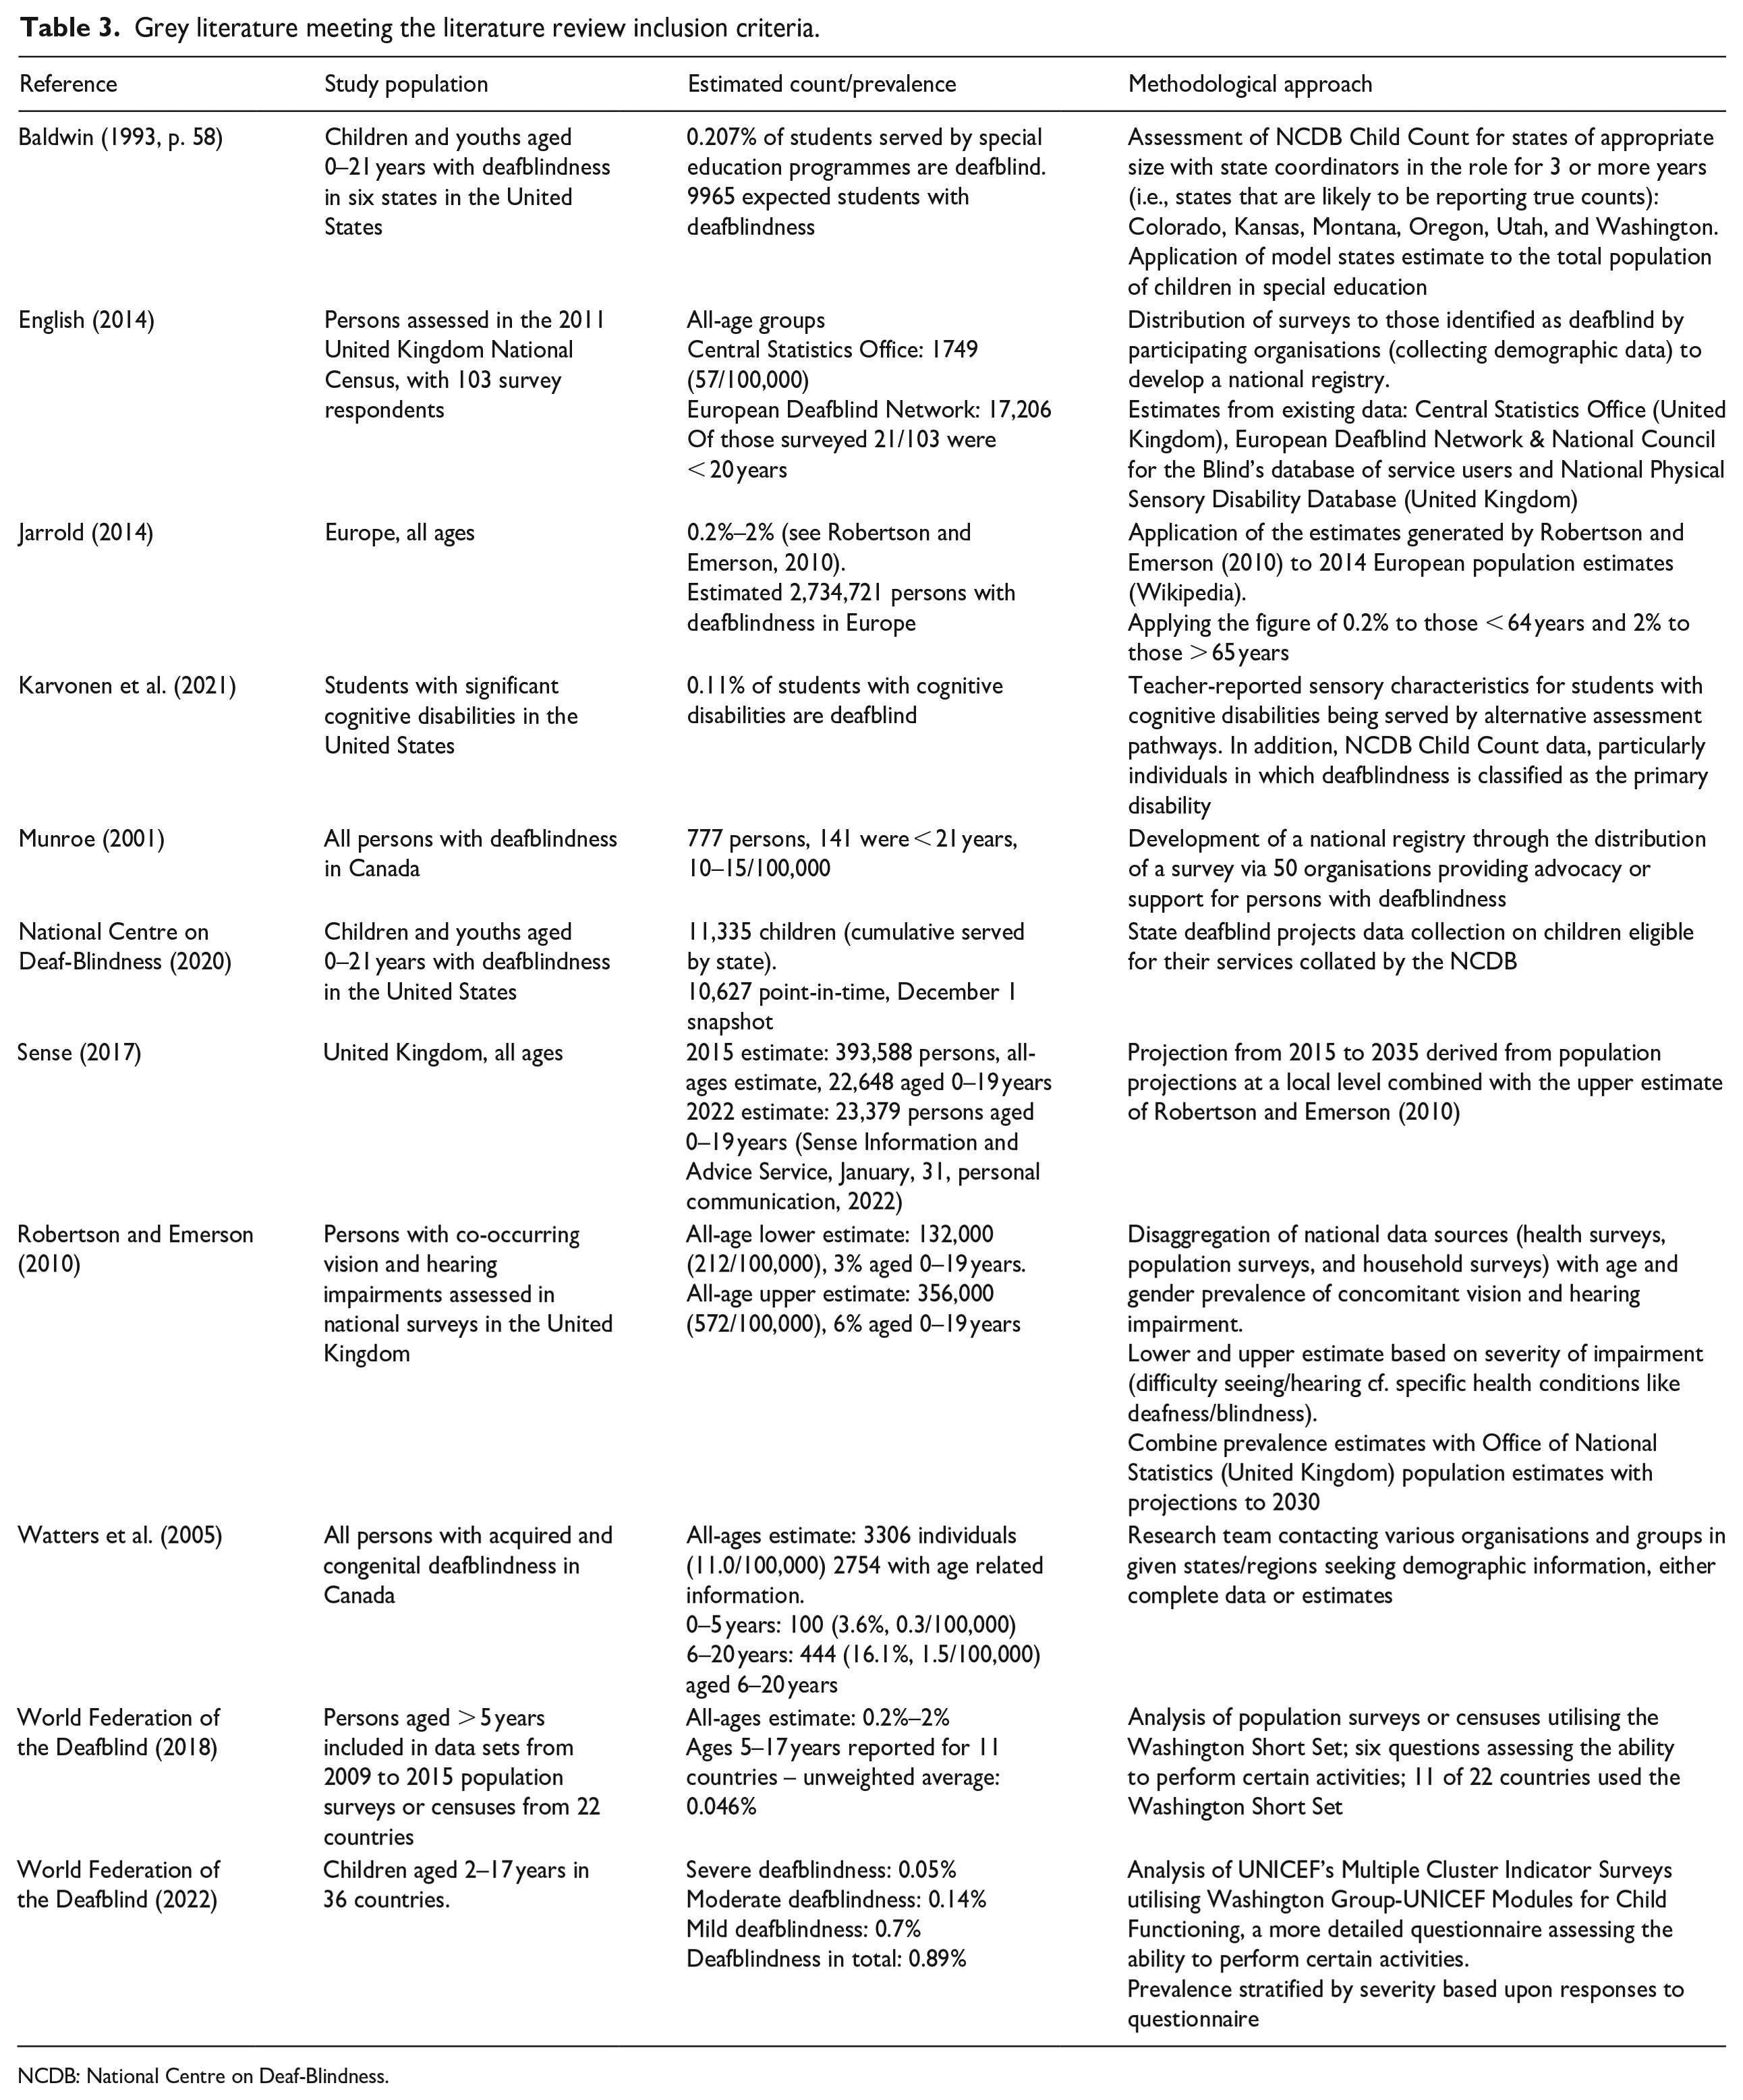
NCDB: National Centre on Deaf-Blindness.
The WFDB report titled ‘At Risk of Exclusion from CRPD and SDGs Implementation: Inequality and Person with Deafblindness’ (WFDB, 2018) was based upon 22 population-based surveys or censuses conducted from 2009 to 2015, on persons aged > 5 years from surveys. This report determined an all-ages prevalence of 0.2%–2%. We calculated an unweighted average prevalence of 0.046% in children aged 5–17 years based on available data from 11 countries. More recently, the Second Global Report on the Situation of Persons with Deafblindness (WFDB, 2022) sought to determine how deafblindness impacted health and wellbeing outcomes in 36 countries. Only one of these 36 countries was included in the previous report from 2018. Highlighting the significant differences in reporting of deafblindness in children (even within two similar publications from the same organisation), the 2022 report stratified prevalence by severity – severe, moderate, and mild – arriving at 0.05%, 0.14%, and 0.7%, respectively, and with a total of 0.89% of children aged 2–17 with some degree of deafblindness. Both reports utilised data from questionnaires assessing the ability of children to perform certain activities, such as seeing, hearing, walking, communicating, or conducting self-care (WFDB, 2018, 2022).
In a report commissioned by Sense UK, Robertson and Emerson (2010) used harmonised data from 12 different health, population, or household surveys conducted between 1996 and 1997, and between 2003 and 2008 to estimate the prevalence of deafblindness in the United Kingdom. The authors calculated upper and lower estimates based on the combined severity of vision and hearing impairment. The upper estimate, based on a less severe definition of deafblindness (i.e., any degree of difficulty in hearing or seeing without aid), suggested 572 persons per 100,000 had deafblindness, with 6% (34/100,000) aged 0–19 years. The lower estimate corresponded to specific disabilities or health conditions, such as conductive, nerve or noise induced deafness, cataracts, restricted vision, and so on, and indicated a prevalence of 212 persons with deafblindness per 100,000, with 3% (6/100,000) aged 0–19 years.
The most recent US National Child Count of Children and Youth who are Deaf-Blind provided a count of 11,335 children aged 0–21 years with deafblindness eligible for state deafblind services (NCDB, 2020). The report noted the significant discrepancy between this and the much lower count (1606 children) by the Department of Education Office of Special Education Programme. The lower figure reflected a stricter inclusion criteria as a case was only counted when deafblindness was listed as the individual’s primary disability, rather than simply eligibility for state support.
Deafblindness estimates
We highlight that many peer-reviewed samples were non-representative, with studies failing to be conducted in the context of the overall populations. This significantly affected the generalisability of such samples for estimating prevalence. Furthermore, the prevalence estimates were not necessarily comparable across studies due to stark differences in data quality, definitions, methodology and modelling approaches (Byass, 2010). Therefore, to avoid misrepresentation of data, information in Tables 1 and 3 are presented ‘as is’ rather than making proportional calculations using non-representative samples.
Noting the differences in approaches, we report that peer-reviewed studies provided variable estimates of prevalence from 1 to 11 children per 100,000 with deafblindness (Rogers, 1996; Wittich et al., 2012) to as high as 300–360 per 100,000 (Eksteen et al., 2022; Lindén-Boström & Persson, 2015). The grey literature demonstrated similar variance; from 10 to 15 per 100,000 children (Munroe, 2001; Watters et al., 2005) to 110 per 100,000 (WFDB, 2018) or 890 per 100,000 (WFDB, 2022).
Discussion
Accurate estimation of childhood deafblindness presents considerable challenges. Although several major grey literature reports exist, there remains a paucity of peer-reviewed literature accurately assessing the prevalence of childhood deafblindness. Peer-reviewed prevalence studies frequently explored pre-existing counts (Anthony, 2016; Huebner et al., 1996) or were limited to smaller, specific population groups (Aghaji et al., 2017; Hamblion et al., 2012; West et al., 2015; Wittich et al., 2012). However, it should be noted that most scientific literature available for review presented findings on related conditions or demographic factors rather than prevalence. Use of this literature for the purposes of calculating prevalence thus risks misrepresentation. With this in mind, a true estimate of childhood deafblindness is most likely to be somewhere between the upper and lower estimates of Robertson and Emerson (2010). This is approximately 6–34/100,000, based on the robust approach adopted by these authors, which included disaggregation of multiple, large, nationally representative data sources from the United Kingdom. However, generalisation remained problematic given the variety of reports used and the reliance on self-reported survey data (Robertson & Emerson, 2010).
This scoping review sought to provide a descriptive overview of current approaches to establishing prevalence of childhood deafblindness. As such, a systematic critical analysis of each approach was beyond the scope of the current study (Arksey & O’Malley, 2005), however, a detailed evaluation is warranted in future research. The key methodological challenges in establishing the prevalence of childhood deafblindness are worthy of further consideration.
Defining, assessing and diagnosing deafblindness
A lack of consistency in defining, assessing and diagnosing deafblindness remains an unresolved issue (Dammeyer, 2011; Minhas et al., 2022; Wittich et al., 2012) and was evident in reports assessed in this study (Table 2). This was particularly evident in the work by Robertson and Emerson (2010) where the lower and upper estimates of prevalence corresponded to more or less strict definitions of deafblindness. This resulted in a difference of more than 350 persons per 100,000 between these bounds. Similarly, the 2022 WFDB report stratified prevalence by severity with the difference between ‘severe’ and ‘mild’ deafblindness being 650 persons per 100,000. This trend was also apparent when studies assessed deafness and blindness separately where measurements of deafness and/or blindness vary significantly between studies (e.g., Eksteen et al., 2022 cf. West et al., 2015 cf. Dammeyer, 2010). Attempts at a unified definition have been made (Danermark & Möller, 2008), and work is currently being undertaken by a Dutch consortium to develop a functional definition (Deelkracht, 2023), however, significant diversity in definitions and inclusion criteria remain (Ask Larsen & Damen, 2014) and may contribute to the variation of prevalence estimates.
Co-occurring disabilities
Deafblindness may not always be considered an individual’s primary disability presenting challenges in identifying this population. Up to 87% of children with deafblindness may have one or more additional disabilities, often cognitive (NCDB, 2020). For example, Karvonen et al. (2021) identified a prevalence of deafblindness in students with significant cognitive disability as 0.11%, based on teacher-reported measures of sensory characteristics. However, it was noted that this was likely an underestimation due to the frequent under-identification of sensory loss in individuals with cognitive disability (Kiani & Miller, 2010; Nikolopoulos et al., 2006).
The relationship between sensory and cognitive disabilities is reciprocal as individuals with cognitive or learning disabilities are also more likely to have hearing or vision impairments and/or sensory processing difficulties when compared to the general population (Beange et al., 1995; Engel-Yeger et al., 2011; Evenhuis et al., 1996; Warburg, 1994). There is also an increased likelihood of deafblindness in people with more severe cognitive disability (Evenhuis et al., 1996; Meuwese-Jongejeugd et al., 2008).
There is a clear trend of under-identification of deafblindness in children (Baldwin, 1993; Huebner et al., 1996; Karvonen et al., 2021; NCDB, 2020). Therefore, when considering individuals receiving disability services, it is crucial to recognise the likelihood of under-identification of combined vision and hearing impairment, particularly in children with multiple and cognitive disabilities. Furthermore, other disabilities, such as intellectual and physical disabilities, may overshadow sensory disabilities, resulting in under-reporting of deafblindness (Prain, 2005).
To address potential under-diagnosis, combined assessment methods similar to those presented by Dammeyer (2010) show promise. This approach involved both self-assessed functional impact and objective physiological assessment of mean tone threshold and visual acuity, though visual fields were not measured, potentially excluding those with Usher syndrome and others. However, the application of this combined assessment method may be challenging for individuals with deafblindness who may be unable to participate due to comorbidities. A more unified approach to the assessment of vision and hearing of children with multiple and/or cognitive disabilities is needed.
Non-representative samples
A variety of approaches to estimating childhood deafblindness prevalence were evident with reliance on non-representative samples being common. Most studies addressed demographic factors or related conditions rather than actual childhood deafblindness prevalence. For example, the population described by Aghaji et al. (2017) estimated the number of deafblind children attending schools for the deaf or schools for the blind, in a low- or middle-income country. In comparison, the general population of preschool children in Cape Town, South Africa, assessed by Eksteen et al. (2022), was more representative of the population of preschool children and thus yielded more generalisable results.
The population assessed by Wittich et al. (2012) only included those receiving rehabilitation services in Greater Montreal, Canada, and provided an all-age population estimate of 15/100,000 of which 5.7% (~1/100,000) were < 18 years. However, not all people with some degree of deafblindness necessarily receive rehabilitation services, so this figure was likely an underestimation.
The population studied for prevalence of deafblindness in the literature is often broad. As such it is reasonable to assume that deafblindness typically acquired in adulthood would make up a significant proportion of this population. However, such non-representative all-age samples makes generalisation to a childhood population difficult. Seeking out populations naturally enriched with deafblind people, such as children attending schools for the deafblind or databases for persons with deafblindness, and those persons attending rehabilitation clinics (e.g., Aghaji et al., 2017; Dammeyer, 2010; West et al., 2015 and Wittich et al., 2012) made finding actual instances of deafblindness more likely than screening whole populations. Unfortunately, the prime aim of these reports was not to establish prevalence.
Furthermore, service organisation databases may not adequately identify individuals with deafblindness (Prain, 2005). Reliance on such databases naturally excluded those not receiving organisational support, those who were ineligible or who preferred not to be registered. In addition, some databases only listed a primary disability, necessitating the choice between deafness or blindness when ‘deafblindness’ was not an option. Even when multiple disabilities could be listed, there were still not always sufficient options to include deafblindness (Prain, 2005).
Consideration of the paediatric population
The reviewed literature was often restricted to disparate age groups, for example, 0–5 years (Anthony, 2016), 4–7 years (Eksteen et al., 2022), 7–22 years (Sukontharungsee et al., 2006), 5–17 years (WFDB, 2018), or 2–17 years (WFDB, 2022). Many reports provided both an all-ages prevalence of deafblindness with demographic information (e.g., age, sex, location), which allowed calculation of childhood deafblindness (English, 2014; Jarrold, 2014; Robertson & Emerson, 2010; Watters et al., 2005). Given the variation of the prevalence of deafblindness with age (Dammeyer, 2014; WFDB, 2022) both inconsistent age bracketing and the reliance on all-ages estimates may prevent reaching an accurate estimate. This difference in approach was exemplified across the two WFDB reports (WFDB, 2018, 2022). The 2018 assessment used general population surveys and provided an all-ages prevalence of 0.2%–2%, with the 5–17 years age range reported for 11 of 22 countries. In comparison, the 2022 report used a more detailed functional assessment for children aged 2–17 years and stratified prevalence by severity. Perhaps due to the specific assessment approach of the 2022 report, a higher prevalence was established. This highlighted the need for a tailored assessment of the paediatric population, rather than assumptions drawn from the all-ages data available at the time.
Small groups, large data sets
The literature also revealed a tendency to generate estimates from counts based on a limited number of reports, and even identical reports. The rarity of deafblindness also created difficulty with using health surveys or census data to account for groups of such low incidence (i.e., below the reportable threshold suggested by Boulet et al., 2009). Applying weightings with so few cases may introduce significant standard error and is likely to affect estimates based on population-level data. Data sets need to be of sufficient size to reach relevant estimates regarding the prevalence of such low-incidence conditions. In the Australian context, Dyke (2013), discussed the 2009 Survey of Disability, Ageing and Carers, and reported significant standard errors (from 25% to greater than 50%), particularly for the 0- to 59-year-old age range. This highlighted the difficulties associated with relying on relatively small data sets for low incidence health conditions, such as deafblindness. Robertson and Emerson (2010) allayed this effect by basing estimates on several, harmonisable population surveys and provided a model for establishing prevalence in any population with robust public health surveying/monitoring.
Comparatively, Boulet et al. (2009) utilised a single data set to assess co-occurring disabilities. The authors reported co-occurring disabilities above a defined threshold, and given the relative rarity of individuals with deafblindness, data for co-occurring deafness and blindness was therefore not reported. This approach does not guarantee representation of all individuals however, rare they might be. By accessing the same IPUMS (Integrated Public Use Microdata Series) Health Survey data set (Blewett et al., 2022) used by Boulet et al. (2009) and filtering for the identification criteria of ‘blind or unable to see at all’ AND ‘deaf or a lot of trouble hearing’ only three potential individuals with deafblindness would be identified within the sample (n = 96,345). This example demonstrated that applying sample weights to reach a prevalence estimate introduced significant bias, highlighting a data set design challenge for low-incidence conditions.
National counts and generating estimates
Where studies provided a count, it was possible to suggest a prevalence by comparing the count to matched populations. In those studies that cited the NCDB (e.g., Anthony, 2016; Huebner et al., 1996) prevalence was estimated by taking the US population (0–21 years), the year the count was conducted and applying that year’s count. As part of their analysis, Sukontharungsee et al. (2006) also took this step, generating a US prevalence estimate of 0.0032%. By performing a similar calculation for the most recent report (NCDB, 2020) with matched census data (U.S. Census Bureau, 2021), a prevalence estimate of approximately 10 per 100,000 (0.010%) can be estimated. However, this approach excluded those children not receiving support services from these estimates. This figure was considered to be a significant underestimation (NCDB, personal communication, February 24, 2022; see also Baldwin, 1993, consistent with the analysis from Ward & Zambone, 1992), especially when compared with the US estimate of 110/100,00 (0.110%) from the 2018 WFDB report.
A similar estimate can be reached using the most recent figures from Sense (2017). By combining a count of 23,379 (Sense Information and Advice Service, 31 January, personal communication, 2022) with the recent UK population data (Office for National Statistics, 2021) an estimate of approximately 147/100,000 (0.147%) was established. This is somewhat higher than the WFDB estimate of 0.11% for the comparable US population (WFDB, 2018). This further emphasises the inherent difficulty in annual count approaches that appeared to be accounting for approximately one tenth of the expected childhood deafblind population.
Inclusion of children with Usher syndrome
Several diagnostic subsets exist under the umbrella of childhood deafblindness including Usher syndrome. In the case of Usher syndrome, a medical definition provides increased case identification rather than a functional assessment alone. To ensure an accurate childhood deafblindness estimation, the representation of children with Usher syndrome is vital. However, due to the nature of this condition, the inclusion of children with Usher syndrome is methodologically challenging. Deafness associated with Usher syndrome is typically congenital and pre-lingual, whereas vision impairment, involving the loss of visual field and visual acuity, is gradual (Toms et al., 2015). In other words, Usher syndrome represents a congenital, acquired deafblindness (Kimberling & Möller, 1995). Notably, West et al. (2015) included children who had a diagnosis of Usher syndrome (or prospective deafblindness), but functionally did not have deafblindness, and therefore would not typically be counted as such. West et al. (2015) thus implemented a physiological assessment to capture prospective deafblindness, that is, those where symptoms were not sufficiently severe to be counted on most in population-level surveys that relied on functional impairment only.
Prospective deafblindness (West et al., 2015) as is the case in Usher syndrome raises methodological issues when considering a prevalence figure for childhood deafblindness. It is unclear where Usher syndrome fits within definitional conceptualisations of congenital deafblindness, when aetiological grounds are applied (Ask Larsen & Damen, 2014). A child may be diagnosed with Usher syndrome early, either genetically or via electrophysiology, and timely intervention with cochlear implants can rehabilitate hearing. They may then develop significant vision impairment in their teens or later, depending on the subtype (Davies et al., 2021). However, due to this later onset of vision impairment, people with Usher syndrome may only enter deafblindness counts later in life, which may risk denying them support and exacerbating under-representation. Where then do these children fit into our models or estimates of deafblindness? At what point are they to be included in prevalence data? These questions are of particular importance given the significant proportion of deafblindness caused by Usher syndrome and improvements in genetic testing resulting in diagnosis prior to the onset of functional vision impairment (Kimberling et al., 2010; Matsunaga, 2021). This under-representation or possible exclusion of Usher syndrome from prevalence estimates is antithetical to research demonstrating the value of early identification and support (Stiff et al., 2020).
Recommendations
Based upon the challenges identified within this scoping review, we propose the following recommendations to address the barriers inherent in establishing prevalence of childhood deafblindness.
Priority should be given to gaining consensus on a universal definition of childhood deafblindness that includes the diverse populations identified in this article. This includes children diagnosed with Usher syndrome and children with multiple disabilities, including deafblindness and processing disorders.
Improved data capture and the ability to identify children with deafblindness of all ages. In a local context, this may be facilitated by modified data collection on a national scale or surveillance programmes linked to existing support networks.
Implementation of surveillance programmes with the demonstrated ability to capture people with either deafness in the form of sensorineural hearing loss (West et al., 2015), vision impairment (Rogers, 1996) or blindness arising from IRDs (Hamblion et al., 2012). These surveillance programmes must reflect a holistic and combined response, to ensure the identification of people with hearing and vision impairment, rather than capturing only those who are deaf or blind, but not both.
Conclusion
This article has outlined the multifactorial challenges associated with estimating the prevalence of childhood deafblindness. It has revealed that all existing strategies for establishing and reporting the prevalence of deafblindness in children have methodological complications. A variety of data types can capture individuals at all levels, from broad-reaching population surveys to smaller, personalised registries. However, rather than relying upon a single census or survey type, the considered use of multiple, harmonisable data sets can ensure the reliability of estimates (Robertson & Emerson, 2010).
It is important to be cautious when using existing data to reflect prevalence, particularly when the sample is not representative, when the data have been gathered for other purposes but are interpreted with the aim of establishing prevalence, and when it overlaps or even duplicates other studies. Also, relying on reporting from service organisations may exclude people who are not receiving support, who are ineligible or who prefer not to be counted. Finally, there is an urgent need for deafblindness to be recognised as a primary disability whether congenital or acquired, not just as a sum of deafness and blindness. Without this recognition, people with deafblindness remain at risk of anonymity.
Footnotes
Declaration of conflicting interests
The author(s) declared no potential conflicts of interest with respect to the research, authorship, and/or publication of this article.
Funding
The author(s) received no financial support for the research, authorship, and/or publication of this article.