
Abstract
Young people may adapt to vision impairment (VI) in a variety of ways. To explore heterogeneity in social participation, data were mined for distinct patterns. Existing data from 258 young people with VI, aged between 26 and 44 years (M = 35.3 years; SD = 5.07), were clustered. Social participation was measured by four closed-ended questions and the Social Network Map. Loneliness was measured by the De Jong Gierveld Loneliness scale. K-medoids clustering with the Partitioning Around Medoids (PAM) algorithm was used to cluster social participation variables and age.Eight clusters were identified, with participants in the two largest clusters, clusters 1 (n = 84) and 2 (n = 50), scoring high on almost all social participation outcomes. Participants in cluster 8 (n = 14) had the lowest social participation scores. However, also over half of the participants in clusters 4, 5, 6, and 7 experienced feelings of loneliness. Findings demonstrate considerable heterogeneity in social participation among young people with VI, which however does not link to loneliness. These variations in social participation underline the need for a differentiated approach to address needs of young people with VI.
Keywords
Introduction
In the International Classification of Functioning, Disability and Health (ICF), the concept of participation is defined as “involvement in a life situation” (Imms et al., 2017; World Health Organization [WHO], 2007). Social participation not only covers the performance and capacity aspect of participation but also covers social embeddedness and integration (Heppe et al., 2020). Three such key life situations are social and romantic relationships, education and employment, and leisure. Young people with vision impairment (VI) evinced disadvantages in social participation compared to their peers (Elsman et al., 2019; Gold et al., 2010), as they had smaller social networks (Bathelt et al., 2019; Kef et al., 2000), were less often involved in romantic relationships (Kef & Bos, 2006; Pfeiffer & Pinquart, 2011), were more often unemployed (McDonnall, 2010; McDonnall & McKnight, 2021; Shaw et al., 2007), and experienced problems with finding and participating in suitable leisure activities (Belknap et al., 2022; Gold et al., 2010). These difficulties young people with VI face can affect their personal well-being. However, not all young people with VI experience similar difficulties when it comes to social participation (Salminen & Karhula, 2014). Studying heterogeneity within the population might correct potentially one-sided views of inequities in social participation of young people with VI.
The impact of VI on social participation is not merely based on characteristics of the impairment itself but also depends on personal and contextual factors (Salminen & Karhula, 2014; Van Leeuwen et al., 2015; WHO, 2007). This means that among young people with similar VI, social participatory success may differ between individuals. This heterogeneity within diagnostic populations has been described specifically for neurodevelopmental disorders (e.g., Khundrakpam et al., 2021; Kofler et al., 2017; Tan et al., 2020). Based on the assumption that inter-individual differences in social participation may reflect differentiated support needs, it might be of great importance for those who support young people with VI to gain more insight into the heterogeneity in social participation of young people with VI.
Initial insights into the heterogeneity in social participation of young people with VI related to different levels of severity of VI (Bathelt et al., 2019; Gold et al., 2010; Lund & Cmar, 2019; McDonnall & McKnight, 2021; Shaw et al., 2007). Overall, more severe VI was linked with fewer forms of social participation. However, while severity of VI might reflect an obvious support target, VI impairment may itself be only partially treatable. Therefore, other support needs may be relevant as well. Therefore, this study was aimed to explore the heterogeneity in social participation among young people with VI. This aim was pursued by asking how a parsimonious set of subgroups of young people with VI may be created to describe differences in social participation. The potential needs of these subgroups will be explored by describing their background characteristics.
Given the universal psychological need for social connectedness, people with VI may be strongly motivated to overcome any impediments that their VI may present against social participation and may experience strong feelings of frustration and loneliness if such efforts fail (Deci & Ryan, 2000; Ilhan et al., 2016). This may be especially the case when people are highly susceptible to social stimuli, such as young people during adolescence and young adulthood (Crone & Dahl, 2012). Differences in patterns in social participatory success between subgroups of young people with VI may thus relate to differences between subgroups in personal well-being, such as feelings of loneliness. Therefore, a second aim of this study was to explore how different patterns in social participation may be related to experiences of loneliness.
Materials and methods
Design
For this cross-sectional study, existing data from the Dutch National Cohort Study of Persons with VI was used (Kef & Bos, 2006; Kef et al., 2000). Initially, this cohort started in 1996 with the first sample of 316 adolescents with VI. In 2004, the second sample of 154 adolescents with VI was added to the cohort, and the first sample was interviewed for the second time (n = 205). Both samples were interviewed again in 2010 (first sample n = 179 and second sample n = 112) and in 2016 (first sample n = 161 and second sample n = 98). Data from the measurement in 2016 of both samples of young people with VI were used in this current explorative study (n = 259). Because the prevalence of VI in the Netherlands remains unknown, it is unclear if the sample of young people with VI in this study is representative of the total population of young people with VI in the Netherlands.
Procedure
In 1996, participants were recruited through two Dutch low-vision rehabilitation organizations using an invitation letter. The same recruitment strategy was used in 2004 for the second sample. All participants received an information letter and signed an informed consent form by sending back a reply card in a self-addressed envelope. During both recruitment periods (1996 and 2004), participation of the adolescents was based on the following eligibility criteria: (1) having VI, (2) aged between 14 and 24 years old, (3) understanding the Dutch language, and (4) having no severe additional impairments (e.g., intellectual disability or being deaf/hard of hearing). All participants had received care at a young age from the two national low-vision rehabilitation organizations. Before every new measurement wave, participants were assessed for eligibility by the primary researcher on the same criteria as by the start of the study in 1996 and 2004, except for the age range. After every measurement, participants provided permission for being contacted for future measurements.
Interviews in 2016 were conducted over the phone by trained interviewers using computer-assisted telephone interviews (CATIs). With the use of CATI, all questions were read out loud by the interviewers, and answers were registered by the interviewer in a structured computer format. The use of CATI minimized missing data within the questionnaires. No incentives were provided for participation in the study. The study design was approved by the Ethics Committee of Vrije Universiteit Amsterdam, the Netherlands (VCW.1310010).
Study participants
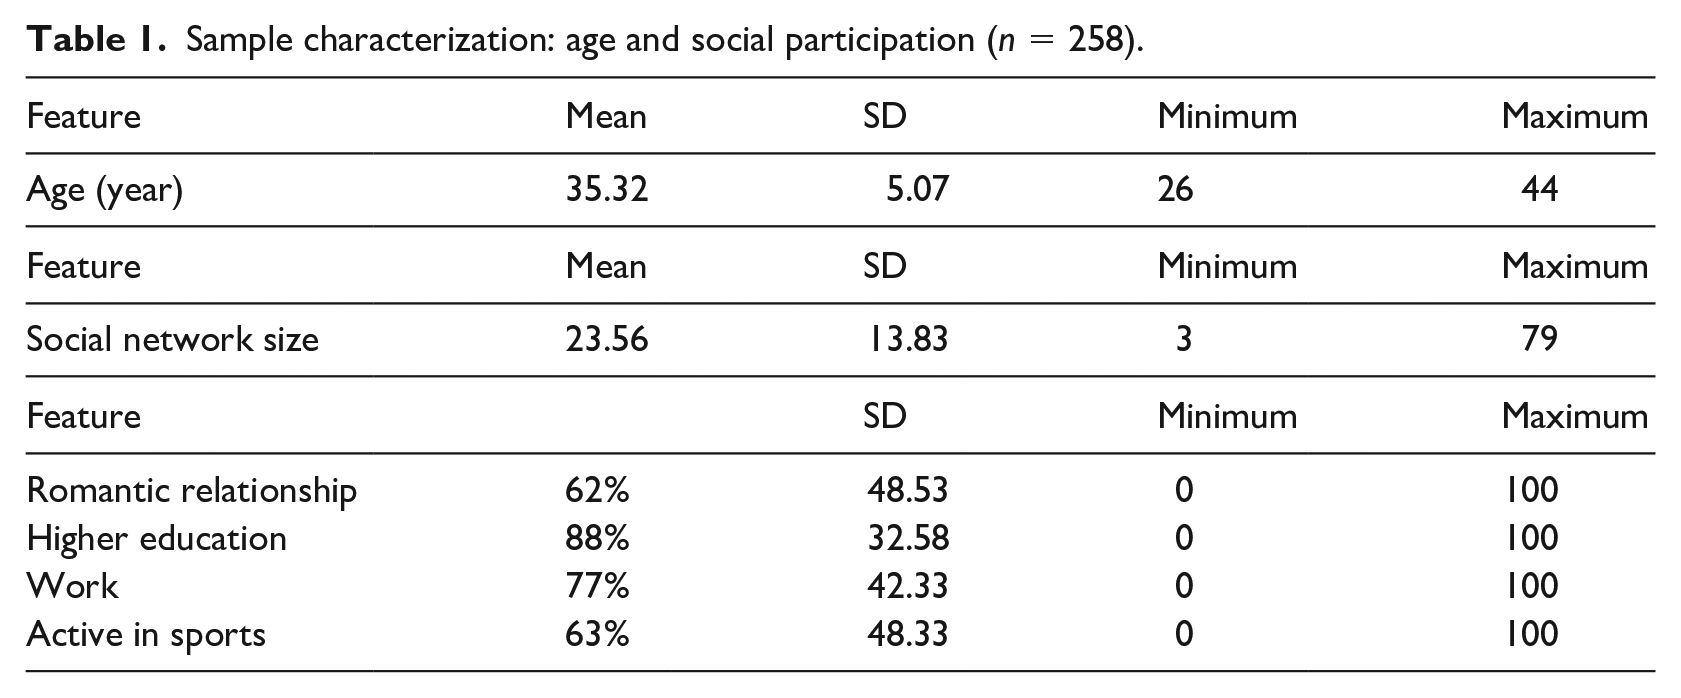
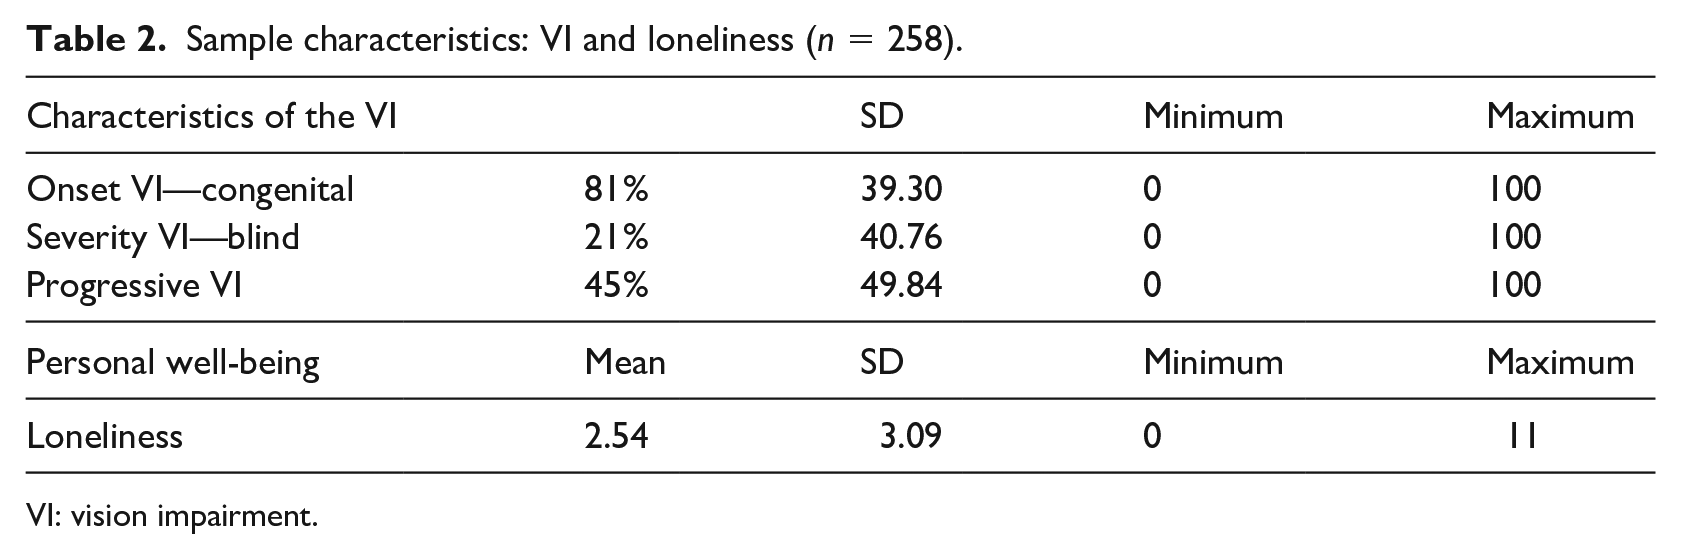
In total, 258 young adults participated in this study. Only one participant was excluded because of missing values on five of the six cluster variables. There was an almost equal gender distribution (54% male) among participants. Their mean age was 35.32 years (SD = 5.07) ranging between 26 and 44 years, as shown in Table 1. Table 2 shows that overall, 81% of the participants had congenital VI, 45% had progressive VI, and 21% were blind.
Sample characterization: age and social participation (n = 258).
Sample characteristics: VI and loneliness (n = 258).
VI: vision impairment.
Questionnaires
Social participation: The size of the social network was measured using the Social Network Map (Tracy & Whittaker, 1990). With this measure, the number of listed important persons within different social network sectors was summed (e.g., family, friends, colleagues, neighbors, and support staff). Each unique social network member could only be named once. The size of the social network was calculated by summing the listed number of persons in each sector of the social network. To assess romantic relationships, education and employment, and leisure, four questions were asked (1) Are you currently in a romantic relationship?; (2) What is your highest educational degree?; (3) Do you currently have a job?; and (4) Do you currently do sports? Questions 1, 3, and 4 were answered by Yes or No. Question 2 was answered by (a) no degree, (b) primary school degree, (c) high school/secondary degree, (d) college/university degree and was dichotomized by combining options (a) and (b) and options (c) and (d) to having a high school/secondary degree or not. All four main questions included follow-up questions such as; for how long you have been in a relationship? what type of education did you follow? how many hours do you work? do you get paid for this job? what type of sport do you do? These follow-up questions were not used within the data analysis of this heterogeneity study and were merely used to check the correctness of the data.
Loneliness was assessed with the scale by De Jong Gierveld and Van Tilburg (1999). This questionnaire contains 11 items which were answered on a 3-point Likert-type scale (yes, more or less, and no). The score “more or less” is also scored as an indicator of loneliness, because people, in general, are reluctant to admit being lonely (De Jong Gierveld & Van Tilburg, 1999). All scores are dichotomized into yes and no. By summing all 11 items, a total score was computed. A minimum score of 0 refers to not being lonely, a maximum score of 11 refers to not being socially embedded, and a score of 3 or higher can be interpreted as having feelings of loneliness (De Jong Gierveld & Van Tilburg, 1999). The internal consistency of the scale was α = .88.
Characteristics of the VI: After asking age of onset of VI, the severity of the VI was assessed by the 6-item Functional Vision Scale of Weiner (Weiner ADSW, 1991). Answers on this scale (yes or no) were combined to create two categories: blind and low vision. The progressiveness of the VI was assessed by one question asking: Does your VI get worse over time or is your VI stable?
Statistical analyses
The clustering method applied is a k-medoids clustering based on the Partitioning Around Medoids (PAM) algorithm (Kaufman & Rousseeuw, 1981). It partitions the data into k clusters based on a selection of focal variables. In contrast to k-means clustering, the PAM approach uses observations as the center of a cluster. A medoid is the most central observation within a cluster. PAM is generally more robust than k-means clustering (Kaufman & Rousseeuw, 1981).
The variables selected for clustering were the size of the social network, being in a romantic relationship, high school degree or highest achieved education, having work, and doing sports. The social network size and age variable were continuous while the other four are binary (yes/no). Hence, we created a robust mixed-metric distance matrix based on the Gower distance as the basis for the PAM algorithm (Gower, 1971). The continuous variables were standardized before the computation of the Gower distance. The optimal number of clusters was subsequently determined using a silhouette width (Rousseeuw, 1987). This is a cohesion measure (ranging from −1 to 1) that, given a choice for k, indicates how well the observations are separated into cohesive clusters. We ran the PAM algorithm for k ranging from 2 to 10. The number of clusters for which the silhouette width attains its maximum value is deemed optimal. The PAM solution under the optimal number of clusters is subsequently used for cluster interpretation.
For the optimal number of clusters, the participants in each cluster were characterized based on the percentage of affirmative answers for binary variables, and the continuous variables “age” and “social network size” were standardized such that both variables are distributed with a mean zero and standard deviation 1. These were assessed based on Pearson chi-square tests with Monte Carlo–based p values or nonparametric analyses of variance (ANOVAs; Kruskal–Wallis rank-sum test), where appropriate (Dunn, 1964).
Results
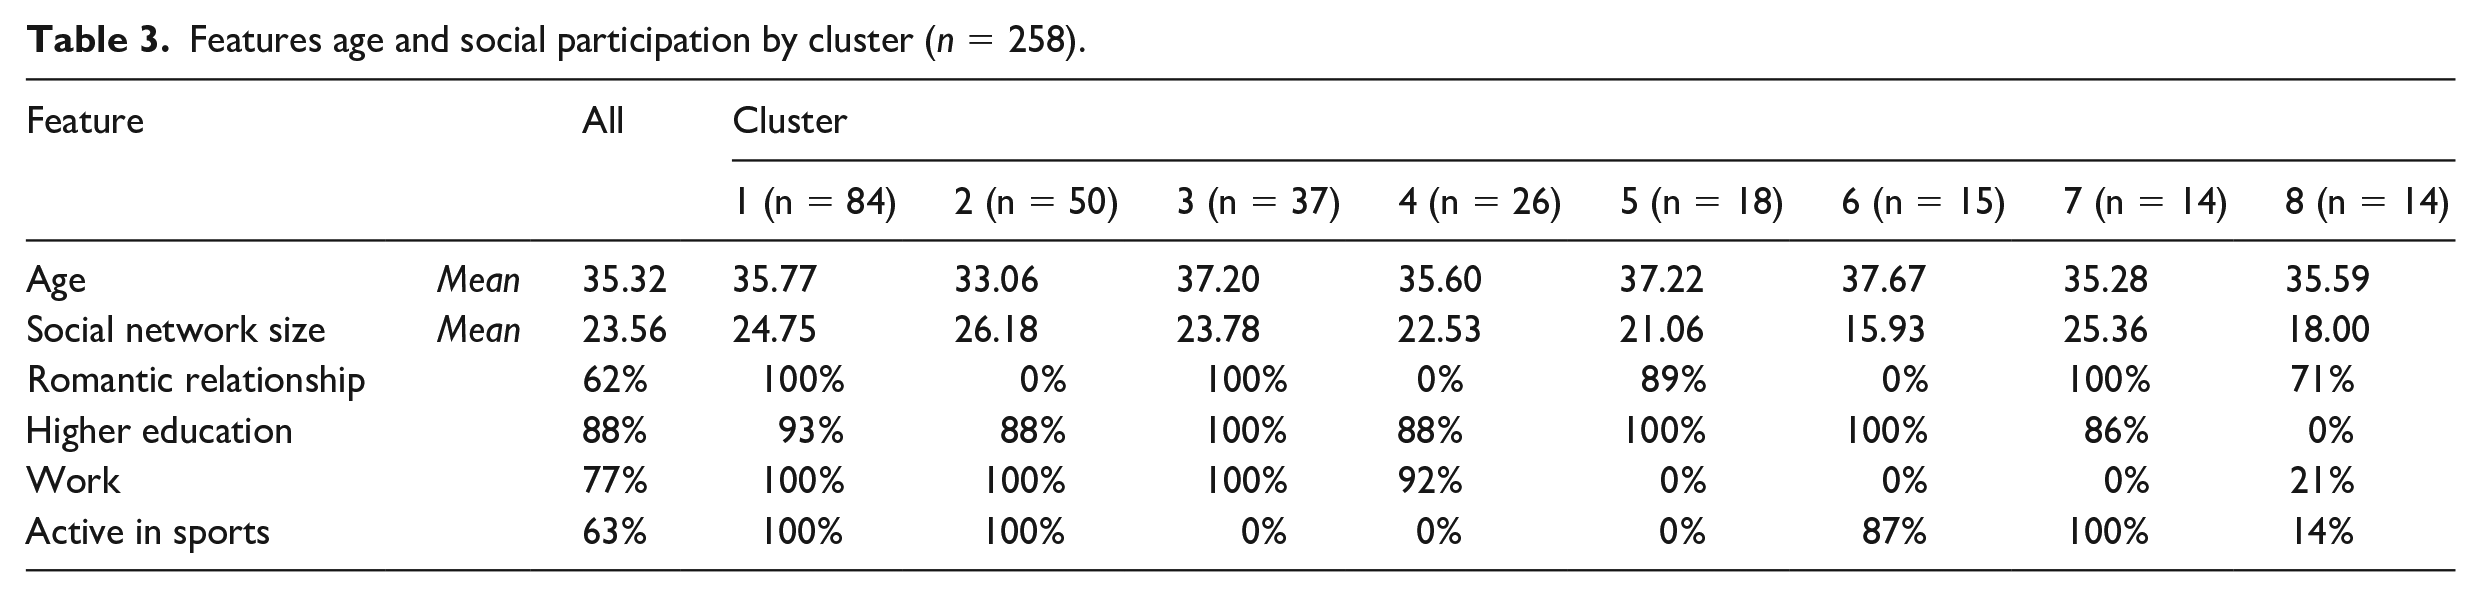
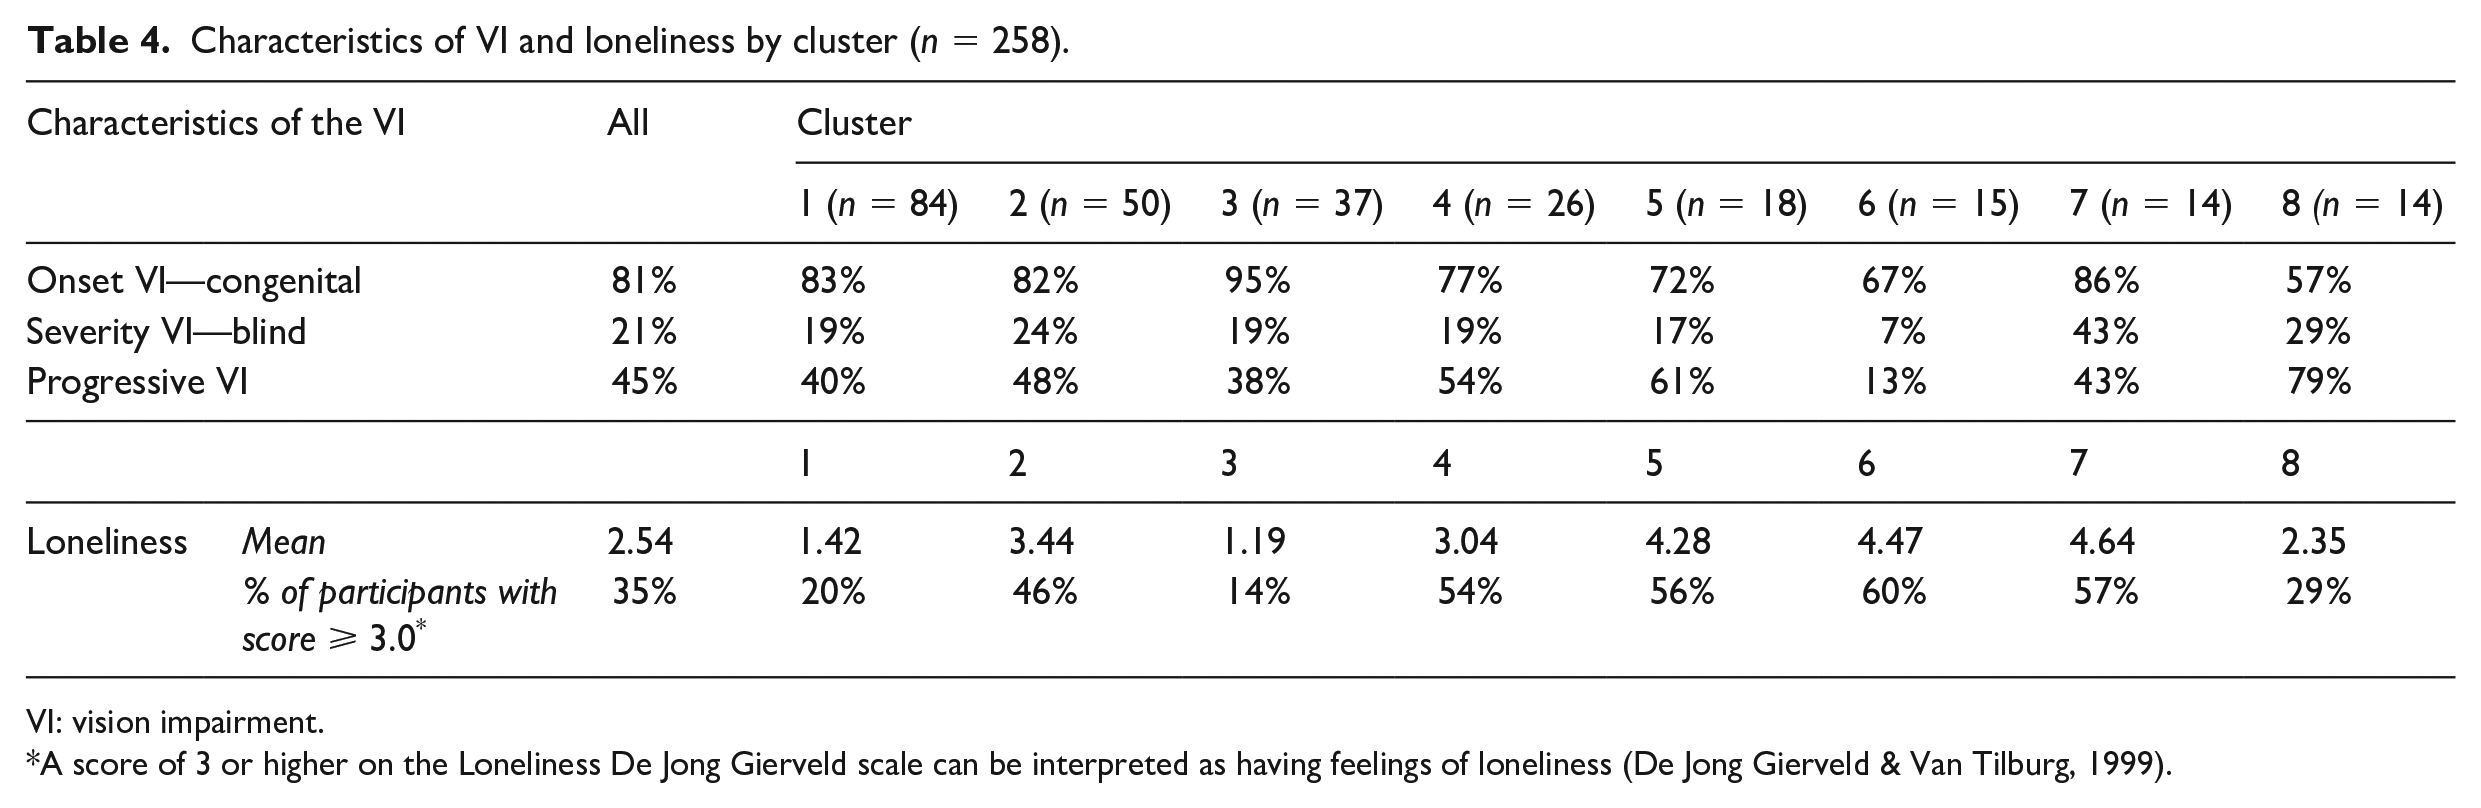
The silhouette width attained its maximum value (.55) at k = 8 clusters. Hence, 8 clusters were deemed optimal, and the cluster profile was based on the PAM solution at k = 8. These clusters were distinguished by highest achieved education, employment, sports, being in a romantic relationship, age, and social network size. The participants assigned to the clusters, shown in Table 3, were characterized by comparing the cluster-specific mean and percentage values with the mean and percentage values of the full sample. In addition, cluster-specific percentages for characteristics of the VI and the mean for loneliness with the percentage values and mean of the full sample are presented in Table 4.
Features age and social participation by cluster (n = 258).
Characteristics of VI and loneliness by cluster (n = 258).
VI: vision impairment.
A score of 3 or higher on the Loneliness De Jong Gierveld scale can be interpreted as having feelings of loneliness (De Jong Gierveld & Van Tilburg, 1999).
Cluster 1
Cluster one is the largest cluster with 84 participants (33%); 51% were female. Participants in this cluster had high scores on all social participation outcomes. Only 20% of the participants in this cluster had a score of 3 or higher on the loneliness scale.
Cluster 2
Cluster two is the second-largest subgroup of people with 30 participants (20%); 30% were female. This cluster had the lowest mean age of all the clusters. Participants in this cluster had high scores on almost all the social participation outcomes and the largest social network size. About 46% of the participants in this cluster had a score of 3 or higher on the loneliness scale.
Cluster 3
Thirty-seven participants (14%) were grouped into cluster 3; 43% were female. Participants in this cluster had high scores on almost all social participation outcomes. This cluster had the highest percentage of people with congenital VI. Cluster 3 had the lowest percentage of participants who had a score of 3 or higher on the loneliness scale.
Cluster 4
Twenty-six participants (10%) were assigned to cluster 4; 27% were female. Participants in this cluster had high scores on only two (highest achieved education and employment) of the social participation outcomes. Their social network size was slightly lower than that of the total sample. About 54% of the participants in this cluster had a score of 3 or higher on the loneliness scale.
Cluster 5
Eighteen participants (7%) were assigned to cluster 5; 67% were female. Participants in this cluster had high scores on only two (highest achieved education and being in a romantic relationship) of the social participation outcomes. Their social network size was slightly lower than that of the total sample. About 56% of the participants in this cluster had a score of 3 or higher on the loneliness scale.
Cluster 6
Fifteen people (6%) were assigned to cluster 6; 47% were female. Participants in this cluster had the highest mean age of all the clusters. Participants had high scores on only two (highest achieved education and being active in sports) of the social participation outcomes and had the smallest social network size. This cluster had the lowest percentage of people who were blind and people with a progressive VI. Cluster 6 had the highest percentage of participants who had a score of 3 or higher on the loneliness scale.
Cluster 7
Fourteen participants (5%) were grouped into cluster 7; 64% were female. Participants in this cluster had high scores on almost all social participation outcomes. This cluster had the highest percentage of people who were blind. Despite their high social participation, 57% of the participants in this cluster had a score of 3 or higher on the loneliness scale.
Cluster 8
Fourteen participants (5%) were assigned to cluster 8; 64% were female. Participants in this cluster had low scores on almost all social participation outcomes. This cluster had the lowest percentage of people with congenital VI and the highest percentage of people with progressive VI. Despite their minimal social participation, only 29% of the participants in this cluster had a score of 3 or higher on the loneliness scale.
Discussion
Following the first aim of the study, on how a parsimonious set of subgroups of young people with VI may be created to described differences in social participation, eight subgroups of young people with VI were identified based on clustering indicators of social participation and age. This shows that social participation is achieved in a heterogeneous fashion by young people with VI. In previous studies, in which differences between young people with VI on social participation outcomes were mostly examined by the severity of the disability, often two (e.g., low vision and blind) or three subgroups (e.g., mild VI, profound VI, and severe VI) were identified (Bathelt et al., 2019; Gold et al., 2010; Lund & Cmar, 2019; McDonnall & McKnight, 2021; Shaw et al., 2007). Using a person-centered approach in analysis, novel configurations of type and severity of VI, age, social participation, and loneliness were uncovered. These configurations give rise to new hypotheses about the ways in which social participation may or may not be related to severity of the VI in people with VI.
The number of participants in each of the eight subgroups varied widely, with the two largest subgroups (clusters 1 and 2) including 52% of the participants. Participants in these two subgroups were similar concerning their social participation outcomes and were successful on all social participation outcomes, with the exception that people in cluster 2 were not involved in a romantic relationship. Almost all subgroups (cluster 1 t/m 7) were successful on two or more social participation outcomes. Most of the clusters were successful with obtaining a high school degree, except for people in cluster 8. In four of the eight clusters, a low percentage of people were employed. However, these clusters were the smallest and included only 21% of the total sample. These results indicate that most of the young people with VI in this sample were relatively successful on multiple social participation outcomes.
Participants in the two largest subgroups were quite similar concerning the characteristics of their VI. Most of them had early onset VI, only a small proportion was blind, and less than half had a progressive VI. Subgroups 2, 3, 5, and 7 had a higher percentage of young people with congenital VI compared to the total sample. These four subgroups also had a higher mean social network size compared to the total sample and had high scores on obtaining a high school degree. However, these subgroups differed from each other on the other social participation outcomes (employment, being active in sports, and being in a romantic relationship). For the other two characteristics of the VI (severity of the VI and progressive or stable VI) also no distinct patterns for social participation outcomes were apparent. This emphasizes that social participatory success is not merely based on characteristics of the impairment (WHO, 2007).
A variety of patterns in social participation were found for clusters with either an older or a younger subpopulation. Subgroups in which nobody was active in sports often had a mean age that was higher than the average mean age. However, also for age, the subgroups differed from each other on all other social participation outcomes.
The secondary aim of this study was to explore how different patterns in social participation may be related to experiences of loneliness. Only one cluster (cluster 1) had high scores on all social participation outcomes and a low percentage of people experiencing feelings of loneliness (20%). In cluster 8, with the lowest indicators for successful social participation, only 29% reported experiencing feelings of loneliness. The two clusters, cluster 6 and 7, with the highest percentages of people experiencing feelings of loneliness (57% and 60%) had different scores on social participation, with cluster 7 scoring high on almost all social participation outcomes and cluster 6 scoring high on only two. Looking into more detail, clusters 1, 3, and 8 with the lowest percentage of people experiencing feelings of loneliness (between 29% and 14) had a high percentage of people being involved in a romantic relationships. In contrast, two clusters with a high percentage of people being involved in a romantic relationship (clusters 5 and 7) were also in the top three clusters with the highest percentage of people experiencing feelings of loneliness. Furthermore, in the top three clusters with the highest percentage of people experiencing feeling of loneliness (clusters 5–7) nobody was employed. However, in clusters in which a high percentage of people were employed (clusters 1–4) either high or low percentages of people who experienced feelings of loneliness were found. Also, no link can be found between being active in sports and experiencing feelings of loneliness. Based on these findings, no link can be found between the different patterns in social participation and the subjective feelings of loneliness.
In two clusters (clusters 6 and 8), participants had a smaller mean social network size compared to the total sample. In cluster 8, only 29% of the people experienced feelings of loneliness, and in those assigned to cluster 6, 60% experienced feelings of loneliness. In cluster 2 with the highest mean social network size (26.18 people), half (46%) of people experienced feelings of loneliness. These findings are in line with previous studies showing that the quality of the relationships within the social network might be more important than the actual size of the social network in the association between social isolation and loneliness (Hawkley et al., 2008). Loneliness could be the result of a lack of affective bonding with the people around us but could also arise when someone is unsatisfied with the relationships in their social network (Bauminger & Kasari, 2000).
A limitation of the study is that current findings are based on self-reported survey data, as this could lead to response bias. Furthermore, the use of telephone interviews, in which an interviewer reads questions aloud and registers the answers provided by the interviewee into the computer system, could have led to participation bias, as people who are satisfied with their lives are more likely to sign up for an interview study than people who are less satisfied with their lives. Another limitation of the study is the use of secondary analysis of existing data to study current research purposes. This could threaten the internal validity of the data, as the data used in this study were collected at a different time point than when they were analyzed (Rew et al., 2000). However, regarding the relevance for practice of the study, there have hardly been any changes in the last decade for this specific target population in the Netherlands when it comes to assessing and diagnosing VI, the care that is provided (interventions) to young people with VI, and the estimated prevalence of the population. Another known limitation to the use of existing data for research is that the researchers involved in the data analysis were usually not involved in the data collection (Cheng & Phillips, 2014). However, the first and the last author of this study were both involved in the data collection in 2016 and, therefore, aware of nuances in the data collection process.
It is recommended that future studies could expand the knowledge on heterogeneity in social participation of people with VI by using recent administrative or governmental data, as these data are not based on self-reports, do not depend on the willingness of people to sign up for the study, and are probably analyzed in the same period as the data are collected. These type of data also often include information on socioeconomic factors which might be important to take into account while studying social participation and personal well-being of young people with VI. To improve our level of knowledge on the heterogeneity in social participation of young people with VI, the next step would also be to look across countries and study, with even bigger samples, to what extent patterns of social participation differ according to social-cultural factors. Furthermore, personalized interventions should be the way forward when intervening in heterogeneous populations like young people with VI (Ng & Weisz, 2016). It is suggested that future intervention studies including people with VI should first study the heterogeneity of the sample, using unsupervised clustering, before participants are allocated to treatment conditions within the study.
The variations in social participatory success found in this study with no distinct patterns for characteristics of the impairment, and age should be taken into account when supporting young people with VI. For example, the enrollment of young people with VI into support programs is often based on the severity of the impairment or age. However, this might not be the way forward. It might be more appropriate to enroll young people with VI into support programs based on their perceived problems with social participation. Furthermore, the results of this study also imply that interventions focusing on supporting the social participation of young people with VI should be tailored to the individual, as there might not always be a need for support focusing on general social participation but more of a need for support focusing on specific domains of social participation. Interventions with a more tailored approach might be more suitable for this population of young people.
Conclusion
This study shows that the social participation of young people with VI is achieved in a heterogeneous fashion. Eight different subgroups were identified in this sample. In each subgroup, individuals with VI experienced feelings of loneliness. Various patterns in social participatory success can be related to people experiencing loneliness. The results of this study show that there is no “one size fits all” when it comes to supporting young people with VI in their way to being socially connected and embedded in society and having healthy personal well-being.
Footnotes
Acknowledgements
The authors wish to thank the participants for their time and effort.
Declaration of conflicting interests
The author(s) declared no potential conflicts of interest with respect to the research, authorship, and/or publication of this article.
Funding
The author(s) disclosed receipt of the following financial support for the research, authorship, and/or publication of this article: This work was supported by The Foundation to Improve the Outcomes for People with VI in the Netherlands, by ZonMw (the Dutch organization for the Health Research and Development program InSight), and by Bartiméus Fonds (grant nos: 943-01-001, 943-07-006, and 943-09-005).