
Abstract
Climate change poses a real threat to the water security by altering the precipitation patterns and other weather variables, desirability function (df) was used to determine the interactive effects and optimize with the Central Composite Design (CCD) of important variables such as initial dyes concentration (Co : 20–100 mg L–1), solution pH (1.5–11), temperature (20–60 °C) and adsorbent dosage (0.1–1.3 g L–1) for the removal of toxic Yellow Tartarazine (YT) and Methylene Blue (MB) onto Untreated Walnut Shells (UWS). The analysis of variance (ANOVA) was applied for the treatment of experimental data, fitted by a second-order polynomial equation and multiple regression analysis. The ideal conditions optimized according to the response surfaces are initial concentration (COyt = 60 mg L–1, pHYT = 1.5, DYT = 0.7 g L–1 and TYT = 40 °C for YT and (Co MB = 60 mL–1, pHMB = 8.5, DMB= 0.7 g L–1 and TMB = 40 °C for MB). Experimental confirmation allowed to accurately determine the maximum eliminations (76.15) for YT and (76.81%) for MB under optimal conditions. Several error analysis equations were used to measure the goodness of fit. Kinetic studies showed that the adsorption kinetic data are well modeled by a pseudo-second-order model. Among the different models used to fit the experimental isotherms, the Langmuir model gave the best correlation with capacities qmax of 55.55 and 50.00 mg/g, for YT and MB respectively at 40 oC. The effect of temperature on the adsorption isotherms allowed to arrive at the thermodynamic functions, the negative values of free energy (ΔG°), enthalpy (ΔH°) and entropy (ΔS°) indicate a spontaneous and exothermic adsorption of physical nature, confirmed by the activation energy (Ea) for both dyes. The elimination of pollutants by new-generation adsorbents has proven to be very effective by application of statistical methodology, Central composite design and the desirability function.
Keywords
Introduction
Water pollution by various species (dyes, pesticides, heavy metals, etc.) is a growing threat and a problem that needs to be addressed immediately. In fact, various pollutants are dumped into natural waters in an anarchic manner, causing significant pollution. Therefore, environmental protection and water quality is a matter of concern nowadays. Dyes represent the greatest pollution and reducing their concentrations below the set limits is a challenge to address. Several sectors contribute to this pollution, mainly the textile sector due to the volume of effluents generated by synthetic dyes (Inyinbor et al., 2016). The widespread use of synthetic dyes has led to health problems due to their carcinogenic properties and therefore the colored effluents must be treated at source (Abbas, 2020a; Abbas, 2021a, 2021b, 2021c; Abbas, 2022; Abbas et al., 2014). Indeed, discharges from different sectors (paints, plastics, paper, leather and textiles) are becoming a growing concern where the physicochemical properties of water, namely color, odor and pH, are very altered where the mesomerism of molecules makes them difficult to mineralize (Yemendzhiev et al., 2009). Accelerated industrialization and a growing population generate organic compounds with high molecular weights and stable chemical structures. Dyes (YT) and (MB) are used in the textile sector, are difficult to biodegrade and appropriate treatments are necessary for their mineralization (Abbas and Trari, 2020a, 2020b). Many physico-chemical and biological techniques were used, including reverse osmosis (Cinperi et al., 2019), precipitation (Li et al., 2022), coagulation/flocculation (Abbas, 2021d), ion exchange (Sinha et al., 2021), membrane filtration (Nozad et al., 2022), adsorption (Abbas, 2020b, 2020c; Abbas et al., 2018; Abbas et al., 2019; Abbas et al., 2020; Abbas and Trari, 2020c) and photo-Fenton oxidation (Abbas, 2021e; Abbas and Trari, 2021) are currently used in the wastewater treatment.
Walnuts are single-seeded stone fruits produced by the walnut tree belonging to the family Juglandaceae. The native plant grows in the temperate mountainous regions of the Eurasian continent and the world production of walnuts was 3.9 million tonnes in 2022 (Martínez et al., 2003). The disposal of by-products from the various uses of walnuts generates annually more than 2.6 million tonnes of organic waste that can have harmful effects on the environment, such as the release of carbon dioxide and methane, two greenhouse gases. The main constituents of walnut shell (WS) are lignin (50.3%), cellulose (23.9%) and hemicellulose, with 22.4% (Jahanban-Esfahlan et al., 2019). The physicochemical properties of WS make it attractive as a biosorbent. It is characterized by chemical stability, mechanical resistance and can be exploited in adsorption (Cao et al., 2014), because of its specific surface area and high porosity and large (Kashif-Uddin and Nasar, 2020). Both raw and modified WS have been used to remove various pollutants, mainly dyes and heavy metals (Kamar et al., 2015; Miyah et al., 2018). Response surface methodology (RSM) is a statistical tool for developing, optimizing and improving industrial processes when many factors affect production, yield or the percentage of removal of a pollutant (Myers and Montgomery, 2002). RSM is used to determine the significant factors affecting an experiment; it aims to reduce the number of experimental trials while maximizing the result through the data generated that allow developing empirical models that correlate the response to experimental factors and analyze the effects of independent variables. It studies the interactive effect of process variables to build a mathematical model that accurately describes the overall process. The most efficient design used in response surface modeling is the Box-Behnken design which has some advantages; it requires few experimental points for its application (three levels per factor) and high efficiency (Ferreira et al., 2007). Several studies used successfully this design, one can cite the MB adsorption by kapok fiber treated by NaCl (Liu et al., 2012), Cr(VI) adsorption onto activated carbons (Özdemir et al., 2011) and degradation of Acid Red 274 using H2O2 in subcritical water (Kayan and Gozmen, 2012). The main objective of RSM is to optimize the response surface which is influenced by various parameters and quantifies the relationship between the controllable input parameters and the obtained response surfaces (Aleboyeh et al., 2008; Zarei et al., 2010). The central composite design procedure allows (i) to perform a series of experiments for a reliable measurement of the response of interest (ii) to develop a mathematical model of the second-order response surface with the best fit (iii) to determine the optimal set of experimental parameters that produce a maximum or minimum response value and (iv) to represent the direct and interactive effects of the process parameters via 2D contour plots of binary effects. The desirability function is used to confirm the optimized parameters. In this contribution, the combined effect of adsorbent dose, pH, initial dye concentration (Co) and temperature on the removal of YT and MB from untreated Walnut Shells was investigated using Central Composite Design. The experimental data were analyzed based on a second-order polynomial model, statistically validated by doing analysis of variance (ANOVA) and a misfit test to test the significance of the model. In addition, YT and MB adsorption were also evaluated from the perspective of kinetics and isotherms. Environmental protection and global warming reduction are closely related to pollution. Therefore, the novelty of this research lies in the recycling of food waste and its valorization in water treatment, the low economic cost of this adsorbent compared to commercial activated carbons, the application of Central Composite Design and statistical method have made it possible to achieve high performance.
Materials and methods
Adsorbent preparation
The walnut shells used in this study were obtained from the Boumerdes region (Algeria). To eliminate unwanted particles, the shells were washed with tap water and distilled water. The washed mass was dried for 6 h at 100 °C. The material obtained was crushed and sieved; the particles with a size of ∼ 0.25 μm were selected and washed with boiling distilled water and dried at 100 oC (24 h). The product obtained did not undergo any chemical or physical treatment (Untreated Walnut Shells (UWS)) and was used in all adsorption experiments.
Characterizations of UWS
The morphology, arrangement of cavities and their dimensions in the prepared UWS adsorbent before and after dye adsorption were visualized with a scanning electron microscope (SEM, JEOL-JSM 7600F) to confirm the occupancy of the pores by MB and YT molecules. FT-IR spectroscopy allowed to identify the characteristic features on the UWS surface before and after adsorption, 5 mg of adsorbent was mixed with dry spectroscopic grade KBr and previously dried and compacted. FT-IR spectra were plotted with a Perkin Elmer 2000 equipment between 4000 and 400 cm−1 for 16 times to increase the signal-to-noise ratio. The Zero Charge Point (pHzpc) of UWS was obtained by the method reported elsewhere (Merrad et al., 2023). Briefly, 20 mL of KNO3 solutions (0.01 M) were placed in closed conical flasks; the pH of each solution was adjusted between 2 and 14 by HCl and NaOH. Then, 0.1 g of UWS was added and the final pH was measured after 24 h under stirring at 25 °C; pHzpc corresponds to the point of intersection of the initial pH and final pH curves.
Biosorbates (Mb and Yt)
Yelow Tartrazine, C.I.1940, acid yellow 23, is an anionic dye (IUPAC name is 4, 5-dihyro-5-oxo-1-(4-sulfophenyl)-4-[(4-sulfophenyl) azo]-1H pyrazole-3- carboxylic acid trisodium salt, Merck) with a chemical formula C16H9N4Na3O9S2, 534.3 g mol–1). Methylene Blue (MB), used as an adsorbate, is a Basic Blue 9 dye, (C.I. 52015, IUPAC name 3,7-bis (dimethylamino) phenothiazin-5-ium chloride, C.I. 52015., C16H18ClN3S, M = 319.85 g mol–1). The chemical structures of both molecules are illustrated in Figure 1.

Structural formulas of MB and YT dyes.
The toxicity risks of YT (LD50: 2 mg kg–1) and the side effects related to its use are hyperactivity, rhinitis, vision disorders. Methylene Blue (LD50: 1.18 mg kg–1) is widely used in dyeing cotton, wood and silk and can lead to burns with permanent eye damage. Its inhalation can cause breathing difficulties (Charbonneau, 2013; Himri et al., 2011) and their elimination is of primary interest.
Residual concentrations were analyzed by linear interpolation using a calibration curve (0–10 mg L–1) prepared from the stock solution obtained by dissolving the required amounts in distilled water. The wavelengths of YT (= 428 nm) and MB (= 675 nm) were determined by spectral scanning using a UV/Visible spectrophotometer (Jasco-V-530).
Adsorption experiments
Batch equilibration for optimization was followed according to CCD matrix. An exact amount of adsorbent was contacted to 100 mL of YT and MB solution under stirring (150 rpm) for 90 min obtained from kinetic study. The separation was performed by centrifugation (6000 rpm, 10 min) and the concentrations retained in the biosorbent phase were titrated by spectrophotometry. The experiments were realized by changing pH, dye concentration (Co), adsorbent dose and temperature; HCl and NaOH (1.0 mol L–1) were used to adjust the pH. The isotherms were performed under optimal conditions by changing the temperature (20, 30 and 40°C), the initial concentration (Co: 20, 30, 40, 50 and 60 mg L–1 for binary solutions; 40, 60, 80, 100 and 120 mg L–1 for simple solutions). The amount of dye to be removed was calculated as follows:


Adsorption process optimization by response surface method
Two types of variables exist in multivariate optimization: responses (dependent variables) and factors (independent variables, qualitative or quantitative). Two responses are measured: the adsorbed quantity (mg g–1) and the removal efficiency (%). After choosing the design matrix and performing the experiments, the data are processed by a specific software that develops a model and a construction of the response surfaces. Consequently, multivariate optimization by the response surface method includes six essential steps:
Selection of independent factors and selection of desired responses. Choice of matrix for experimental design. Execution of adsorption experiments. Adjustment of mathematical model. Confirmation and validation of model. Process optimization.
Having an idea of the measurement response is an essential step for the application of the RSM method, which explains performance and the influence of operational parameters. Two responses are studied in adsorption: removal and/or adsorbed quantity. The next step specifies the number of tests and the quality of the model developed. RSM optimization involves estimation coefficients and predicts the response in a mathematical model. In our case, a central composite design (24) allowed to evaluate the influence on adsorption of YT and MB mixed at equivalent concentrations. RSM is basically a specific mathematical tool, which combines the experiment, models the construction process and controls the impacts of operating variables (Garg et al., 2009; Zabeti et al., 2009). In this study, the significant variables in the adsorption of the two dyes (YT and MB) were considered, pH (
Independent variables and their levels used for central composite design.

The percentage of dye removal was given with an accuracy of ±0.5%. The second-order polynomial response was derived to explain the system behavior: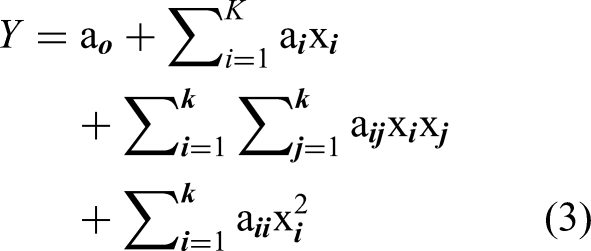

The CCD experimental matrix was generated by Minitab 16 software, also used for regression analysis of the designed model and graphical analysis of each response. The CCD matrix is established from 16 factorial points, 6 repetitions at the center and 8 axial points. The total number of experiments (= 30) is calculated from the following equation: N = 2
k
+2k +nc,
Central composite matrix, experimental response Rexp (%) and predicted response Rpred (%) for elimination of YT and MB onto UWS.
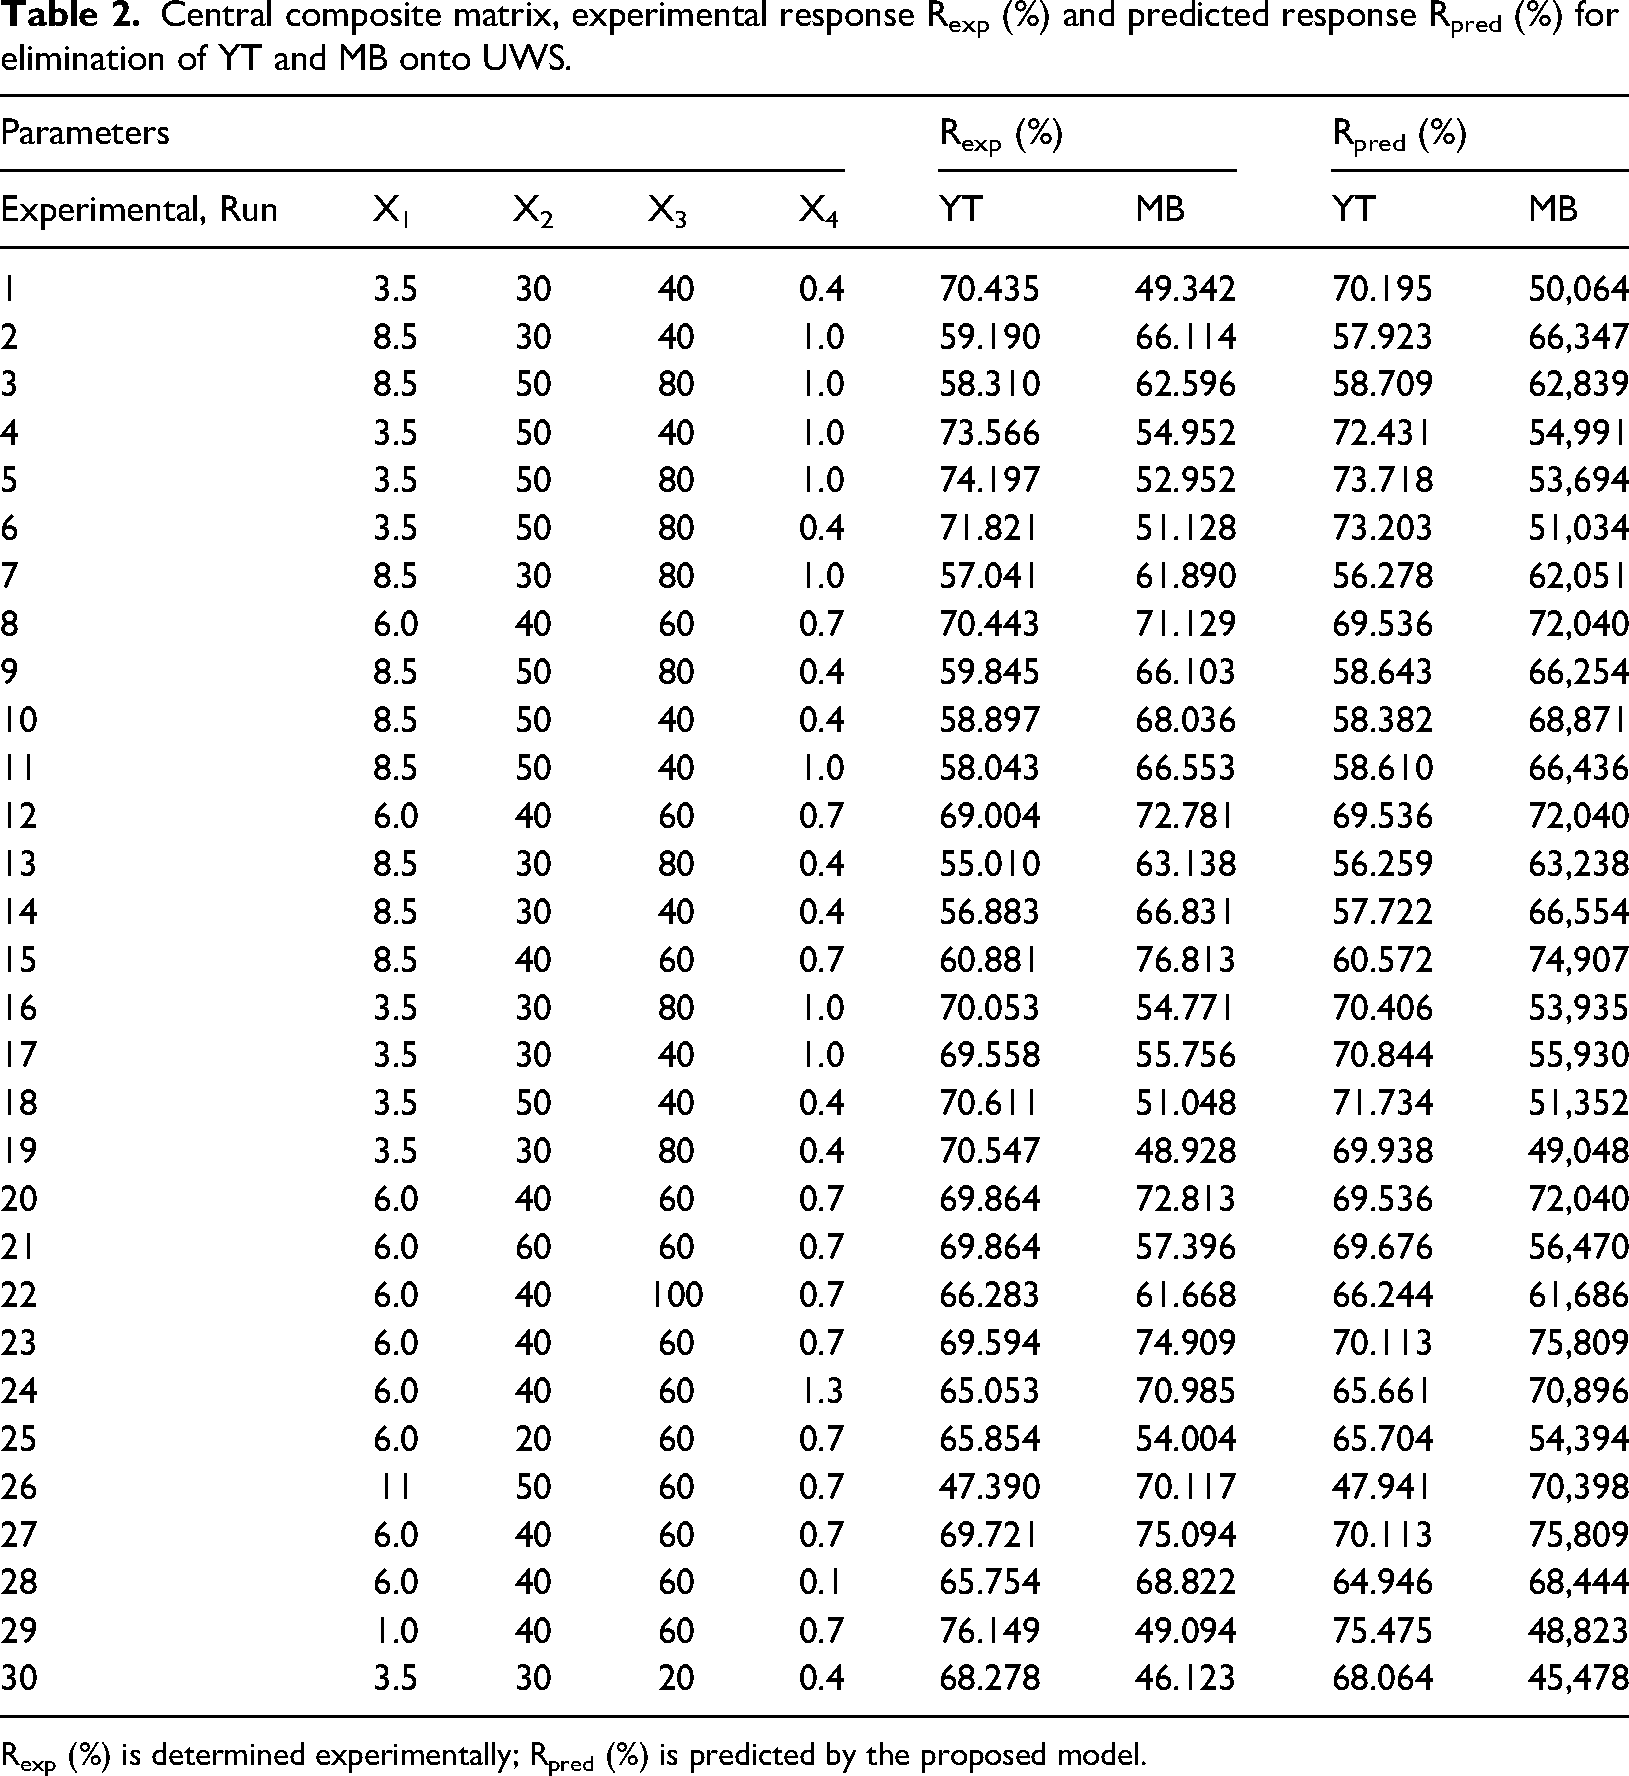
Rexp (%) is determined experimentally; Rpred (%) is predicted by the proposed model.
Modeling and statistical analysis
To verify the quality of the mathematical model obtained from the experiments, we used the Student Test (T-value), Fisher Test (F-value) and the coefficient of determination (R2) using Minitab 16 software. The Student T-test is used to statistically verify the hypothesis of equality of the expectation of two random variables according to a normal distribution and an unknown variance as well as the nullity of a coefficient in the context of a linear regression. The statistical hypothesis (F-test) enables to verify the equality of two variances thanks to the ratio of the two variances which must not exceed a certain theoretical value, as given in the Fisher table. In this case, the software gives the ratio between the adjustment variance and the experimental error variance. The determination coefficient (R2) is an indicator for judging the quality of a linear regression, simple or multiple. For a value between 0 and 1, it measures the adequacy between the model and the observed data. Of course, the R2 has its imperfections, but remains relatively interesting because of its simplicity.
Variance analysis
ANOVA tests the statistical significance of the experimental design by establishing the interactions between the independent variables and the response effects (Gadekar and Ahammed, 2019; Karimifard and Moghaddam, 2019). It subdivides the total variation into two components, the variation associated with the model or the experimental error (Danmaliki et al., 2017; Zhao et al., 2020). The F and p values (prob>F, confidence interval = 95%) for the model were obtained. ANOVA is a mathematical and statistical approach that subdivides the total alteration of the data set into parts of ingredients concomitant with a defined source. The latter tests the target hypotheses on the model parameters (Hu et al., 2007) and checks the statistical significance. Fisher's F test, i.e., the ratio between the mean square of the model and the residual error, allows for a comparison (Kasiri et al., 2013; Khataee et al., 2010).
Adsorption kinetic study
Many models were proposed to study the mechanisms controlling the adsorption. In this study, the experimental data of dyes adsorption are examined using a pseudo-first kinetic (Ho and McKay, 1998), the pseudo-second-order kinetic (Juang and Chen, 1997), the Elovich kinetic equation (Woodbury, 1997) and intra-particle diffusion (Weber and Morris, 1963) given respectively by:


Adsorption equilibrium isotherms
Adsorption isotherms are very important for the optimization of the adsorption system. The equilibrium relationship between adsorbent and adsorbate is best explained, and the maximum uptake capacity can be determined by the adsorption isotherm. To assess the performance of adsorbent, different equations and isotherms exist, out of which the Langmuir (Langmuir, 1918), Freundlich (Freundlich, 1906), Temkin (Temkin and Pyzhev, 1940) and Elovich (Ghaedj et al., 2013) isotherms were used that have been presented in the following equations respectively. Besides, the isotherm models were applied at optimal conditions of the parameters. The Langmuir model is the best known and most widely applied, it is represented by the nonlinear form:


KL (L mg–1), AT, BT, ΔET (kJ mol–1), KF, n and KE (L mg–1) are the Langmuir, Temkin, Freundlich and Elovich constants.
Regression analysis, goodness of fit measure and model comparison
All the model parameters were evaluated by nonlinear regression using Mattlab Software. A part from the determination coefficient (R2), the chi-square statistic (χ2) was also used to measure the goodness of fit. The error functions employed are as follows:
The sum of the square of the errors The determination coefficient (R2)

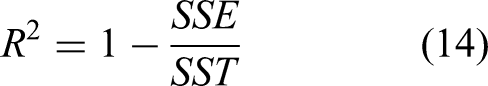
SST is the total of sum square
The chi-square test (χ2) where n is the number of experimental samples, qe,exp and qe,cal (mg g–1) are the experimental and model calculated values of adsorption capacity respectively.

Thermodynamic characterization of adsorption
The thermal effect on the adsorption capacity of UWS was investigated in the range temperature (293–313 K). The adsorption of dyes onto UWS surface implies a variation of the free energy (ΔG°) between the initial and final states. The feasibility of the reaction is defined by the variation of ΔG° (kJ/mol) at constant pressure:
The free energy is composed of the enthalpy ΔH° which gives the energies of interactions molecules/adsorbent surface, and entropy ΔS° which expresses the modification and arrangement of the molecules in the liquid phase and on the surface. The thermodynamic behavior for the MB and YT adsorption on UWS was further investigated and the parameters ΔG°, ΔH°, and ΔS° are calculated from the relation:
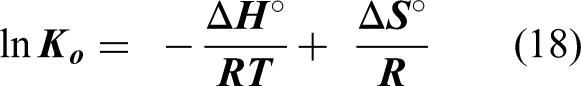
The values of lnK0 are deduced from equilibrium constant (Ks):

The constant Ko determined from intercept, by plotting ln(qe/Ce) versus Ce and extrapolating to Ce = 0 (Li et al., 2010). The rate constant obeys the known relation:
A is a pre-exponential factor and K2 (g mg–1.min–1) is the pseudo-second-order kinetics constant at different temperatures. The activation energy (Ea) easily deduced by plots lnK2vs T−1.
Results and discussion
Analyses of the UWS surface morphology
The Scanning Electron Microscope (SEM) micrographs of UWS before and after adsorption are illustrated in Figure 2. UWS exhibits a microporous structure with different pore diameters and a rough surface with protrusions. After adsorption, the surface became smoother with significantly reduced roughness and less visible pores, thus confirming the adsorption of YT and BM both on the surface and inside the pores. Indeed, the images show an outer surface of UWS formed by more or less homogeneous cavities with different sizes and shapes. These cavities depend on the nature of the carbon and the activating agent. These cavities represent the external pores of the access channels to the inner surface of the activated carbon. A higher magnification shows that the adsorbent surface contains pores with a high probability of absorption.

Microscopic images of the adsorbent (UWS) (a, b) before adsorption and (c, d) after adsorption of pollutants MB and YT.
Analyses of the UWS surface chemical
FT-IR spectra (Figure 3) elucidate the chemical structure of the film where the bands of UWS are assigned to the vibrations of C-H, C=O and O-H groups, indicating that UWS is formed by hydrocarbons, alcohol, ketone and other functional chains. The presence of bands at 3400 cm−1 assigned to NH2 and –OH stretching functional groups due to hydrogen bonds to UWS (Wang 2013), 2929 cm−1 correspond to –CH and –CH2 stretching (Zaku et al., 2011). The intramolecular bond (OH) remains unchanged before and after adsorption with high intensity. The new peak at 1654 cm−1 after MB adsorption is characteristic of amide (Wang et al., 2010), while the peaks at 685, 1385 cm−1 after YT adsorption are due to the C=O and C-H deformation in the aldehyde. The peaks 685 and 795 cm−1 attributed to the -CH deformation bands and -OH groups, confirm the adsorption of MB. The peaks at 1068 and 1029 cm−1 correspond to the C-O-C stretching vibration (Zaku et al., 2011) while 1699 cm−1 before and after MB and YT adsorption is assigned to the C=O group. The bands centered at 1220 are due to the C-O stretching vibrations in alcohols, phenols or ether groups after YT adsorption.

FTIR spectrum of the UWS before and after adsorption of the MB and YT.
Experimental design analysis by central composite design
The complete experimental design and results are illustrated in Table 2. Based on our results, the relation between the response and independent process variables is given by a second-order polynomial:


Analysis of variance (ANOVA) for response surface quadratic model.

Significance: * Parameter is not significant.
According to the model, all of the independent variables (singular terms of the designed model X1, X2, X3 and X4) for both dyes (YT and MB) have a positive sign, showing a positive impact on the response, and this means that an increase in each of them increases the percentage of elimination of YT and MB. Analysis of variance allowed us to identify the significance of multiple regressions. ANOVA (Table 4) provides information on the fit as well as the significance of the factors based on the F and P values. For values: P < 0.05 and F > F.0.05, the factor is significant. High F-value and a low P-value indicate significant models supported by the quality of fit; the coefficient (R2) for a significant model should tend towards 1 (Segurola et al., 1999). For our models, R2 values are equal to 0.9869 (YT) and 0.9953 (MB) for adsorption (Table 4). This means that more than 98.69% of the experimental data were explained by these models and only less than 1.3% were not. These results are confirmed by the high values of R2 (0.9142 for YT and 0.9828 for MB) and the adjusted R2adj (0.9729, YT) and (0.9904, MB). The validity of the model can be verified by the correlation between the experimental data and those given by the model. The coefficients (R2) are 0.985 (YT) and 0.956 (MB), indicating a good fit (Figure 4).

Plot of the experimental and predicted response. (
Different parameters for adsorption kinetic models for the removal of MB and YT onto UWS.

The adsorption of YT (98.5%) and MB (95.6%) is explained by the independent variables; the model does not explain only 1.5% (YT) and 4.4% (MB). It is important to respect the normality assumption for a good reliability of the results which is verified by evaluating the normal distribution of the residuals (Figure 5). For the dyes, the plot shows that the data follow a straight line, with a normal distribution and the absence of evidence of non-normality or undefined variables, which also confirms that the normality assumption is valid, and thus the validity of the proposed models.
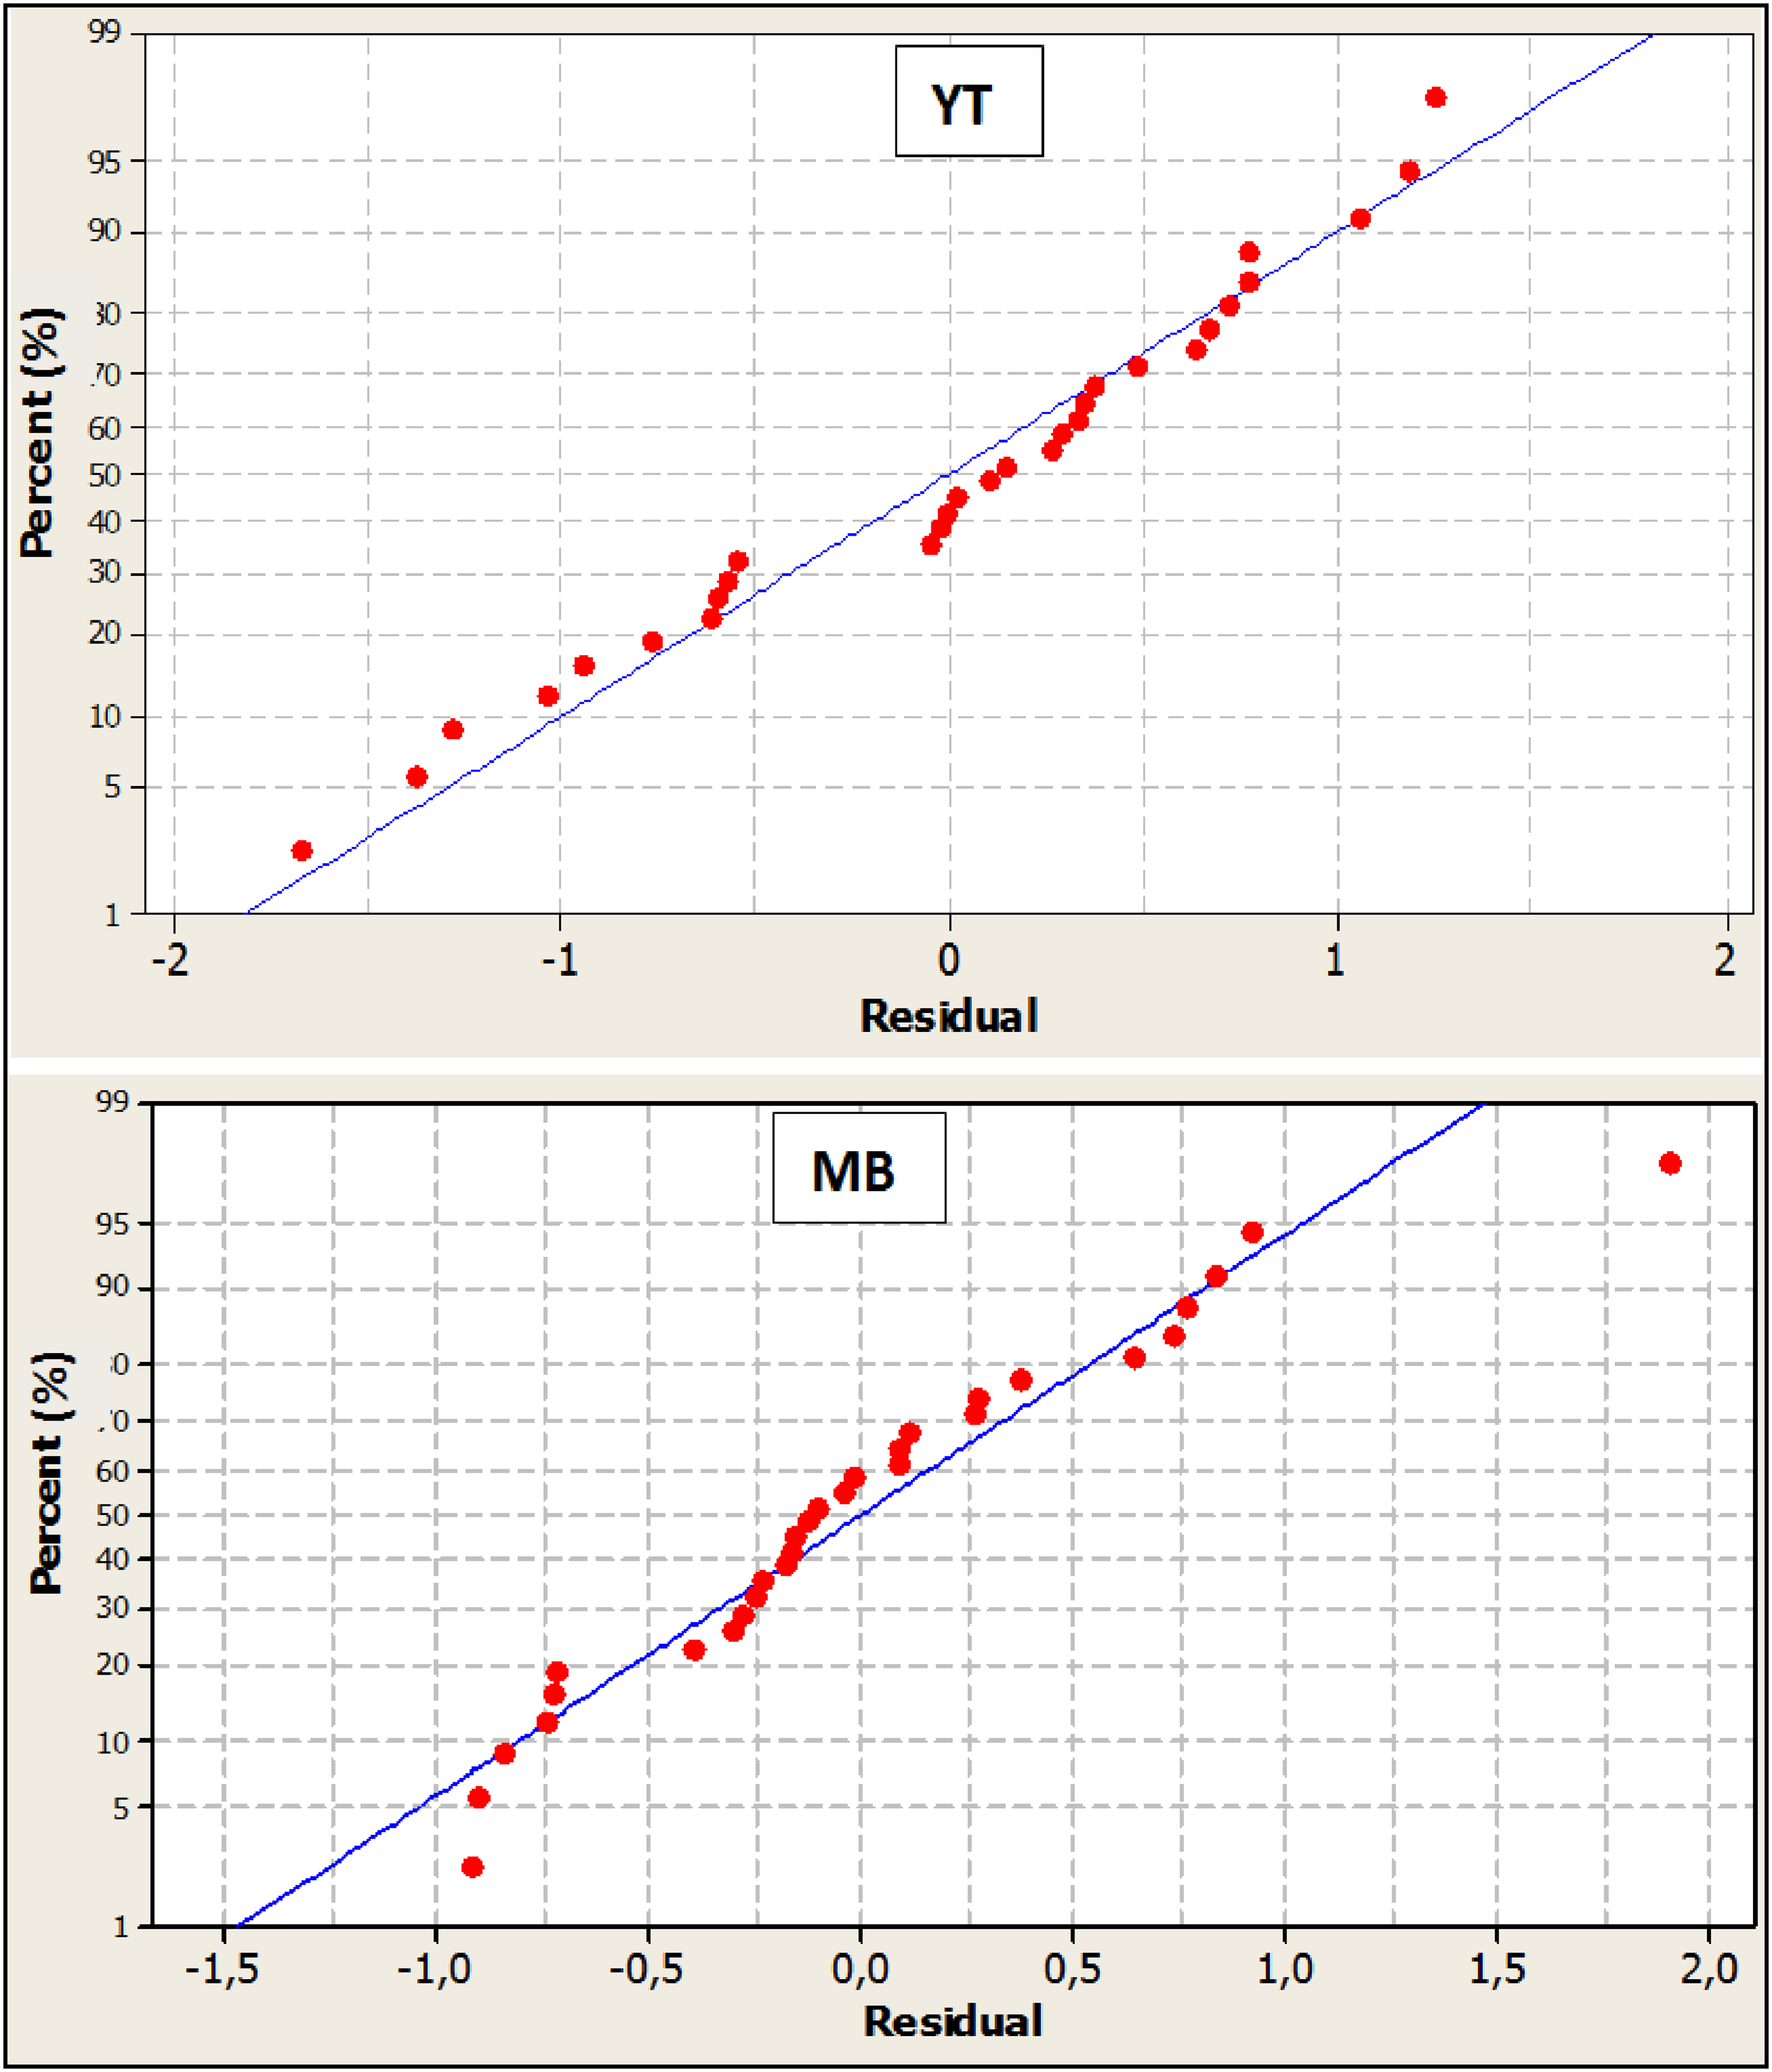
Normal evaluation of the normal probability.
Effect of interactive variable
For determining the comparative significance of each term of the model, Pareto analysis was applied using the following equation:
where ai is the regression coefficient of individual variables according to Pareto analysis, the order of relative importance of the factor is as follows: Adsorbent dose (g L–1) >> pH solution >> T (oC) >> (MB, YT) Concentration C0 (mg L–1). A singular term X4 (adsorbent dose), with the highest coefficient (a4 (YT) = 19.366, a4(MB) = 47.937) has the maximum influence on the response for YT and MB adsorption, while the binary terms X1X2, X1X3, X1X4, X2X3, X3X4 and X1X2, X2X3, X3X4 have no impact on the YT and MB elimination. X1X3, X1X4 and X2X4 have a negative sign, indicating a negative impact on the response, and indicates that an increase of each of them should decrease the MB removal. pH is among the most influencing parameters with a high impact on the dyes uptake. In addition to its impact on the solubility of dyes; it has the capability to replace some of positive ions in the active sites and affects the ionization of the adsorbate. Indeed, pH not only has an impact on the surface charge of the adsorbent UWS but also affects the functional groups of MB and YT. The influence of pH on the dyes adsorption onto UWS is interpreted by pHpzc (Deng et al., 2011).
The basic or acidic nature of the UWS surface controls the retention of the dye. However, the chemical properties of the adsorbent are intimately related to the functional groups on its surface. The surface charge of the adsorbent depends on the ionic strength and pH of the solution. Thus, an important characteristic of the surface is the pHpzc value (= 4.14) (Figure 6), the latter characterizes the acidity or alkalinity of the UWS adsorbent. The surface charge is positive below pHpzc where the oxygenated groups are in cationic form, thus providing a favorable medium for the adsorption of YT, an anionic dye. This is due to the electrostatic attractive forces catalyzing the removal of YT, which peaks at pH 2. On the other hand, above pHpzc, the surface of the adsorbent and the YT are negatively charged, with repulsive forces that reduce the removal of YT. MB is a cationic dye, above pHpzc, the surface of the adsorbent is negative, with a favorable adsorption of MB due to the attractive forces that increase the removal of MB, the maximum is obtained for a pH of 8; the opposite effect occurs below pH 8.
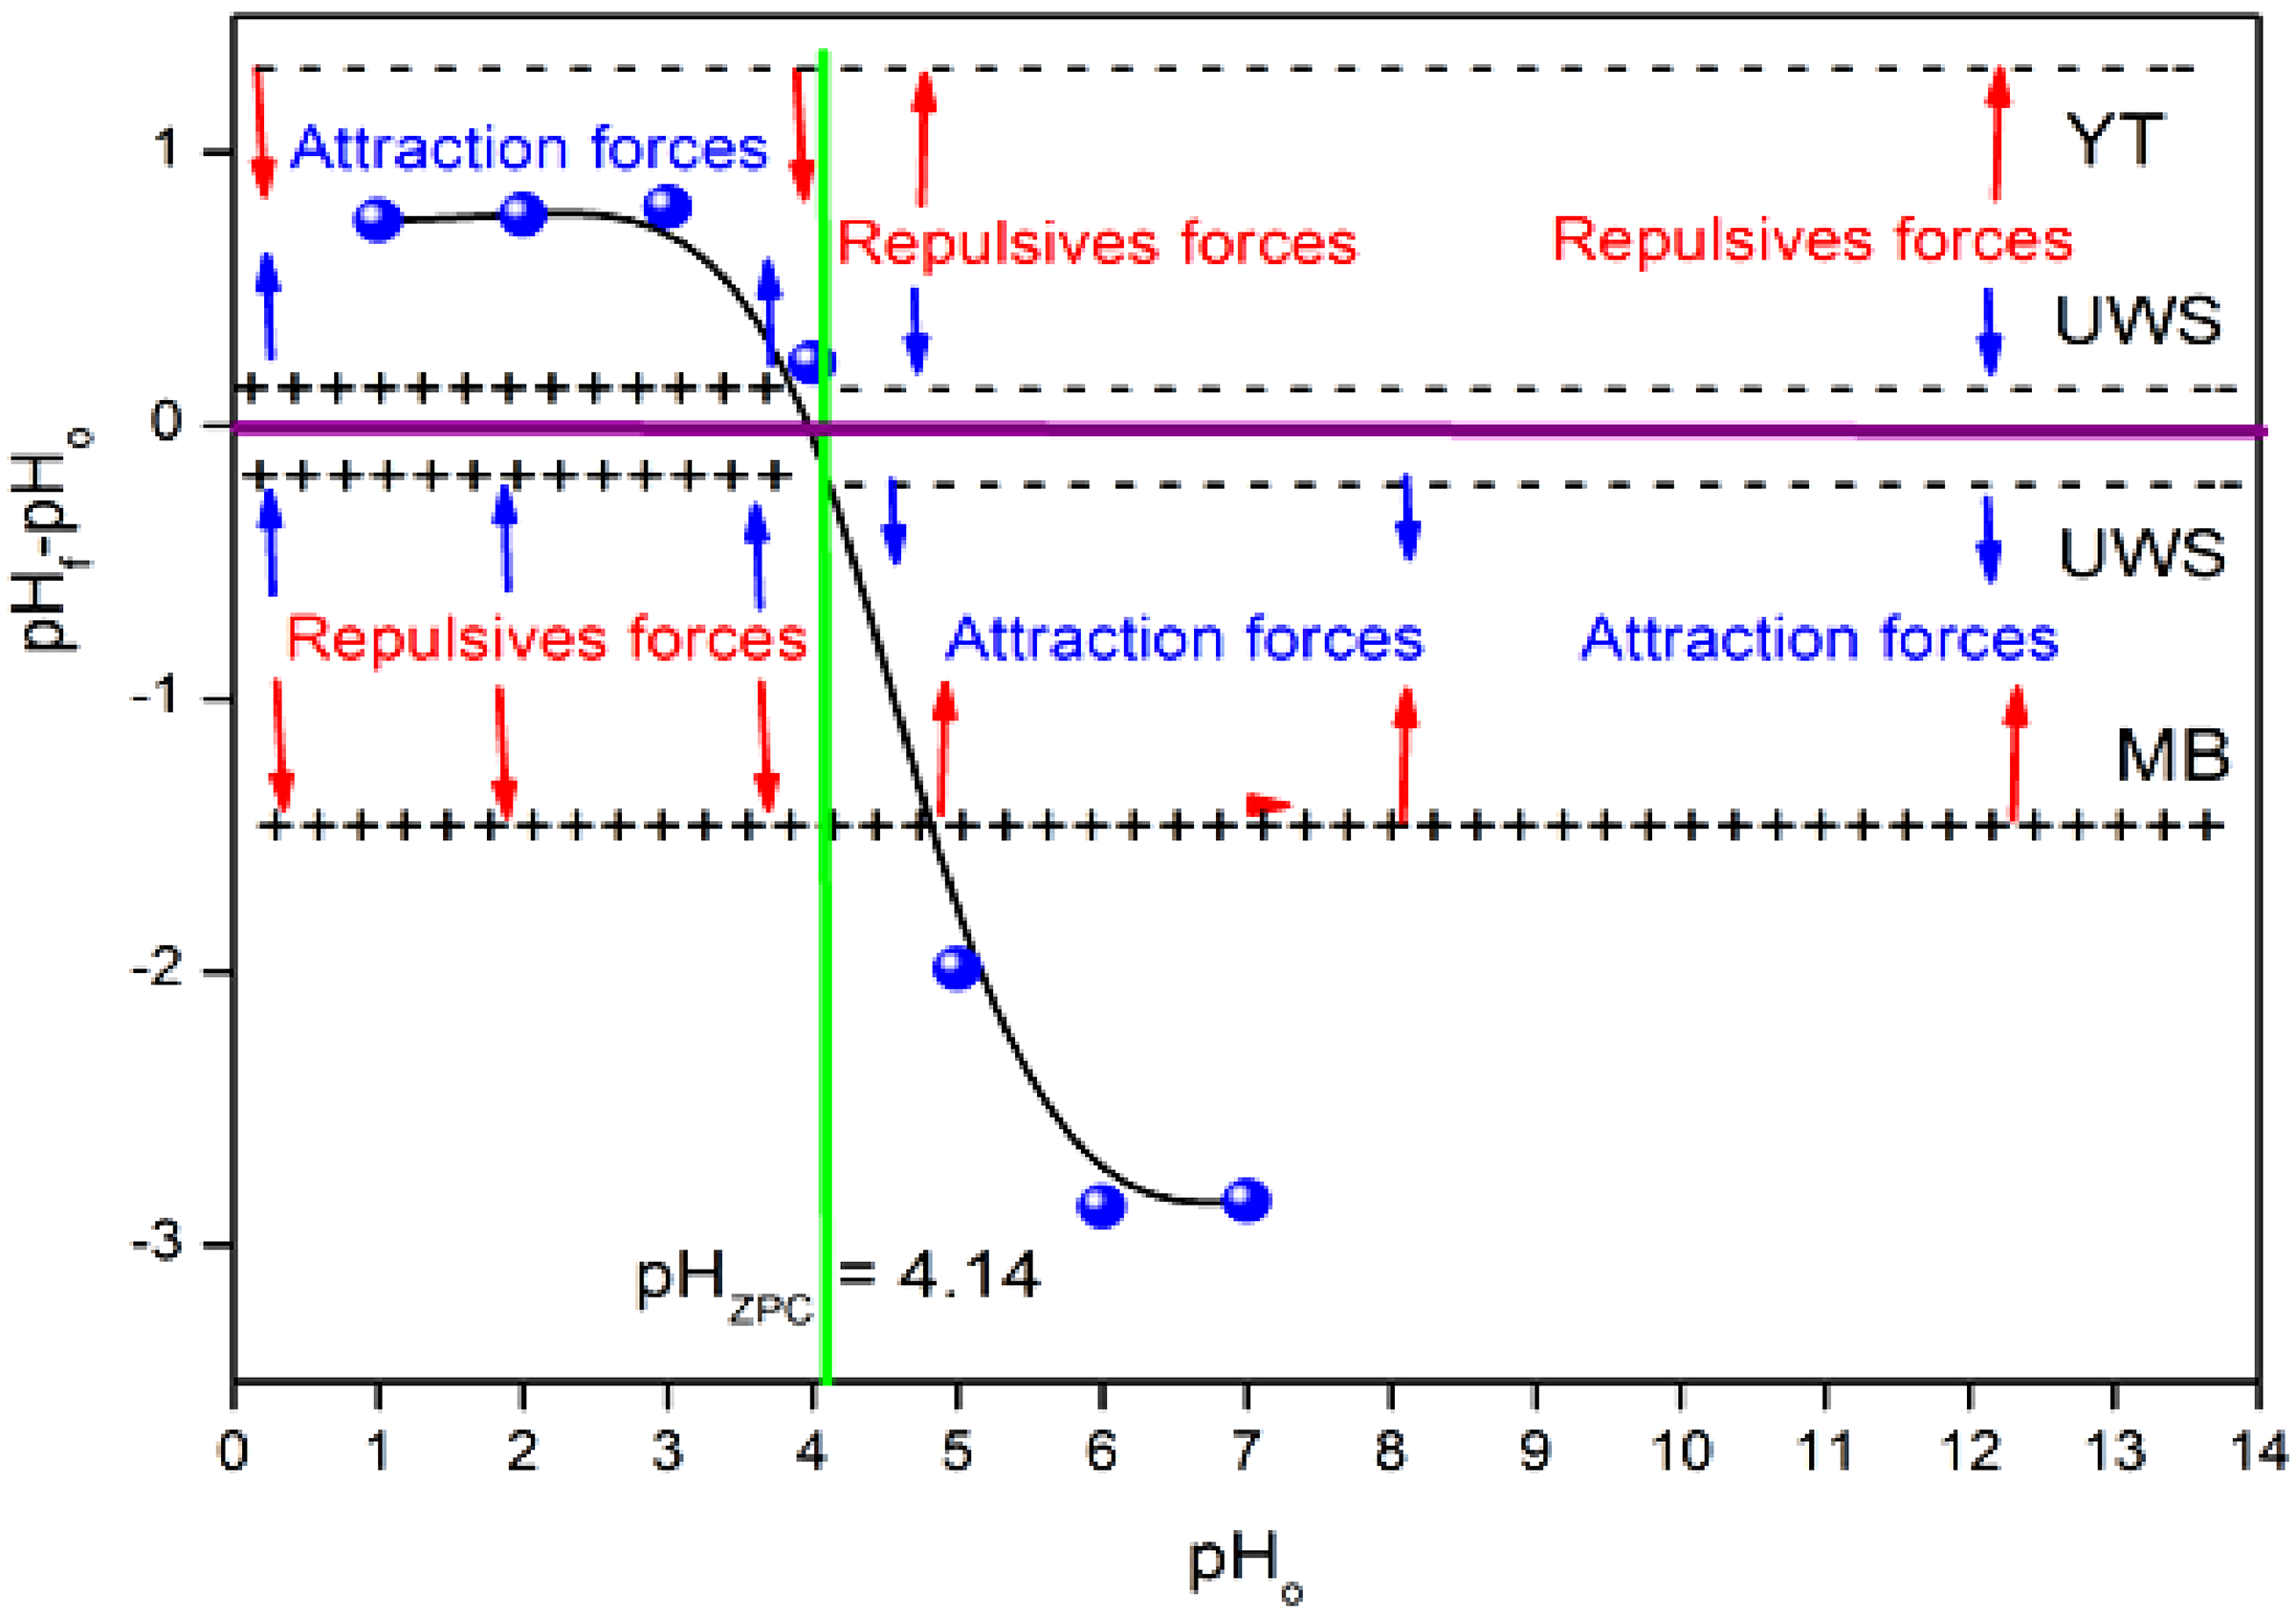
Determination of charge predominance zones (pHpzc) in the UWS adsorbent.
Optimization by RSM and with desirability function
Minitab software provides a graphical route for the model through 2D contours, suitable for studying binary interactions of factors. The contour plots of the second-order polynomial equation within two independent variables (pH and T, pH and Co, pH and adsorbent dose for YT and MB, while all others are kept at fixed values).
Figure 7 provides the information on their connections and relationships, which includes the main factor and the interaction impacts of these two independent factors (Adinarayana and Ellaiah, 2002; Harrington, 1965). Examination of the 2D curves of the binary variables allows delineating of the optimal parameters for maximum dye removal efficiency (For YT: pH 1.5; T = 40°C; C0 = 60 mg L–1 and adsorbent dose = 0.7 g L–1, and for MB: pH 8.5; T = 40 °C; C0 = 60 mg L–1 and adsorbent dose = 0.7 g L–1).

(a) The contour plots of the solution pH and temperature (time 90 min, adsorbent dosage 0.7 g/L, YT concentration 80 mg/L, agitation speed: 300 trs/min). (b) The contour plots of the solution pH and YT concentration (time 90 min, adsorbent dosage 0.7 g/L, temperature 40 oC, agitation speed: 300 trs/min). (c) The contour plots of the solution pH and adsorbent dosage (time 90 min, YT concentration 80 mg/L, temperature 40 oC, agitation speed: 300 trs/min). (d) The contour plots of the solution pH and adsorbent dosage (time 90 min, BM concentration 80 mg/L, temperature 40 oC, agitation speed: 300 trs/min). (e) The contour plots of the solution pH and MB concentration (time 90 min, adsorbent dosage 0.7 g/L, temperature 40 oC, agitation speed: 300 trs/min). (f) The contour plots of the solution pH and temperature (time 90 min, adsorbent dosage 0.7 g/L, MB concentration 80 mg/L, agitation speed: 300 trs/min).
The desirability function allows to arrive at the optimal parameters of the input variables simultaneously which determine the performance for one or more responses and takes place in two stages:
(i) Find the levels of the independent variables that simultaneously produce the desirable responses on the dependent variables. (ii) Maximize the overall desirability with respect to the controllable factors. The desirability function approach was initially introduced by Harrington (Derringer and Suich, 1980). Depending on whether one wishes to maximize, minimize or assign a target value to a particular response yi, the different desirability functions di(yi) used are those proposed by Derringer (Reddad et al., 2002). For comparative purposes, a desirability function (d = 0.8) was performed (Figure 8), the maximum dye removals proposed by the software are given at the optimal conditions obtained for both dyes: (for YT: pH = 1.808; T = 40.70 °C; C0 = 68.48 mg L–1 and adsorbent dose = 0.75 g L–1, and for MB: pH = 8.474; T = 41.01 °C; C0 = 54.745 mg L–1 and adsorbent dose = 0.69 g L–1).

Predicted responses using desirability function for (a) YT and (b) MB removal.
Adsorption kinetics and isotherms
The kinetics of YT and MB uptake are important for conditioning them for optimized operation at large-scale batch processes. It gives the adsorbate absorption, controls the residual time of the overall process and predicts the adsorption rate and its design. A few models have been suggested to study the behavior of adsorbents and thus propose adsorption mechanisms. The slope and intercept of the ln(qe−qt) plots versus (t) enable us to calculate the first-order rate constants K1 and qecal while the plot of t/qe vs (t) is used for the determination of K2 and qecal of the pseudo-second-order Table 4. A closer look at the kinetic modeling shows that the Elovich and pseudo-first-order models deviate from linearity, with R2 coefficients far from unity. Moreover, the high error functions, between experimental and calculated values (>5%), confirm the invalidity of these models in our case. On the contrary, the values of R2 (=0.999) and the lowest values (0.001<χ2 <0.037) are found for the pseudo-second-order kinetic model. In addition, the qe,exp and qe,cal values are also close to each other. The adsorption kinetics follows a pseudo-second-order model (Denis and Tezel, 2022; Nath et al., 2021). It suggests that the removal of YT and MB is a physisorption, with electron exchange with UWS where the dye molecules are attached to the adsorbent surface by hydrogen or Van Der Waals bonds.
The transport of dyes on the particle surface was studied using the intraparticle diffusion model. The line qt versus t1/2 shows multi-linearity, implying a two-step process and the calculated constants Kin (mg g–1 min–1/2) and C (mg g–1). The adsorption is complex but intraparticle diffusion is important in the early stages: (i) The early lines are due to intraparticle diffusion. (ii) The slopes are characteristic of the adsorption rate in the intraparticle diffusion region.
The constants of the different models, which describe the intraparticle diffusion and, based on literature reports, the C high value (>1) is synonymous with the appearance of a significant boundary layer effect within the system. Thus, the intraparticle diffusion cannot be regarded as a probable sorption mechanism in the present case.
To investigate the dyes uptake, the adsorption isotherms were used to evaluate the amount of MB and YT accumulation on the adsorbent surface and the type of interaction dye-adsorbent. The graphic representation of the linearized forms of the four isothermal models applied makes it possible to calculate the constants of the different models, grouped in. Fitness evaluation of experimental equilibrium data by different conventional models, based on the R2 value as criterion, shows the applicability of the Langmuir and Temkin models for the interpretation of experimental data with a maximum adsorption capacity
In a first step and over a short period, it is assumed that YT and MB are transported to the external surface of the adsorbent by film diffusion at a high velocity. After saturation, YT and MB molecules penetrate into the adsorbent by intraparticle diffusion through the pores and diffusion to the internal surface until equilibrium is established, as shown in the second line. The high C-values (>1) are synonymous with the occurrence of a significant boundary layer effect within the system. Therefore, the intraparticle diffusion cannot be considered as a likely sorption mechanism in our case. Isotherms are used to evaluate the adsorbed quantities of MB and YT on the adsorbent surface and the type of “dye-adsorbent” interaction. The linearized forms of the four applied isotherm models (Figure 9) allow us to calculate the constants of the different models (Table 5). The experimental data based on the R2 coefficient show the validity of the Langmuir and Temkin models with maximum adsorption qmax (= 55.55.30 mg g–1, R2 = 0.999 for YT) and (= 50 mg g–1, R2 = 0.999 for MB); the Langmuir model is appropriate to model the experimental data. Note that RL indicates the type of isotherm: Irreversible (RL = 0), Good (0 < RL < 1), Linear (RL = 1) or Bad (RL > 1). In our case, RL is less than 1, clearly indicating that the adsorption is suitably described by the Langmuir modem frequently, with one of the following three main hypotheses:
The adsorption sites have the adsorption energy, The adsorbate occupies only one site on the surface, with no interaction “adsorbate-molecules”, The adsorption is mainly confined to the adsorbent surface.
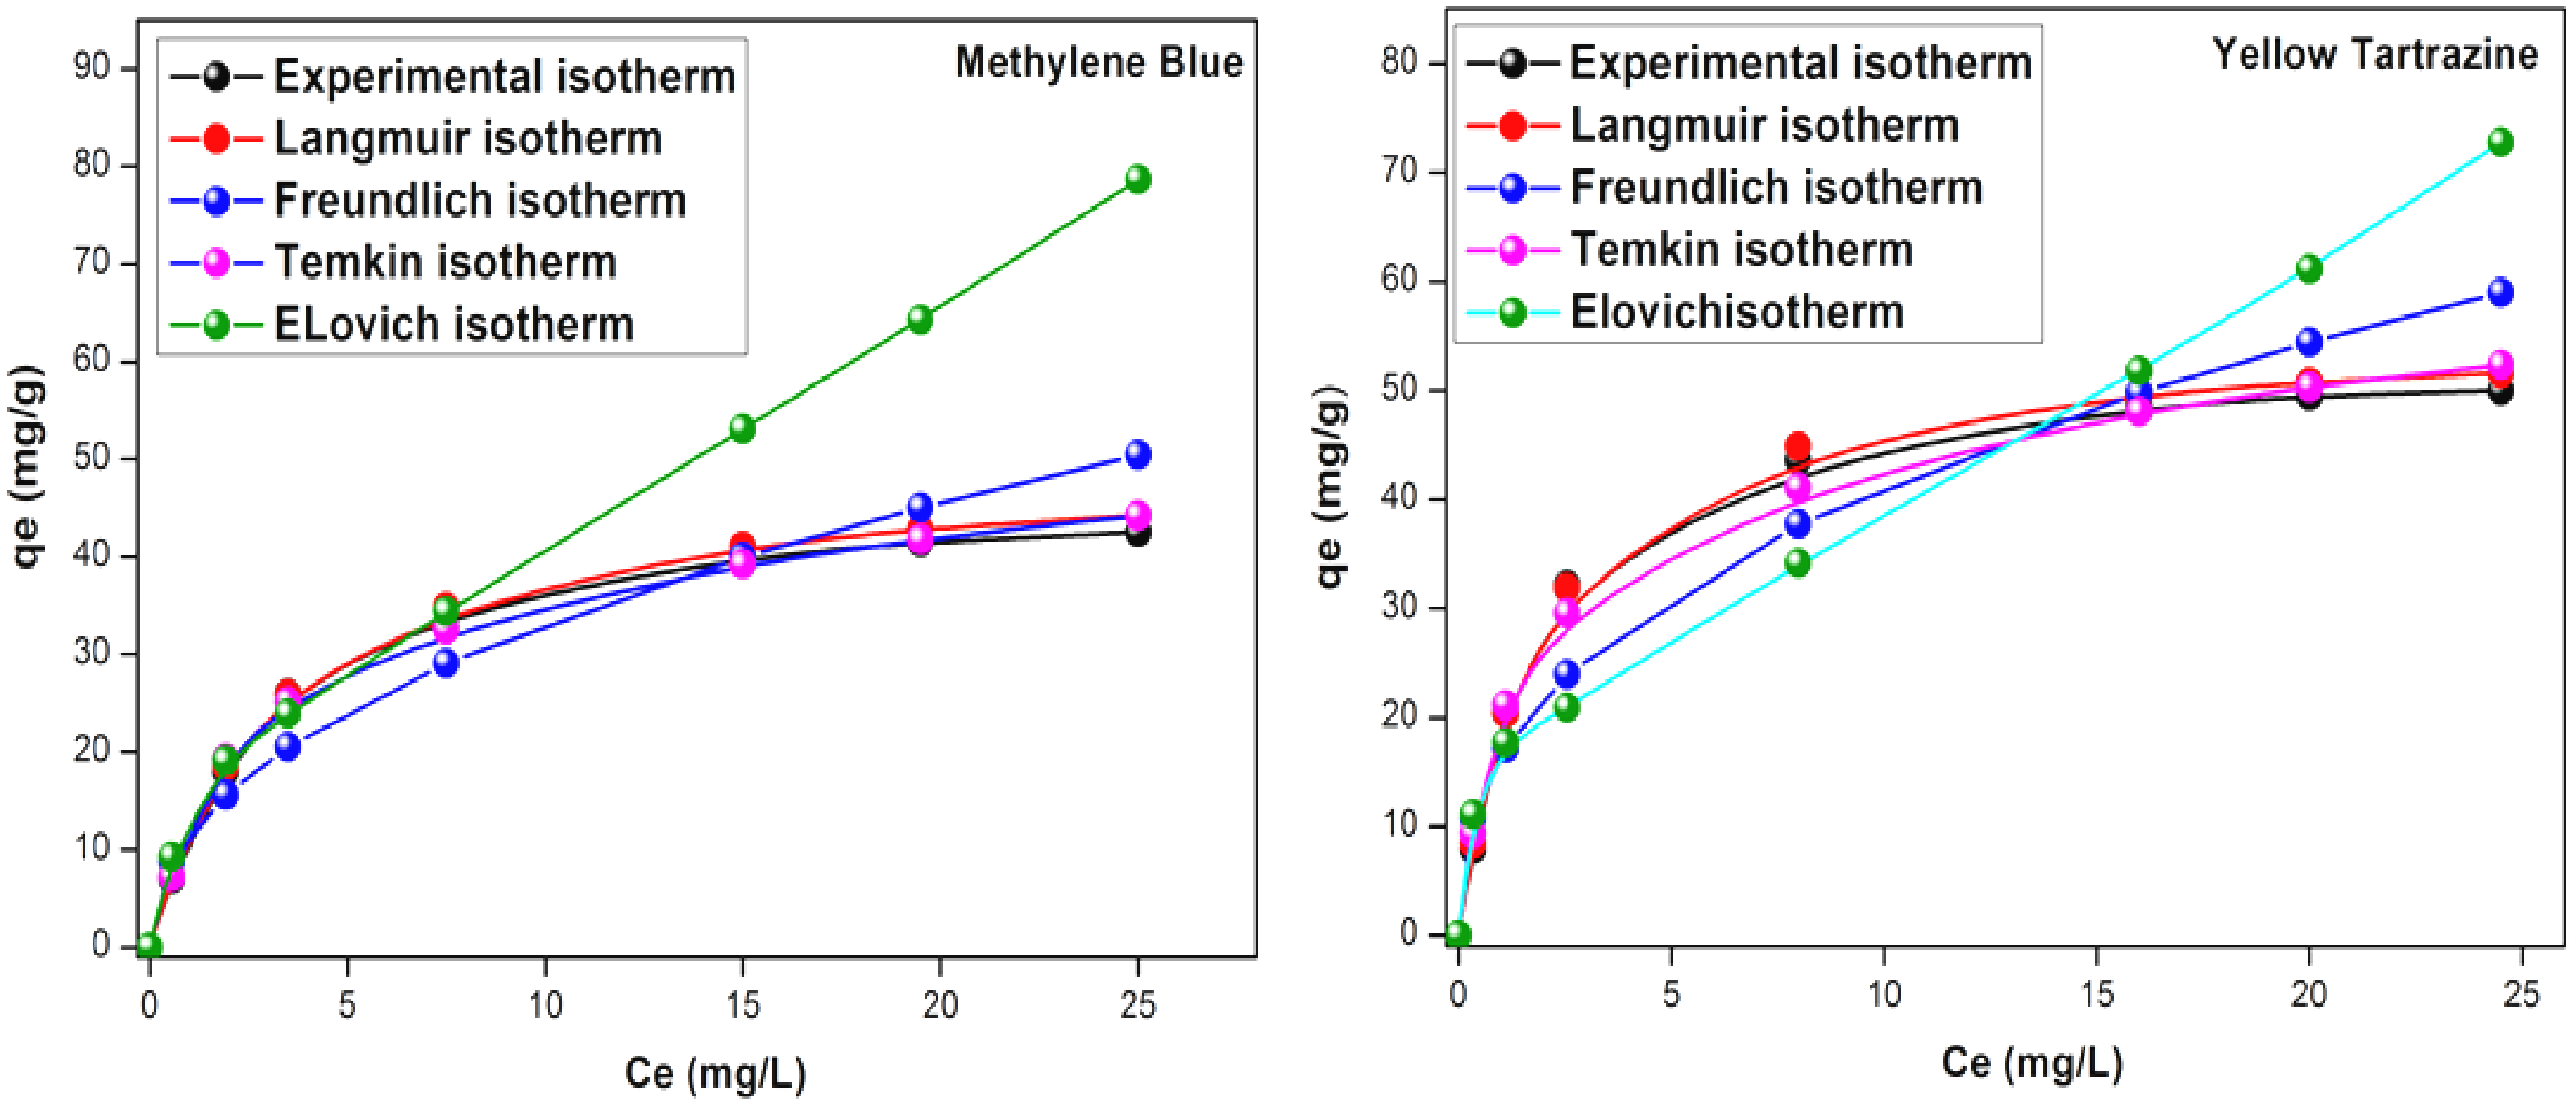
Isotherms adsorption for the different models in the optimum conditions.
Different parameters for adsorption isotherm models for the removal of MB and YT onto UWS at temperature 40 °C.

Effect of contact time and temperature
Figure 10 shows a rapid adsorption that saturates after 90 min which characterizes the formation of a monolayer. The adsorption capacity increases with Co, due to the diffusion of the dye towards the adsorbent, and which is accelerated by the concentration gradient. It can be predicted that the adsorption of dyes on UWS occurs in three stages:
Rapid adsorption of the dye due to the free sites on the UWS surface which reflects a linear increase in the adsorption capacity (0 to 30 min). Slowing down of the adsorption (30–90 min), with a decrease in the adsorption capacity attributed to a lower concentration of dye and to the lower number of available sites A tendency towards saturation of the unoccupied sites (90–100 min), reflected by a flattened region. The adsorption reaches a maximum within 60 min and then tends towards a constant value, where no molecule is adsorbed with equilibrium at 90 min.
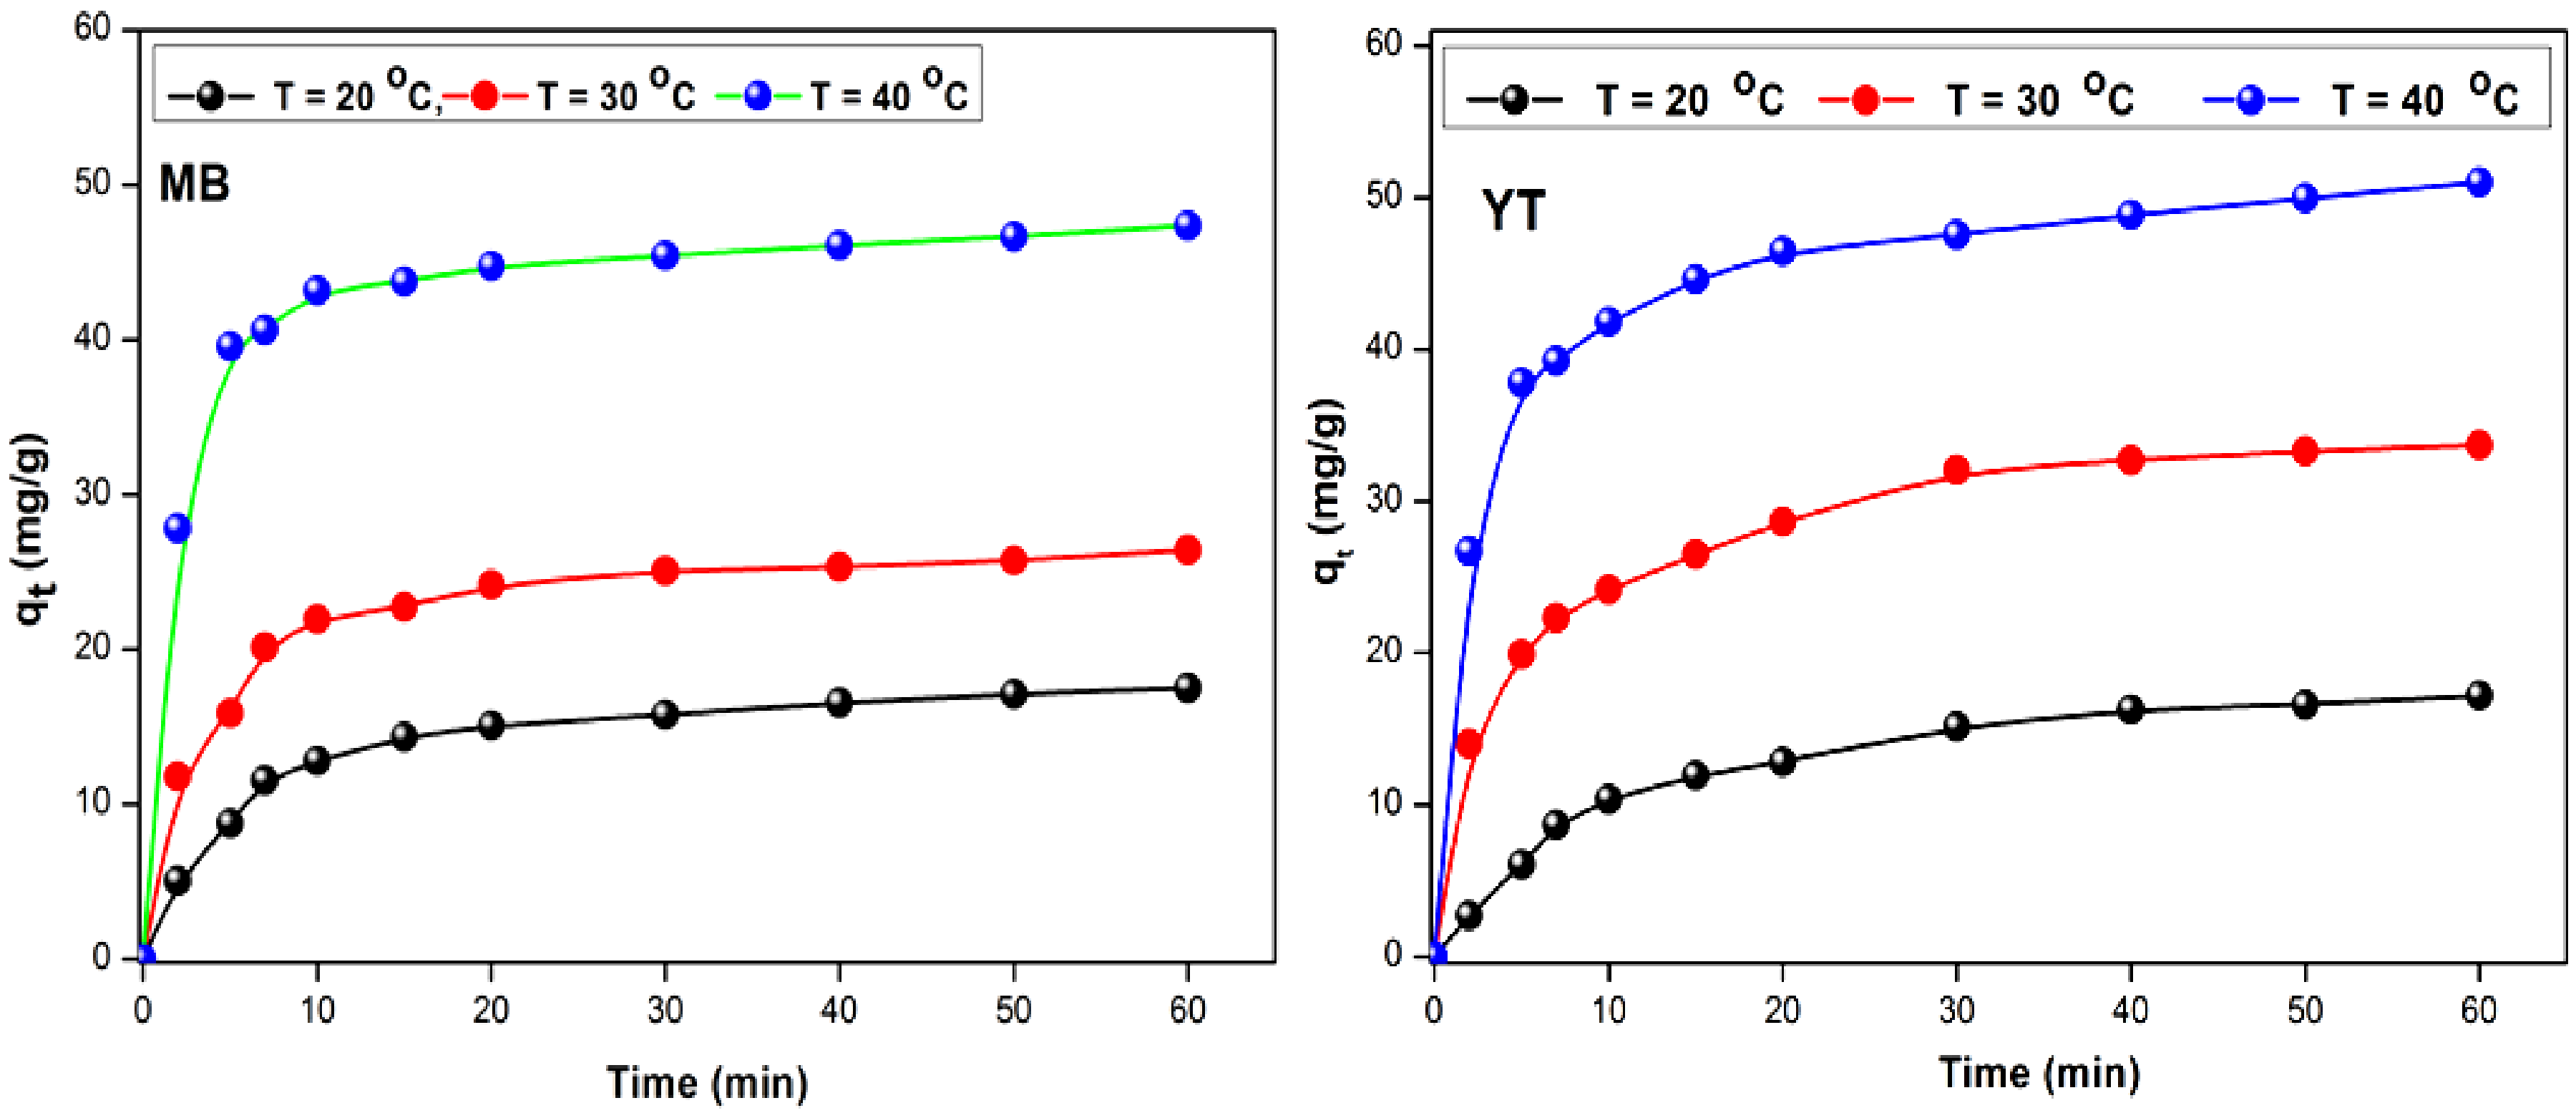
Effect of contact time and temperature for MB and YT adsorption.
The variation of the adsorption of YT and MB at equilibrium q as a function of temperature is illustrated in Figure 10. Increasing the temperature from 293 to 313 K enhances the adsorption (4.29 and 5.00 mg g–1 for YT) to (5.11 and 6.89 mg g–1 for MB) and this shows the endothermic nature of the adsorption for YT and MB. They also show that if their solution concentrations are high, there are very few molecules that diffuse to the surface of the unoccupied sites, which leads to an increase in the retention of MB and YT.
Thermodynamic properties modeling studies
The elimination dyes on adsorbent surface implies a variation of the free energy between the initial and final states. The adsorption of UWS increases with increasing temperature in the range (293–313 K) indicating a favorable adsorption for YT and MB (Figure 10) (Guo et al., 2020). Temperature has a dual effect, known to increase the mobility and the diffusion rate of molecules across the boundary layer and in the internal pores of the adsorbent particle, due to the decreased viscosity of the solution (Onal et al., 2007). The ratio of activity coefficients was assumed to be uniform in dilute solutions. As the dyes concentration in the solution approaches zero, the activity coefficient tends to unity. The constant Ke was determined from the plot ln(qe/Ce) versus Ce. The functions ΔHo, ΔSo and ΔGo (Figure 11(a)) obtained from the slope and intercept of the plots lnKo versus 1/T (Equations 18 and 16), are listed in Table 6. Furthermore, ΔH° (−59.59 and −107.19 kJ mol–1) for YT and MB indicate that adsorption is controlled by physical adsorption.

Estimation of thermodynamic parameters.
Estimation of thermodynamic parameters.

The standard entropy (ΔS°) is used to describe the randomness of the adsorption; the negatives values (−0.302 and −0.452 kJ mol–1K–1) for YT and MB imply an ordered nature of the dyes adsorption. As the adsorption time increases, the dyes move from an ordered state within the solution, resulting in an increased rate of diffusion and removal. The negative free energy (ΔG°) at the investigated temperatures indicates a spontaneous and favorable YT and MB elimination (Joseph et al., 2018) for the dyes.
The linearized form (Equation 21), LnK2 = f (1/T) (Figure 11(b)) enabled us to calculate the activation energies (Ea) (Table 6). The energies Ea (12.40 kJ mol–1 for MB, and 22.75 kJ mol–1 for YT), are characteristic of a physisorption since the Ea value for the chemical reaction is in the range (65–250 kJ mol–1) (Al-Rashed and Al-Gaid, 2012), this result is in good agreement with the obtained results (ΔH° = −59.55 kJ mol–1 for MB and −107.18 kJ mol–1 for YT), these values are less than 20 kcal mol–1, thus confirming a physisorption process.
Performance and regeneration of the UWS
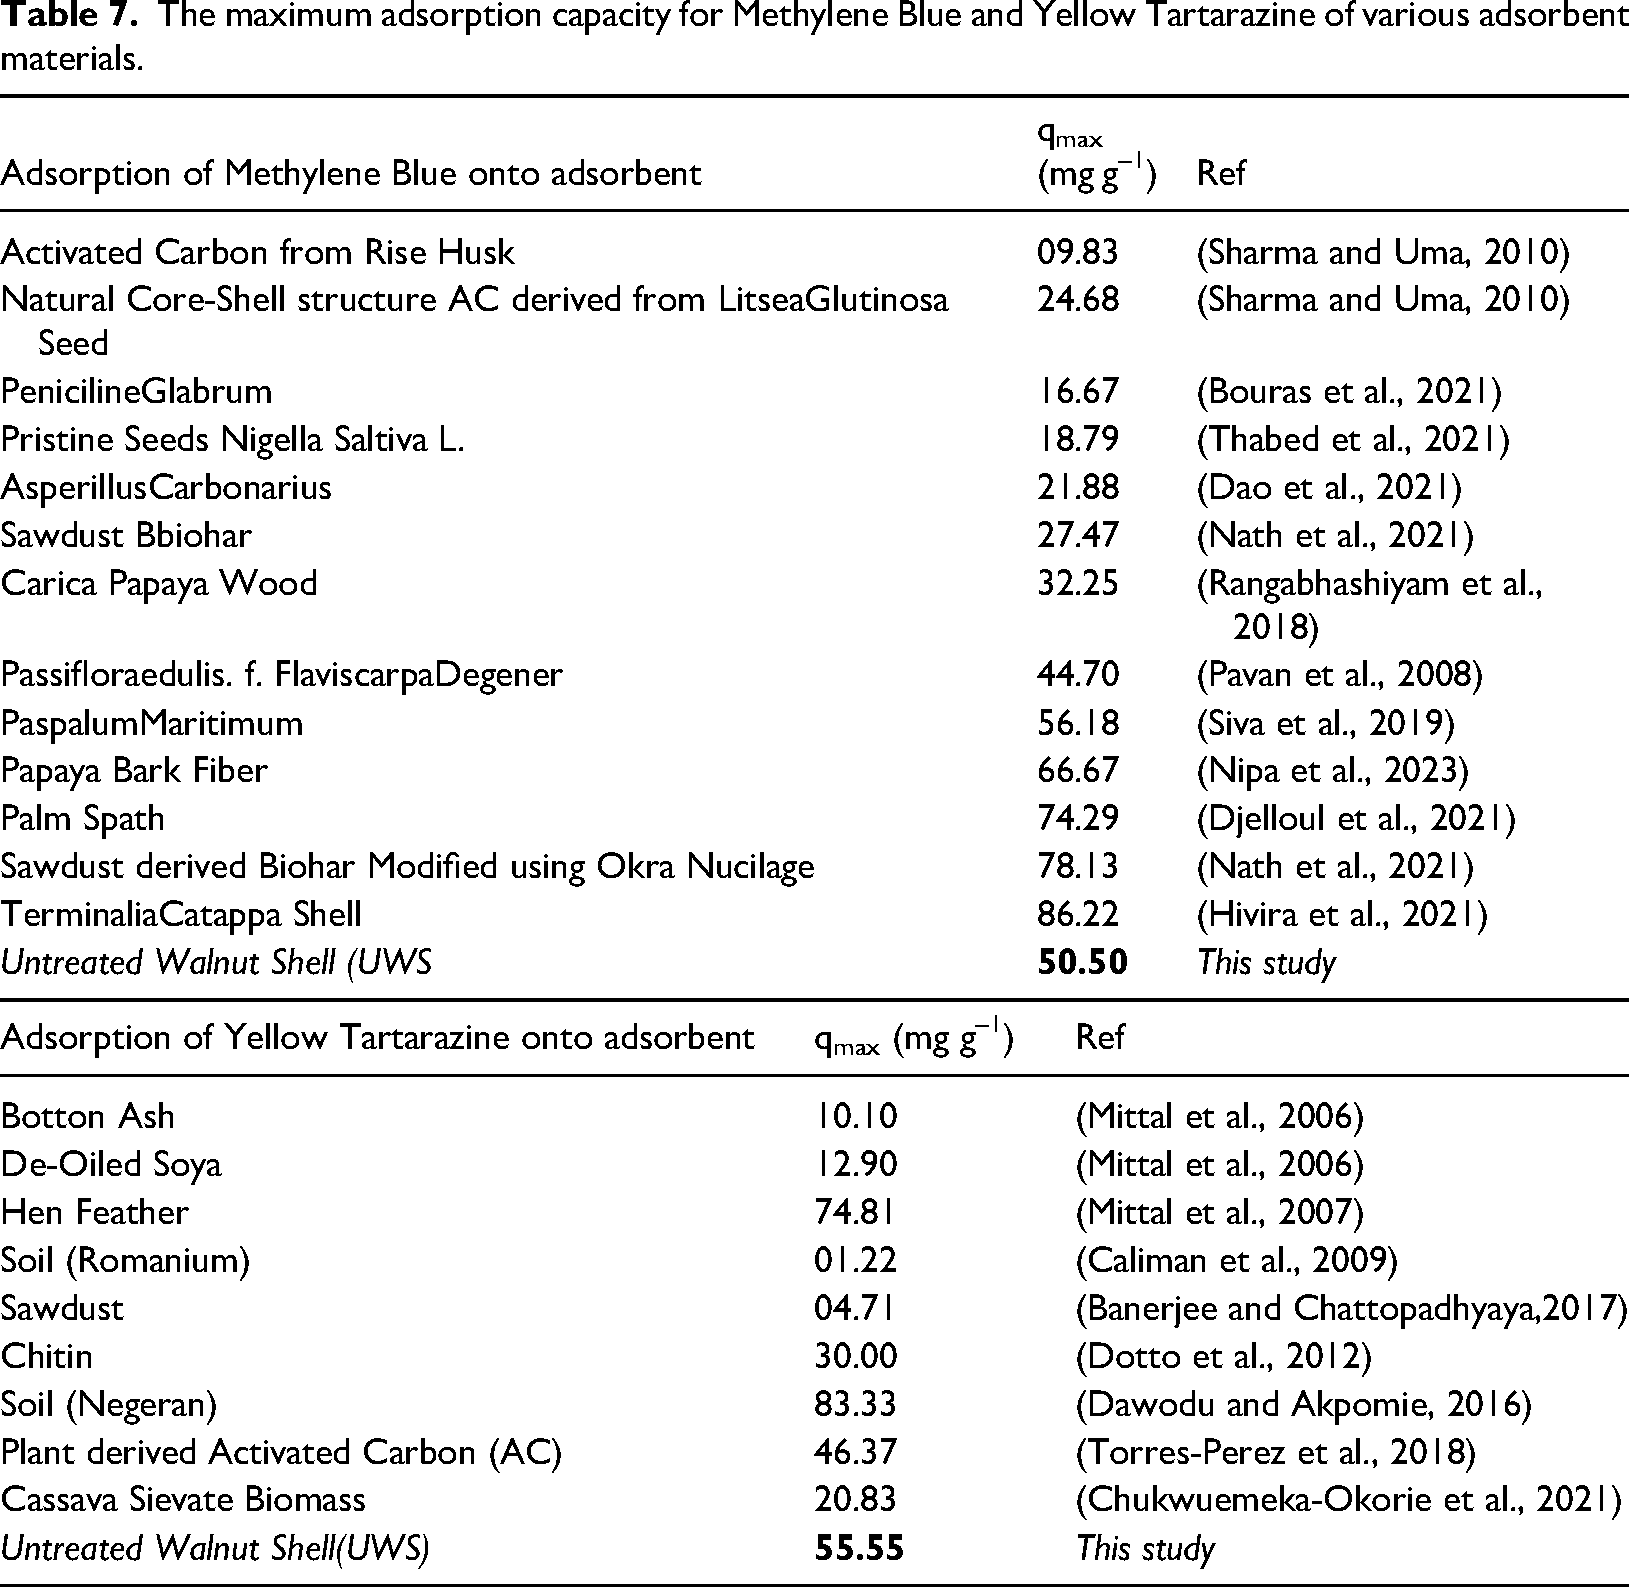
In order to reveal the efficiency of our adsorbent for MB and YT removal, we undertook a comparison with other adsorbents (Table 7), where the maximum Langmuir adsorption capacities (qmax) are reported. We can see that the adsorption of MB (55.55 mg g–1) and YT (50.00 mg g–1) is well positioned compared to other works. Due to pHpzc, UWS is an attractive adsorbent for basic and acidic dyes. Other factors were optimized such as pH, temperature, stirring speed, adsorbent dose, dye concentration and contact time.
The maximum adsorption capacity for Methylene Blue and Yellow Tartarazine of various adsorbent materials.
The regeneration of adsorbents is of utmost importance for the removal of dyes, not only for its reusability but also for its viability. Desorption is imperative and constitutes an intermediate step for new cycles. For the regeneration of adsorbents, some techniques are currently used such as electrochemistry, thermal and chemical methods. We chose the chemical method for economic reasons (Momina and Kafeel, 2023, 2024). For this, three different solvents: H2O, NaOH and HCl were used (Figure 12). The best desorption was obtained in HCl solution with a rate of 70.56%, followed by NaOH (58.24%) and H2O (35.23%. 2 cycles (R1 = 70.58%, R2 = 45.26%) were tested because of physisorption.

Regeneration of the adsorbent.
Adsorption mechanism probable
The possible mechanism followed in the MB and YT removal by using UWS according to the kinetic results is shown in (Figure 13). The adsorption mechanism includes

Probable mechanism for adsorption of MB and YT dyes by UWS.
Conclusions and future work
Globally, there is a need for a sustainable approach and the development of efficient processes for water treatment. Dye removal by new-generation adsorbents has been shown to be highly effective. In this study, the statistical methodology, Response Surface Design, was found to be effective and reliable in optimizing the adsorption conditions, which showed significant effects on the removal of YT and MB. Response surface plots were used to estimate the interactive effects of four independent variables (initial dye concentration, pH, temperature, and adsorbent dose) on the adsorption percentage. The second-order mathematical model was developed by regression analysis of experimental data obtained from 30 batch tests. The optimum conditions according to the response surfaces were evaluated using the desirability function (CYT = 60 mg L–1, pHYT = 1.5, DYT = 0.7 g L–1) and (TYT = 40 °C and CMB = 60 mg L–1, pHMB = 8.5, DMB = 0.7 g L–1 and TMB = 40 °C). A confirmation test was undertaken to determine the accuracy and reliability of the optimization with maximum removals of YT (76.149%) and MB (76.81%). Error analyses were used to measure the goodness of fit. The adsorption kinetic data obey a pseudo-second-order model. The Langmuir, Freundlich, Temkin and Elovich equations were used to fit the experimental isotherms. The Langmuir model gave a better correlation with qmax capacities (55.55 mg g–1, YT) and (50.00 mg g–1, MB). The free energy (ΔG°); enthalpy (ΔH°) and entropy (ΔS°) predict the character of dye adsorption. Their negative values predict spontaneous and exothermic adsorption with physisorption for both dyes. The present study showed that UWS requires chemical and physical activations with ZnCl2 as activating agent for high affinity towards cationic and anionic pollutants through increasing porosity.
Footnotes
Acknowledgements
The authors gratefully acknowledge support from the Laboratory of Applied Chemistry and Materials (LabCAM), University of M’hamed Bougara of Boumerdes, Avenue de l'Indépendance Boumerdes, 35000. Algeria and the Laboratory of Storage and Valorization of Renewable Energies, Faculty of Chemistry (USTHB) Algeria.
Author contributions
M. Trachi and M. Abbas: preparation, conceptualization, formal analysis investigation writing-original draft and methodology. M. Trari and M. Abbas: validation data curation, supervision and writing-review and editing. All authors have read and agreed to the published version of the manuscript.
Data availability
All data generated or analyzed during this study are included in this published article. No AIF related data was generated in this study.
Declaration of conflicting interests
The authors declared no potential conflicts of interest with respect to the research, authorship, and/or publication of this article.
Funding
The authors received no financial support for the research, authorship, and/or publication of this article.