
Abstract
This paper aims to investigate the uptake of two basic dyes (methylene blue [MB] and brilliant cresyl blue [BCB]) using the formaldehyde-treated algae Fucus vesiculosus (FV-FORMALD). The surface and morphology of modified biomass was characterized by the point of zero-charge (pHPZC), Brunauer–Emmett–Teller (BET) surface area (SBET), scanning electron microscopy (SEM/EDS), and Fourier-transform infrared spectroscopy. The equilibrium data were best described by the Langmuir and Freudnlich isotherm model for MB and BCB, respectively. Kinetics modeling shows that the adsorption of both dyes onto FV-FORMALD was well described by pseudo-second order. The thermodynamics parameters validated the exothermic nature and the spontaneously of the adsorption of both dyes. The optimum conditions for the adsorption of MB and BCB were at pH = 8 and 4, adsorbent concentration = 2 and 1 g L−1, and T = 313.15 and 300.15 K, respectively. The FV-FORMALD had reuse potential for at least three cycles with high adsorption capacities of MB and BCB dyes. A colored real wastewater was successfully treated using FV-FORMALD. According to the results, the brown algae FV-FORMALD could be considered appropriate for removing cationic dyes due to its high efficiency and an environmentally friendly, sustainable, and low-cost approach.
Introduction
Overpopulation, urbanization, and industrial development are the leading causes of environmental pollution. Pharmaceutical, cosmetic, agricultural, and textile industries are the main polluters because their wastewater effluents are discharged without or with poor treatment (Raj et al., 2020). The wastewater effluents from the textile industry are a mixture of recalcitrant pollutants such as surfactants, disinfectants, and high concentrations of dyes (Paździor et al., 2017). Dyes are applied in biology and medicine for microbiological and histological stains. Water that is not clear is associated with poor quality or polluted water. A low dye concentration (1 mg L−1) is enough to be visually perceived (Malik et al., 2007) and may also present a risk to human health because some dyes are carcinogenic and mutagenic. Therefore, its regulation has been recently considered by the Zero Discharge of Hazardous Chemicals Program, which is an organization dedicated to eliminating hazardous chemicals in the leather, textile, and synthetic sectors (ZDHC, 2022).
The World Health Organization suggests drinking water should ideally have no visible color, or that levels of color below 15 TCU (True Color Units) are often acceptable to consumers (World Health Organization, 2022). The problem of color in water can be assumed as an aesthetic situation because water that is not transparent can be perceived as dirty water (Naseem et al., 2019). Furthermore, the loss of water transparency causes a decrease in the sunlight penetration, thus affecting the photosynthetic function of plants (Garg et al., 2004) and to a decrease in the amount of dissolved oxygen available to aquatic flora and fauna (Lakshmi et al., 2009). Therefore, color affects the balance of aquatic ecosystem and can lead to species turnover (U.S. Environmental Protection Agency, 1974).
The treatment of wastewater from the textile industry is one of the main environmental concerns today. Organizations such as Environmental, Health, and Safety (EHS) propose in their guidelines biological and physicochemical methods as the predominant control option for the treatment of the color parameter (EHS, 2007). Some biological materials, such as bacteria, fungi, yeasts, and algae, have demonstrated their ability to remove various synthetic dyes (Ali, 2010). These materials can break the bound of the chromophoric group by enzymatic action and remove the color (Satheesh Babu et al., 2015). The advantages of biological methods include that they are economically viable, environmentally friendly, and generate less sludge volume compared to other techniques, while their principal disadvantage is the transition from laboratory scale to real scale (Bhatia et al., 2017). Some bacteria have been successfully employed to eliminate different dyes. For example, the Bacillus sp bacteria was used in a study by Ezhilarasu (2016) to remove Methyl Red (Ezhilarasu, 2016). Adeeb et al. (2014) removed crystal violet dye using three different bacteria, Clostridium perfringens, Pseudomonas aeruginosa, and Proteus vulgaris.
The most applied physicochemical methods for dye removal are adsorption, ion exchange, oxidation process, and irradiation. In adsorption, the dye is adsorbed on the surface of the material through chemical or physical interactions. Various waste materials have been used as an adsorbent for dye removal. For example, sawdust was used to remove brilliant cresyl blue (BCB; Elhami et al., 2011) and methylene blue (MB; Garg et al., 2004). In addition, different types of resins were applied to remove basic dyes such as safranin T, Nile blue, and BCB (Iyim et al., 2008) and cationic dyes: brilliant green, methyl violet, MB, phenosafranine, and BCB (Çinar et al., 2018) using ion exchange.
Physicochemical techniques have a high dye removal efficiency, are easy to use, nevertheless require high production and operating costs, regeneration of the material is not always possible, and produce sludge or by-products.
Marine macroalgae such as Sargassum, in their raw state or after simple processing, such as washing and drying, present favorable chemical characteristics for adsorption of various pollutants from aqueous solution (Popa and Volf 2018). Therefore, the arrival of Sargassum to the coasts of Mexico and other parts of the world is seen as a socioeconomic and environmental problem. However, these seaweeds can be removed from beaches and applied as biosorbents with a simple process to remove dyes. Recently, Sargassum tenerrimum, Sargassum sp, and Sargassum ilicifolium were used to remove eosin yellow (Tukaram Bai et al., 2020), sulfur black (Vijayaraghavan and Shanthakumar, 2015), and five different dyes: methyl blue, fuchsin acid, rhodamine B, MB, bromocresol purple, and methyl orange (Tabaraki and Sadeghinejad, 2017). In addition, algae have shown promising results for the sorption of inorganic compounds such as heavy metals (Khajavian et al., 2019). Based on the above, algae have multiple applications, highlighting the removal of pollutants where high percentages of removal have been found. Furthermore, its main advantage is an economical alternative compared to other biosorbents.
Sargassum crasifolium was treated with formaldehyde and used to remove Pb (II) (Zein and Mawardi, 2009). Hypnea Valentiae and Gracilaria verrucose treated with formaldehyde were used to remove Co(II) (Vafajoo et al., 2018) and Cr (VI) (Ata et al., 2012), respectively. The amine groups present in the algae surface and the formaldehyde can form hydroxylamine (Zein and Mawardi, 2009). Moreover, formaldehyde can cause methylation of the amine groups (Jianlong, 2002). According to Park et al. (2005), methylation of amine groups can cause the reduction of the number of positively charged sites on the biomass surface. Based on the capacity of the formaldehyde of increase the binding sites in the surface of the algae due to cross-linking process. In this work, the brown algae Fucus vesiculosus was chemically treated with formaldehyde (FV-FORMALD) and used to remove two dyes of different chemical nature: MB and BCB in aqueous solution, to compare and evaluate the removal efficiency. The effects of the following parameters on the adsorption process were evaluated: contact time, dye concentration, temperature, and pH of the aqueous medium, as well as the biomass concentration. The thermodynamics adsorption parameters for both dyes were calculated. In order to evaluate the possibility of the reutilization of the loaded biomass, adsorption, and desorption cycles were performed.
Experimental
Dyes
Methylene Blue C.I. 52,015 (C16H18ClN3S) and BCB C.I. 51,010 ((C17H20ClN3O)2·ZnCl2) were procured from Merck and Fagalab, respectively, as a dye source, their chemical structures were drawn with ChemDraw professional software (Figure 1(a) and (b), respectively).

Chemical structure of (a) brilliant cresyl blue and (b) methylene blue (ChemDraw professional software).
Preparation of biosorbent
Fucus vesiculosus was collected from the coast of El Recodo Beach, Playa del Carmen, Quintana Roo, Mexico, in March 2022. The collected algae were washed with distilled water several times and then sun dried for three days. Next, the biomass was washed again at room temperature (27 °C) in 1 L of 2% v/v formaldehyde solution for 24 h. Subsequently, the solution is decanted, and the biomass is thoroughly rinsed with deionized water. A few milliliters of washing solution are then collected and poured into a cell to scan in a UV-Vis spectrophotometer from 200 to 760 nm. The washing process was repeated three times until the spectrum showed no signal. The washed algae were then dried at 60 °C for 8 h. The dried algae FV-FORMALD were stored in a desiccator for later use in adsorption experiments.
Characterization techniques
pHPZC
The pHPZC of the raw and brown algae FV-FORMALD was determined using 0.01 M NaCl as the background electrolyte solution; the pH of the working solutions was fixed between 1 and 12 using 0.1 M NaOH or 0.1 M HCl. First, the initial pH of each solution was measured. Subsequently, solutions were put in contact with the algae at 120 rpm at room temperature for 1440 min. The solutions were decanted, and the pH values were measured using a Hanna instruments (model HI2020-01) pH meter.
Fourier-transform infrared spectroscopy
Fourier-transform infrared (FTIR) Fucus vesiculosus brown algae spectra (4000–400 cm−1) before and after dye biosorption were recorded on a Nicolet Nexus 670 FTIR spectrophotometer. The samples were prepared using the KBr pellet method.
Scanning electron microscopy and EDS
The surface morphologies of the raw (FV) and modified seaweed (FV-FORMALD) were observed by scanning electron microscopy (SEM) using a JEOL JSM-IT300 electron microscope operating at 20 kV, and the superficial composition was estimated using an EDS system coupled to the electron microscope.
Brunauer–Emmett–Teller surface area (SBET)
Brunauer–Emmett–Teller (BET) surface area and pore size were measured in a Nova 2200e equipment (Quantachrome). FV-FORMALD was pretreated under vacuum at 393 K for 16 h. The adsorption isotherm of N2 onto FV-FORMALD was performed at 77 K. The BET theory and the BJH method were used to calculate the surface area and the pore size.
Sorption studies
Effect of contact time
Adsorption kinetics of both dyes (MB and BCB) was performed as follows: 0.01 g of FV-FORMALD and 10 mL aliquot of dye solution (1000 mg L−1) were contacted for different time's intervals (5–1440 min) in a rotating incubator at 150 rpm at room temperature. After each contacted time, the samples were centrifuged and analyzed by UV-Vis spectrophotometry (Thermo Scientific, Evolution 220) at a wavelength of 664 and 635 nm for MB and BCB, respectively.
Effect of dye concentration
To study the effect of the initial dye concentration on the adsorption capacity of the algae, different MB and BCB dye concentrations were produced from 100 to 1000 mg L−1. Then, 0.01 g of FV-FORMALD samples were added to 10 mL of each dye solution and kept in contact for 360 min, under the same conditions mentioned above.
Effect of pH
The initial pH medium's effect on MB and BCB adsorption was explored in the range of 2–8 for both dyes. Different dye concentrations were prepared (100–1000 mg L−1). pH was adjusted by adding 0.1 M HCl or 0.1 M NaOH. The conditions were the same as for the sorption isotherm study.
Adsorbent concentration effect
The effect of FV-FORMALD algae concentration on the dye sorption was evaluated. An aliquot of 10 mL of each dye (1000 mg L−1) was put in contact with the following amounts of biomass: 1 g L−1 to 10 g L−1 for 360 min, at room temperature, and pH = 4 for both dyes.
Effect of temperature
A volume of 30 mL of each dye at different concentrations (100–1000 mg L−1) was placed in contact with 0.03 g of biomass for 360 min, 150 rpm agitation, and at the following temperatures: 300.15, 313.15, and 330.15 K.
Kinetic and isotherm models
The adsorption capacity (qe) was calculated using the following equation:


The equilibrium data obtained from concentration, pH, and temperature effects mentioned above were fitted to the linear and non-linear Langmuir and Freundlich models. For linear form of Langmuir isotherm (equation (7)), the parameters were obtained from the intercept and slope of the plot of


where n (dimensionless) and KF (mg1−1/nL1/ng−1) are the exponent and the Freundlich parameter, respectively.
Error functions analysis
In order to confirm the accuracy of the measurement results and a good fit of the experimental adsorption data with the proposed kinetic and isotherm models, four error functions such as the average percentage error (ARE), nonlinear chi-square test (χ2) (Al-Ghouti and Da’ana, 2020), residual root mean square error (RMSE), normalized standard deviation (Δ(%)) (Rahman and Sathasivam, 2015) were calculated with the equations given below:


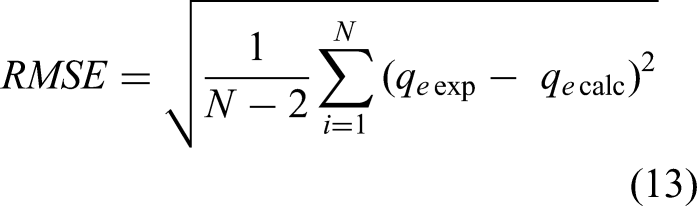

where qe,exp is the adsorption capacity obtained from the batch experiment (mg g−1), qe,calc is the adsorption capacity obtained with a mathematical model corresponding (mg g−1), and N is the corresponding number of observations in the experiment. The ARE, χ2, RMSE, and Δq (%) values obtained for the kinetic and isotherm models were compared to each other, and the lowest indicates best fitted model.
Reusability study
The reuse of the FV-FORMALD biosorbent and the recovery of MB and BCB are very important to assess the sustainability and cost-effectiveness of adsorbent. For this purpose, three adsorption/desorption cycles were carried. Many researchers have used HCl as the main eluent of MB dye (Hidayat et al., 2022; Momina et al., 2020; Tehubijuluw et al., 2021). In this case, 0.1 M HCl solution was used as eluent to desorb MB and BCB dye from the adsorbent surface.
For the adsorption step, 50 mL of each dye at the initial concentration of 1000 mg L−1 was placed in contact with 50 mg of FV-FORMALD and stirred at room temperature for 6 h. The mixture was then centrifuged to obtain the adsorbent, and the residual concentration was measured by UV-vis spectrophotometric analysis. The quantity of MB or BCB adsorbed is calculated using equation (1). For desorption process, the loaded FV-FORMALD was added into 50 mL of 0.1 M HCl solution followed by continuous stirring at room temperature for 6 h. Next, the sample was centrifuged and the residual concentration of MB or BCB was measured. The quantity of dyes desorbed Qdes (mg g−1) was calculated using equation (15) (Dada et al., 2021):

where Cdes (mg L−1) is the concentration of dye left after desorption, V (L) is the volume of the dye solution, and m (g) is the FV-FORMALD mass.
The regenerated FV-FORMALD was washed severally with deionized water and dried at 60°C for 8 h before the next cycle of adsorption took place. Three cycles of consecutive adsorption–desorption studies were carried out.
Real colored wastewater treatment
The waste generated in our experiments was used as real colored wastewater. The sample has a blue color and pH = 2.4. A 10 mL aliquot of the wastewater was placed in contact with 0.01 g of FV-FORMALD at room temperature for 6 h. The sample was scanned in a UV-Vis spectrophotometer from 380 to 750 nm before and after the adsorption process.
Results and discussions
pHPZC
The determination of the adsorbent's zero-point charge is useful because the dye's adsorption depends on the solution's pH. Figure 2 shows that pHPZC = 7.2 for raw Fucus vesiculosus (Raw-FV) and pHPZC = 4.7 for the algae after treatment with formaldehyde (FV-FORMALD). The pHPZC of FV-FORMALD is 2.5 units lower than that raw brown algae, suggesting a change on the surface of algae after the treatment with formaldehyde. When the aqueous media has pH < pHPZC, the algae surface is positively charged, favoring the biosorption of anions, while at pH > pHPZC, the algae surface is negatively charged, favoring the biosorption of cations. Furthermore, the fact that the pHPZC of FV treated with formaldehyde is lower than that of raw FV is an advantage, because it gives a higher range of pH solution values for the removal of cationic dyes than raw algae and, consequently, it can be suspected that the adsorption of MB and BCB could be improved for FV-FORMALD.

pHPZC determination of raw Fucus vesiculosus (Raw-FV) and Fucus vesiculosus treated with formaldehyde (FV-FORMALD).
Fourier-transform infrared spectroscopy
Fourier-transform infrared spectra of FV-FORMALD were recorded before and after adsorption of MB and BCB within the range of 650–4000 cm−1 (Figure 3(a)–(c)). The vibrational spectra of FV-FORMALD before dye biosorption showed a broadband between the range 3200–3500 cm−1, representing the O-H and -NH groups of the carbohydrates and protein present in the algae. The peak at 3300 cm−1 corresponds to O-H vibrations of cellulose, pectin, and lignin, the peak at 2920 cm−1 represents (C-H) of alkyl groups (Gokulan et al., 2019), a peak around 1600 cm−1 could be attributed to the C=O stretch of the carboxylic or aldehyde functions. The peak at 1025 cm−1 could be related to the C–O stretching vibration of carboxylic acids, alcohol, or phenol. After MB biosorption, the peaks shifted to 3275, 1595, and 1025 cm−1, respectively, suggesting that these functional groups on the surface of the algae interacted with the dye. In addition, two new signals were identified, at 1330 cm−1 (C–N stretching) and at 884 cm−1 (C–H bending of arene rings), which identify the presence of the MB molecule (Salazar et al., 2017). After BCB biosorption, the peaks shifted to 3290, 1590, and 1010 cm−1, respectively, indicating that the hydroxyl, amine, and carboxyl, are the main groups responsible for the biosorption of the two dyes (Table 1).

FTIR of (a) FV-FORMALD (b) FV-FORMALD-MB and (c) FV-FORMALD-BCB.
FTIR bands before and after the adsorption process.

Scanning electron microscopy/EDS
Figure 4 shows the micrographs and respective EDS analysis of raw and treated algae FV before and after adsorption of BCB and MB dyes. As can be seen, the raw algae (Figure 4(a)) present a nonuniform and elongated particle; however, after washing with formaldehyde (Figure 4(c)), the FV-FORMALD shows a rougher and more heterogeneous surface. The morphology of the treated sample could improve the uptake process because it increases the surface area of the adsorbent (Lebron et al., 2021), and the cavities, which allow access to the dye molecule and its subsequent retention (Reck et al., 2018). EDS analysis of algae shows the approximate elemental analysis of the surface before and after biosorption. The results show that raw FV and treated with formaldehyde materials have mainly carbon and oxygen content (Figure 4(b) and (d)), a result expected for organic materials. After MB biosorption, an increase in sulfur percentage (from 1.3% to 1.5%) is observed in Figure 4(f); this element is present in the MB molecule (Figure 1(b)) and confirms the dye biosorption onto algae. After BCB biosorption, EDS analysis shows 0.4% of zinc and 0.1% of chlorine (Figure 4(h)); these two elements are characteristic of the BCB molecule (Figure 1(a)). Furthermore, an increase the percentage of carbon (from 59.4% to 61.4%), indicates that both dyes were adsorbed on the FV-FORMALD surface. Finally, SEM and EDS also analyzed the FV-FORMALD sample in contact with deionized water. The results are shown in Figure 4(i). The micrographs of the blank and those of the adsorbed dyes (Figure 4(c) and (e)) are different. Therefore, it is verified that the change in the biomass surface was due to the sorbed dyes and not to the biosorbent interaction with the aqueous solution.

SEM images and EDS analysis of (a) and (b) raw seaweed Fucus vesiculosus, (c) and (d) Fucus vesiculosus treated with formaldehyde (FV-FORMALD), (e) and (f) FV-FORMALD after methylene blue (MB) biosorption, (g) and (h) FV-FORMALD after brilliant cresyl blue (BCB) biosorption and (i) and (j) FV-FORMALD-H2O.
Brunauer–Emmett–Teller surface area (SBET)
The adsorption–desorption isotherm of N2 on the FV-FORMALD sample is shown in Figure 5. As can be seen in this figure, the shape of isotherm allows it to be classified as a type IV isotherm (IUPAC classification), this type of isotherm is characteristic of mesoporous materials (Barton et al., 1999).

Adsorption–desorption isotherm of N2 on the FV-FORMALD.
The results of surface area, pore volume, and mean pore diameter were calculated by BET and BJH methods and are shown in Table 2. The surface area of FV-FORMALD is similar with those of other algae species, slightly higher than of surface of the Sargassum horneri but slightly lower than that of Sargassum muticum. Based on the average pore size (7.48 nm), the pore of FV-FORMALD can be classified as mesoporous like the other algae species as shown in Table 2. Other mesoporous materials have been used to effectively remove MB. Pang et al. (2017) used a mesoporous mineral (birnessite) and achieved 95% of MB removal efficiency. Mesoporous activated carbon from dragon fruit peels achieved a maximum adsorption capacity (Qmax) of MB equal to 195.2 mg g−1 (Jawad et al., 2021).
Results surface area, pore volume, and mean pore size for different algae materials.

Effect of contact time
Figure 6(a) and (b) depicts the adsorption kinetics of BCB and MB dyes, respectively, by the FV-FORMALD and their modeling with the PFO and PSO order nonlinear equations. It was observed that BCB and MB were rapidly removed during the first 30 min; after this time, the adsorption capacity gradually reached equilibrium; this behavior is due to the that during the initial biosorption phase, dye particles are more present in the solution and the actives sites in algae are unoccupied and available (Silva et al., 2019). Adsorption equilibrium was reached in around 360 min for both dyes.
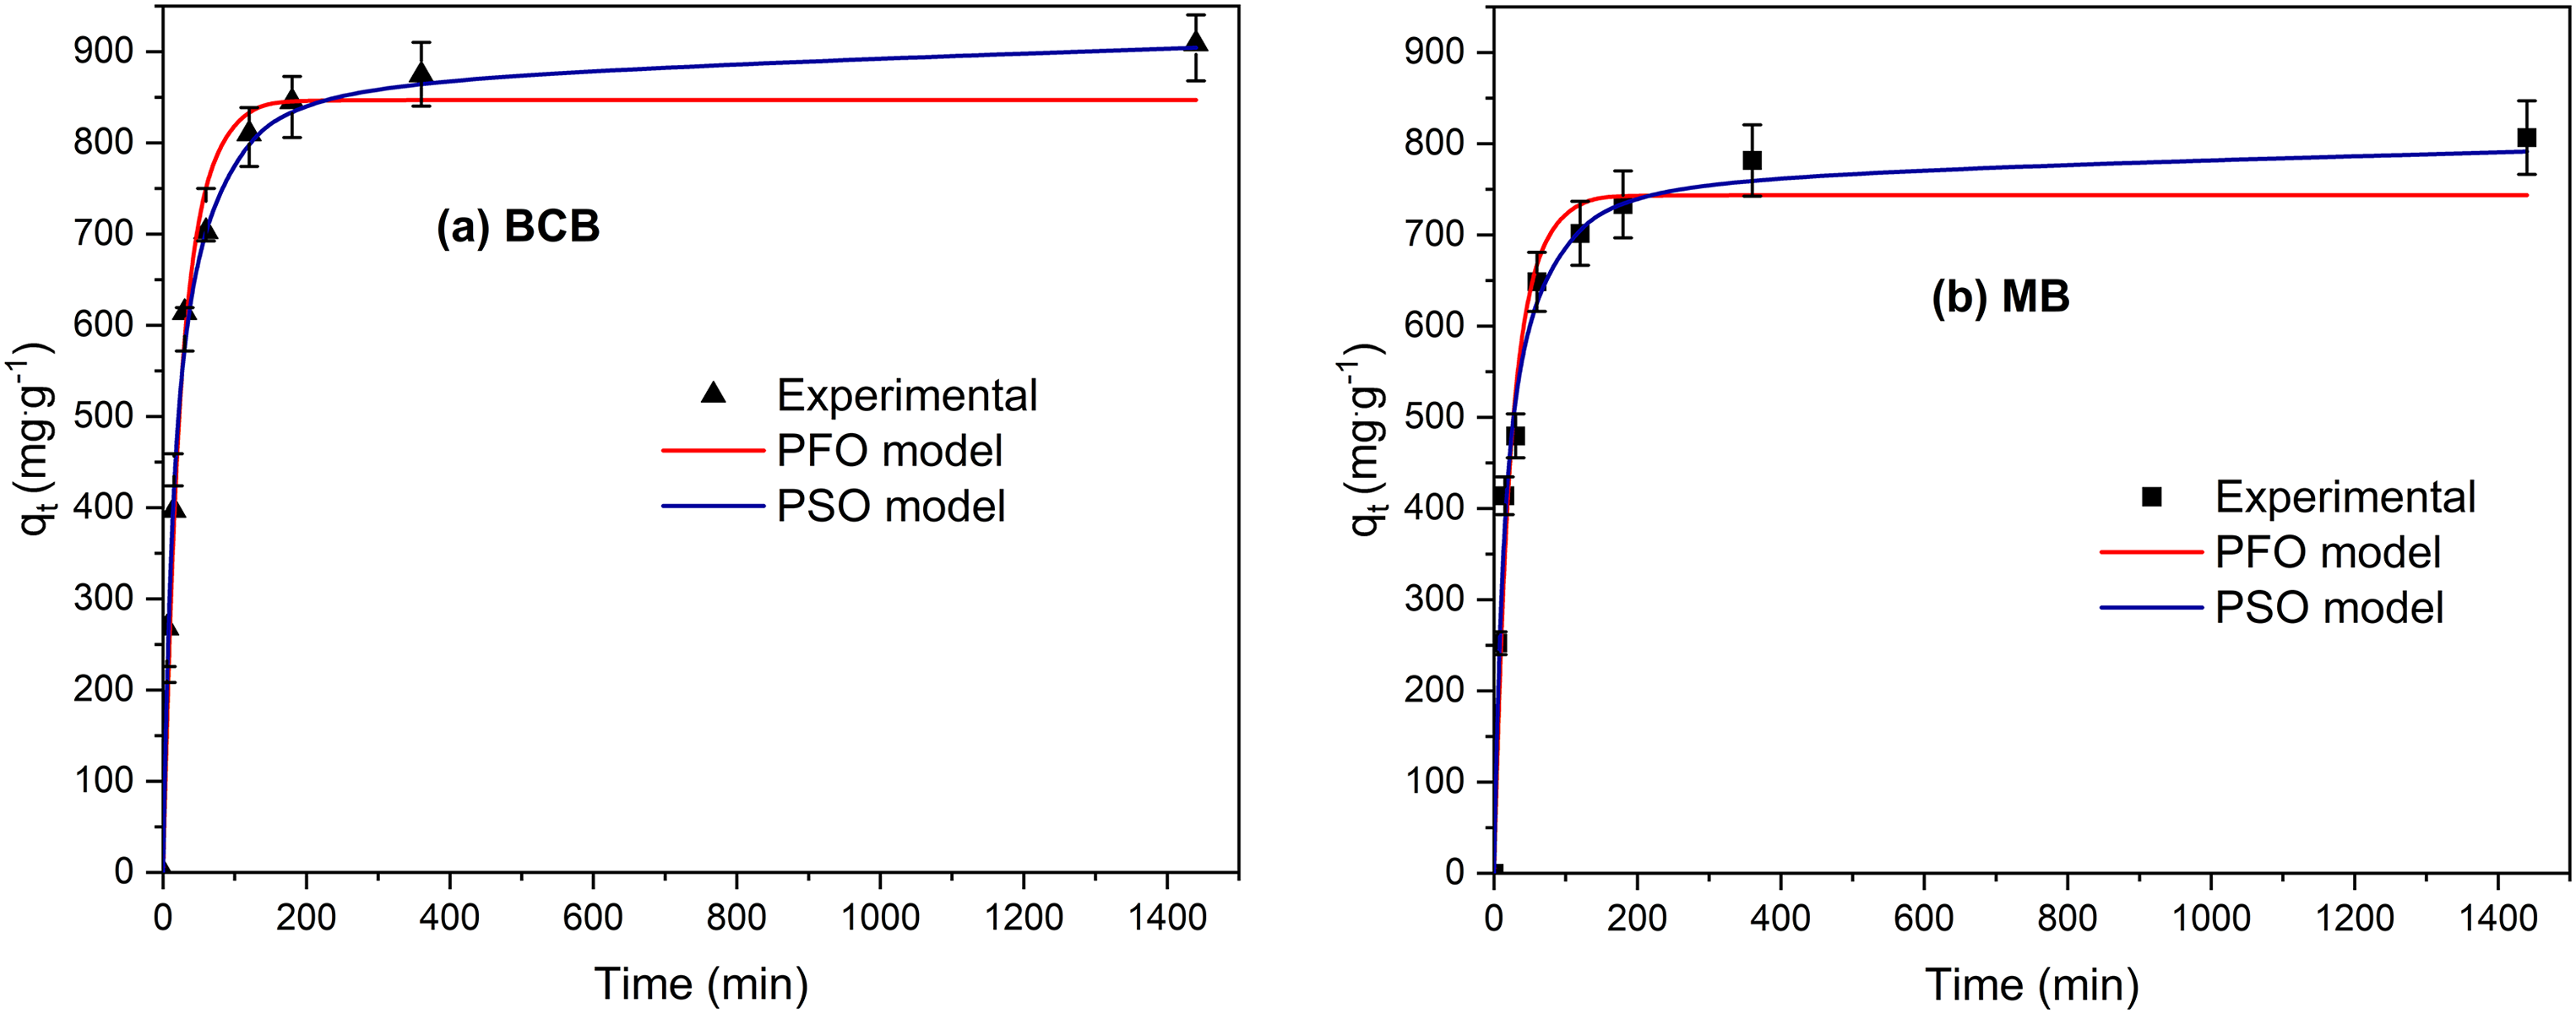
Kinetic modeling of (a) BCB and (b) MB according to pseudo-first order and pseudo-second order nonlinear models by FV-FORMALD. (Co, MB = 1000 mg L−1; Co, BCB = 1000 mg L−1; pH MB = 4; pH BCB = 4; concentration of FV-FORMALD = 1 g L−1; T = 300.15 K; contact time = 5–1440 min).
Kinetic parameters were calculated utilizing linear and nonlinear PFO and PSO models. Results are depicted in Table 3. For MB, PFO linear and nonlinear models show values of R2 = 0.968 and R2 = 0.913, respectively, suggesting a nongood fit to the PFO model. In other hand, the values of R2 = 0.980 and R2 = 0.999 obtained for PSO are higher to those obtained for PFO. In addition, the PFO model exhibits the lowest values of error functions (Table 4). The value of the equilibrium adsorption capacity (qe,cal) obtained with the pseudo-second-order nonlinear model was 799.4 mg g−1 and is closer to the experimental equilibrium adsorption capacity at (qe,exp = 806.8 mg g−1) than qe,cal obtained with the pseudo-first-order model (743.5 mg g−1). Therefore, the best model to describe the kinetics of the adsorption of MB is the pseudo-second order. Similar behavior was observed for BCB kinetics, the equilibrium adsorption capacity (qe,cal) obtained with the pseudo-second-order nonlinear model was 914.3 mg g−1 and is closer to the equilibrium experimental adsorption capacity (qe,exp = 908.6 mg g−1) than qe,cal obtained with the pseudo-first-order model (Table 6) (847.0 mg g−1). Therefore, the best model to describe the kinetics of the adsorption of both dyes is the pseudo-second order.
Kinetic parameters of MB and BCB biosorption onto Fucus vesiculosus treated with formaldehyde.

Error function data of the kinetic models.

Effect of dye concentration
The isotherm study was performed to describe the interaction between adsorbate and adsorbent surface, calculate the maximum biosorption capacity of adsorbent, and describe the dynamic equilibrium of the adsorption system. Figure 7(a) and (b) shows adsorption isotherms for BCB and MB, respectively, and the fit to Langmuir and Freundlich nonlinear isotherm models. Table 5 presents the parameters of the Langmuir and Freundlich isotherm obtained from their linear and nonlinear forms by fitting the experimental data.
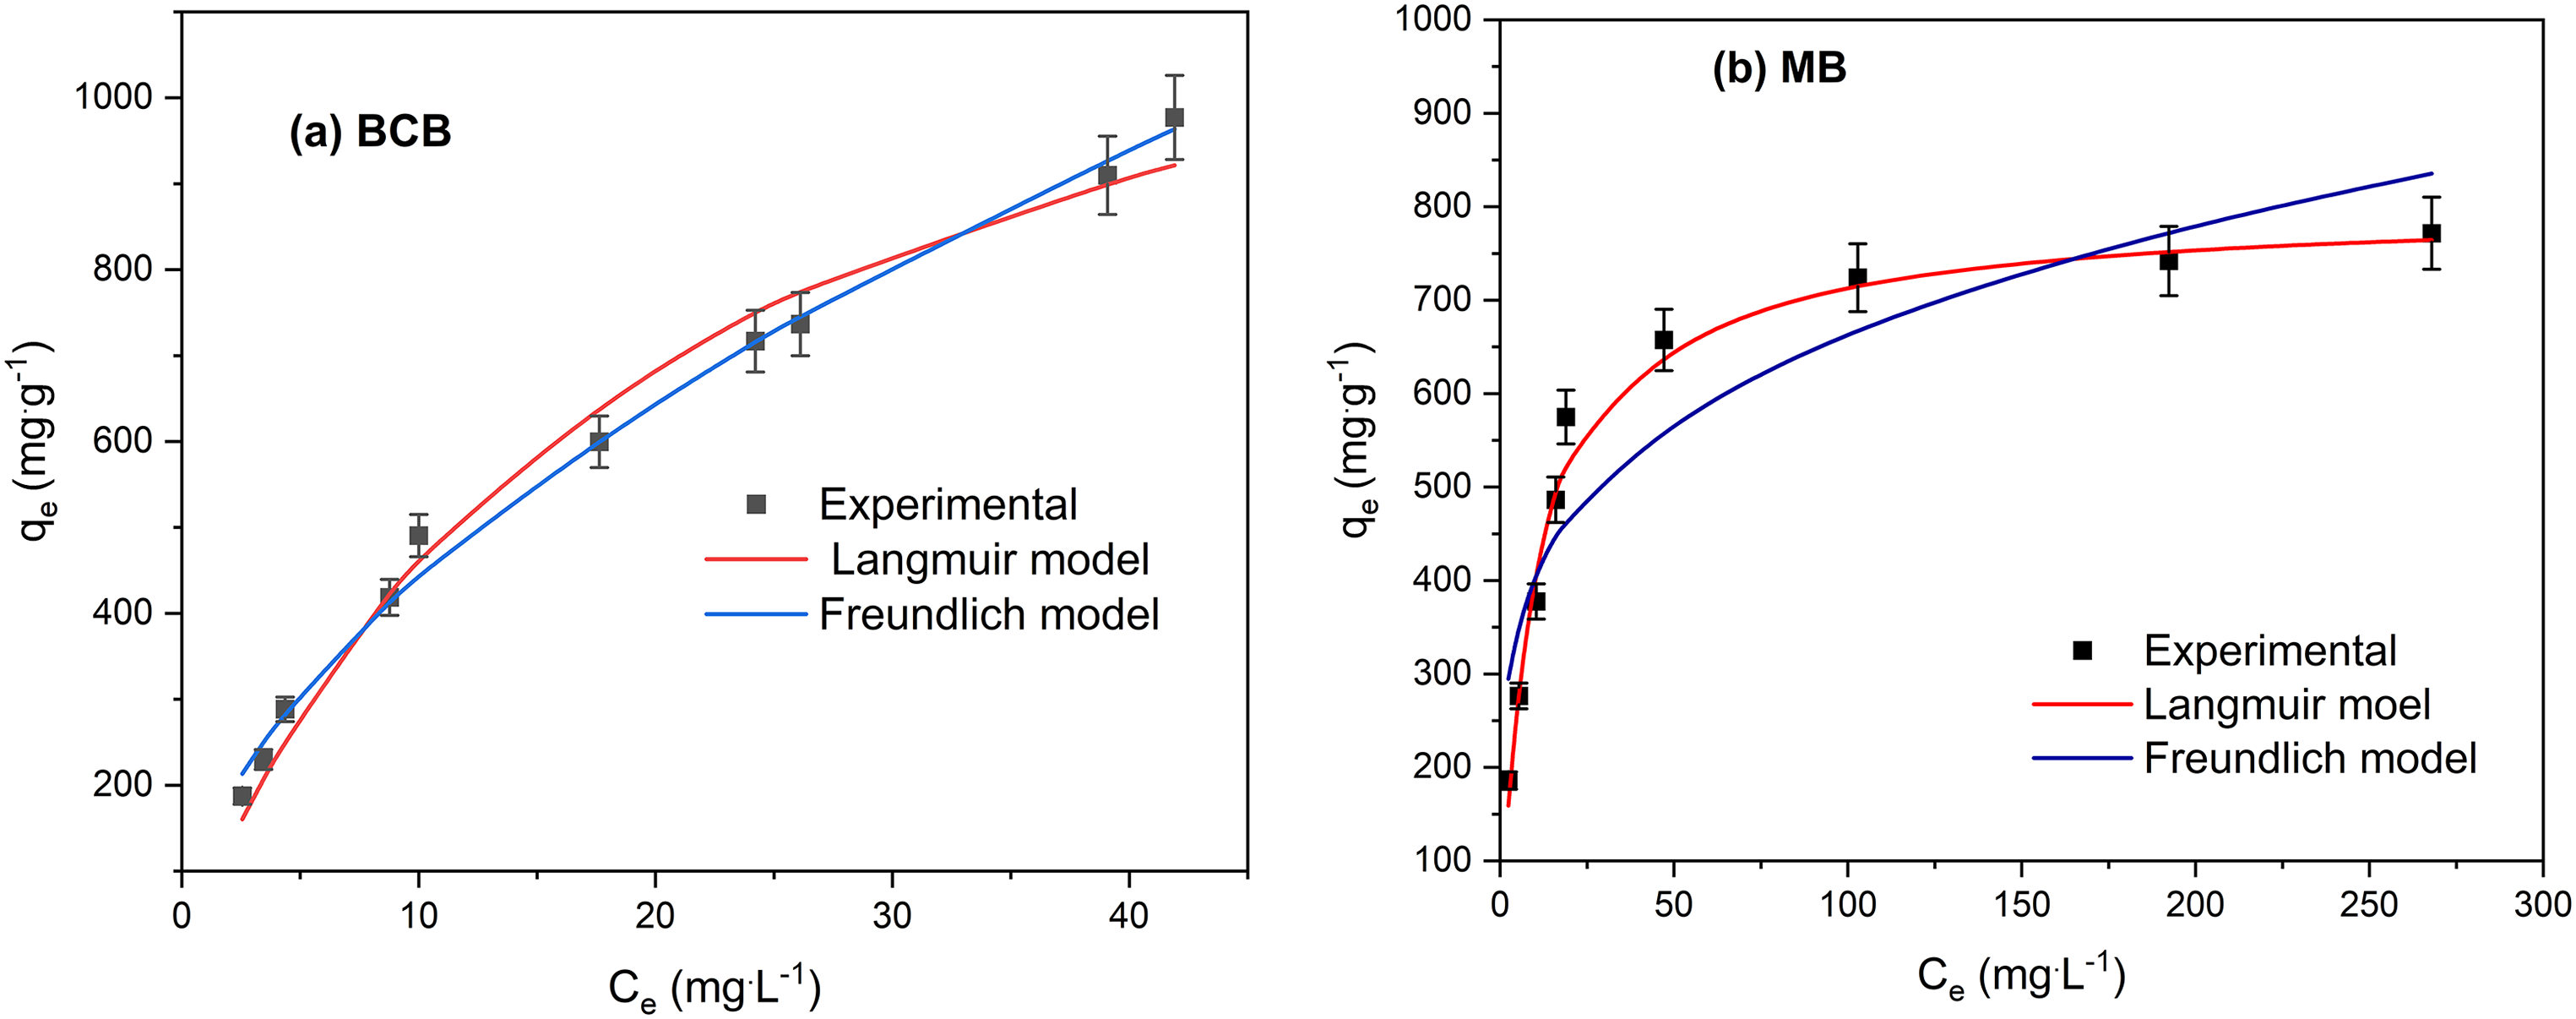
Fitting data for Langmuir and Freundlich nonlinear isotherms for (a) BCB and (b) MB adsorption onto FV-FORMALD (Co, MB = 100–1000 mg L−1; Co, BCB = 100–1000 mg L−1; pH MB = 4; pH BCB = 4; concentration of FV-FORMALD = 1 g L−1; T = 300.15 K; contact time = 360 min.
Isotherm parameters obtained by linear and nonlinear model for methylene blue (MB) and brilliant cresyl blue (BCB) biosorption onto Fucus vesiculosus treated with formaldehyde.

Error function data of the isotherm models.

For MB adsorption, both, linear and nonlinear forms of the Langmuir isotherm model fitted better than the Freundlich isotherm, given the R2 value close to 1 (R2 = 0.999 and R2 = 0.987). Additionally, the ARE, χ2, RMS, and Δq (%) values obtained for nonlinear model of Langmuir are lower than those obtained for Freundlich model (Table 6). The Langmuir isotherm model assumes a homogeneous biosorbent surface, an identical energy distribution on the biosorbent surface, and the formation of monolayer (Miraboutalebi et al., 2017). The maximum monolayer adsorption capacity (Qmax) obtained with the Langmuir nonlinear model was 791.4 mg g−1. Regarding the Langmuir constant KL, this parameter indicates the binding sites’ affinity and adsorption energy. A low value of KL is related to a low binding site affinity (Zou et al., 2013). From Table 5, the KL value obtained for MB is low (0.106). Therefore, a weak interaction between MB and FV-FORMALD can be assumed.
For BCB adsorption, as shown in Table 5, the R2 values are 0.991 and 0.994 for linear and nonlinear Freundlich isotherm models, respectively. The results of R2 for linear and nonlinear models of Langmuir isotherm are 0.976 and 0.984, respectively.
It can be assumed that both models are suitable to describe the adsorption of BCB dye onto FV-FORMAD. However, the values of the error functions are lower for the nonlinear Freundlich model, suggesting that this model better fits to the adsorption data. The Freundlich isotherm model assumes a heterogeneous surface, reversible adsorption, and multilayer formation (Özcan et al., 2004). Values of the parameter n between 1 and 10 indicate a favorable adsorption process (Lebron et al., 2021). Also, n = 1 indicates linear process, n > 1 indicates physical process, and when n < 1, indicates chemical process (Choi and Yu, 2019). In this study, the value of n obtained from the nonlinear model was 1.853, indicating that the biosorption of BCB onto FV-FORMALD is favorable. In addition, value of KF = 128.3 (Table 5) indicates high affinity for BCB. According to the fit with the nonlinear Langmuir model, the maximum monolayer adsorption capacity of BCB dye (Qmax) is 1332 mg g-1, which is higher than the Qmax previously reported for the MB dye.
Based on the BCB and MB isotherms shapes and the results are shown above, it can be assumed that the Langmuir model describes the biosorption of MB onto FV-FORMALD, while Freundlich better describes the biosorption of BCB.
pH effect
Figure 8 shows the adsorption isotherms of BCB and MB fitted by Langmuir and Freundlich isotherms at different pH values. It can be seen that for all pH values, the same isotherm shapes are observed for both dyes.
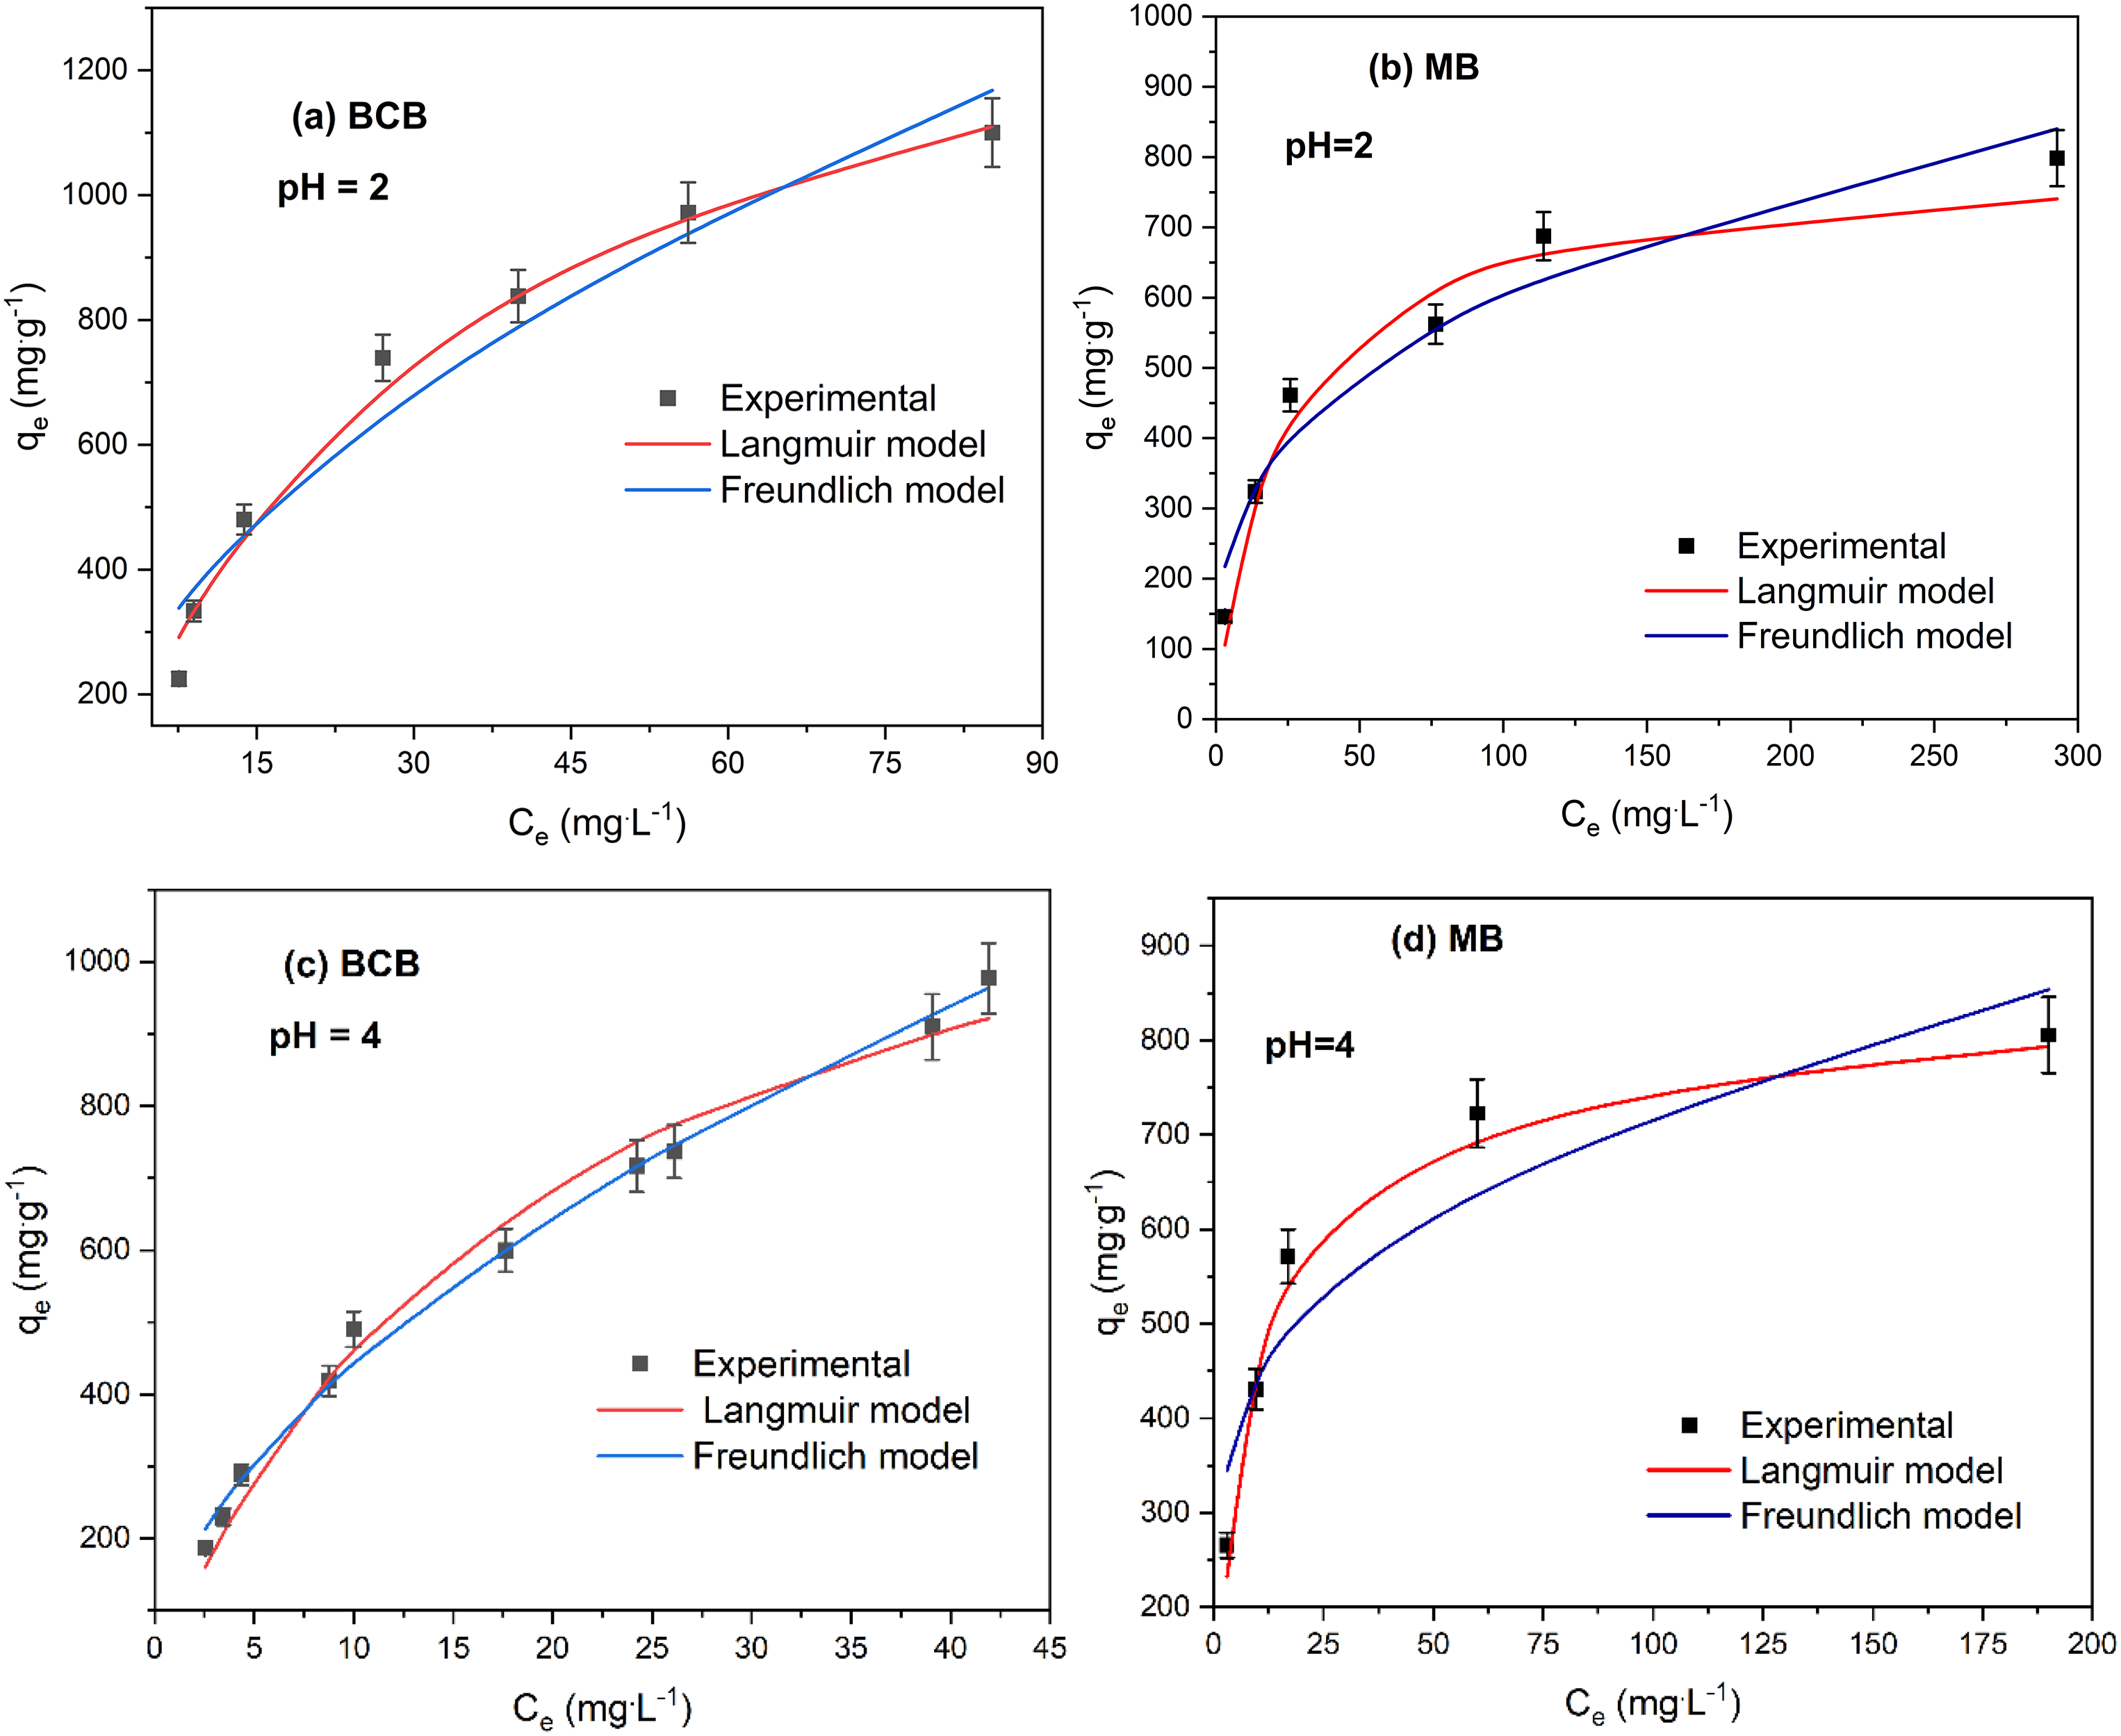
Effect of pH on the modeling of Langmuir and Freundlich nonlinear isotherms for MB and BCB biosorption onto FV-FORMALD (Co, MB = 100–1000 mg L−1; Co, BCB = 100–1000 mg L−1; concentration of FV-FORMALD = 1 g L−1; T = 300.15 K; contact time = 360 min.
In the whole range studied (pH 2–8), the MB biosorption capacity increased with increasing solution pH values (Figure 8(b), (d), (e), and (h)), which also means that under low pH conditions, low adsorption capacity of MB was achieved. This occurred when the pH is acidic (low value); the electrostatic repulsion between the positive surface of the adsorbent and the positive charge of the cationic dyes (Figure 1(b)) inhibits dye adsorption, and excess of hydrogen ions can compete with the dye molecules for adsorption sites. Conversely, when the pH increases, the surface of the biosorbent becomes negatively charged due to the deprotonation of the surface (Pang et al., 2017), which facilitates the adsorption of MB. Other authors have reported similar behavior for the adsorption of cationic dyes onto other algae species (Caparkaya and Cavas 2008; Guarín et al. 2018; Liang et al. 2017). In other hand, in Figure 8, the effect of the pH solution on BCB adsorption is also shown. There is a minimal decreased in the adsorption capacity of BCB form pH = 2 to pH = 4 (Figure 8(a) and (c)), it could be said that in the whole studied range, there is no significant difference between the adsorption capacity of BCB by changing the pH of the solutin.
The results of the linear and nonlinear modeling of the Langmuir and Freundlich isotherm models are presented in Table 7. For the linear and nonlinear Langmuir models, R2 > 0.950 were obtained for all pH solutions, and are higher than the R2 values obtained for Freundlich models. In addition, the ARE, χ2, RMS, and Δq (%) values obtained for nonlinear model of Langmuir are lower than those obtained for Freundlich mode (Table 8). Thus, it confirms the tendency of fitting to the Langmuir isotherm model. According to the Langmuir nonlinear model, the maximum adsorption capacity of the MB monolayer (Qmax) increased substantially in the pH range 4–8; this is related to pHPZC = 4.77 obtained for FV-FORMALD, when pH > pHPZC algae surface is negatively charged, favoring cations biosorption. In this case, for MB at pH = 7 and 8, Qmax = 834.2 and 862.6 mg g−1, respectively, confirm the increased biosorption of MB.
Isotherms parameters of MB and BCB biosorption onto Fucus vesiculosus treated with formaldehyde at different pH values.
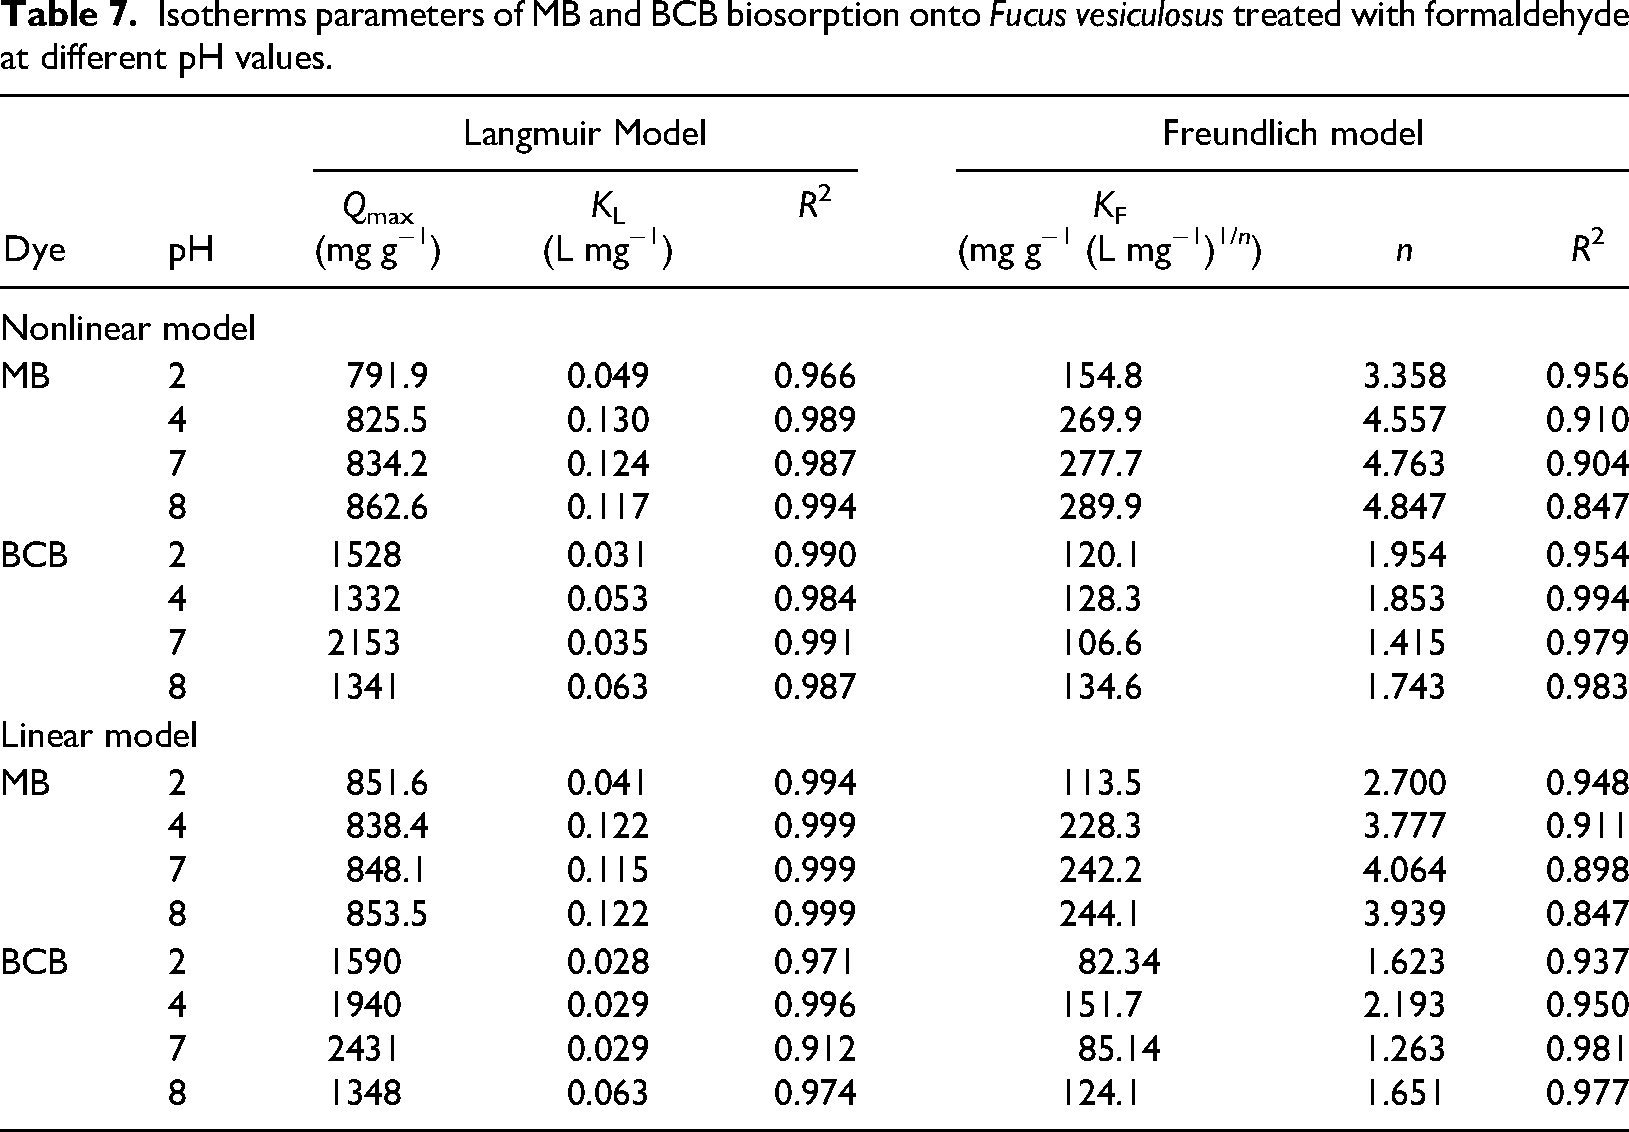
Error function data of the isotherm models at different pH values.

For BCB biosorption, when the pH increased from 2 to 4, Qmax calculated with Langmuir nonlinear model decreased from 1528 to 1332 mg g−1. At higher pH values, Qmax = 2153 and 1341 mg g−1 for pH values of 7 and 8, respectively. The highest value of Qmax obtained with nonlinear Langmuir model was 2153 at pH = 7, which could be considered erroneous and atypical because if we consider the results of linear model Qmax is 2431 mg g−1 (Table 7), which is close to 2153 but the value of the determination coefficient (R2 = 0.912) is low. Additionally, considering the results obtained from Freundlich nonlinear isotherm model, a slight change in the parameters (n and KF) was observed. The parameter n decreased from 1.954 to 1.743 as the pH of the solution increased from 2 to 8 units. However, the values for n and KF are still good and indicate a favorable biosorption of BCB. The highest value for Qmax obtained with linear model of Langmuir is 1940, and the highest value of n parameter obtained with linear Freundlich isotherm is 2.193 at pH = 4. According to the results of the evaluated isotherm models, the optimum pH condition is 8 for MB biosorption and 4 for BCB biosorption.
Adsorbent concentration effect
The effect of the concentration of the brown algae FV treated with formaldehyde on the dye's removal efficiency was evaluated in the range of 1.0–10 g L−1. The results showed that the removal efficiency of MB increased from 78.85% to 98.56% when the adsorbent concentration increased from 1 to 2 g L−1 (Figure 9); above 2 g L−1, the removal efficiency increased slightly and then remained constant around 99%. Previous works have reported similar results (Caparkaya and Cavas, 2008; Liang et al., 2017). The increase in the removal efficiency as the biomass concentration increases are due to an increase in the number of active sites and enough surface to place the MB molecule on the biosorbent (Foroutan et al., 2019). The 99% removal of BCB was achieved using the lowest adsorbent concentration of FV-FORMALD (1 g L−1). When the algae concentration increases, the removal efficiency remains almost constant. This uncommon behavior has been reported for MB biosorption by different brown algae (Pratiwi et al., 2020) and it may be attributed to high biosorbent amounts causing agglomeration and consequently obstructing the binding sites. According to the results, using the same initial concentration (1 g L−1) of FV-FORMALD higher removal efficiency was obtained for BCB dye than MB which may indicates more affinity for BCB dye. The optimal adsorbent concentrations were 1 g L−1 and 2 g L−1 for BCB and MB, respectively.

Effect of FV-FORMALD concentration on the percentage removal of MB and BCB (Co, MB = 1000 mg L−1; Co, BCB = 1000 mg L−1; pH MB = 4; pH BCB = 4; T = 300.15 K; contact time = 360 min).
Temperature effect
The effect of temperature on the biosorption capacity of MB and BCB onto FV-FORMALD was performed by an isotherm study. The experiments were carried out at 300.15, 313.15, and 330.15 K. As can be seen in Figure 10, the biosorption process of BCB dye continues fitting to both nonlinear isotherm models. However, experimental data are closer to the Freundlich model curve than the Langmuir curve, and the shape of the isotherm is similar for the three values of temperatures (Figure 10(a), (c) and (e)), where no significant change is observed in the adsorption capacity (qe). Figure 10(b), (d), and (f) shows the fitting isotherm curves of MB at 300.15, 313.15, and 330.15 K, respectively. It can be observed that the experimental curves are best fitted by the Langmuir model, with a slight increase in the adsorption capacity with increasing temperature.

Temperature influence on BCB and MB uptake by the brown algae Fucus vesiculosus treated with formaldehyde (FV-FORMALD) (Co, MB = 100–1000 mg L−1; Co, BCB = 100–1000 mg L−1; pH MB = 4; pH BCB = 4; FV-FORMALD concentration = 1 g L−1; T = 300–330 K; contact time = 360 min).
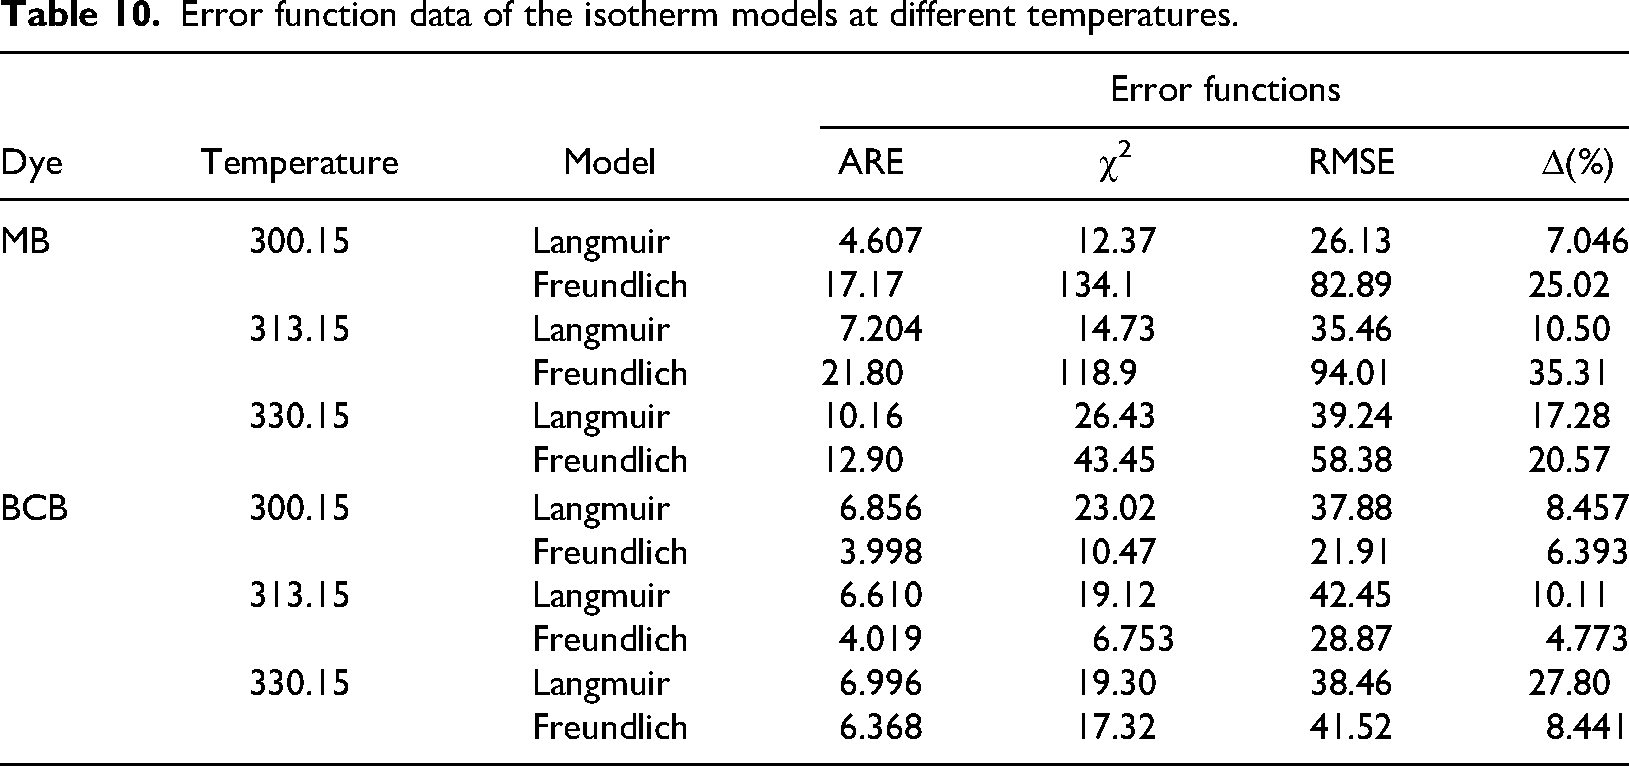
The Langmuir and Freundlich parameters obtained with the linear and nonlinear model for MB and BCB biosorption are shown in Table 9. For BCB adsorption, although the values of R2 for Langmuir nonlinear model are good, and the experimental data seem to be closed (Figure 10(a), (c) and (e)), the determination coefficients obtained for the linear Langmuir model are R2 = 0.935 and 0.831 for 313.15 and 330.15 K, respectively, could indicates that the Langmuir model is not the best to describe the adsorption of BCB at higher temperatures. However, the lowest values of error functions were obtained for the Freundlich isotherm model. The lower values of the error functions values corroborate the best fit of the Langmuir isotherm model for MB and Freundlich isotherm model for BCB (Table 10). Furthermore, the highest values of R2 were obtained for linear and nonlinear Freundlich isotherm models. It was found that at 300.15 K, Freundlich parameters, KF = 128.3 and n = 1.853 confirm a favorable adsorption process. In contrast, increasing temperature up to 313.15, KF = 65.04 and n = 1.480. While for the highest studied temperature (330.15 K), KF = 61.87 and n = 1.385. Therefore, biosorption of BCB is best performed at low temperatures, which implies energy savings. On the other hand, for MB biosorption, the results obtained from the linear Langmuir model indicate that Qmax increases with increasing temperature (Qmax = 791.9, 812.2 and 845.8 mg g−1 for T = 300.15, 313.15, 330.15 K, respectively), because increasing temperature enhance the mobility of the adsorbate and provided sufficient energy for the interaction between the biosorbent surface and the adsorbate (Aichour and Zaghouane, 2020).
Isotherms parameters of MB and BCB biosorption onto Fucus vesiculosus treated with formaldehyde (FV-FORMALD) at different temperatures.

Error function data of the isotherm models at different temperatures.
Thermodynamic of Mb and BCB adsorption
According to Tran (2022), the constant KL from the Langmuir model, in correct units (Lmol−1), is appropriate for calculating the thermodynamics parameters of the solid-liquids adsorption process. The results obtained from the temperature effect were used to calculate KL (Lmol−1). Then, the linear relation between (ln KL) and 1T−1 (equation (16)) provided the thermodynamics parameters (ΔH°, and ΔS°). ΔG° was calculated using equation (17):

The thermodynamics parameters of the adsorption of both dyes are shown in Table 11. For both dyes, ΔG° presents negatives values for the three studied temperatures, which means that the adsorption of MB and BCB onto FV-FORMALD occurs spontaneously (Al-Ma’abreh et al., 2024). When ΔH° < 0, it indicates that the adsorption process is exothermic in nature (Al-Dalahmeh et al., 2024). ΔH° = −10.873 and −29.322 kJ.mol−1 for MB and BCB, respectively. Therefore, the adsorption of both dye is an exothermic process. Finally, ΔS° is positive for MB dye indicating a higher randomness at the interface of the dye and FV-FORMALD (Medhat et al., 2021). Whereas, for the BCB dye, ΔS° = −10.892 kJ.mol−1K−1, the negative value indicates a lower randomness at the interface of BCB dye and the adsorbent (Egbosiuba et al., 2020).
Thermodynamic parameters of MB and BCB adsorption by Fucus vesiculosus treated with formaldehyde (FV-FORMALD).

Comparison of the maximum adsorption capacities Qm of MB and BCB onto different adsorbents
Table 12 compares the Qmax values of MB and BCB obtained using other biosorbents. It can be seen that the Qmax values for both dyes obtained in this study are higher than other types of seaweed. Lebron et al. (2021) used Raw FV for MB removal and obtained Qmax = 698.8 mg g−1 under the following conditions: Co,MB = 100–2500 mg L−1; pH = 6; concentration of raw algae = 2 g L−1; T = 303 K; contact time = 1 440 min. For vesiculosus treated with formaldehyde, we obtained Qmax = 866.3 mg g−1 (167.58 mg g−1 more than raw FV) at Co, MB = 100–1000 mg L−1; pH = 4; concentration of FV-FORMALD = 1 g L−1; T = 313.15 K; and contact time = 360 min. Using the formaldehyde treated algae, the biomass concentration and contact time conditions were lower than those of raw FV, resulting in material and treatment time savings.
Comparison of the maximum adsorption capacity of MB and BCB onto different adsorbents.

Although there are not many studies of the removal of BCB dye. In this study, the Qmax obtained with the Langmuir isotherm model was higher than Qmax obtained using more complex adsorbents such as resins and hydrogels. Therefore, it can be assumed that formaldehyde-treated Fucus vesiculosus (FV-FORMALD) is a good option to remove large amounts of both dyes.
Reusability study
Reuse of adsorbents has been identified as an important parameter for economically and environmental valuable application. The result of the adsorption–desorption cycles of MB onto FV-FORMALD is shown in Figure 11(a). The figure shows that high adsorption capacities (qads) were obtained for at least three cycles, qads = 726.9, 102.8, and 71.7 mg g−1 for cycle 1, 2 and 3, respectively. For desorption capacity (qdes), values equal to 201.9, 202.3 and 184.3 mg g−1 were obtained for cycle 1,2 and 3, respectively. Figure 11(b) shows the results for BCB adsorption–desorption cycles. Qads = 981.1, 645.9, and 212.36 mg g−1 for cycles 1,2 and 3, respectively. While qdes = 28.1, 79.3, and 48.8 mg g−1. After three cycles, high adsorption capacities (qads) were obtained for both dyes indicating their reusability to effectively remove cationic dyes.
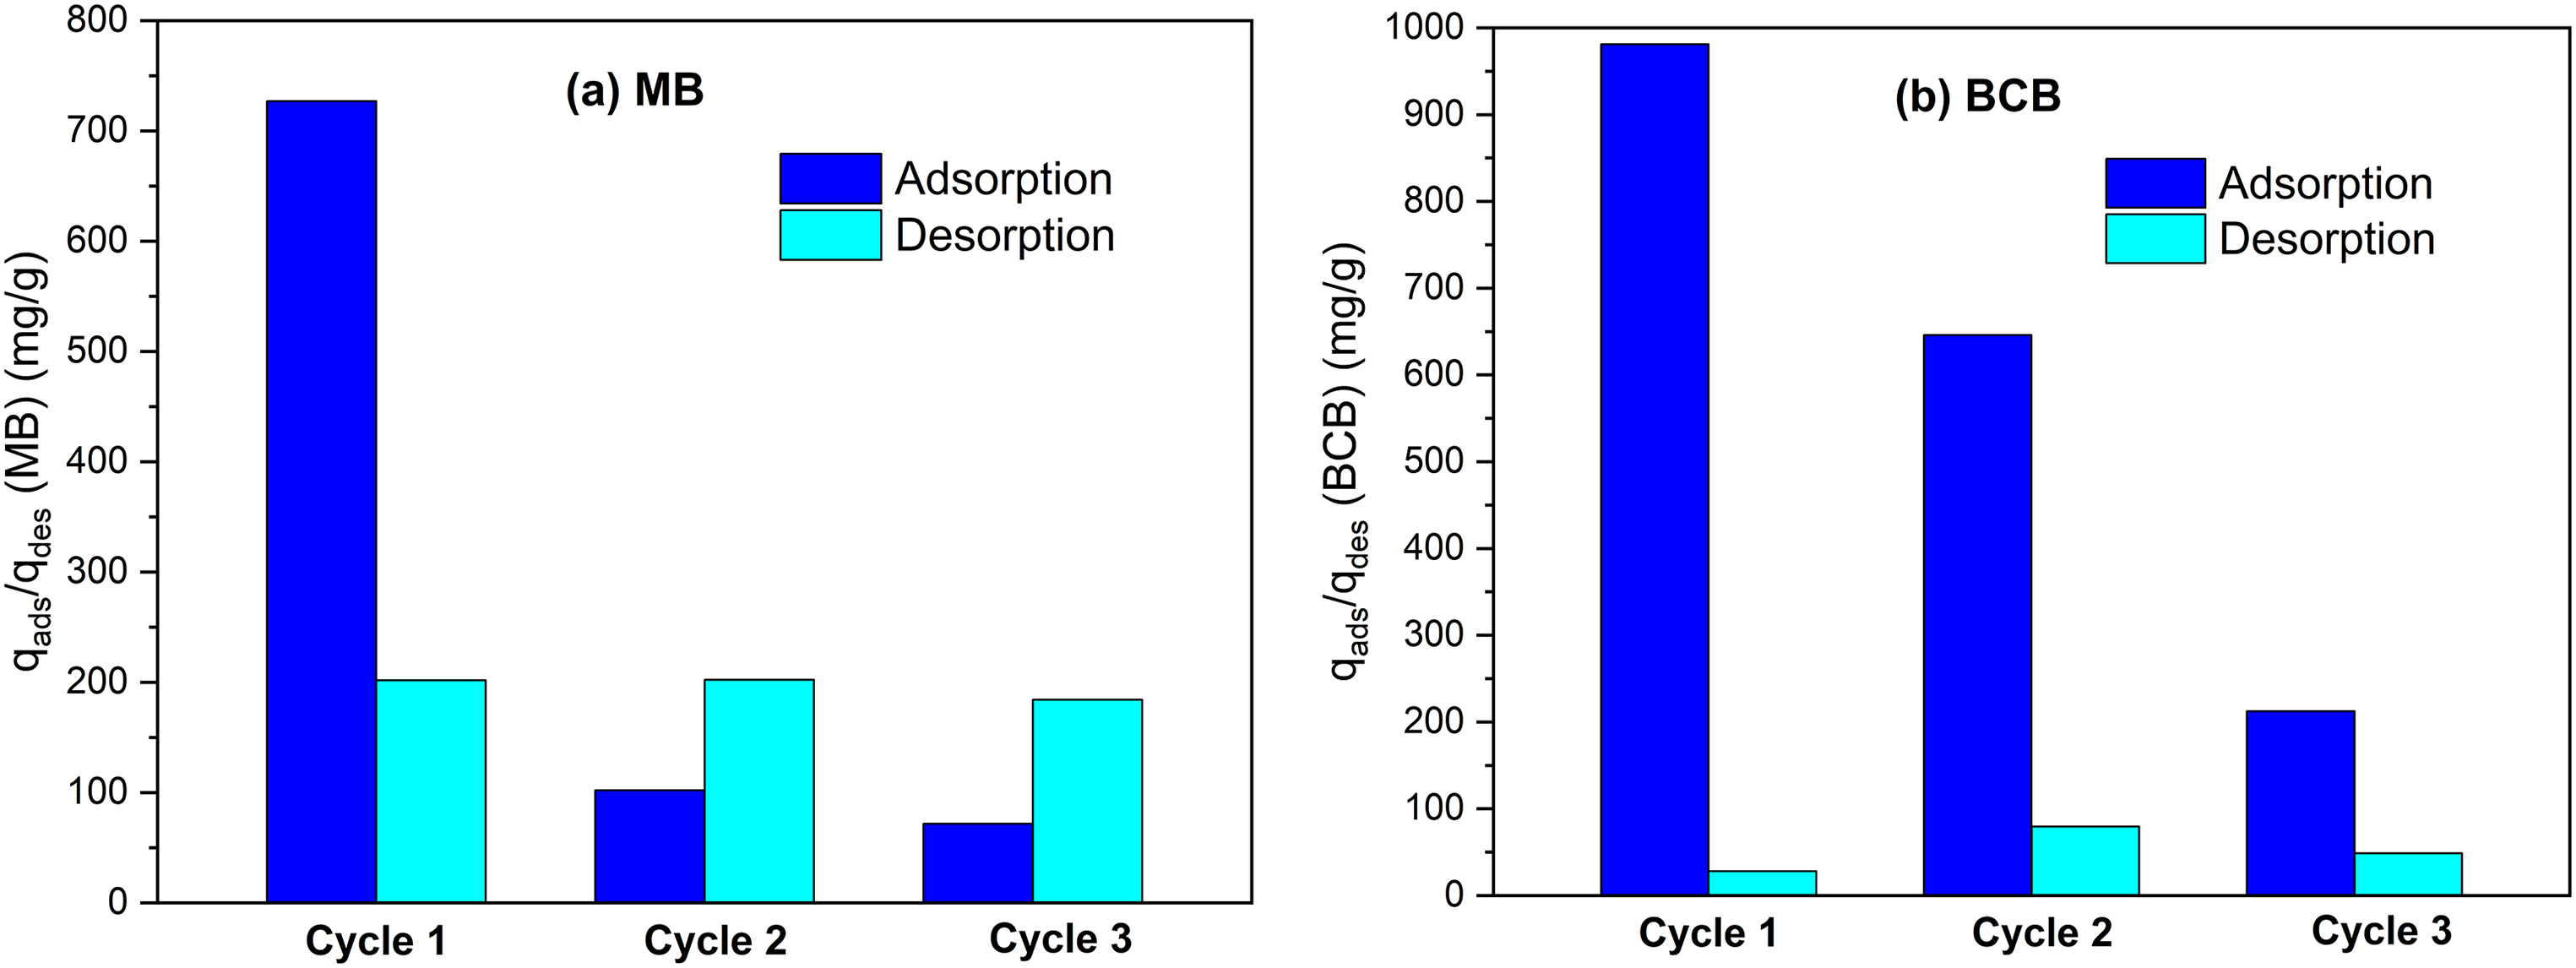
Adsorption/desorption cycles of (a) MB and (b) BCB onto FV-FORMALD using 0.1 M HCl as eluent (Co, MB = 1000 mg L−1; Co, BCB = 1000 mg L−1).
Real colored wastewater treatment
The waste generated from this research was treated with the FV-FORMALD biosorbent. The UV–Visible spectra of wastewater before and after the adsorption is shown in Figure 12. The maximum absorbance of the colored wastewater corresponds at λmax = 655 nm. After adsorption, the absorbance was reduced from 1.129 to 0.089 a.u, indicating a removal efficiency of 92%. According to Sepulveda and Santana (2013), the λmax = 655 nm could be attributed to basic blue 3, another cationic dye. Therefore, it can be assumed that the algae treated with formaldehyde can be used for the treatment of wastewater containing other catatonics dyes such as basic blue 3 efficiently, besides of MB and BCB removal.
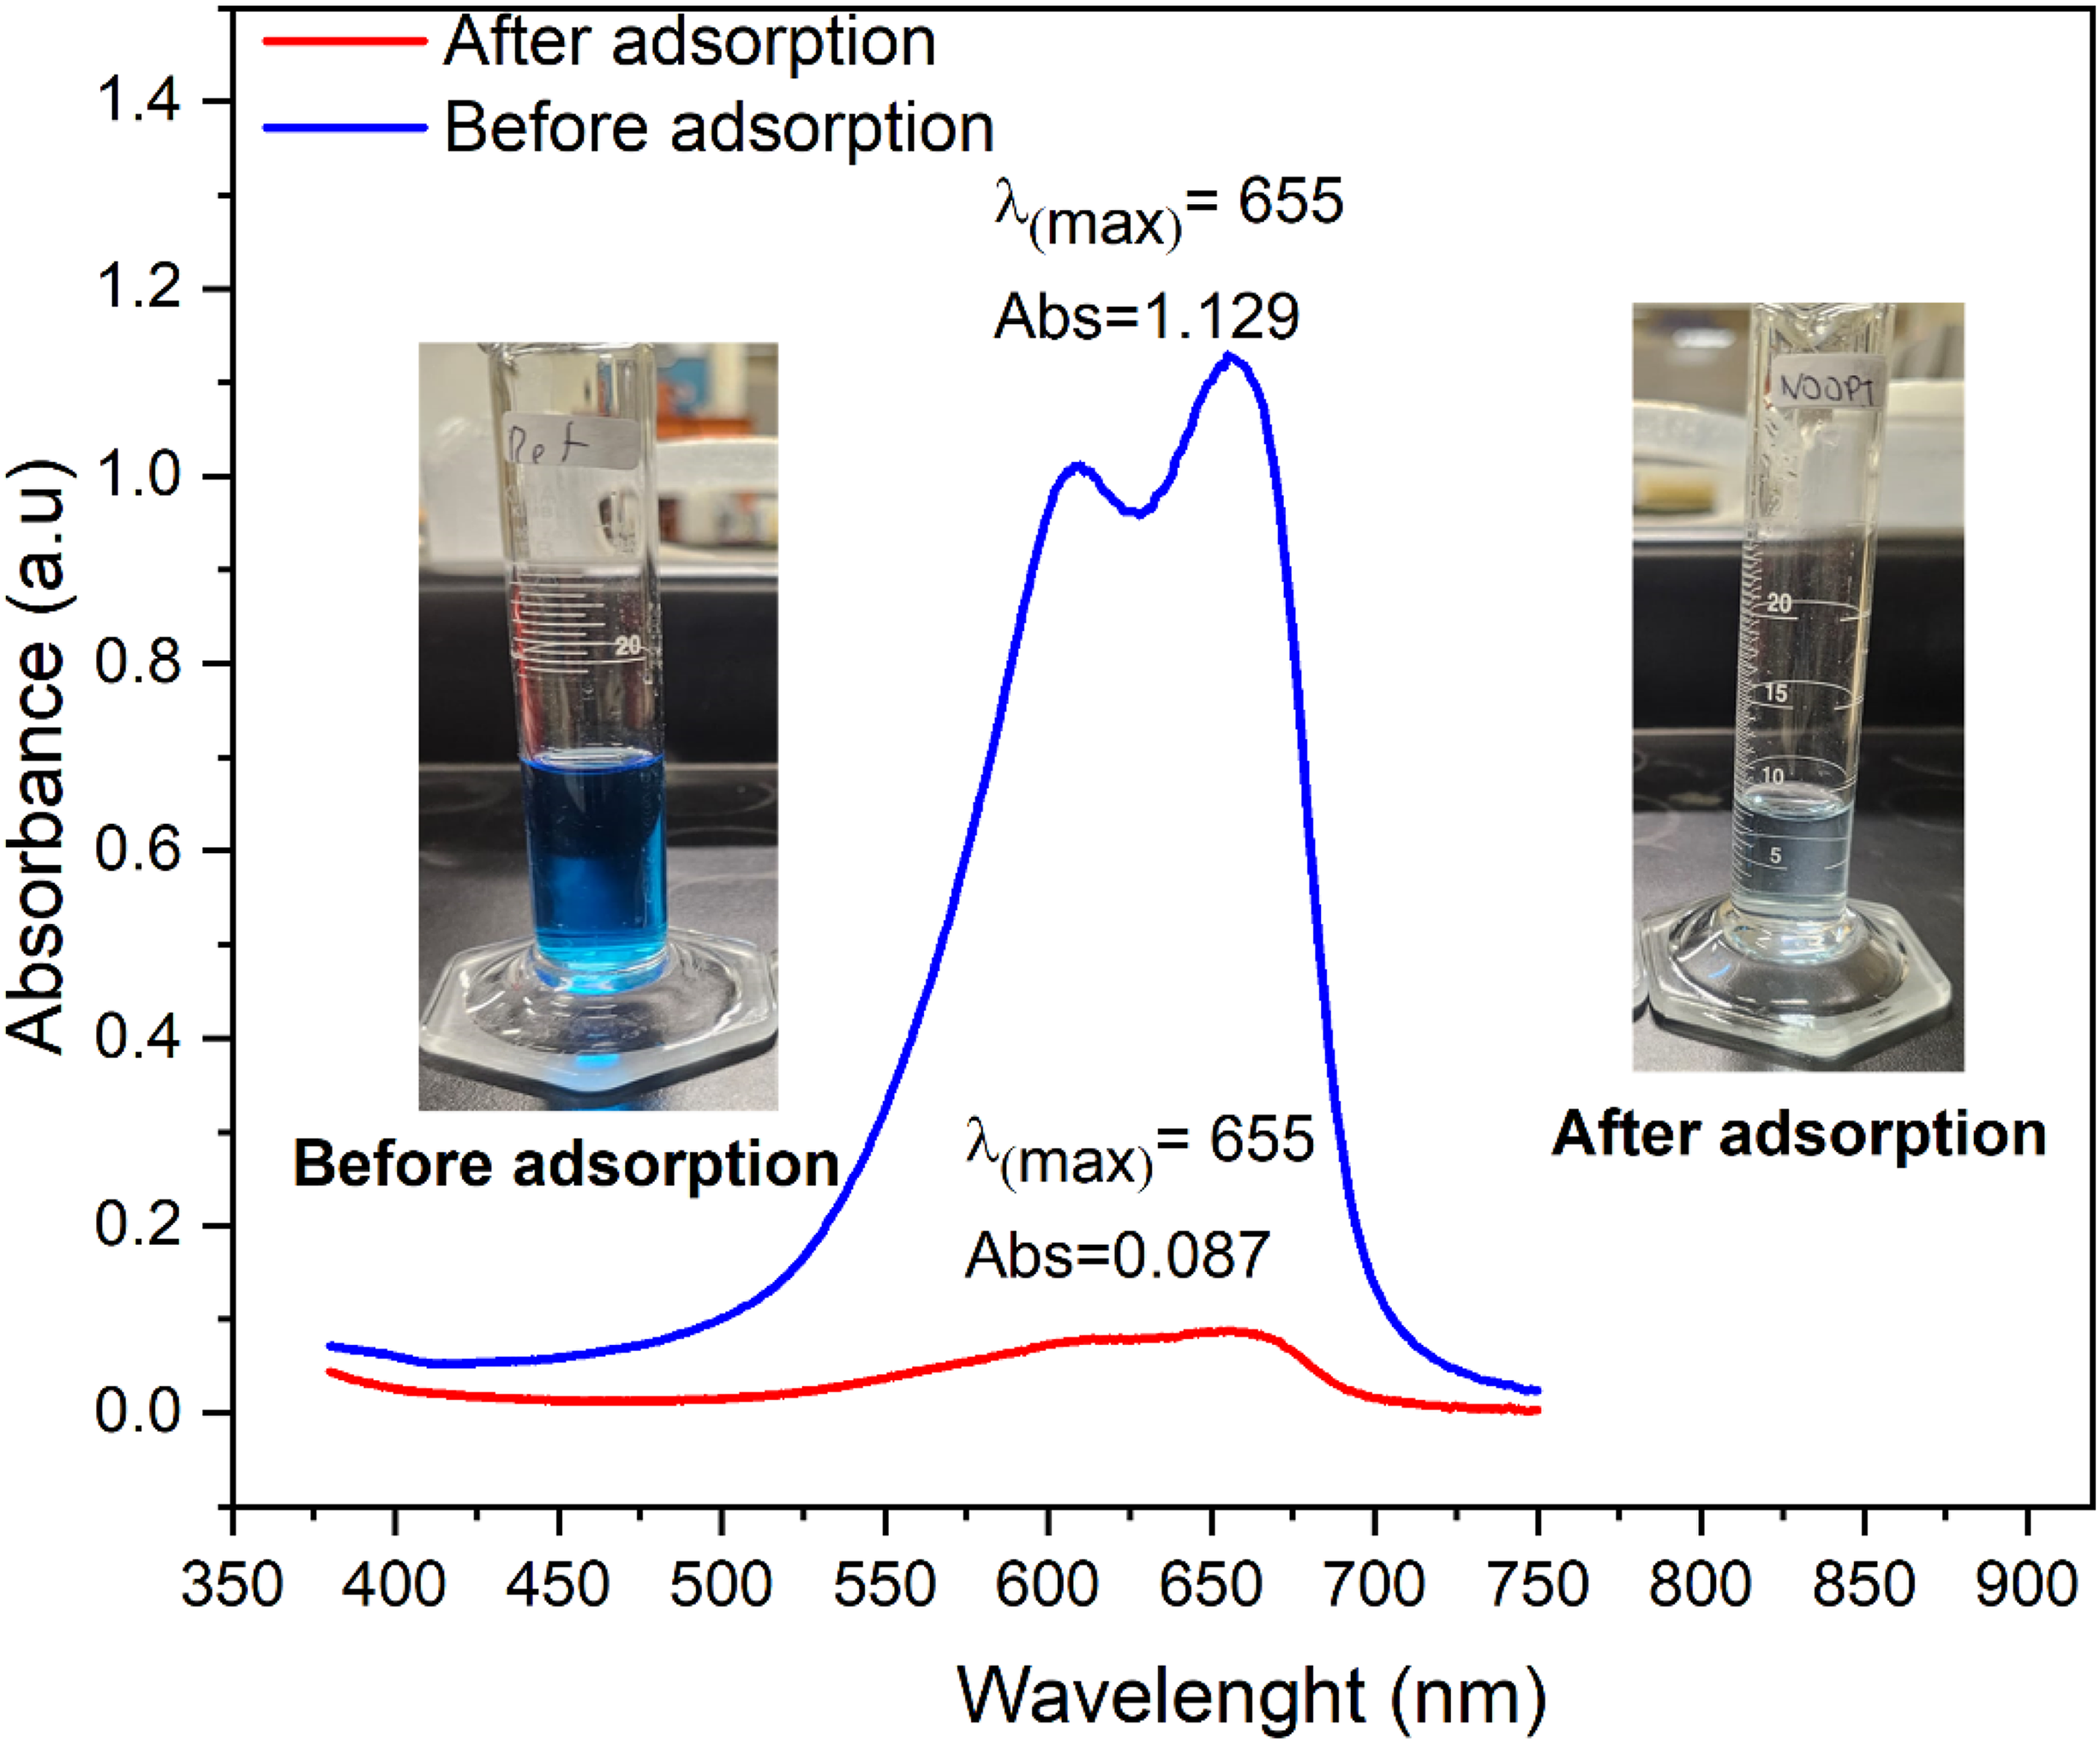
Adsorption of real colored wastewater onto FV-FORMALD.
Conclusions
The brown algae FV treated with formaldehyde (FV-FORMALD) presented high interaction with MB and BCB. Fourier-transform infrared spectroscopy characterization shows that the OH and COOH groups of FV-FORMALD exert a vital role in the uptake process of both dyes. Furthermore, the kinetic studies indicated that equilibrium biosorption of both dyes onto FV-FORMALD was reached within 6 h of contact time, and the pseudo-second-order model best describes the effect of contact time.
The fit to the Freundlich model and the adsorption/desorption study suggest a physical mechanism of BCB biosorption. The maximum adsorption (Qmax) of BCB obtained with the model of Langmuir was 1940 mg g−1.
A chemical adsorption mechanism of MB is suggested as a result of the adjustment to the Langmuir model, the kinetics, FTIR, and the adsorption/desorption results. The maximum adsorption capacity (Qmax) of MB obtained with the Langmuir model was 866.3 mg g−1. The interactions involved in the removal of MB and BCB were electrostatic attraction, hydrophobic attraction, hydrogen bonding and n-π and π-π interactions.
The optimal conditions for MB biosorption onto algae were at 313.15 K, adsorbent concentration = 2 g L−1, and pH = 8. While for BCB biosorption, the optimal conditions were at 300.15 K, pH 4, and adsorbent concentration = 1 g L−1. The adsorption of both dyes was exothermic and spontaneous.
Considering the high adsorption capacities of both dyes compared to other biosorbents, its reusability for at least three cycles, its successfully application in the treatment of the real wastewater, its cost–benefit compared to more complex and expensive methods, the brown algae FV treated with formaldehyde is an environmentally friendly, sustainable, and low-cost option for the removal of cationic dyes from water.
Footnotes
Acknowledgements
The authors thank the Congreso Nacional de Ciencia y Tecnología (CONACyT) for supporting the national master's scholarship. Rogelio Morán Elvira from IER-UNAM for BET characterization. CONAHCYT CF-2023-I-698, CF 2023-I-775, LNC 2023-33, and DGAPA PAPIIT IT100821.
Credit author statement
All authors have read and agreed to the published version of the manuscript.
Data availability statement
The datasets generated and used to support the findings of this study are available from the corresponding author upon request.
Declaration of conflicting interests
The author(s) declared no potential conflicts of interest with respect to the research, authorship, and/or publication of this article.
Funding
The author(s) received no financial support for the research, authorship, and/or publication of this article.