
Abstract
This study investigated the removal of methyl orange (MO) and methylene blue (MB) dyes from an aqueous phase using a novel activated carbon material derived from peanut shells. The effects of pH, contact-time and initial dye concentration on the adsorption performance were evaluated. The adsorption kinetics were fitted with pseudo-first-order, pseudo-second-order and intraparticle diffusion models, while the adsorption isotherms were modelled using Langmuir, Freundlich and Sips equations. The results showed that the adsorption of both dyes followed the PSO kinetic model, and the Freundlich and Sips isotherm models. The maximum adsorption capacities of the carbon material for MO and MB, according to the Sips model, were 4584 and 1769 mg/g, respectively. The pH range of 3–11 had negligible influence on the adsorption capacities of both dyes. The adsorption mechanism was mainly attributed to π–π interactions, n–π electron donor–acceptor (EDA) interactions and pore filling. The activated carbon material exhibited good reusability and stability, achieving over 90% dye removal, after five cycles of adsorption–desorption using hot (90 ± 2 °C) deionised water as the eluent, indicating that the carbon material synthesised from peanut shells is a promising adsorbent for the removal of ionic dyes from wastewater.
Introduction
Industrial activities in various sectors such as paint, textile, food, leather and cosmetics have resulted in the generation of large volumes of wastewater containing dye pollutants. These pollutants pose serious threats to the environment and human health at a global scale, due to their toxicity, persistence and bioaccumulation potential (Edebali, 2019; Maheshwari et al., 2021; Patel et al., 2021; Sabzehmeidani et al., 2021). Therefore, the removal of dyes from wastewater is a crucial task to protect human health and the environment.
Among various techniques for dye removal, such as coagulation-flocculation, chemical oxidation, photocatalysis, biological treatment, membrane separation and others; adsorption is regarded as one of the most effective and economical methods, due to its advantages of simplicity, low cost, recyclability of adsorbent and high efficiency (Nazal, 2020; Rathi and Kumar, 2021). Adsorption technology treats wastewater by using a medium that adsorbs substances from gas or liquid phases. These media are called adsorbents and vary in structure, texture and application. Some common examples are activated carbons, silica gel, polymers, activated alumina, zeolites and resins (El Maguana et al., 2020a).
Activated carbon (AC) is a widely used adsorbent for dye removal because of its high surface area, porosity and adsorption capacity (Sricharoenchaikul et al., 2008). However, AC is usually derived from non-renewable sources, such as coal and petroleum coke, which are expensive and cause environmental problems (Wang et al., 2020). Therefore, there is growing interest in developing AC from renewable and low-cost biomass materials, such as agricultural wastes (Bergna et al., 2017). One of such materials is peanut shell, which is an agricultural by-product and has a high carbon content (Perea-Moreno et al., 2018).
In our previous study (Fletcher et al., 2023), response surface methodology (RSM) was applied to optimise the production of AC from peanut shells by a single stage chemical activation method. The resulting AC materials had a high surface area of ∼1700 m2/g and showed excellent performance in removing methyl orange (MO) dye from aqueous phase, with a maximum removal efficiency of 99.8%, for preliminary equilibrium adsorption measurements. While helpful for screening, it is essential to more fully understand the adsorption processes underpinning such performance, and kinetics are an important parameter in defining adsorption systems, describing the rate of uptake, as well as providing insight into the mechanism of adsorption, relating surface reactions, mass transfer and the diffusion of adsorbate in the system (Krstić, 2020). Adsorption isotherms are also of value, depicting the equilibrium relationship between the adsorbate molecules and the adsorbent, which reflects the nature and intensity of adsorbate–adsorbent interactions, and indicates the maximum available adsorption capacity (El Maguana et al., 2020a). The mechanism of adsorption can be further understood through experimental evidence, such as pH effects, desorption experiments, and post-adsorption textural and surface chemistry analyses.
The objective of this study is to evaluate the performance of the synthesised peanut shell-based AC material for the removal of MO (anionic dye) and methylene blue (MB, cationic dye) from aqueous phase. MO and MB are selected as model pollutants because they are commonly employed in various industries and recognised to exert adverse impacts on living organisms and the wider ecosystem, if released into the environment without treatment (Islam et al., 2018). In this study, we investigate and compare the adsorption kinetics, isotherms and mechanisms of MO and MB removal by peanut shell-based AC material, addressing both the lack of (1) comprehensive understanding of the adsorption processes and mechanisms of dye removal by peanut shell-based AC material and (2) comparison of the adsorption performance of peanut shell-based AC material for different types of dyes.
Materials and methods
Materials
The adsorbent (PNTS2-600-15) used in this study was activated carbon material derived from peanut shells, as previously described by Fletcher et al. (2023) The PNTS2-600-15 was sieved to obtain a uniform particle size range of 1.25–2 mm. MO and MB dye pollutants investigated in this study have molecular weights of 327.33 and 373.90 g/mol, respectively, and their chemical structures are presented in Figure 1. The dyes were obtained from Sigma-Aldrich, UK, and used as received. Stock solution (1000 mg/L) of each dye was prepared by weighing the required amount of dye and dissolving it in distilled water. The concentrations of the working solutions were adjusted by diluting the stock solutions with distilled water.

The molecular structure of: (a) methyl orange (b) methylene blue.
Materials characterisation
The textural characteristics of the PNTS-based activated carbon material were determined using the method of Brunauer et al. (1938). The total pore volume (TPV) was calculated using:

The determination of point of zero charge (PZC) of the AC was carried out using a salt addition method (Bakatula et al., 2018). Details of the textural characteristics and PZC techniques were described elsewhere (Fletcher et al., 2023). Proximate analysis of the PNTS-based activated carbon material was conducted using a thermogravimetric technique based on British Standard BS1016; the procedure followed the method reported by Ottaway (1982). A NETZSCH STA 449 F3 Jupiter system was used for analysis. Ultimate analysis of the samples was determined using an Exeter Analytical CE440 Elemental analyser. Surface chemical composition of the samples was investigated by Fourier transform infrared spectrometry (FTIR) and X-ray photoemission spectroscopy (XPS) techniques. FTIR was conducted using an MB3000 FT-IR laboratory analyser with Horizon MB™ FTIR software. The samples were scanned over a range of 500–4000 cm−1. XPS analysis was conducted using a Thermo Scientific K-alpha X-ray Photoelectron Spectrometer (Thermo Scientific, East Grinstead, UK). The instrument was equipped with a monochromatic Al Kα X-ray source (hν = 1486.6 eV), and a hemispherical electron analyser. The spectra were recorded at a pass energy of 40 eV with an energy step size of 0.05 eV. The high-resolution spectra of C1s, O1s and N1s regions were obtained to identify the chemical states of the elements. The background subtraction was performed using the Shirley method (Shirley, 1972). The relative atomic concentration of each element was calculated using equation (2):

Adsorption experiment
Batch adsorption experiments were performed to assess the efficiency of PNTS2-600-15 in removing MO and MB from aqueous solution. The adsorbent dose effect on MO and MB dye removal was examined by varying the adsorbent mass from 0.01 to 0.2 g in 50 mL of 100 mg/L dye solution. The contact time effect on MO and MB adsorption onto PNTS2-600-15 was investigated at different time periods up to 360 min. The pH effect was studied in the range 3–11; while the initial dye concentration effect was also evaluated for concentrations from 10 to 500 mg/L. All adsorption experiments were carried out at 25 ± 1 °C in 500 mL Erlenmeyer flasks, which were shaken at 150 rpm on an orbital shaker. The mixtures of dye solutions and adsorbents were centrifuged at predetermined intervals, and the residual concentrations were determined at 465 and 664 nm for MO and MB, respectively, using a Varian CARY 5000 UV-VIS-NIR spectrophotometer. The amount of dye uptake at equilibrium,

The percentage removal of dye was calculated using equation (4):

Desorption studies were conducted using the following solvents as desorbing agents: deionised (DI) water at pH 2, pH 8, 80 ± 2 °C, ambient temperature and 90 ± 2 °C. The dye adsorbed on the adsorbent was desorbed by using 50 mL of each desorbing agent, except for DI water at 90 ± 2 °C which was applied repeatedly to wash the loaded adsorbent until negligible desorption occurred. The desorption efficiency (DE) was calculated using the equation.
where
Statistical analysis of data
Trial-and-error nonlinear methods were performed using the solver add-in function of Microsoft Excel and curve fitting tools of MATLAB R2022b to compute the parameters of the isotherm and kinetic models. The coefficient of determination (R2), sum of squared estimate of errors (SSE), and residual root mean square error (RMSE) were used to identify the best-fit models for the adsorption process. Voigt fitting was used for the deconvolution of the XPS spectra using Fityk software.
Results and discussion
Activated carbon characteristics
Table 1 presents the textural parameters obtained from N2 adsorption analysis, including BET surface area (
Physicochemical characteristics of PNTS2-600-15, MO-loaded PNTS2-600-15, and MB-loaded PNTS2-600-15.
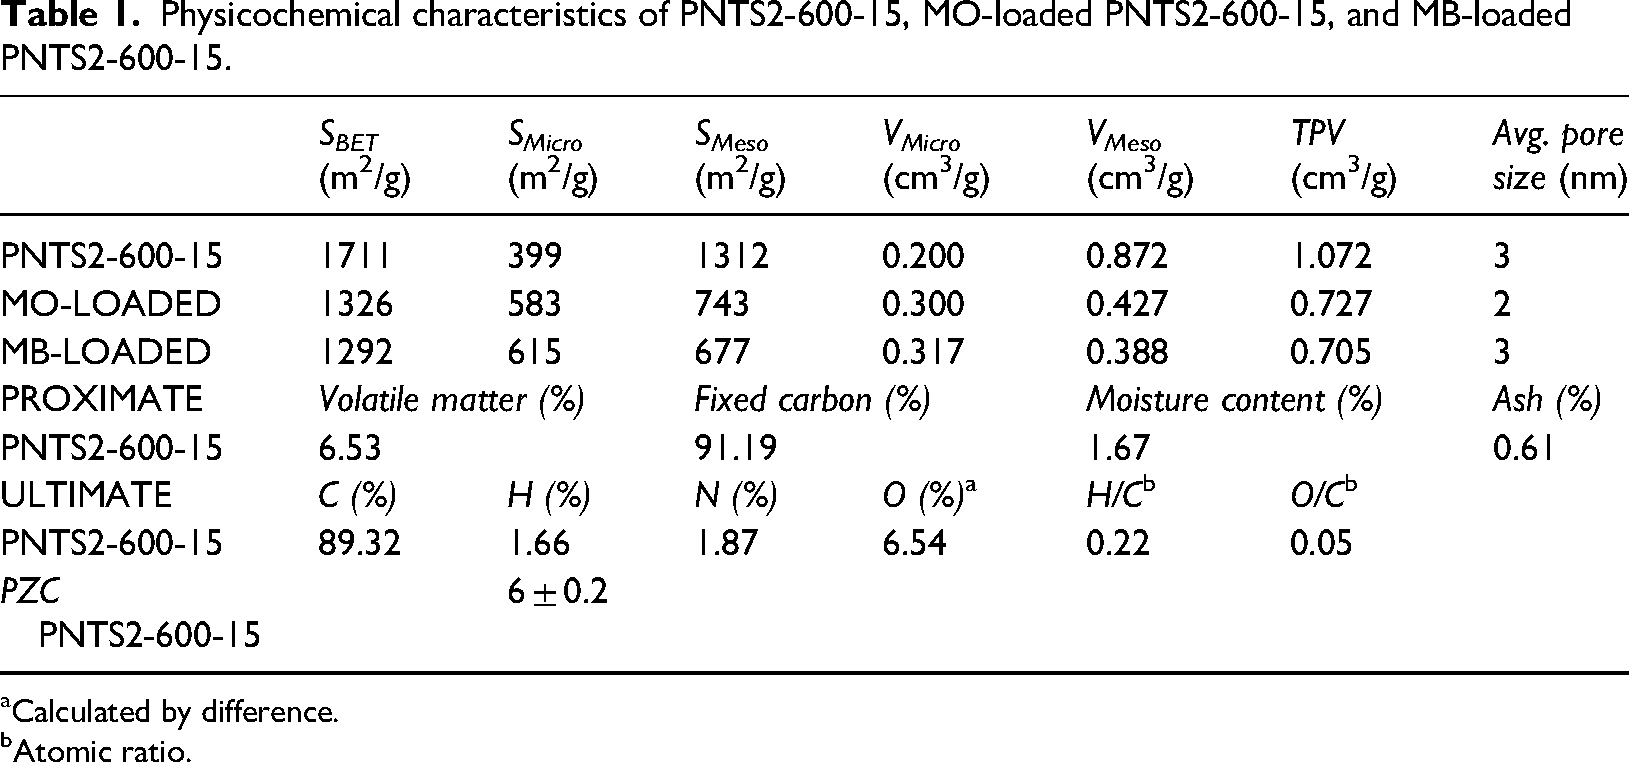
Calculated by difference.
Atomic ratio.
Table 1 also shows the results of PZC, proximate and ultimate analyses for the synthesised sample. The sample has low moisture and ash contents, indicating the high quality of the carbon material (Tran et al., 2018). This feature enhances the hydrophobicity of carbon materials, which makes them more suitable for removing organic pollutants from aqueous phases (Zuim et al., 2011).
The atomic H/C ratio reflects the degree of carbonisation and aromatisation of the plant organic matter in the carbon material, as reported in the literature (Chen et al., 2011; Tran et al., 2018). The atomic O/C ratio indicates the surface hydrophilicity of the carbon material, which is influenced by the content of polar groups, as reported by the same authors. The H/C ratio of 0.22 for PNTS2-600-15 is much lower than that of activated carbon (AC) with H/C ratios of 0.52 and 0.55 reported by Chen et al. (2011), implying that PNTS2-600-15 is highly aromatic. The O/C ratio of 0.05 for PNTS2-600-15 is comparable to that of the most hydrophobic sample with an O/C ratio of 0.04 reported by the same author, suggesting that PNTS2-600-15 has a high degree of hydrophobicity.
The FTIR spectra of the samples reveal a number of functional groups, as shown in Figure 2. Notably, the absorption band ranging from 1650 to 1560 cm−1 is indicative of N-H bending vibrations, which are characteristic of amine functional groups. This band may also correspond to the skeletal vibrations associated with aromatic C═C bonds, as referenced in literature (Tran et al., 2017b), is present in all samples at 1650–1560 cm−1. Additionally, the presence of C-O functional groups, which can be attributed to the presence of the carbonyl groups, are indicated by the absorption peaks observed between 1150 and 1070 or 1275 and 1200 cm−1, corroborated by sources (Edebali, 2019; Fleming and Williams, 1966).
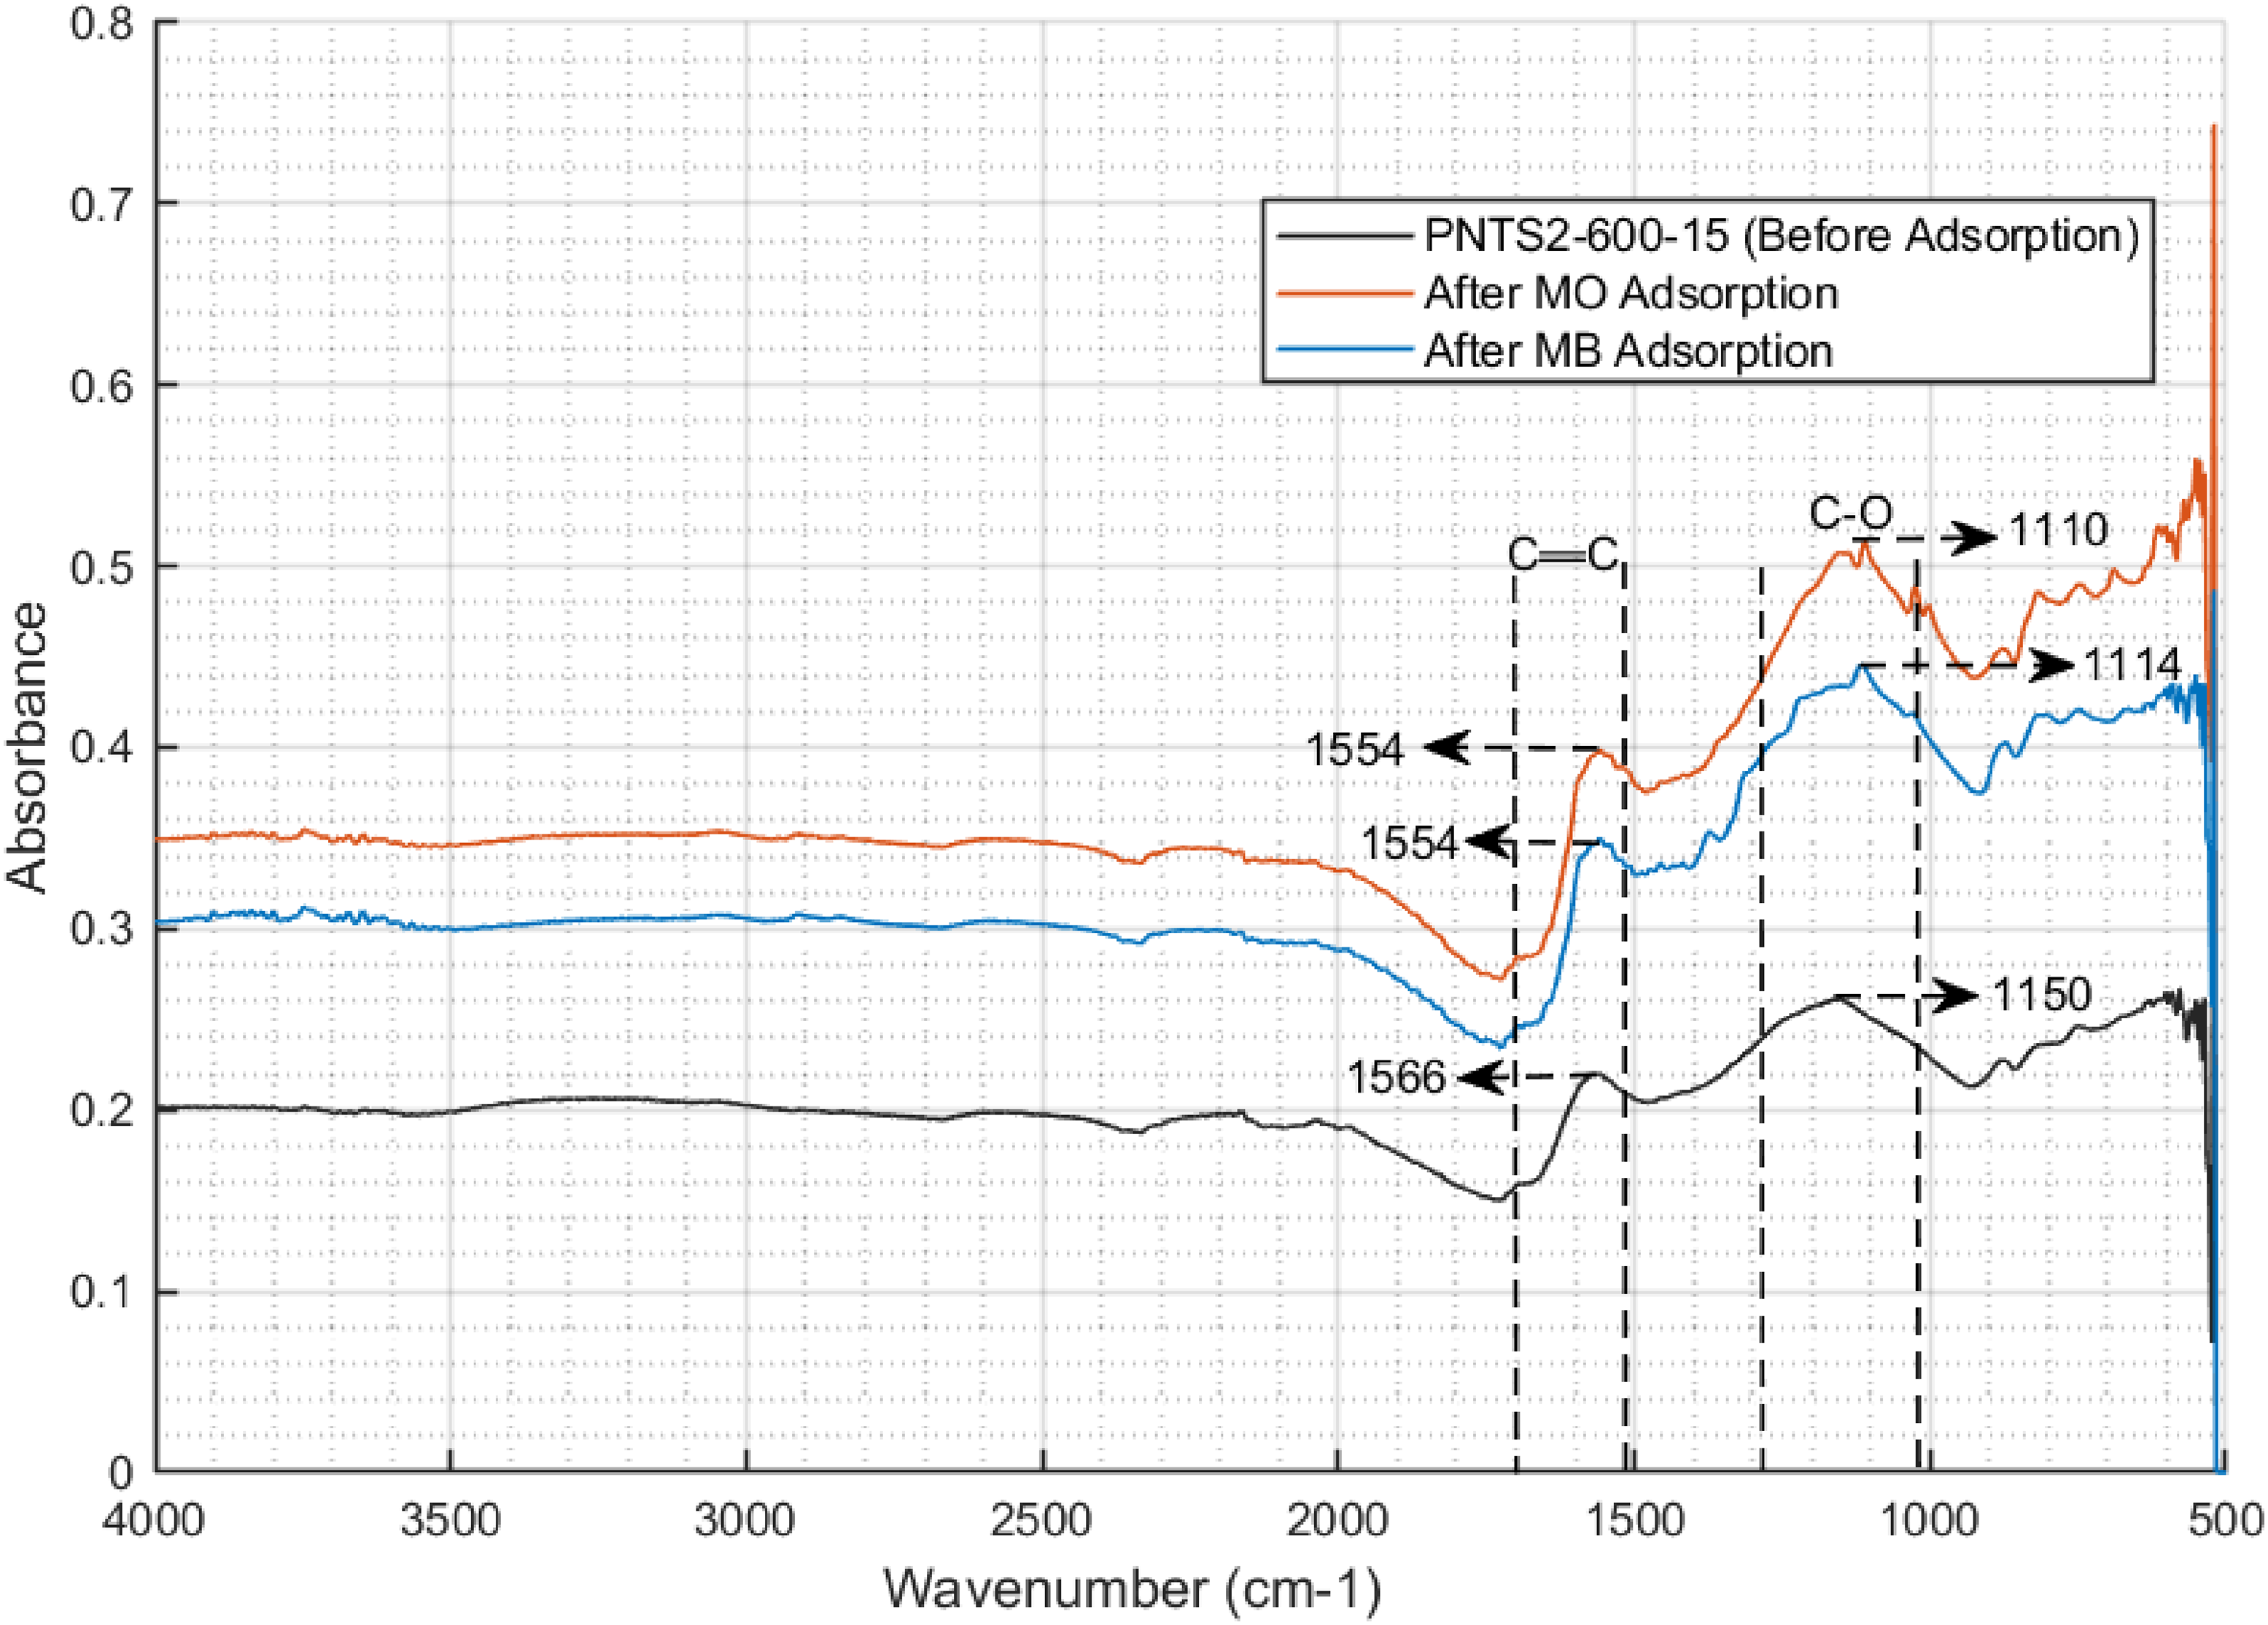
FTIR spectra of PNTS2-600-15 before and after MO and MB adsorption.
XPS was used to further investigate the surface chemical composition of the synthesised PNTS-based activated carbon. The XPS spectra reveals three distinctive peaks attributable to carbon (C1s), oxygen (O1s) and nitrogen (N1s). The C1s peak was deconvoluted into four peaks, the O1s peak into three peaks, and the N1s peaks into three peaks, as shown in Table 2.
XPS analysis of the synthesised PTNS2-600-15 activated carbon.
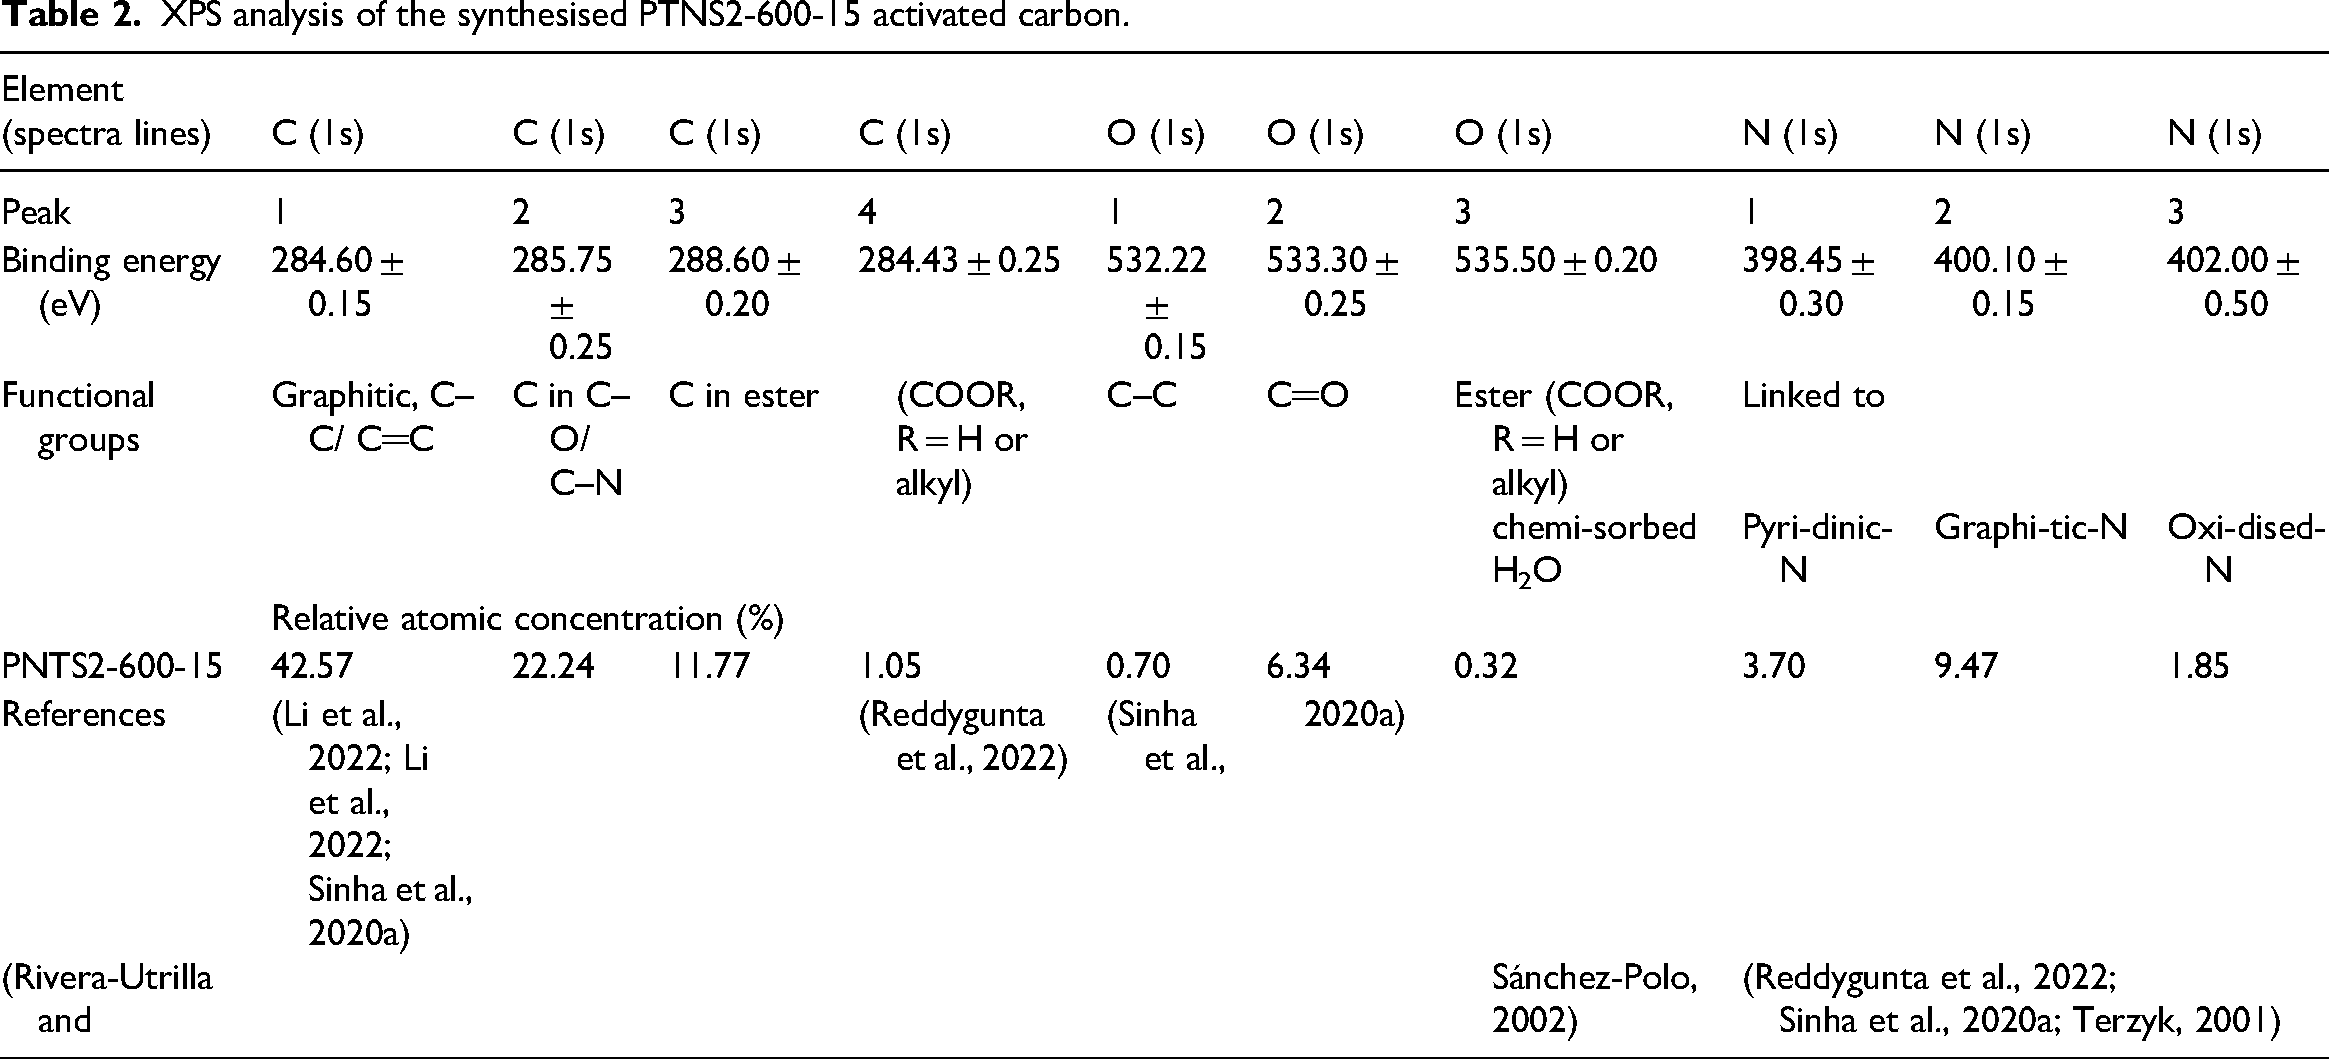
Figure 3 shows the C1s, O1s and N1s spectra of the synthesised PNTS2-600-15.

XPS spectra of PNTS2-600-15 (a) C1s, (b) O1s and (c) N1s.
The C1s peaks were assigned to four groups: sp2 graphitic hybridised carbon (C═C), sp3 C–C, C–O/C–N and C in esters. These components were also confirmed by FTIR analysis. The O1s peak was deconvoluted into three groups: C═O, COOR and chemisorbed H2O. The XPS analysis also detected nitrogen, which was consistent with the FTIR analysis that indicated the presence of nitrogen in the form of amide-N (Leng et al., 2020). The N1s peaks were assigned to three functional groups: pyridinic-N, graphitic-N and oxidised-N, as summarised in Table 2.
The relative atomic concentrations were determined using equation (2); analysis revealed that the C1s peak was the most dominant, accounting for 78% of the total signal, followed by the N1s peak with 15%, and the O1s peak with 7%. These values indicate that the sample had a high degree of carbonisation and nitrogen doping, as well as some oxygen-containing functional groups. The nitrogen content was likely introduced during synthesis of the carbon material. Nitrogen can substitute carbon atoms (graphene-N) in the graphene lattice, creating active sites and increasing the surface area of the carbon material (Reddygunta et al., 2022). Previous studies have reported that nitrogen doping can induce mesopores in graphene, which can significantly contribute to its surface area (Deng et al., 2015; Wang et al., 2014). Moreover, heteroatoms, such as oxygen, nitrogen and sulphur in the synthesised carbon, can enhance its wettability, which is the ability of a liquid to maintain contact with a carbon surface (Sinha et al., 2020b).
Effect of adsorbent dose
Figure 4 shows that dye removal increased from 29.5% to 100% with increasing dose, after 240 min of contact time, but the amount adsorbed per unit mass decreased. This is due to the higher availability of adsorption sites and surface area at higher doses, which enhances dye adsorption (Malik et al., 2006). The results also reveal that the dye removal efficiency increased significantly from 29.5% to 98% when the adsorbent dose increased from 0.01 to 0.07 g, suggesting that more dye molecules were captured by the increased number of adsorption sites. However, when the adsorbent dose was further increased, the dye removal efficiency reached a maximum of 100% at 0.1 g and remained constant thereafter, with continuous decrease in adsorption capacity. This decrease at higher doses can be explained by the fact that adsorption sites are unsaturated during the adsorption process (Malik et al., 2006; Özacar and Şengil, 2005).

Effect of adsorbent dose on percentage dye removal and quantity adsorbed for MO adsorption on PNTS2-600-15 (volume of dye solution = 50 mL).
Based on the results shown in Figure 4, the optimal adsorbent dose for achieving 100% dye removal was determined to be 0.1 g in 50 mL, that is, 2 g/L (Note that MO was the dye used for this experiment). This was also supported by the visual observation of the dye colour change, as illustrated in Supplemental Figure 3 (Supplemental Material).
Adsorption kinetics
The effect of contact time on MO and MB adsorption at 25 ± 1 °C for 360 min is shown in Figure 5. MO adsorbed faster than MB, reaching ∼80% removal in 20 min, while MB reached 61% removal. The adsorption rate decreased after 30 min and approached equilibrium. This is because the active sites on the external surface of the adsorbent were rapidly occupied, with the dyes entering the pores slowly until equilibrium was reached (El Maguana et al., 2019). MO adsorbed faster due to its stronger affinity to the adsorbent (Varank et al., 2012). The equilibrium time was 180 min, whereupon MO and MB removal reached 100% and 99.80%, respectively. No further increase in dye removal was observed after this time. Hence, 180 min was selected as the equilibrium time for both dyes in subsequent experiments. The rate and mechanism of adsorption were investigated using PFO, PSO and intraparticle diffusion (IPD) models.

PFO kinetic fitting curve for the adsorption of MO and MB on PNTS2-600-15 (C0 = 100 mg/L, adsorbent dose = 2 g/L).
PFO and PSO kinetic models
The non-linear form of PFO and PSO are expressed in equations (6) and (7), respectively. Figures 5 and 6 show the plots for PFO and PSO models, respectively.


PSO kinetic fitting curve for the adsorption of MO and MB on PNTS2-600-15 (C0 = 100 mg/L).
The calculated values of the models’ parameters and the determination coefficients, that is, R2, are presented in Table 3.
Kinetic model parameters and determination coefficients for adsorption of MO and MB unto PNTS2-600-15.

The R2 values for fits to MO adsorption kinetics, as shown in Table 3, are 0.9896 and 0.9928 for PFO and PSO models, respectively, indicating a good agreement between the models and the experimental data. Moreover, the calculated equilibrium adsorption capacities,
The R2 values of the PFO and PSO model fits for the adsorption kinetics of MB onto PNTS2-600-15 are 0.9460 and 0.9848, respectively. The PSO model shows a markedly higher R2 value and a closer calculated equilibrium adsorption capacity,
The PSO model is more applicable for both dyes, as indicated by the higher R2 values and the closer agreement between
IPD model
IPD was explored by using the IPD model as described in equation (8). If the plot of 

IPD model plots for MO and MB adsorption on PNTS2-600-15 (C0 = 100 mg/L, adsorbent dose = 2 g/L, time = 300 min).
The IPD model parameters and determination coefficients for the kinetic data of MO and MB are shown in Table 3. The first linear section of the plot (Figure 7) corresponds to the diffusion of dye molecules from the bulk solution across the liquid film to the external surface of the adsorbent. The first linear section also indicates a stronger attraction force between the adsorbent surface and MO molecules, as evidenced by the higher rate constant (kint,1) value. The C values (Table 3) which represent the boundary layer effects, were positive in all cases, indicating the occurrence of an initial adsorption process (Ofomaja et al., 2020; Wu et al., 2009). The second linear section corresponds to a slower process, as shown by the lower rate constant (kint,2) values. This section represents the IPD of the dye molecules into the adsorbent particles, which occurs after the external surface of the adsorbent is saturated (El Maguana et al., 2020b; Sun and Yang, 2003). The third section describes the equilibrium stage for which the IPD starts to slow down due to the lower dye concentration (El Maguana et al., 2020a).
Effect of pH on the adsorption of MO and MB
The initial pH of the dye solution is a crucial factor that affects the adsorption capacity by influencing the chemical properties of both the dye molecules and the adsorbent in the aqueous medium (Kaur et al., 2013). The adsorption of MO and MB dyes by PNTS2-600-15 was slightly affected by pH, as shown in Figure 8. The adsorption capacity increased marginally at pH 3 for MO and at pH 11 for MB, that is, the overall effect of the dyes’ solution pH on the adsorption capacity of the adsorbent was minimal. The adsorption mechanism would be expected to depend strongly on the solution pH if electrostatic attraction was the dominant factor, which was not the case for PNTS2-600-15. This implies that other interactions, such as pore filling, hydrogen bonding or π-π stacking are involved.

Effect of varied solution pH levels on MO and MB adsorption on PNTS2-600-15 (C0 = 250 mg/L, Temp. = 25 ± 1 °C).
It is noteworthy that the adsorption capacity of the synthesised AC was relatively high at a pH of 7, suggesting that the AC could effectively remove the dyes fromzz solutions under neutral pH conditions. Therefore, the pH of subsequent experiments was not altered.
Adsorption isotherms
Equilibrium adsorption data were obtained by varying the initial concentration of the dye in the aqueous phase from 10 to 500 mg/L, while maintaining the temperature at 25 ± 1 °C, and the contact time at 180 min. The data obtained represent the adsorption isotherm and were used to investigate the relationship between the dye concentration in aqueous phase and the adsorbent surface. The adsorption isotherm data were fitted to Langmuir, Freundlich and Sips isotherm models.
Langmuir isotherm model
The nonlinear form of the Langmuir isotherm model, as expressed in equation (9), was used to fit the adsorption equilibrium data:
Figure 9 displays the nonlinear fits of the Langmuir model to the adsorption isotherms obtained for MO and MB on PNTS2-600-15. The model parameters and error analysis, such as determination coefficients (R2), sum of squared errors (SSE) and root mean square errors (RMSE), are given in Table 4.

Nonlinear fits of Langmuir isotherm model to MO and MB adsorption on PNTS2-600-15 (Temp. = 25 ± 1 °C).
Isotherm parameters for MO and MB adsorption by the synthesised PNTS2-600-15 derived from Langmuir, Freundlich and Sips non-linear models.
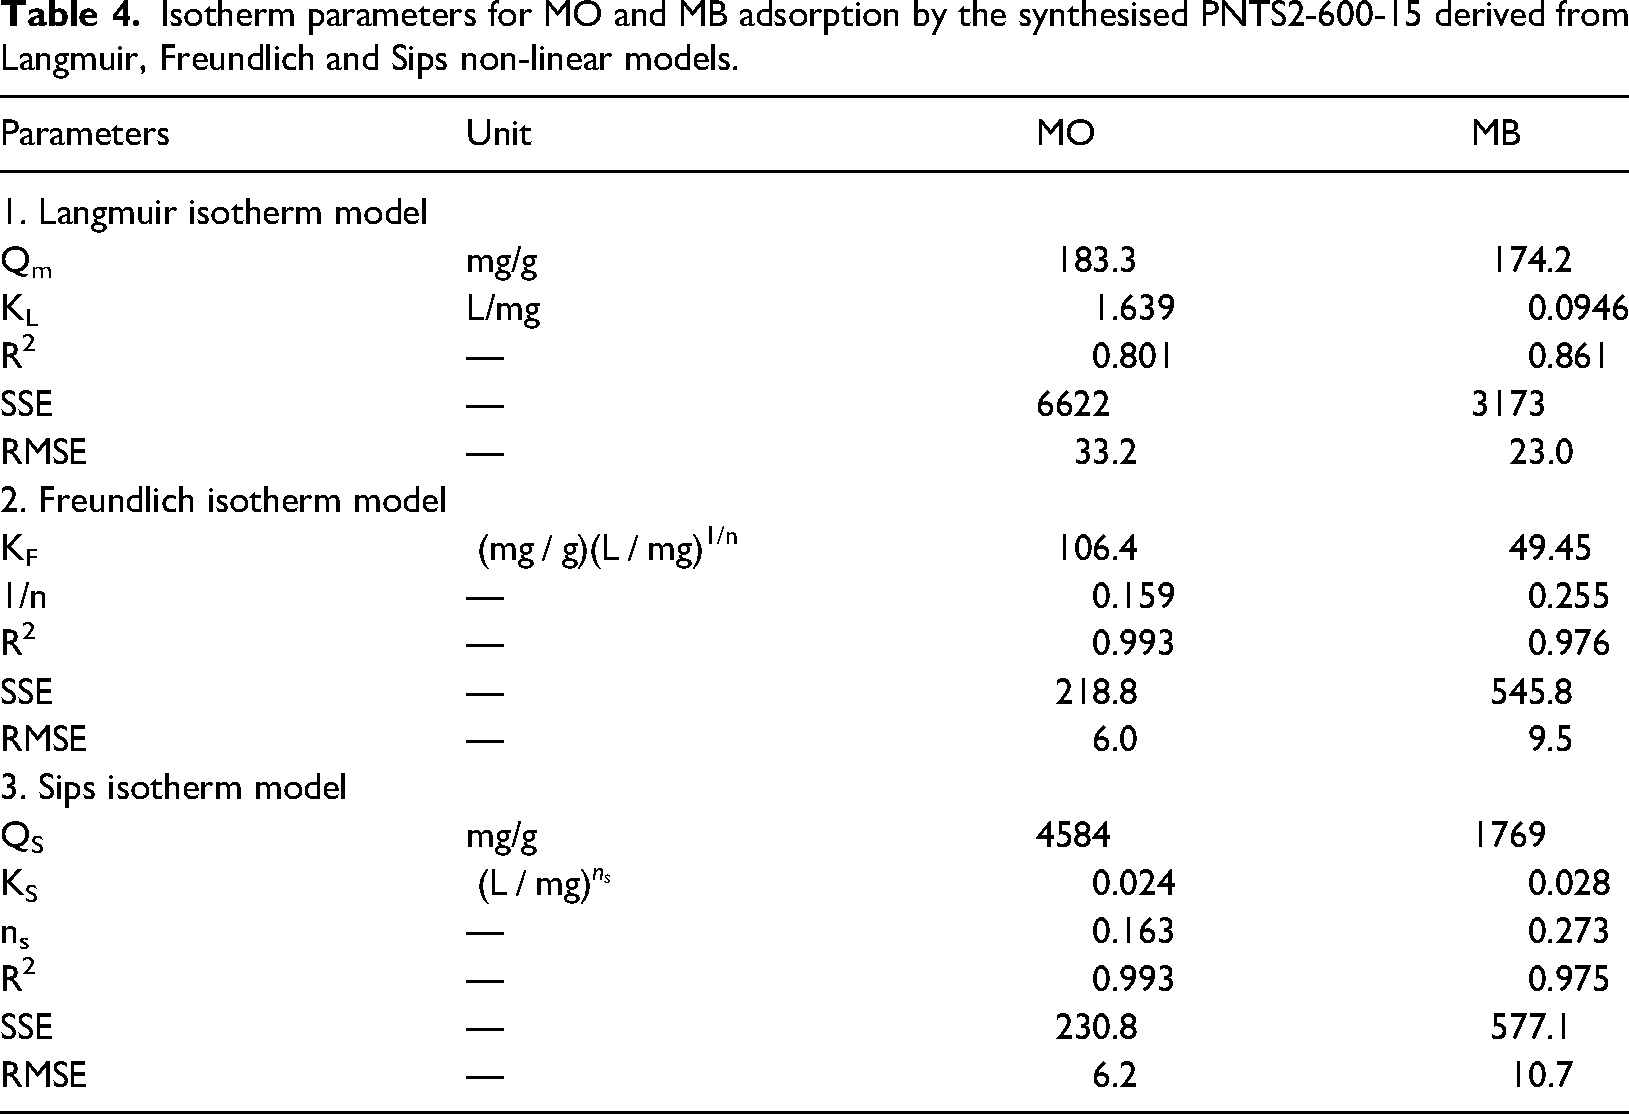
According to Ayawei et al. (2017), the evaluation of the isotherm model fit should not rely solely on the R2 values, but also consider other error analysis criteria. The low R2 values and high SSE and RMSE values, as shown in Table 4, suggest that the Langmuir model does not provide a suitable fit for the adsorption isotherm of MO and MB on PNTS2-600-15. Since the Langmuir model is not a good fit for the adsorption equilibrium data of MO and MB on PNTS2-600-15, the Langmuir separation factor was not considered.
Freundlich isotherm model
The nonlinear form of the Freundlich isotherm model, as expressed in equation (10) was used to fit the adsorption equilibrium data:
Figure 10 shows the nonlinear fits of the Freundlich model to the adsorption isotherms obtained for MO and MB adsorption on PNTS2-600-15. As shown in Table 4, the higher R2 values and lower SSE and RMSE, relative to the values obtained for Langmuir model, suggest that the Freundlich model is more suitable in describing the adsorption equilibrium data of MO and MB on PNTS2-600-15. The suitability of the Freundlich model indicates multilayer adsorption on a heterogeneous surface, with an energy distribution (El Maguana et al., 2020a).

Nonlinear fits of Freundlich isotherm model to MO and MB adsorption on PNTS2-600-15 (Temp. = 25 ± 1 °C).
The Freundlich parameter, 1/n (dimensionless), which reflects the adsorption intensity, or surface heterogeneity, was calculated to be 0.159 for MO and 0.255 and MB; and 1/n values between 0 and 1 indicate favourable adsorption for both target species (El Maguana et al., 2020a; Subbaiah and Kim, 2016; Varank et al., 2012). The lower value of 1/n for MO implies a relatively higher adsorption driving force between the MO molecules and the adsorbent surface (Tan et al., 2009).
Sips isotherm model
The nonlinear form of the Sips isotherm model, as expressed in equation (11) was used to fit the adsorption equilibrium data:
Figure 11 shows the nonlinear fits of the Sips model to the adsorption isotherms obtained for MO and MB adsorption on PNTS2-600-15. As shown in Table 4, the R2 values for the Sips model are higher than those for the Langmuir model, while being comparable to those for the Freundlich model. Moreover, the error analysis reveals that the SSE and RMSE values for the Sips model are slightly different from those for the Freundlich model. Based on these results, both the Freundlich and Sips models can be said to adequately describe the adsorption isotherms of MO and MB on PNTS2-600-15. However, overall, the Freundlich model provides a better fit to the adsorption data than the Sips model.
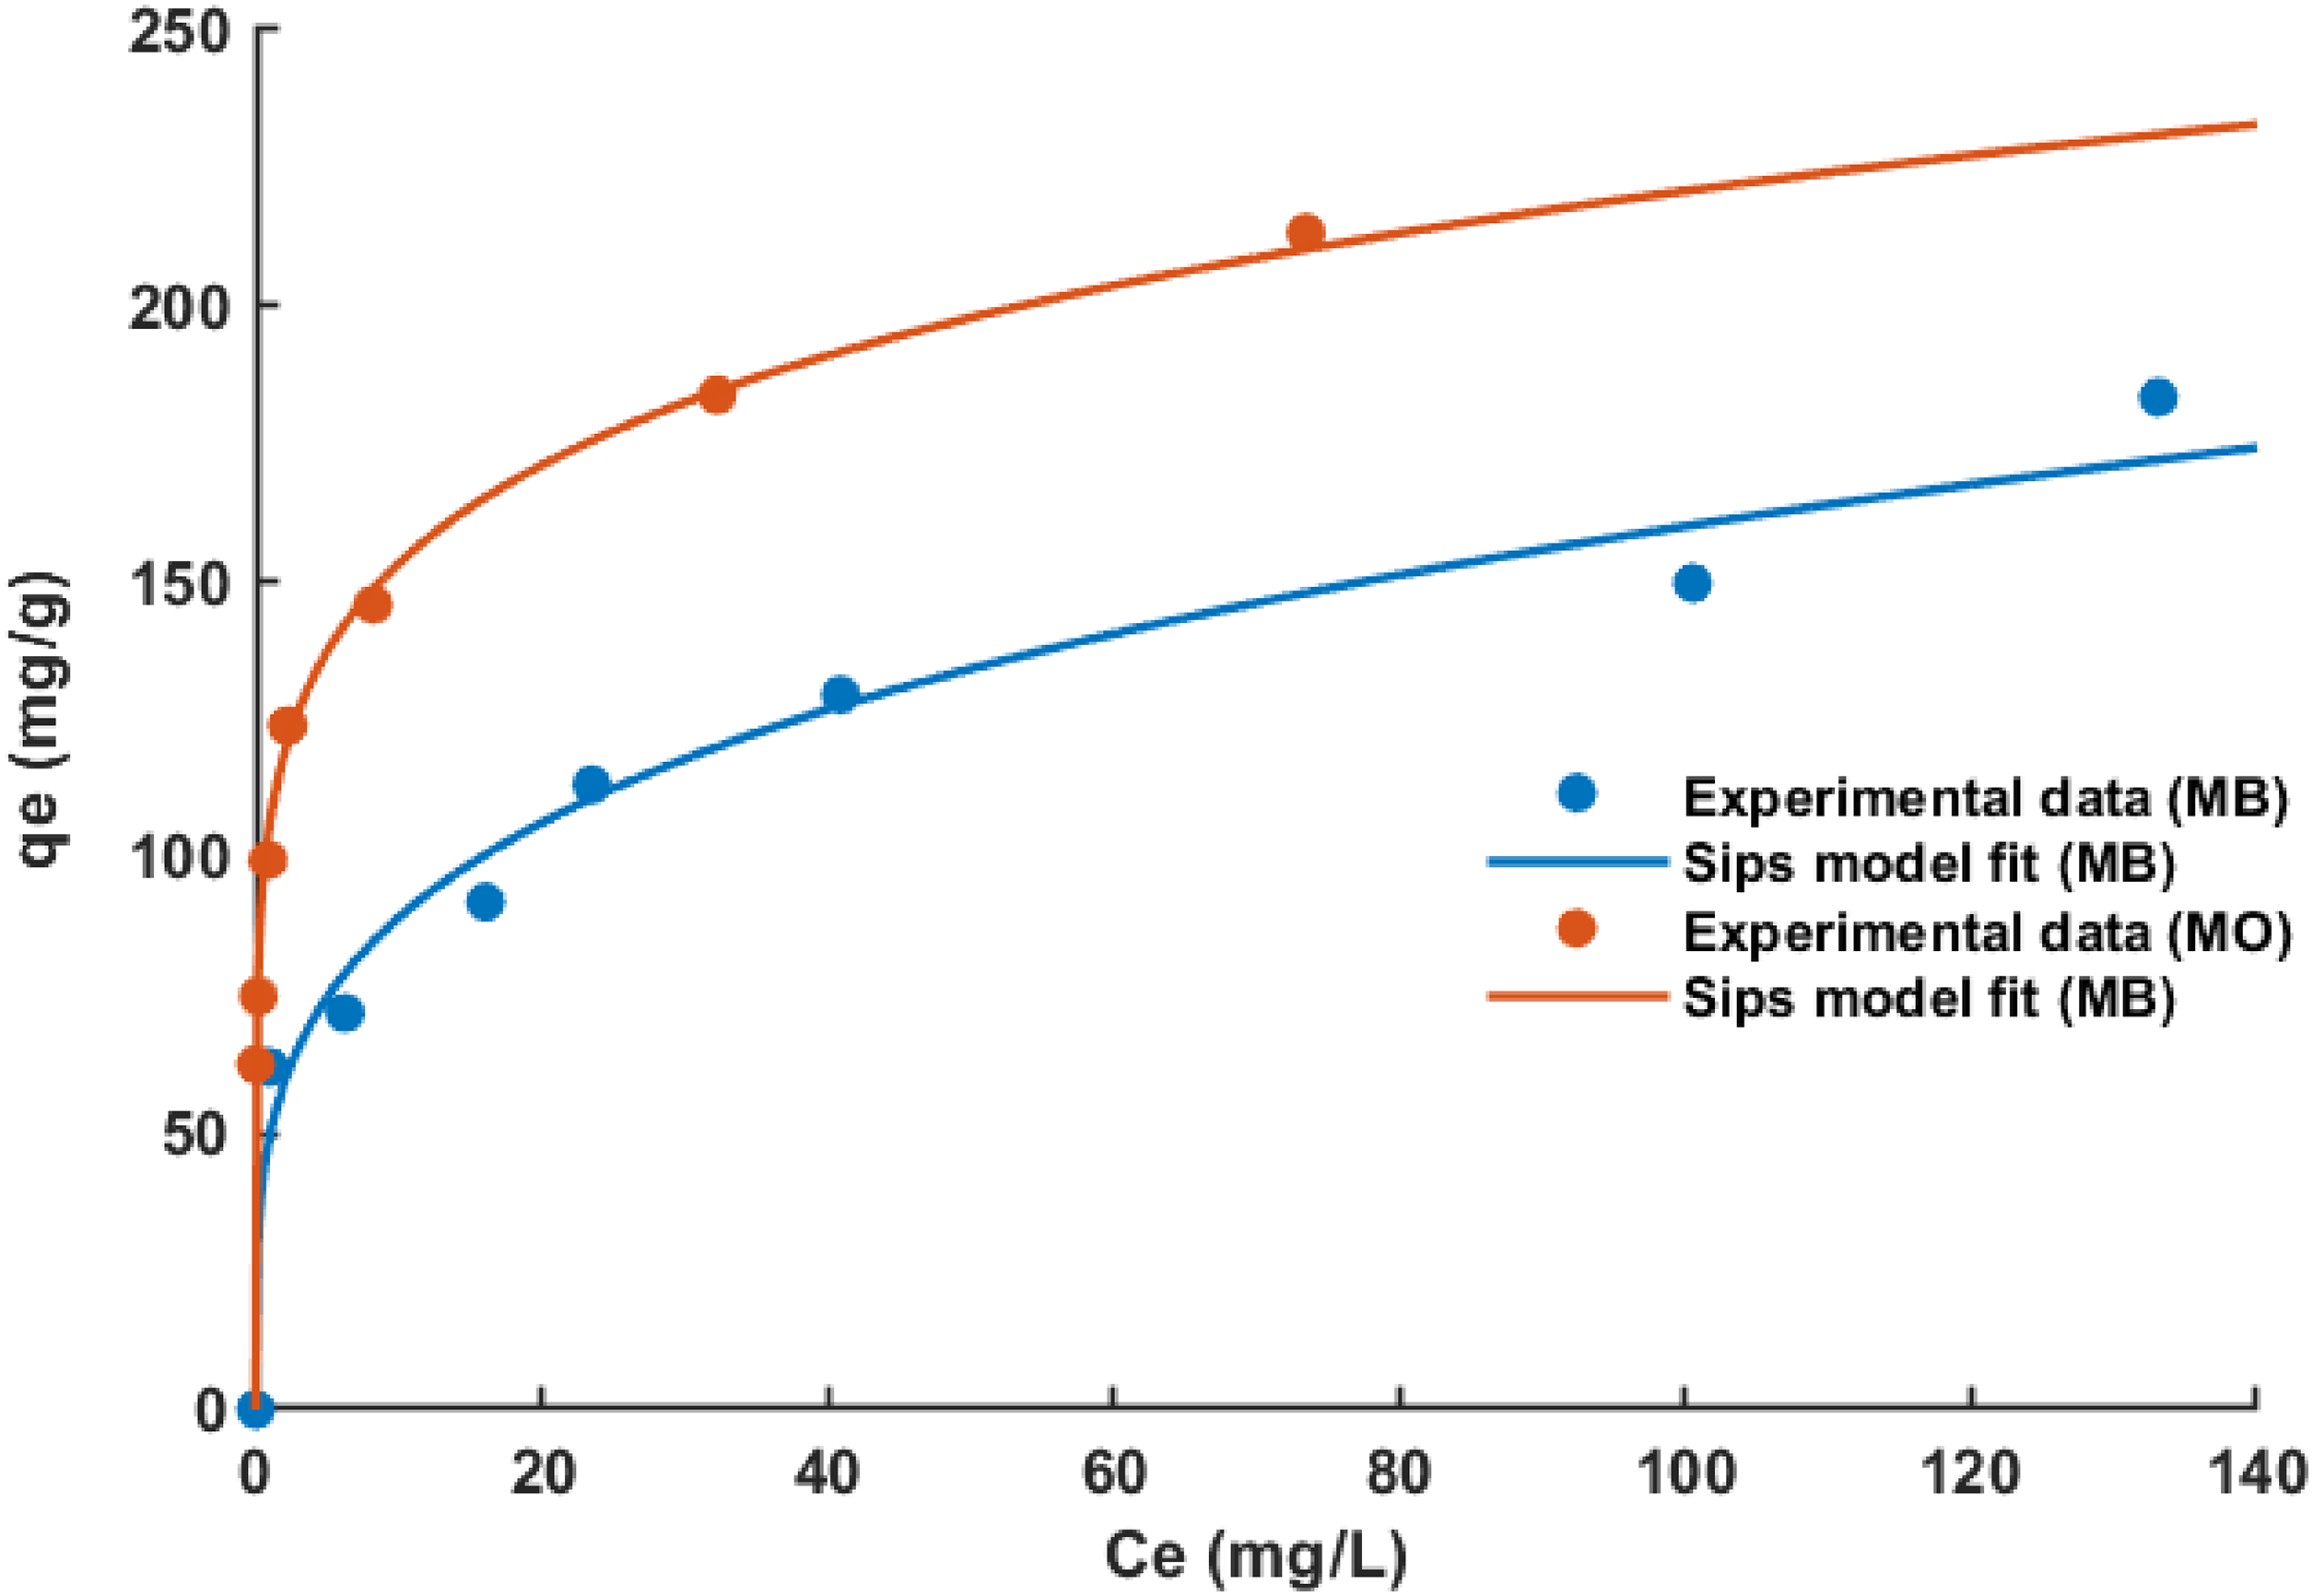
Nonlinear fits of Sips isotherm model to MO and MB adsorption on PNTS2-600-15 (Temp. = 25 ± 1 °C).
According to Varank et al. (2012), the Sips isotherm exponent, ns, determines the degree of deviation from the Langmuir model, which is obtained when
Desorption studies
Desorption studies are, to some extent, useful in understanding the adsorption mechanism and the regeneration potential of adsorbents, which can enhance the economic feasibility of the treatment process by enabling multiple cycles of adsorbent reuse (Tran et al., 2017c). To further investigate the effect of pH levels on the adsorption of MO and MB onto PNTS2-600-15, desorption experiments for MO and MB removal from PNTS2-600-15 were conducted using DI water at pH 8 and pH 2.
The PZC of PNTS2-600-15 was found to be ∼6 (Table 1). Therefore, at higher pH levels, the surface of PNTS2-600-15 was expected to be negatively charged to facilitate the desorption of MO anions. Conversely, at lower pH levels, the surface of PNTS2-600-15 was expected to be positively charged to favour the desorption of MB cations. However, the results did not support this hypothesis, as no significant desorption was observed under these conditions, as shown in Supplemental Figure 4 (see Supplemental Material), indicating that adsorption was not strongly dependent on electrostatic attractions.
Creating a driving force for desorption, by applying pure solvent (in this case water) and/or using heat, is often used to facilitate release of adsorbed material from the surface and effect its removal; these effects were investigated in this study using water at room temperature, as well as hot water. Figure 12 illustrates the percentage of MO and MB desorbed using DI water at ambient temperature and 80 ± 2 °C. At ambient temperature, it can be observed that the desorption percentages were minimal for both dyes. (Note: after 1 h of agitation, the dye concentration reached a saturation point, and some of the desorbed dye molecules started to re-attach to the adsorbent surface. Therefore, agitation time was limited to 20 min (Supplemental Figure 5, see Supplemental Material). However, when the temperature of the solvent was increased to 80 °C, a significant increase in the desorption percentages were noted for both dyes. This suggests that the adsorption process was exothermic in nature and likely dominated by physical interactions.

Percentage of MO and MB desorbed from on PNTS2-600-15 using DI water at ambient temperature and 80 °C in a single wash.
Given the high recoveries observed using hot water, this method was applied as the regeneration step between successive adsorption runs. Figure 13 shows the trend of MO and MB removal efficiencies of PNTS2-600-15 as a function of the desorption–adsorption cycle using DI water at 80 °C in single wash for the desorption step. The adsorption capacity of the regenerated adsorbent for both dyes declined progressively with each cycle, as a fraction of dye molecules remained irreversibly bound to the adsorbent surface and reduced the available sites for adsorption. While this could indicate that there is a chemical interaction binding a fraction of molecules to the surface, it is also possible that either the temperature, and/or contact time, is insufficient to fully realise desorption, and the effect of this builds up over time.

Variation of MO and MB removal efficiencies from PNTS2-600-15, as a function of the adsorption–desorption cycle using DI water at 80 °C in a single wash.
As a result of the high, yet declining, efficiencies observed for the desorption experiments run at 80 °C in a single wash, the temperature of the DI water was increased to 90 ± 2 °C, and this water was used to rinse the spent adsorbent multiple times until negligible further desorption was observed. As shown by the results presented in Figure 14, increasing the temperature and number of washes enhanced the desorption process significantly. The adsorbent exhibited a high and stable removal efficiency of over 99% for MO dye throughout the repeated cycles. However, the removal efficiency for MB dye declined to 88% by the sixth cycle (note that this is still higher than for the lower temperature single wash process). This decrease in removal could be attributed to more MB dye molecules being retained via chemical binding with the adsorbent surface and remaining irreversible in the desorption process.

Variation of MO and MB removal efficiencies by PNTS2-600-15 as a function of the adsorption–desorption cycle using DI water at 90 °C in multiple washes.
Adsorption mechanism
Typically, both anionic and cationic dyes may undergo various modes of adsorption mechanism, such as electrostatic interaction, hydrogen bonding, π–π stacking, n–π interaction (which entails the transfer of lone pair electrons from oxygen, nitrogen or sulphur atoms to π orbitals of C═O, C═N or aromatic groups) and pore filling (Das and Panwaria, 2022; Iwuozor et al., 2021; Tran et al., 2017d).
The effect of solution pH on the adsorption behaviour of MO and MB on PTNS2-600-15 has been discussed above. The results (Figure 8) indicate that the adsorption process was not strongly dependent on electrostatic attractions. As already discussed within the desorption studies results, the desorption of both dyes was negligible in basic and acidic solutions, also, implying that electrostatic interactions did not play a significant role in the sorption of MO and MB on PNTS2-600-15.
The surface hydrogens of the hydroxyl groups (H-donor) on the AC samples may form hydrogen bonds with the heteroatoms (such as oxygen, nitrogen, and halogens; H-acceptor) within the dye structure, which is a type of dipole–dipole H-bonding, or with the aromatic rings in the dye structure (also known as Yoshida H–bonding interaction) (Iwuozor et al., 2021). The surface chemistry of the synthesised AC was examined by FTIR and XPS, which both indicated the existence of oxygen complexes. XPS detected the presence of esters, COOR, in PNTS2-600-15, where R could be H or an alkyl group. If R=H, the hydrogen in –OH of the carboxyl group could participate in hydrogen bonding with the dyes, however, FTIR analysis showed that –OH groups were absent or infinitesimal in PNTS2-600-15 after activation, which could be attributed to the dehydrating effects of ZnCl2 and the increased activation temperature. Therefore, the role of hydrogen bonding interaction in the adsorption of MO and MB on PNTS2-600-15 was assumed to be minimal or negligible.
The potential n–π interaction was also explored. Both MO (polycyclic aromatic compound) and MB (heterocyclic aromatic compound) are aromatic in nature, which may enable n–π electron donor–acceptor (EDA) interactions. The C–O groups on PNTS2-600-15, as revealed by both FTIR and XPS analyses, could serve as electron donors and the aromatic rings of the dyes as electron acceptors (Rivera-Utrilla and Sánchez-Polo, 2002). The FTIR analysis of PNTS2-600-15 after adsorption of both dyes (Figure 2) revealed changes and shifts in the peaks corresponding to the C–O groups on the adsorbent. The peak at 1150 cm−1, attributed to the C–O groups on PNTS2-600-15, shifted to 1110 and 1114 cm−1 after adsorption of MO and MB, respectively. These shifts indicate that dye molecules were adsorbed at the sites of the C–O groups on the adsorbent, as suggested by Al-Ghouti et al. (2003). Therefore, it can be inferred that there was significant n–π electron donor–acceptor (EDA) interaction between the adsorbent and the dye molecules.
The kinetic studies indicated that pore diffusion was involved in the adsorption of both MO and MB dyes on PNTS2-600-15. As the dye molecules diffuse into the adsorbent particles, due to the heterogeneous nature of PNTS2-600-15, as revealed by the characterisation analysis, molecular sieving effects could facilitate pore filling by selectively adsorbing dye molecules that fit the pore size of the adsorbent. Pore filling was investigated by performing textural analysis on MO- and MB-loaded PNTS2-600-15, as shown in Table 1. The results revealed that the adsorption of the dye molecules affected the surface properties and the pore structure of the adsorbent. The surface area and the TPV decreased after the adsorption process, while the micropore volume increased. This can be attributed to the formation of dye layers on the walls of the larger pores, reducing the external surface area and the mesopore volume. This process effectively narrows the pore size, leading to an increase in the micropore volume. PSD curves, as shown in Supplemental Figure 2 (see Supplemental Material), were also used to visualise this phenomenon; the curves of both MO- and MB-loaded samples shifted to the left, indicating a decrease in pore widths. The multilayer formation of the dye molecules is consistent with the Freundlich model, which fits the equilibrium data. Based on this analysis, it can be concluded that the adsorption process was influenced by a pore filling mechanism, with similar observations reported in the literature (Juang et al., 2006; Lee et al., 2007).
The π–π dispersion interaction between the dye molecules and the synthesised AC was also investigated. The FTIR and XPS analyses revealed that the synthesised AC material had aromatic C═C bonds, which indicates the presence of π electrons in the AC aromatic rings (Tran et al., 2017c). The quantitative XPS analysis revealed that PNTS2-600-15 had approximately 78% of carbon attached functional groups, with aromatic C═C bonds constituting approximately 43% of them. This indicated a higher π electron density in the basal plane of PNTS2-600-15. However, consideration must also be given to the electron withdrawing groups present on the surface of the carbon material. Previous studies reported that an increase in the concentration of oxygenated groups, which are electron-withdrawing, reduced the basal plane electron density of the synthesised aromatic carbon (Huff and Lee, 2016). XPS quantitative analysis within this study showed that PNTS2-600-15 consisted of ∼7% oxygenated groups, suggesting the sample had a high π-electron density in its graphene layer that could interact with the aromatic rings of the dye molecules. The FTIR analysis of PNTS2-600-15 after the adsorption of both dyes revealed changes and shifts in the peaks corresponding to the aromatic C═C bonds on the adsorbent (Figure 2). The peak at 1566 cm−1, attributed to the skeletal vibration of aromatic C═C bonds on PNTS2-600-15, shifted to 1554 cm−1 after adsorption of MO and MB. This shift indicates that dye molecules interacted at the sites of the C═C bonds on the adsorbent, as reported in the literature (Al-Ghouti et al., 2003; Tran et al., 2017a). Therefore, it can be inferred that significant π–π dispersion interactions occurred between the adsorbent and the dye molecules.
The adsorption of organic and aromatic compounds on carbon materials is governed by a complex interplay of electrostatic and dispersive interactions (Rivera-Utrilla and Sánchez-Polo, 2002). Previous studies have suggested that the adsorption of aromatic compounds involves the formation of donor-acceptor complexes between the carbonyl groups on the carbon surface and the organic molecules (Mattson et al., 1969) or the π–π interactions between the aromatic rings (Coughlin and Ezra, 1968). Tran et al. (2017b) reported that the adsorption of methylene green 5 on activated carbon was mainly driven by π–π interactions and pore filling. In this study, we propose that the adsorption mechanisms of MO and MB on the synthesised AC are similar, and that they involve π–π interactions, n–π electron donor-acceptor (EDA) interactions and pore filling, based on the evidence from pH analysis, FTIR and XPS analyses, textural analysis, and desorption studies. Other mechanisms, such as electrostatic interactions and hydrogen bonding, may also play a minor role.
Table 5 displays the comparison of maximum adsorption capacity of PNTS2-600-15 for MO and MB to various AC materials in the literature. According to the Sips model, the peanut shell-based AC material developed in this study exhibited outstanding adsorption performance for both dyes.
Comparison of adsorption capacities of ACs from various precursors for the removal of MO and MB.

Conclusions
This study investigated the efficacy of a novel and cost-effective adsorbent material (PNTS2-600-15), derived from peanut shells, for the removal of MO and MB dyes from water. The findings revealed that the adsorption behaviour of both dyes followed the PSO kinetic model and conformed to the Freundlich and Sips isotherm models.
Specifically, the adsorption of MO on PNTS2-600-15 exhibited rapid kinetics, achieving 80% removal within 20 min, while MB reached 61% removal during the same time interval. According to the Sips model, the maximum adsorption capacities of the carbon material were 4584 mg/g for MO and 1769 mg/g for MB.
Furthermore, the adsorbent material demonstrated excellent reusability and stability, maintaining over 90% dye removal even after undergoing five cycles of regeneration. The underlying adsorption mechanism primarily involves π–π interactions, n–π electron donor–acceptor interactions, and pore filling, emphasising that physical interactions predominantly governed the adsorption of the dyes onto the carbon material.
In summary, these results highlight the potential of peanut shell-based carbon material as a promising adsorbent for effectively removing ionic dyes from wastewater.
Supplemental Material
sj-docx-1-adt-10.1177_02636174241256843 - Supplemental material for A novel activated carbon material from peanut shells for the removal of methyl orange and methylene blue dyes from wastewater: kinetics, isotherms and mechanism
Supplemental material, sj-docx-1-adt-10.1177_02636174241256843 for A novel activated carbon material from peanut shells for the removal of methyl orange and methylene blue dyes from wastewater: kinetics, isotherms and mechanism by Oluwagbemi Aladeokin and Ashleigh Fletcher in Adsorption Science & Technology
Footnotes
Declaration of conflicting interests
The authors declared no potential conflicts of interest with respect to the research, authorship, and/or publication of this article.
Funding
The authors received no financial support for the research, authorship, and/or publication of this article.
Supplemental material
Supplemental material for this article is available online.
References
Supplementary Material
Please find the following supplemental material available below.
For Open Access articles published under a Creative Commons License, all supplemental material carries the same license as the article it is associated with.
For non-Open Access articles published, all supplemental material carries a non-exclusive license, and permission requests for re-use of supplemental material or any part of supplemental material shall be sent directly to the copyright owner as specified in the copyright notice associated with the article.