
Abstract
Ceratonia siliqua pod biochar sample (CBC) was generated in this work from C. siliqua (carob pod waste) biomass (CBM) by slow pyrolysis for 5h at 400°C as an alternative low-cost biosorbent for the removal of Cr(VI). The biosorption parameters that were adjusted were the initial pH (2.0–10.0), temperature (30°C, 40°C, and 50°C), biosorbent dose (0.01–0.03 g/50 mL), initial Cr(VI) concentration (10–100 mg/L), and contact period (0–360 min). The interaction between the surface functional groups on the CBM and CBC and the Cr(VI) ions was found to be the primary mechanism for Cr(VI) sorption via surface complexation and electrostatic interactions, according to the investigation of the pH influence. The Langmuir isotherm was shown to be more well-fitting than the Freundlich and Dubinin-Radushkevich isotherms for the concentration range of 10 to 100 mg/L. The testing results indicated a sorption capacity of 90.909 mg/g of CBM and 131.579 mg/g of CBC. According to kinetic investigations, the absorption of Cr(VI) ions onto CBM and CBC was defined in pseudo-second order. The findings of thermodynamic investigations showed that the biosorption of Cr(VI) ions onto CBM and CBC was an exothermic, spontaneous process. These findings demonstrated that, even for high concentrations of Cr(VI) in industrial wastewater, CBM and CBC could be viable, affordable alternatives as adsorbents.
Keywords
Introduction
One of the key metals in industry, chrome (Cr), is employed in various human endeavors, including chrome plating, leather tanning, and dyeing. Because Cr6+ is an ionic compound, it is highly soluble in water and readily absorbed by aquatic organisms, posing a threat to both human and aquatic life. It is categorized as mutagenic, poisonous, and carcinogenic to humans (Badessa et al., 2020; Zhou et al., 2018). According to the U.S. Environmental Protection Agency, the maximum chromium concentration in drinking water should not be more than 0.1 ppm (Adekola and Adegoke, 2005).
Several techniques have been employed to remove Cr(VI) from wastewater, including ion exchange, chemical precipitation, liquid extraction or electrodialysis, and membrane filtration. Due to the high cost required and complicated treatment procedures that release poisonous by-products, consume high energy, with low feasibility for small-scale industries, the abovementioned techniques are not preferable and are rarely used. Accordingly, adsorption is one of the most cost-effective, efficient, and practical methods for removing toxic heavy metals from aqueous solutions (Kumar et al., 2023; Varadharaj et al., 2023). The adsorption process is based on sorbents, insoluble substances that adhere to and hold pollutants in their pores and capillary surfaces (Mohammed et al., 2018). The removal of chromium from aqueous solutions has been studied using several low-cost and highly efficient natural forms (raw) and modified (chemically or thermally) adsorbents, including ethylenediaminetetraacetic acid-modified attapulgite (Wang et al., 2020), surfactant-modified diatomaceous earth (Shafqat et al., 2008), activated carbon (Dula et al., 2014), cork waste (Sfaksi et al., 2014), citrus reticulate waste biomass (Zubair et al., 2008), modified activated carbon (Valentín-Reyes et al., 2019), and Fe-loaded food waste biochar and Chlorella-based biochar (Kang et al., 2022; Moon et al., 2023).
By pyrolyzing biomass, such as fruit waste, rice husk, sawdust, bark, and other tannin-rich materials, biochar is created in the absence of oxygen, which is a carbon-rich, fine-grained, and porous substance (Varadharaj et al., 2023; Alharbi et al., 2022). The distinctive properties of biochar, such as its high specific surface area, microporosity, high adsorption capacity, pH, and ion exchange capacity, make it a valuable sorbent material for separation and purification in adsorption applications.
Ceratonia siliqua L. is the carob tree's scientific name. The family Leguminosae includes the genus Ceratonia. The carob tree, also known as Fabaceae or Rosales, is primarily planted throughout the Mediterranean Basin (I. Batlle, Carob tree, 1997). To eliminate contaminants from water or wastewater, such as heavy metals, carob is a sustainable and alternative biomass source (I. Batlle, Carob tree, 1997). Several research looked into the use of carob biomass for the removal of contaminants, including Bensafiddine et al. (2020), which looked into the raw carob shells’ ability to absorb copper, nickel, and methylene blue from wastewater. Farnane et al. (2018) investigated the removal of cobalt (II) and cadmium (II) from wastewater using defatted carob seeds. Gezer (2018) and Farhan et al. (2012) studied the use of carob tree bark in the adsorption of zinc (II), nickel (II), copper (II), and cadmium (II) from wastewater in a batch biosorption process.
There have been no studies that explicitly address the use of carob biomass and biochar in removing Cr(VI) from aqueous solutions or wastewater, with the exception of the newly published study by Bouaouina et al. (2022). The primary aim of this research is to synthesize plentiful, affordable, and environmentally safe biochar and other agricultural by-products by pyrolyzing C. siliqua (carob pod waste) biomass (CBM) and a C. siliqua pod biochar sample (CBC) at 400°C. The elimination of Cr(VI) ions using raw carob and biochar made by pyrolyzing the biomass at 400°C for 5 h was investigated in terms of the operating parameters, including temperature, adsorbent dosage, contact time, solution pH, and beginning Cr(VI) ion concentration. The biosorption kinetic data were tested using pseudo-first order, pseudo-second order, and intraparticle diffusion kinetic models. Utilizing the Freundlich, D-R, and Langmuir isotherm models, the equilibrium data was examined.
Materials and methods
Materials and instruments
All the reagents used in this study were purchased from Sigma Aldrich Co. and of analytical grade with purity > 99%. The raw carob fruit was collected in the Amman region of Jordan. Prior to drying at 80°C for 2 h to remove the moisture, it was first cut into small pieces and thoroughly cleaned with distilled water to get rid of contaminants like sand and dust. The material was ground using a food processor (Moulinex, France), and the powder was then sieved to < 40 µm size.
A thermostat-equipped shaker (GFL model no. 1083, Germany) was used to shake samples. The samples were ignited in a muffle furnace (Naber, model no. H3/A, Germany). The samples were weighed using an analytical balance (Mettler, model no. CH-8606, Switzerland) with three digits after the decimal point. A pH meter (Eutech, model no. 2700, Singapore) was employed to gauge the pH of the solutions. NETZSCH STA (409 PG/PC, Germany) Thermal Analyzer was used to study the samples’ thermal gravimetric analysis (TGA) in the temperature range (25°C–700°C). For phase analysis, an X-ray powder diffraction machine (XRD Shimadzu, model 7000) was utilized. The Fourier Transform Infrared Spectroscopy (FTIR) spectra were obtained using a Thermo Nicolet NEXUS 670 FTIR spectrometer (USA). Scanning electron microscopy (SEM) (VERSA-3D, FEI, the Netherlands) was used to analyze the surface morphology of the samples. Utilizing a Varian UV-Vis spectrophotometer (Cary 100, Australia), the amount of chromium ions was measured. The solid addition method, as previously reported in our works (Salameh et al., 2017), was used to determine the pH at point of zero charge (pHpzc) of the CBM and CBC adsorbent.
Determination of surface area
The surface area was calculated using the Sears technique (El Hanandeh et al., 2016; Sears, 1956). After adding 10 g of NaCl and acidifying the sample with 0.1 M HCl to bring its pH between 3.0 and 3.5, 50.0 mL of deionized water was added. The sample contained 0.5g of CBM and CBC. Standard 0.1 M NaOH was used for the titration, which was conducted at 25°C in a thermostatic bath to reach pH 4.0 and then pH 9.0. After measuring the volume V needed to increase the pH from 4.0 to 9.0 mL, the surface area was calculated using the equation that follows:

Biochar preparation
Fifty grams of grounded samples were wrapped tightly in aluminum foil. A small hole was made in the wrapping using a needle to allow the evolved gases (when placed in the furnace) to escape and heated at 400°C for 5 h and labeled (CBC). Afterward, the biochar was washed several times with deionized water and acetone to ensure the removal of unreacted organic contents. Finally, the biochar was dried in an oven at 60 °C for 24 h and kept in a desiccator for further use.
Moisture and ash content
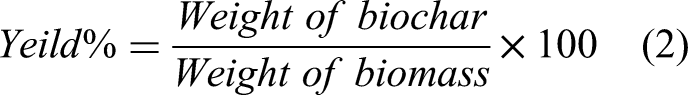
The yield of biochar was determined using the following equation using the weight of CBM on a dry basis:


Biosorption experiments
First, 2.826 g of K2Cr2O7 were dissolved in 100 mL of deionized distilled water, and the stock solution, which contained 1000 mg/L, was quantitatively diluted to 1000 mL using the same deionized distilled water. NaOH and HCl 0.1 M solutions were used to change the medium's pH. Using the colorimetric 1,5-diphenylcarbazide approach, a UV-Vis spectrophotometer operating at 540 nm wavelength measured the content of Cr(VI) in a sample (Onchoke and Sasu, 2016; Adekola and Adegoke, 2005). As usual, the absorbance versus Cr(VI) concentration was graphed to construct the calibration curve. Every experiment was run in three duplicates. The following formulas were used to determine the adsorption capacity (qe, mg/g) and the percentage removal of biosorption (%R) (Krishnamoorthy et al., 2019; Rambabu et al., 2019):


During the course of the study, the effects of various experimental parameters were assessed, including pH 1–10, biosorbent dose (0.01, 0.015, 0.02, 0.03, 0.04, and 0.05 g), initial metal concentration (10, 20, 30, 40, 50, 60, 70, 80, 90, and 100 mg/L), temperature (30°C, 40°C, and 50°C), and contact time (0–360 min).
Isotherm and kinetic models
The empirical adsorption models included in this study are listed in Table 1 and include the Weber-Morris intraparticle diffusion model (Weber and Morris, 1963), adsorption isotherm models (Langmuir, 1918; Kitkaew et al., 2018; Freundlich, 1906; Dubinin et al., 1947), and adsorption kinetic models (Lagergren, 1898; Ho, 2006).
Adsorption equilibrium isotherm and kinetic models.

CBC: Ceratonia siliqua pod biochar sample; CBM: Ceratonia siliqua (carob pod waste) biomass.
Evaluation of the tested isotherm and kinetic models
To find the best-fit model for the adsorption equilibrium and kinetic trials, the R2 and χ2 values were recommended. Verifying the best-fit isotherm and kinetic for a particular biosorption system was crucial and required dataset analysis utilizing R2 and χ2 tests. The following equations were used to calculate the values of these two factors:

The models were also evaluated using a function F(error%) that quantifies the differences between the amount of Cr(VI) ions absorbed by the biosorbent that the models predicted and the actual qe that was observed experimentally (Vaghetti et al., 2009).
Results and discussion
Characterization of adsorbents
The CBM and CBC were characterized using XRD, SEM, TGA, FTIR, pHpzc, and specific surface area measurements, moisture content% and ash content%.
Yield and physicochemical properties of biosorbents
Table 2 includes a list of the physicochemical characteristics of CBM and CBC, such as biochar yield, ash content, moisture content, specific surface area, pH, and pHpzc. The ash percentage of the CBC was 8.83%, a low figure that is ideal for the formation of biochar and reflects its high quality. As a result of pyrolysis, the CBC's pH value dropped from 8.07 to 7.46, which is compatible with the reduced ash content (67.22–8.83%). The specific surface area values were found to be 195.32 m2/g for CBM, and 360.28 m2/g for CBC due to pyrolysis effect.
Basic physicochemical characteristics of the CBM and CBC.

CBC: Ceratonia siliqua pod biochar sample; CBM: Ceratonia siliqua (carob pod waste) biomass; SA: surface area.
FTIR spectra
The infrared spectra of CBM and CBC are shown in Figure 1. The complex structure of CBM was emphasized by the numerous absorption peaks visible in its spectra. Strong band between 3625 and 3272 cm−1 that is indicative of the linked O-H group of hydroxyl groups and belongs to the stretching of the N-H bond of amino groups (Rubio et al., 2013). It is possible to associate the bands at 2917 and 2866 cm−1 with the –CH stretching vibrations of the –CH3 and –CH2 functional groups, respectively. The stretching vibrations of C=O in the conjugated aldehyde and carboxylic acid groups are responsible for the peak at 1619 cm−1, whereas the C=O stretching in the amide moiety may be the cause of the peak at 1447 cm−1. The primary and secondary amides’ N-H stretching, and the presence of carboxylic acids are shown by the bands at 1134 to 1473 cm−1. The lignin structure of CBM is confirmed by the prominent C-O band at 1026 cm−1. With a small shift in the typical wavenumbers, the FTIR spectra of CBC exhibits essentially identical characteristics. The majority of the CBC bands (3576, 3198, 2915, 2852, 1614, 1429, 1116, 1162, and 1129 cm−1) shift or intensify as a result of the carbonization of CBM, confirming a reduction in the amount of water, aliphatic, and lignocellulose chemicals (Farnane et al., 2017).

FTIR spectra of CBM and CBC. CBC: Ceratonia siliqua pod biochar sample; CBM: Ceratonia siliqua (carob pod waste) biomass.
XRD
The XRD signals in Figure 1 show the crystalline structure of the CBM and CBC. The three peaks at 2θ = 14.94° with (110), 2θ = 24.36° (200), and 2θ = 38.36° (004) in the XRD pattern for CBM exhibit a characteristic for crystalline cellulose (monoclinic structure); these results are in good agreement with (Bouaouina et al., 2022). The CBC sample underwent significant modifications following thermal treatment at 500°C (Figure 2). The previously described peaks vanished and were replaced by new peaks at 2θ = 29.20°, 2θ = 33.85°, 2θ = 36.00°, 2θ = 47.20°, and 2θ = 48.50° that displayed indications of enhanced crystallinity. The peaks of the aluminum sample holder are located at 2θ = 37.00°and 2θ = 44.00°.

XRD diffraction pattern of CBM and CBC. CBC: Ceratonia siliqua pod biochar sample; CBM: Ceratonia siliqua (carob pod waste) biomass; XRD: X-ray powder diffraction.
SEM
The surface morphology of the thermally treated CBC and the raw biomass CBM exhibits notable changes, as indicated by the SEM micrograph (Figure 3). It was evident that the raw material had irregularly shaped grains with a range of grain sizes; the gaps and holes were not readily visible on the surface (Figure 3(a)). The CBC sample (Figure 3(b)), however, demonstrated better gaps and holes creation that are widely dispersed on the surface as a result of thermal degradation. It is possible to see the CBC's uneven and heterogeneous holes and gaps, which encourage the adhesion of metal ions found in the aqueous solution.

SEM micrograph of biosorbent: (a) CBM and (b) CBC. CBC: Ceratonia siliqua pod biochar sample; CBM: Ceratonia siliqua (carob pod waste) biomass; SEM: scanning electron microscopy.
TGA
TGA revealed that the vaporization of free water at 100°C caused a decline in CBM and CBC between 50 and 100°C of 2% and 3% weight loss, respectively (Figure 4). The degradation of cellulose and hemicellulose in the CBM sample caused two additional mass losses at temperatures of 250°C and 320°C, respectively. Additionally, lignin slowly decomposed above 400°C; the residual proportion for CBM at 700°C is 44%. The CBC sample demonstrated exceptional thermal stability, with a modest weight loss as the temperature rose and an 87% residual percentage at 700°C. These results indicated that CBC could be used as a potential adsorbent for organic and inorganic pollutants.

TGA thermogram of CBM and CBC. CBC: Ceratonia siliqua pod biochar sample; CBM: Ceratonia siliqua (carob pod waste) biomass; TGA: thermal gravimetric analysis.
Effect of biosorbent dosage
The effects of biosorbent dose on the biosorption of Cr(VI) ions were examined, with biomass loading ranging from 0.01 to 0.05 g/50 mL (Figure 5). The results shown in Figure 5 indicate that the largest percentage of Cr(VI) removal was achieved with 0.04 g of both CBM and CBC, with percentages of removal of 94.5% and 98.7%, respectively. An increase in the dose of the biosorbent has a considerable effect on the amount of Cr(VI) ions adsorbed because of the agglomeration of the biomass particles, increase in surface area, and availability of more adsorption active sites (Pradhan et al., 2019). At doses of biosorbent >0.04 g, the biosorption efficiency remains constant due to the presence of more accessible sites and insufficient metal ions in the solution (Tadjenant et al., 2020). Conversely, as the dosage of biosorbent is raised, the amount of Cr(VI) ion absorbed per gram of biosorbent (qe) considerably falls. This can be mathematically explained by combining equations (4) and (5):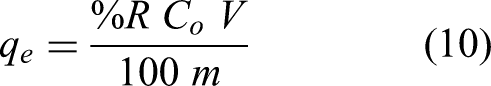

Influence of biosorbent dose on percentage removal (%R) and biosorption efficiency (qe) of Cr(VI) biosorption by CBM and CBC (experimental conditions: Cr(VI) concentration = 50 mg/L, initial pH = 2, adsorption time = 24 h, and T= 30°C). CBC: Ceratonia siliqua pod biochar sample; CBM: Ceratonia siliqua (carob pod waste) biomass.
As seen in equation (10), the mass of the biosorbent (m) and the amount of Cr(VI) ion uptake (qe) are inversely proportional. Since the volume (V) and initial Cr(VI) ion concentrations (Co) are always constant, an increase in biosorbent mass results in a drop in qe values for a fixed Cr(VI) ion %R (Kumar and Porkodi, 2007). The dosage that was chosen for all of the studies in this article was 0.04 g/50 mL.
Effect of solution pH
The biosorption mechanism is significantly influenced by the pH of the solution and subsequent surface charge of the adsorbent. The pattern of Cr(VI) adsorption on CBM and CBC is comparable and substantially dependent on the initial pH (Figure 6). At pH 2.0, the maximum elimination of Cr(VI) (95.08% for CBM and 85.25% for CBC) was accomplished. The removal effectiveness had gradually decreased as the pH of the solution increased. The fact that Cr(VI) exists in many different ionic forms (

The initial pH system as a function of the adsorptive performance of Cr(VI) by the CBM and CBC (experimental conditions: Cr(VI) concentration = 50 mg/L, adsorption time = 24 h, and CBM and CBC dosage = 0.04 g/50 mL, T= 30°C). CBC: Ceratonia siliqua pod biochar sample; CBM: Ceratonia siliqua (carob pod waste) biomass.
Isothermal models
The experimental data on the biosorption process of Cr(VI) ions were evaluated using the Langmuir, Freundlich, and D-R isotherm models. The adsorption isotherm is a very helpful tool in the equilibrium state to explain the distribution of adsorbed molecules between the liquid and solid phases. Each isotherm's constant parameters and computed correlation coefficient are listed in Table 3, and each isotherm's plotted experimental data is examined in Figure 7. The adsorption of Cr(VI) ions onto CBM and CBC was best suited for the Langmuir isotherm models in Table 3, which suggest monolayer adsorption on a surface with a homogeneous distribution of active sites. In contrast, Freundlich and D-R models, which were not fitted with experimental data, were obtained according to the values of correlation coefficient R2, χ2, and

Nonlinear regression plots of biosorption isotherms of Cr(VI) ions by CBM and CBC (experimental conditions: Cr(VI) concentration = 10–100 mg/L, initial pH = 2, adsorption time = 24 h, CBM and CBC dosage = 0.04 g/50 mL, T= 30°C). CBC: Ceratonia siliqua pod biochar sample; CBM: Ceratonia siliqua (carob pod waste) biomass.
Fitting parameters of Langmuir, Freundlich, and D-R isotherm models for the biosorption of Cr(VI) ions onto CBM and CBC at 30°C.

CBC: Ceratonia siliqua pod biochar sample; CBM: Ceratonia siliqua (carob pod waste) biomass.
Table 4 compares the biosorption capabilities of Cr(VI) onto a few naturally occurring adsorbents with the one found in this investigation. Table 4 suggests that CBM and CBC are a reasonably efficient adsorbent for Cr(VI) ions from aqueous solution since their adsorption capacities (qmax values) are higher than those of the majority of the reported adsorbents.
Comparison between results recorded for Cr(VI) adsorption onto CBM and CBC to the results of previous studies on natural adsorbents.

CBC: Ceratonia siliqua pod biochar sample; CBM: Ceratonia siliqua (carob pod waste) biomass.
Effect of contact time and adsorption kinetic
The effects of contact time on the biosorption of Cr(VI) ions were measured within the contact time range of 0.0 to 360.0 min, while keeping the initial metal ion concentrations at 50 mg/L, the pH of the solution at 2.0, the temperature at 30.0°C, and the loading dosage at 0.04 g/50 mL (Figure 8). The biosorption capacity increases with the length of the contact period. Significant amounts were adsorbed in the first 150.0 min, and equilibrium behaviors were reached in about 300.0 min. It should be noted that the initial stage of the biosorption process' elevated Cr(VI) ion concentration provides the dive force needed to improve ion diffusion from solution to the absorbent's surface. Furthermore, longer contact times promote Cr(VI) ions to adhere to the biosorbent surface for an extended duration. A slower rate of Cr(VI) biosorption before equilibrium, which may be brought on by occupation of the biosorbent surface and a decrease in Cr(VI) ion concentration, causes the rate of adsorption to decrease until equilibrium is reached. The electrostatic resistance of the deposited Cr(VI) ions to the biosorbent surface provides another possible reason (Hamadneh et al., 2020; Peng et al., 2018).

Biosorption of Cr(VI) ions versus contact time with CBM and CBC (experimental conditions: Cr(VI) concentration = 50 mg/L, initial pH = 2, adsorption time = 24 h, CBM and CBC dosage = 0.04 g/50 mL, T= 30°C). CBC: Ceratonia siliqua pod biochar sample; CBM: Ceratonia siliqua (carob pod waste) biomass.
Pseudo-first order, pseudo-second order, and intraparticle diffusion kinetic models were used to analyze the kinetic data of Cr(VI) ion removal by CBM and CBC (Figure 9).

Nonlinear regression plots of biosorption kinetics models of Cr(VI) ions by CBM and CBC (experimental conditions: Cr(VI) concentration = 50 mg/L, initial pH = 2, adsorption time = 24 h, CBM and CBC dosage = 0.04 g/50 mL, T= 30°C). CBC: Ceratonia siliqua pod biochar sample; CBM: Ceratonia siliqua (carob pod waste) biomass.
The pseudo-first order model predicts that the adsorbate molecule will be adsorbed onto an active site on the outer surface of the biosorbent. Conversely, the pseudo-second order model suggests that a single adsorbate molecule is adsorbed on two of the adsorbent's active sites. Moreover, Figure 9 illustrates how CBM and CBC used the intraparticle diffusion model to understand the adsorption process's diffusion mechanism. The models’ fit accuracy was evaluated using the R2 and χ2 values, as well as by comparing the values of the q(e,exp) and q(e,cal) functions (F(error%)) (Table 5). The experimental data for the biosorption of Cr(VI) on CBM and CBC provided a superior match for the pseudo-second order kinetic model because of its R2 > 0.99 and lower values for χ2 and F(error%). Furthermore, compared to the pseudo-first order model, the pseudo-second order model exhibits a smaller disparity between q(e,exp) and q(e,cal), as Table 5 illustrates. In terms of intraparticle diffusion, biosorption of adsorbates is proportional to the square root of the contact period during the adsorption process. The regression plot of qt versus t (figure not shown) should be linear if the diffusion process is in play, and C = 0 if the regression line crosses the origin (Zhao et al., 2022). Mass transfer through the boundary layer restricts the diffusion rate in this investigation's diffusion curve with C=0, suggesting that factors other than intraparticle diffusion are also influencing the adsorption rate.
Fitting parameters of pseudo-first order, pseudo-second order, and intraparticle diffusion equation for the adsorption of Cr(VI) ions onto CBM and CBC at 30°C.

CBC: Ceratonia siliqua pod biochar sample; CBM: Ceratonia siliqua (carob pod waste) biomass.
Effect of temperature
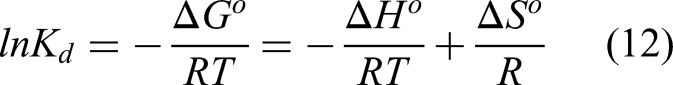
Thermodynamic parameters including standard Gibbs free energy change
The following equation can be used to calculate the adsorption's 
The relationship between 

Thermodynamic study for Cr(VI) removal by the CBM and CBC (experimental conditions: Cr(VI) concentration = 50 mg/L, initial pH = 2, adsorption time = 24 h, CBM and CBC dosage = 0.04 g/50 mL). CBC: Ceratonia siliqua pod biochar sample; CBM: Ceratonia siliqua (carob pod waste) biomass.
Thermodynamic parameters for the biosorption of Cr(VI) ions onto CBM and CBC.

CBC: Ceratonia siliqua pod biochar sample; CBM: Ceratonia siliqua (carob pod waste) biomass.
Conclusions
This work shows that removing Cr(VI) ions from aqueous solutions through biosorption using CBM and CBC is a practical, eco-friendly, and effective method. The data from TGA, XRD, and FTIR analysis demonstrated that the natures of both biosorbents have the elements required for a successful biosorption. Batch studies demonstrate complete biosorption of 10–100 mg Cr(VI) from synthetic wastewater at pH 2.0 for > 360 min and 30°C with a dosage of 0.04 g/50 mL of biosorbent. The best connection was found between the Langmuir sorption isotherm model and the Cr(VI) biosorption equilibrium data for both biosorbents. CBM and CBC were shown to have maximal biosorption capacities of 90.909 and 131.579 mg/g, respectively. The rate of Cr(VI) biosorption on both biosorbents was found to be best fitted by the pseudo-second order kinetic model. The thermodynamic data additionally showed that Cr(VI) biosorption onto CBM and CBC happens exothermally and spontaneously.
Footnotes
Acknowledgements
The authors would like to thank the Deanship of Scientific Research at the University of Jordan for its scientific support.
Authors’ contributions
All authors contributed to the study conception and design. YA, IH, and AHA were responsible for the writing—original draft preparation. YA, IH, and GA were responsible for the visualization. YA, IH, and AA were responsible for the supervision. IH was responsible for the visualization. YA, IH, GA, and AA were responsible for the data curation. MA, AAS, RA, and ME were responsible for formal analysis and investigation. All of the authors worked on the manuscript, read the final version, and approved it.
Declaration of conflicting interests
The authors declared no potential conflicts of interest with respect to the research, authorship, and/or publication of this article.
Data availability
All data generated or analyzed during this study are included in this published article.
Funding
The authors disclosed receipt of the following financial support for the research, authorship, and/or publication of this article: Scientific Research and Innovation Support Fund, Ministry of Higher Education, Jordan (grant number 36/2022).