
Abstract
In this study, a simple analytical procedure for determining the adsorption kinetic parameters Ds and kF from a single concentration history (decay curve) in circulate-type fixed-bed reactor test method was investigated. A simple and reliable method to obtain the parameters Ds and kF from the decay curve of circulate-type fixed-bed reactor was developed based on an advanced analytical method for the completely mixed batch reactor test method. The experimental conditions in the circulate-type fixed-bed reactor method that meet the application criteria of the advanced analytical method for the completely mixed batch reactor test method were investigated based on the theoretical decay curves of the test methods. Experimental conditions, such as large liquid–solid ratio Zϕ, short contact time z/u, and small bed height Z, which make the decay behaviors in the circulate-type fixed-bed reactor close to those of the completely mixed batch reactor, were evaluated quantitatively on theoretical basis. Furthermore, the reliability of the adsorption kinetic parameters obtained in this study was verified by comparing the kF values with those from a reported empirical correlation equation for kF.
Keywords
Introduction
Adsorption equilibrium and kinetic parameters are desirable in the design of any type of engineering adsorption processes. However, measurements of kinetic parameters, such as intraparticle diffusivity (DS) and fluid film mass transfer coefficient (kF), require high amount of experimental and analytical efforts. Several experimental methods for the determination of the kinetic parameters have been proposed for various reactor systems, such as batch reactor, fixed bed, and shallow bed reactors (Badruzzaman et al., 2004; Crittenden and Weber, 1978; Hand et al., 1983, 1984; Michaels, 1952; Satoh et al., 2008; Suzuki and Kawazoe, 1974; Takeuchi et al., 1987). In the estimation of DS using batch reactor and shallow bed reactor, fluid film mass transfer resistance (kF) is neglected in the determination analysis in conventional test methods (Furuya et al., 1996; Hand et al., 1983; Satoh et al., 2008; Suzuki and Kawazoe, 1974). Empirical equations, such as Wilson–Geankoplis correlation and Wakao–Funazukuri correlation, are often used even now to determine kF owing to difficulty of precise measurement in the systems (Coorny, 1991; Rexwinkel et al., 1997; Shafeeyan et al., 2014; Wakao and Funazkri, 1978). The breakthrough method using fixed-bed reactor is the main method that is able to obtain the fluid film mass transfer coefficient as well as the diffusion coefficient with a small quantity of test solution (approximately 20 l); however, data analysis in this method is not simple (Ruthven, 1984). Although data acquisition requires a large quantity of test solution (approximately 150–200 l) in the shallow bed method, data analysis for the determination of the diffusion coefficient is simple and convenient (Hahn et al., 2005). To reduce the amount of test solution used in the breakthrough method and shallow bed method, circulate-type fixed-bed reactor (CFBR) has been proposed; however, data analysis in this system is also not simple (Ben-Shebil et al., 2007). Approximation in the adsorption process model, such as the linear driving force model, is often used to simplify the analysis. However, the approximation also increases the prediction error of the breakthrough behavior, especially in nonlinear adsorption isotherm systems (Kawakita et al., 2016; Miura and Hashimoto, 1977; Ruthven, 1984). Simple and convenient methods that reduce the effort in analysis and the amount of test solution while retaining the accuracy and reliability of the adsorption kinetic parameters are desirable. The CFBR is the focus of this study owing to its advantage of using a small quantity of the test solution. Dynamics of the CFBR analyzed based on a rigorous theoretical model simulation and a determination technique of the adsorption kinetic parameters in the CFBR have been recently reported (Fujiki et al., submitted).
In this study, a simple analytical procedure for determining the adsorption kinetic parameters Ds and kF in the CFBR method was investigated. The key technique in the simple and reliable determination of the kinetic parameters using the CFBR method is the application of advanced analytical method that was essentially developed for the completely mixed batch reactor (CMBR) test method (Fujiki et al., 2010, 2011; Sonetaka et al., 2009). Experimental conditions of the CFBR that meet the application criteria of the advanced CMBR analysis were investigated based on the theoretical model of the decay history in CMBR and CFBR.
Mathematical model of the CFBR adsorber
Figure 1(a) shows the experimental configuration of the CFBR. Difference of the CFBR method from the conventional breakthrough test method is the recycle feed of effluent from the fixed-bed column as indicated in Figure 1(a). Fluid was fed into the shallow packed bed from the batch reservoir vessel and effluent from the shallow packed bed was recovered and quickly mixed in the vessel with a vigorous stirring.
(a) Experimental configuration of CFBR method and (b) schematic of the concentration profiles in the adsorbent particles. CFBR: circulate-type fixed-bed reactor.
Fundamental rigorous model equations for the CFBR method investigated in this study are essentially the same with the ordinary fixed-bed adsorber. The model assumed one-dimensional flow in the packed bed, film transport at fluid–solid (adsorbent) interface, surface diffusion in the intraparticle transport, Freundlich-type adsorption isotherm, and complete mixing in the reservoir vessel. The definitions of concentration in pore and adsorption phase in the adsorbent particles are shown in Figure 1(b).
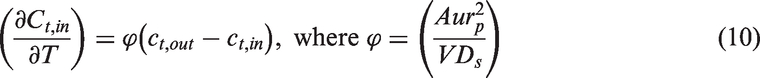
The fundamental equations are stated as follows


Film transport at fluid–solid interface is given by

The fluid film transport is described by the mass balance at the interface with no accumulation.
kF, av, and cs indicate film mass transfer coefficient, surface area of adsorbent particles per unit bed volume, and fluid concentration at the film surface, respectively.
The boundary conditions at the surface of the adsorbent and reservoir mass balance are given by equations (4) and (5), respectively


Mass balance in packed bed column is given as:

Mass balance in adsorbent particles is given as:

Film transport in the fluid – solid interface is given as:

Boundary condition at the surface ofadsorbent is given as:
Reservoir mass balance is given as:

Here, β is slope of operation line on the adsorption isotherm.
Procedure for determining Ds and kF in the CMBR test method
In conventional analytical procedure, Ds is determined from experimental concentration decay curve obtained in the CMBR test method. Details of the reactor configuration for the CMBR method and the analytical procedure can be found in Fujiki et al. (2010) and Sonetaka et al. (2009). Recently, an analytical method for the determination of both Ds and kF from concentration decay curve of the CMBR was proposed by Fujiki et al. (2010). Fundamental model equations of the analysis in the CMBR were also described by equations (2) to (5), and by equations (7) to (10) in dimensionless forms. Mass balance within the reservoir vessel was described by equation (11) in dimensionless form. The reservoir vessel was assumed to be completely mixed to attain homogeneous concentration quickly

From the concentration decay curve theoretically simulated in the CMBR test system, a time ratio T0.2/T0.8 can be determined simply as indicated in Figure 2(a). T0.2 and T0.8 indicate the time at C/C0 = 0.2 and C/C0 = 0.8 in the concentration decay curve, respectively. Figure 2(b) shows the relationship between T0.2/T0.8 and Bi number in the CMBR system (Fujiki et al., 2010). This relationship was obtained by simulations of the decay curves in the CMBR using equations (7) to (11) systematically for a series of Bi numbers. The T0.2/T0.8 values that simply characterize the decay pattern correlate with Bi numbers as shown in Figure 2(b). The Bi number can be estimated using the relationship from the T0.8/T0.2 value obtained from the decay curve in the CMBR experiment. Once the Bi number has been estimated, the estimation of Ds is possible by means of profile fitting of experimentally obtained decay data by model simulation of the CMBR using the estimated Bi number through Ds adjusting. Then, kF can be calculated from the Bi number and the estimated Ds value using equation (8). To verify the accuracy of the kF value, the experimental concentration decay curve is fitted again using the Ds through adjusting kF. The use of T0.2/T0.8 versus Bi number relationship obtained from the simulated concentration decay pattern in the CMBR is the key technique for a simple and reliable determination of the adsorption parameters. After determining Ds and kF through the data fitting, the Bi number is recalculated using the Ds and kF.
(a) Definition of T0.2 and T0.8 and (b) relationship between T0.2/T0.8 versus Bi number in the CMBR. CMBR: completely mixed batch reactor.
Experimental
Concentration decay data acquisition in CFBR
Sample characteristics and experimental conditions.
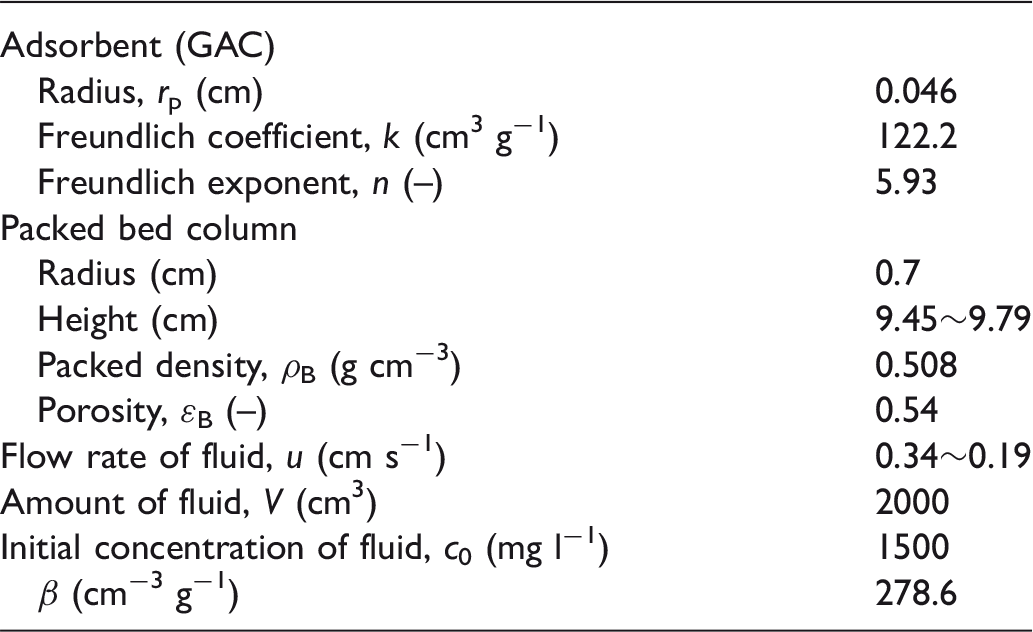
List of experimental conditions performed in the CFBR test.

CFBR: circulate-type fixed-bed reactor.
Simulation of the decay curves in CFBR
Concentration decay curves were simulated with the CFBR model for a series of Zϕ, z/u, and Bi number. The simulation was performed using finite difference method of the model equations. T0.2/T0.8 values were calculated from the series of simulated concentration decay curves and the relationship between T0.2/T0.8 and the Bi number was obtained. The experimental conditions in the CFBR, to which the advanced CMBR analysis would be applicable, were evaluated using the simulated concentration decay curves.
Determination of Ds and kF in CFBR
The determination procedure for Ds and kF from the experimental concentration decay curves in the CFBR using advanced analysis method developed in the CMBR test method is as follows. From the concentration decay curve obtained in the CFBR test, T0.2/T0.8 was first calculated. Then, the Bi number was determined from the relationship between T0.2/T0.8 and the Bi number, which was obtained in advance by the wide parameter range of the decay curve simulations as described above. Using the Bi number, the experimental concentration decay curve was fitted by simulation while adjusting Ds. Once the decay curve was well fitted, then kF was determined from the Bi number and Ds. The experimental concentration decay curve was fitted again by simulation using kF while adjusting kF.
Results and discussion
Behavior of concentration decay curve in CFBR
Figure 3 shows examples of the concentration decay curves simulated with the CFBR model (Bi = 30) for Zϕ = 1.1 (Z = 0.1, ϕ = 11) (bold line) and Zϕ = 1.3 (Z = 2, ϕ = 0.65) (dotted line), respectively. Saturation concentration in the reservoir depends on the Zϕ value. The decay curves are simple decreasing functions for small Zϕ (Zϕ = 1.1 in Figure 3) and small z/u (large ϕ) conditions; that is, small solid–liquid ratio (Zϕ) and small residence time of fluid in the packed (fixed) bed column (z/u). The concentration buffer in the reservoir vessel tends to become large under small Zϕ and z/u conditions depending on the decrease in Zϕ. For large Zϕ (Zϕ = 1.3 in Figure 3) and large z/u (small ϕ) conditions, a rebound peak followed by a fluctuation in the saturating curve occurred in the decay curve owing to the influence of breakthrough from the packed bed and recycling of the effluent. The application of the CMBR analysis to the decay curves obtained in the CFBR can be verified using the patterns of the decay curves. In the application of the advanced CMBR analysis to the determination of both Ds and kF from the decay curve obtained in the CFBR, simply decreasing the concentration decay curves without any rebound peaks and fluctuations can be achieved. In this regard, the experimental conditions for which the adsorption kinetic parameters can be obtained using the advanced CMBR analysis are limited. An overview of applicable experimental conditions of Zϕ and z/u in the CFBR method will be presented later in Figure 5.
Decay curves simulated with the CFBR model for Bi = 30, Zϕ = 1.1 (bold line), and Zϕ = 1.3 (dotted line) conditions. CFBR: circulate-type fixed-bed reactor.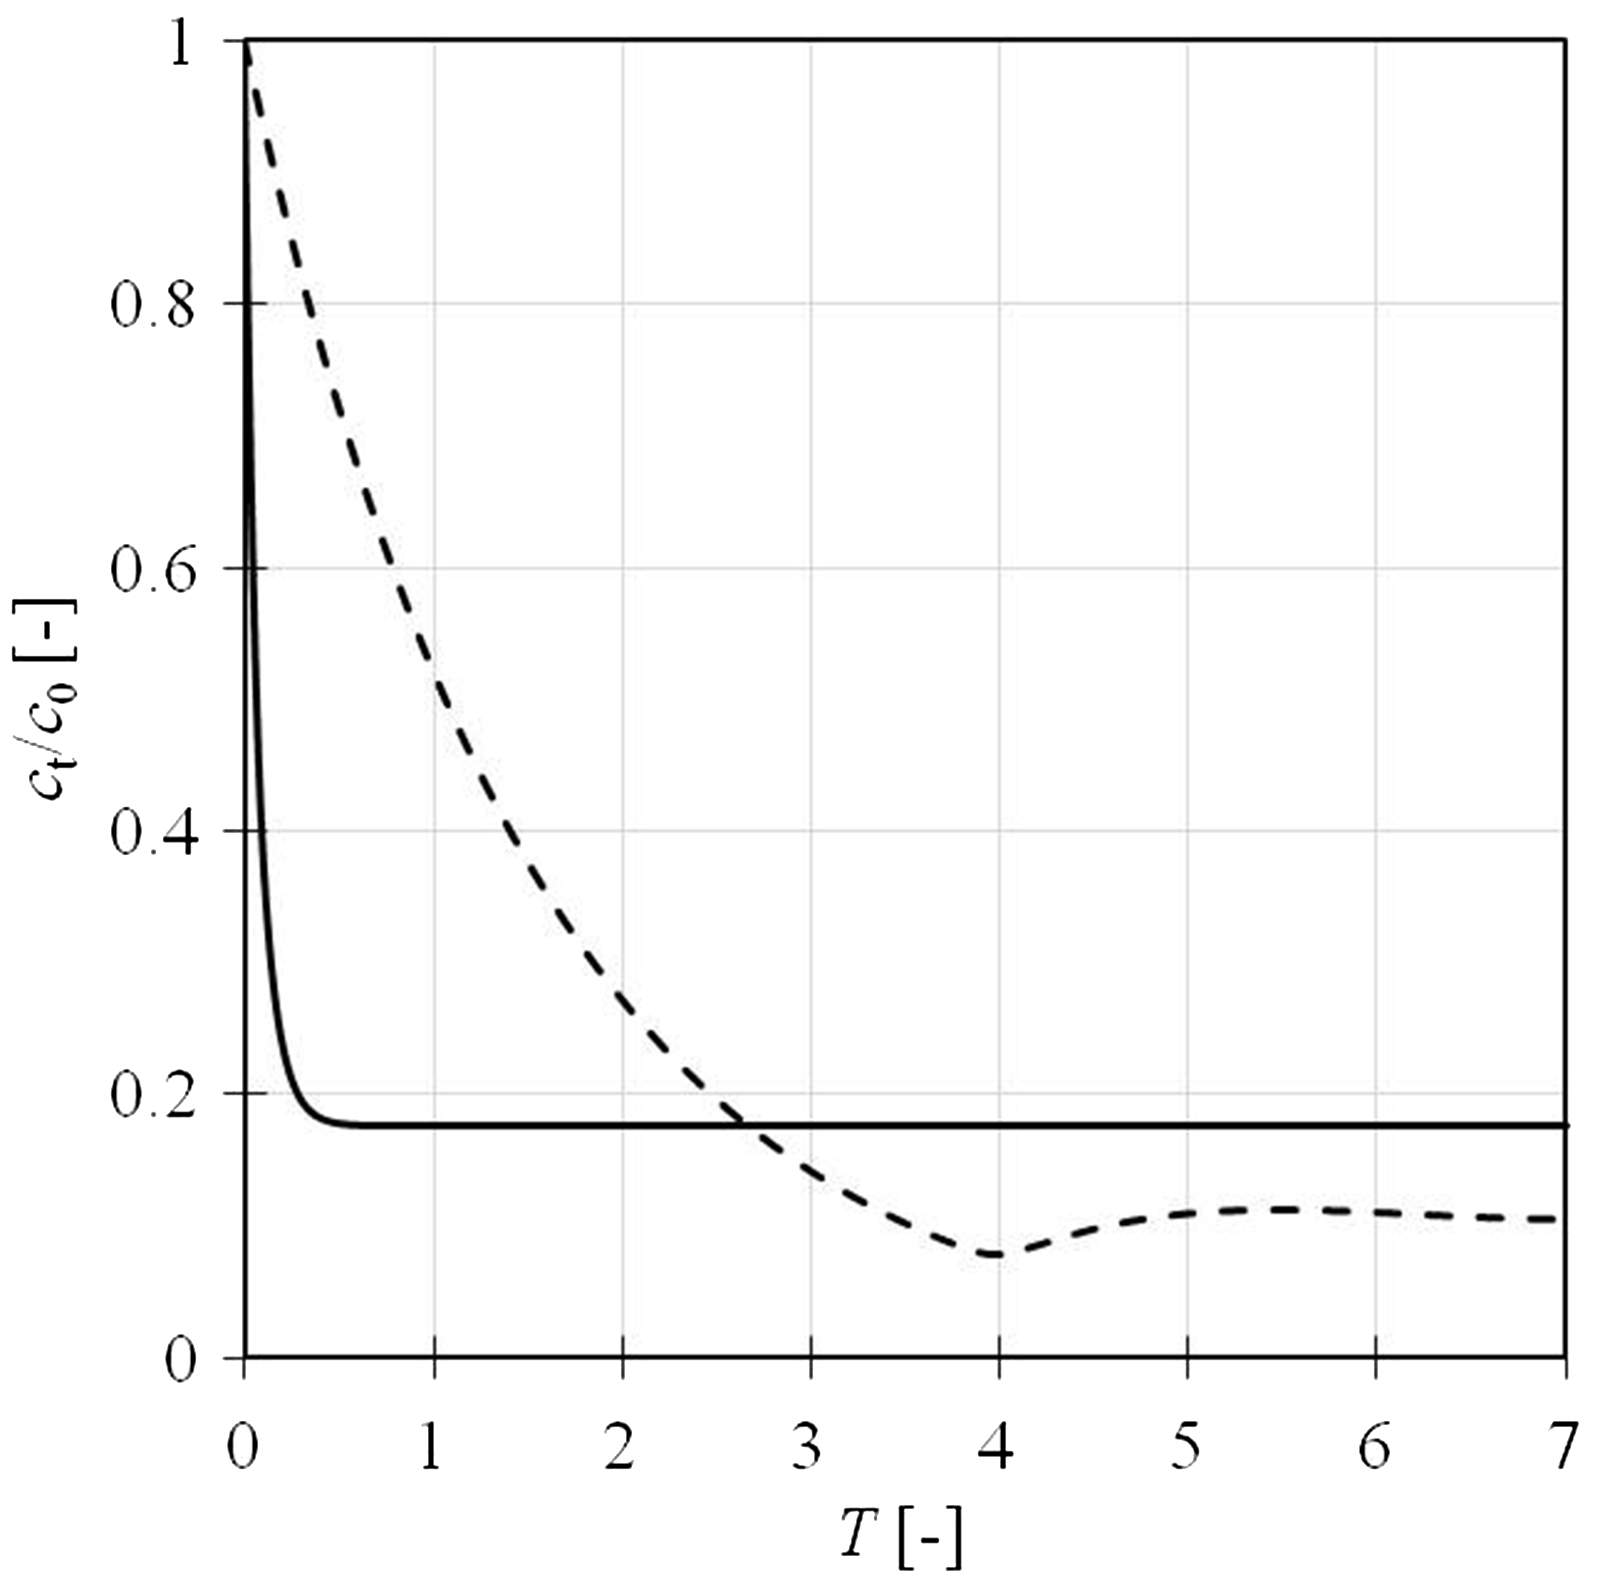
Applicable experimental conditions in the CFBR method
When the CMBR analysis is applied to the concentration decay data obtained in the CFBR, experimental conditions, such as Zϕ and z/u, should be selected to avoid rebound and fluctuations in the concentration decay curves as described above. The concentrations at rebound peak and its rising edge in the decay curves are defined as cmax and cmin, respectively. The ratio cmin/cmax indicates the relative height of the rebound peak and this was used as an index of the presence of rebound peak. The ratio cmin/cmax < 1 indicates the presence of rebound peak in the decay curve. If there is no rebound peak in the decay curve, then cmin/cmax = 1. Figure 4(a) shows the cmin/cmax values obtained from the simulated concentration decay curves in the CFBR model as functions of Zϕ and z/u. The figure shows that the rebound peak occurred at small z/u conditions and increasing values of Zϕ. The cmin/cmax value decreased significantly when Zϕ and z/u increased, which indicates the presence of large rebound peak. A large decrease can be observed for Zϕ > 0.9 and at larger z/u conditions. The rebound in the decay curve occurred due to breakthrough from the packed bed and recycling of effluent in the CFBR. After the breakthrough, the concentration decay in the reservoir vessel (concentration of feed solution) stagnates and then feed from the reservoir vessel causes fluctuation of the decay curve. Therefore, rebound in the decay curve occurred in the system with larger Zϕ and z/u the system attaining adsorption equilibrium and small reservoir. Figure 4(b) shows the dependency of the bed height Z on cmin/cmax values when Zϕ = 1.1. It can be easily deduced that shorter packed beds are suitable for the application of advanced CMBR analysis. On the premise of the application of advanced CMBR analysis to the decay data obtained in the CFBR, the experimental conditions that satisfy cmin/cmax = 1 should be used.
(a) Contact time dependency of the rebound peak cmin/cmax for the series of solid–liquid ratio and (b) bed height Z dependency of cmin/cmax in the case of Zϕ = 1.11. Relationship between T0.2/T0.8 and Bi number obtained from the decay curve simulation in the CFBR method. CFBR: circulate-type fixed-bed reactor.

Determination of Ds and kF using the CFBR test method
Figure 5 shows relationship between T0.2/T0.8 and Bi number obtained by the simulation of concentration decay curve in CFBR. The profile in Figure 5 is almost same with the profile shown in Figure 2(b). This is reasonable because the basic equations are almost same between the test methods. The relationship between T0.2/T0.8 and Bi number is almost similar between the CMBR and CFBR methods within the experimental conditions of CFBR method to which the CMBR analysis is applicable.
The CFBR concentration decay data were experimentally obtained at the various experimental conditions listed in Table 2. Details of the experimental procedure are reported elsewhere (Fujiki et al., submitted). From the experimental concentration decay curves in the CFBR, the T0.2/T0.8 value in each experimental condition shown in Table 2 was obtained and was used to determine the Bi number using the relation shown in Figure 5. Then, using the Bi numbers determined from Figure 5, the Ds and kF were determined based on profile refitting of the experimental concentration decay curves with the simulated decay curves by adjusting the kinetic parameters as shown in Figure 6(a) and (b). When Ds has been determined, the kF was determined tentatively from the Bi and Ds using equation (8). The kF was also adjusted by profile fitting using Ds to verify the reliability of its value. The Ds and kF values determined from the series of CFBR experiments are listed in Table 3. It can be observed from the trend in Table 3 that similar Ds values were obtained for various Bi number conditions while the kF values depend on the z/u. Relatively slow contact of fluid with the adsorbent particles (large z/u) resulted in increased film resistance.
(a) Refitting of the decay curve with adjusting Ds and (b) refitting of the decay curve with adjusting kF using the determined Bi number. List of the obtained Ds, kF, and Bi number for the series of conditions of the CFBR test. CFBR: circulate-type fixed-bed reactor.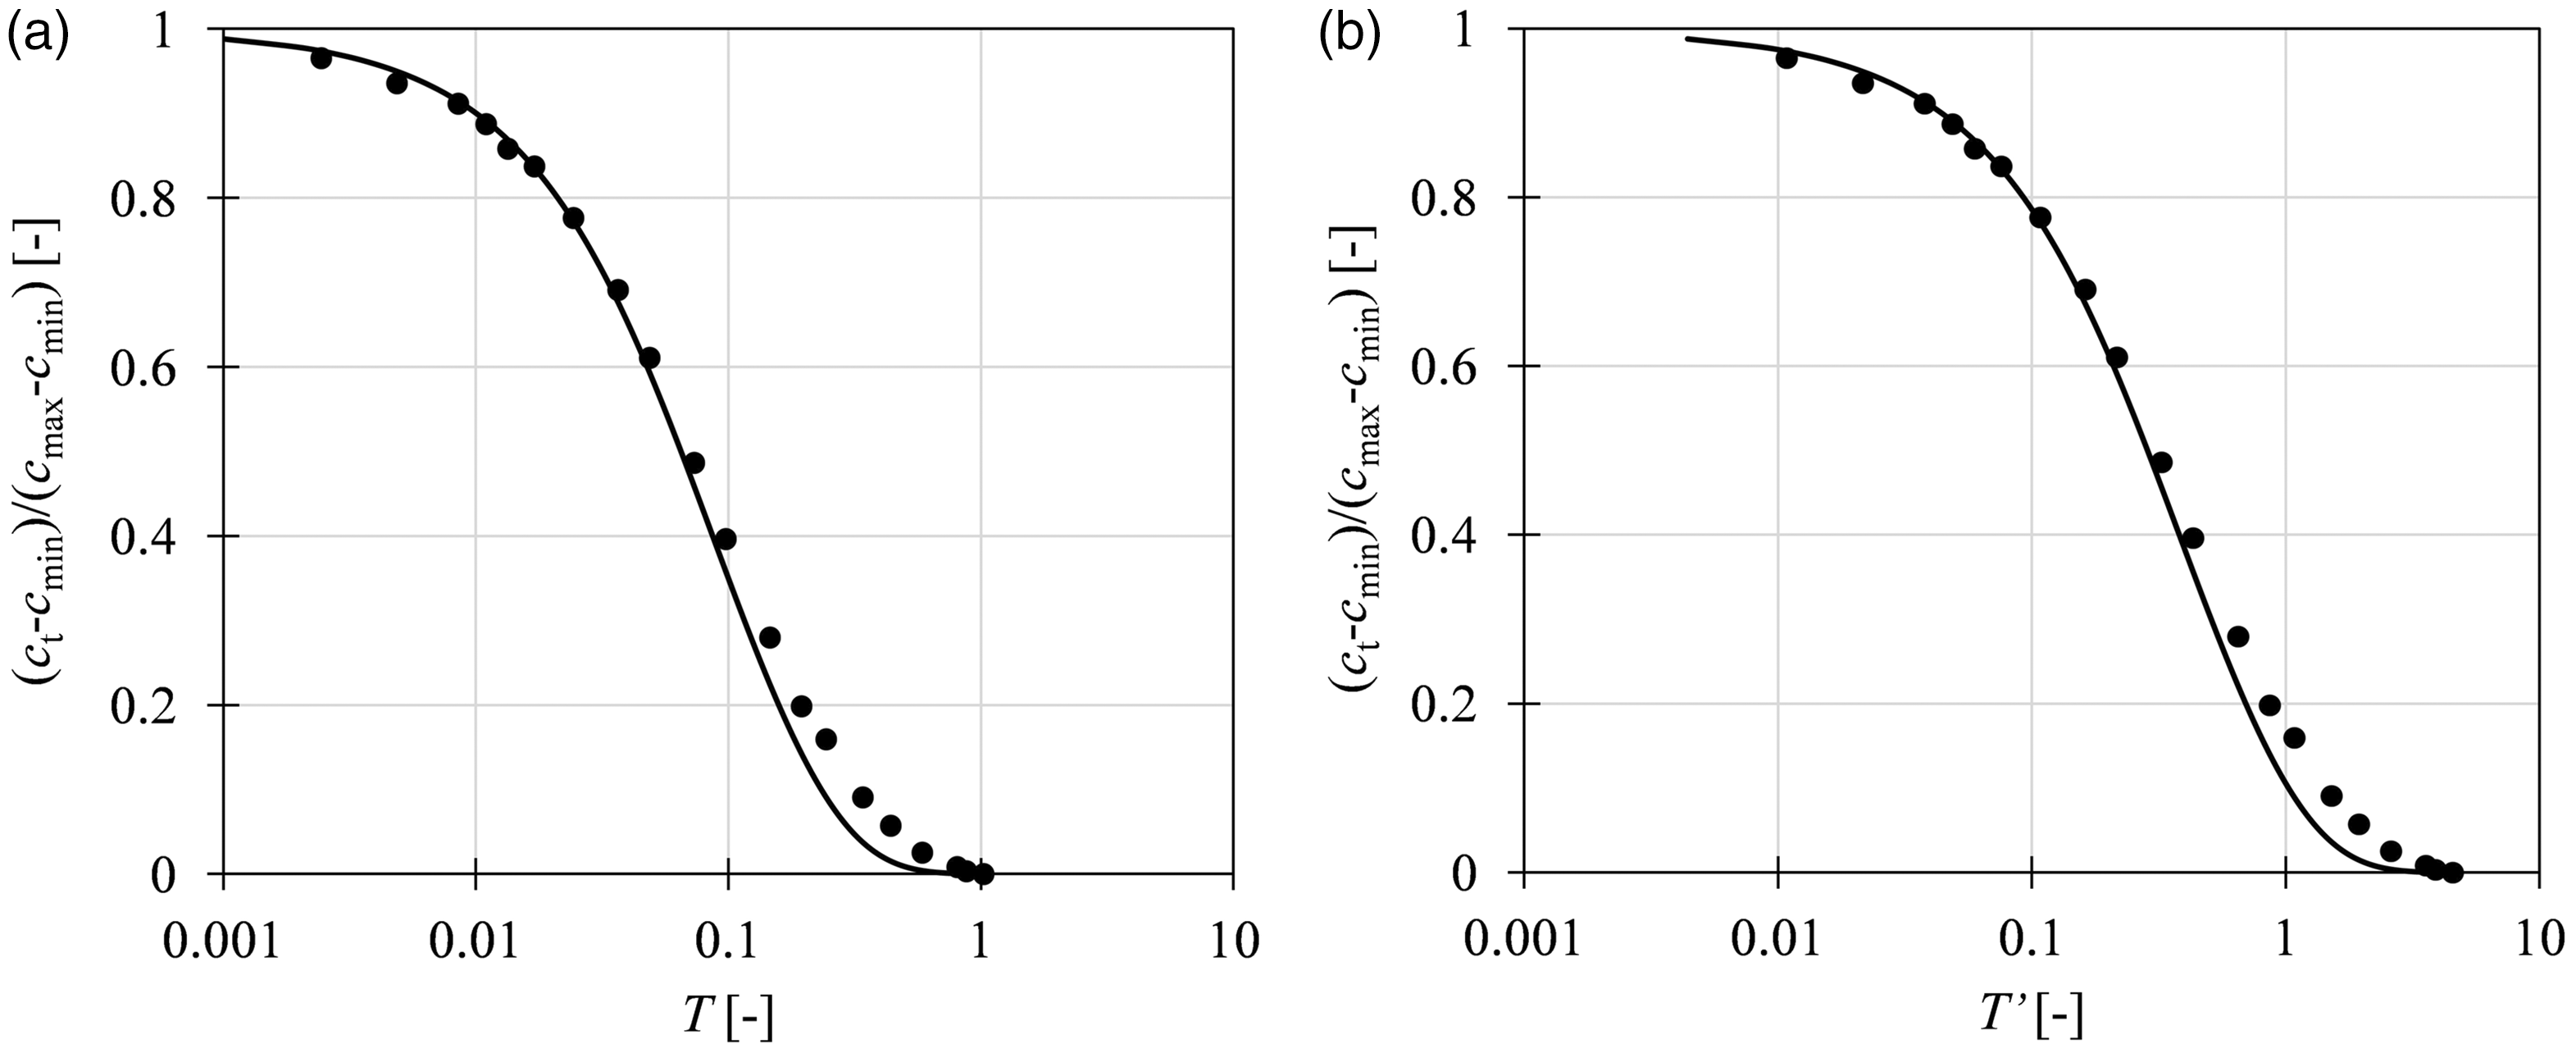

Figure 7 shows the obtained kF values as a function of the Reynolds number, Re, of the system from which the kF values were obtained. The trend was compared with the Wakao–Funazukuri’s empirical correlation equation of kF (Wakao and Funazkri, 1978). The results verify the reliability of the parameters that were determined in this study using advanced CMBR analysis. Therefore, the application of advanced CMBR analysis was successfully demonstrated. This analytical method simply provides reliable Ds and kF values from a single concentration decay data obtained from the CFBR test method when the condition for data acquisition in the CFBR is properly selected as demonstrated in this study.
Dependence of kF on Re number in the CFBR method. CFBR: circulate-type fixed-bed reactor.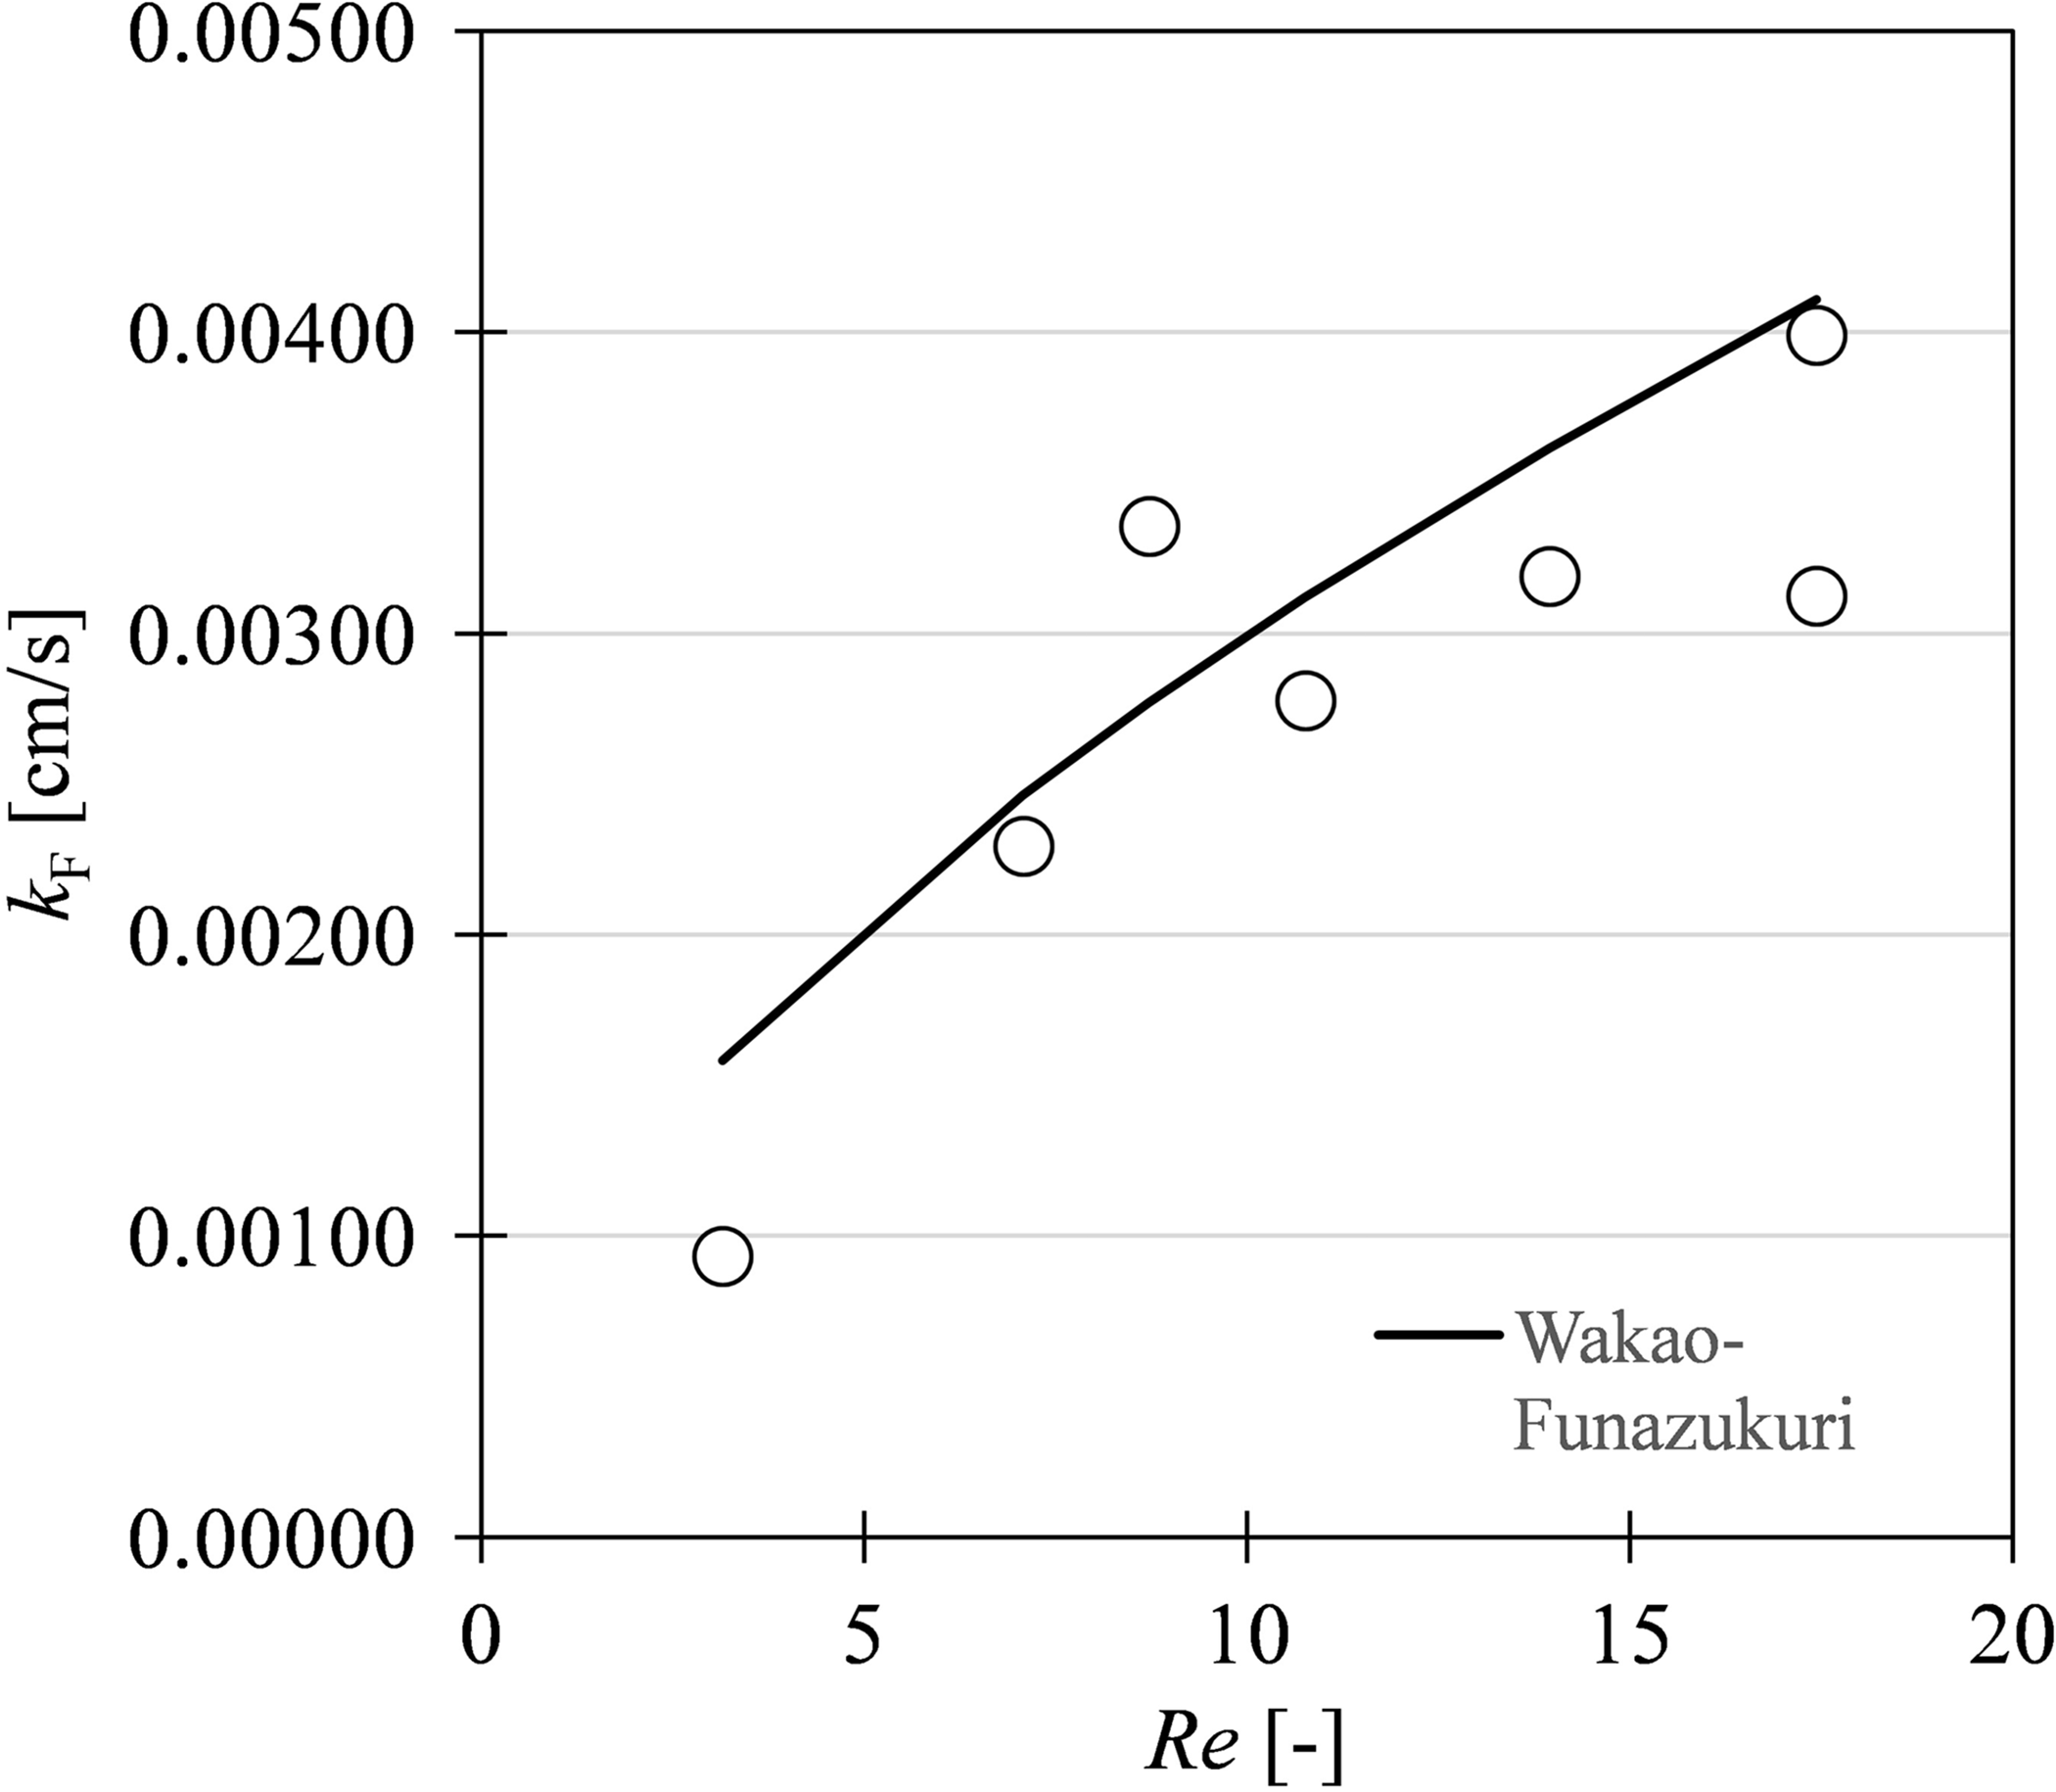
Conclusion
In this study, the applicability of advanced CMBR analysis method to decay data obtained in CFBR test method was investigated. The experimental conditions of the CFBR method for which the advanced CMBR analysis can be applied was examined based on the pattern of concentration decay curves obtained from the simulation of phenomenological rigorous model of the CFBR. For some limited experimental conditions in the CFBR, the concentration decay behavior was similar to the decay behavior of the CMBR. This method allows a simple and simultaneous determination of Ds and kF values in the CFBR method under experimental conditions that are free from rebound peak in the decay curve. When operations with small contact time z/u and or Zϕ were performed in the CFBR test, the concentration decay curves were similar to the decay curves of the CMBR; therefore, the simple data analysis developed for the CMBR test was carried out fairly well. The experimental conditions suitable for data acquisition in the CFBR were verified.
Footnotes
Declaration of Conflicting Interests
The author(s) declared no potential conflicts of interest with respect to the research, authorship, and/or publication of this article.
Funding
The author(s) received no financial support for the research, authorship, and/or publication of this article.