
Abstract
Impact of nanosized oxide particles of titania (titanium dioxide, rutile) and silica–titania fumed compound on structure relaxation processes in nanocomposites of an orthophtalic unsaturated styrene cross-linked polyester resin has been experimentally studied using the thermal desorption mass spectroscopy, the dielectric spectroscopy, and the positron annihilation lifetime spectroscopy. All the nanocomposites showed unmonotonous variations in the thermal resistance, the dielectric permittivity and losses, and the annihilation rates for both positrons and ortho-positronium atoms with increasing filler’s loading. The nanoparticle-loading effects can be explained on the assumption that the oxide particles embedded into a cross-linked polyester resin induce rearrangements in its structure. Several mechanisms of particle–polymer interface interaction compete simultaneously and thus promote the alterations in molecular structure of the nanocomposites. The mechanisms may include both chemical and electrostatic fastening of polyester chains and styrene cross-links to the active surface sites, the destruction of the styrene cross-links, and redistribution of electron density in polymers. The features of the loading effects observed in the different nanocomposites can be ascribed to distinctions in both of active surface sites and intrinsic dielectric properties of the filling oxide particles.
Keywords
Introduction
Unsaturated polyester resins (UPR) are the most widely used thermosetting matrices for reinforced plastics because of their versatile features such as relatively inexpensive and excellent process ability as well as good mechanical properties, high thermal stability, heat resistance, low water absorption, and high chemical resistance. Also, it is remarkable that the thermosets of a three-dimensional (3D) networked structure (such as epoxy resins or polyester resins) are more usable at higher temperatures than thermoplastics because they are more harder, more chemically inert, and have a better dimensional stability owing to a high degree of cross-linking between the polymer chains (Pascault et al., 2002; Penczek et al., 2005; Ramesh et al., 2012; Rubinstein and Colby, 2003).
In recent years, nanosized oxides such as SiO2 (Dittanet and Pearson, 2012; Hsieh et al., 2010; Jang et al., 2012; Wang and Chen, 2012; Kochetov et al., 2012), titanium dioxide (TiO2) (Carballeira and Haupert, 2010; Katayama et al., 2013; Khodaparast and Ounaies, 2013; Nayak et al., 2013; Singha and Thomas, 2008), Al2O3 (Amendola et al, 2011; Hsieh et al., 2010; Kyritsis et al., 2011; Singha and Thomas, 2008; Wang and Chen, 2012; Yu et al., 2012; Kochetov et al., 2012), and ZnO (Singha and Thomas, 2009; Yang, 2013) have been employed as fillers to improve electric, mechanic, or thermal properties of epoxy resins. However, the question of how to optimize tailoring the performance of polymer nanocomposites for specific needs still remains one of the most important challenges for applied polymer sciences.
Therefore, many efforts have been made by various research teams to ascertain physical reasons underlying the improvements observed. As a result, it has been established that a polymer–particle interface and related interfacial interactions in the nanocomposites have a significant impact on the nanocomposite’s overall properties due to its role in transferring both the mechanical stress and the charge carriers across a polymer matrix and a filler (Zaman et al., 2011). Also, a formation of so-called interphase regions (IPRs) surrounding the particles embedded into a polymer matrix has been predicted by theoretical simulations and experimentally proved (Klonos et al., 2010; Odegard et al., 2005). Both the molecular structure and the charge density within IPRs have been turned out to be distinct from those inherent to the neat polymer (Klonos et al., 2012). These alterations are caused not only by fastening macromolecular chains to active surface centers (ASCs) of nanoparticles but also by forming double electric layer (DEL) around ones (Jancar et al., 2010) where the chains are electrically and particle’s ordered (Lewis, 2004, 2005).
Also, it has been established that the effects induced by oxide nanofillers on the physical properties of both thermoplast and thermoset polymer matrices are dependent on both a level of filler’s loading (Gorelov et al., 2015; Jeziórska et al., 2012; Nayak et al., 2013; Kochetov et al., 2012) and size (Sun et al., 2011). Non-monotonous loading dependences of the dielectric permittivity and the dielectric loss factor have been observed in epoxy nanocomposites filled with SiO2 (Hsieh et al., 2010), TiO2 (Singha and Thomas, 2008), Al2O3 (Wang and Chen, 2012), ZnO (Singha and Thomas, 2009), or MgO (Hsieh et al., 2010) and also in SiO2-filled nanocomposites of a styrene cross-linked UPR (Gorelov et al., 2012). These facts mentioned above testify to a very complex picture of interactions that occur among oxide nanoparticles and polymer macromolecules during the curing process.
On the whole, the data available on studying 3D network polymer oxide nanocomposites show that there is only a little progress in our awareness of both particle–macromolecule interactions and structure–property relations in such materials. In particular, mechanism of lowering the permittivity in oxide–polyester resin nanocomposites remains unclear.
Therefore, the present investigation has been undertaken with the aim to study variations in dielectric and thermal properties and underlying alterations in inner structure of a styrene cross-linked UPR caused by nanosized oxides of a relatively low number of ASCs.
Materials and methods
Polyester resin
The UPR matrix was commercially available orthophtalic styrene cross-linked UPR “Polymal 1094 AWTP-1” (Poland). A detailed description of the molecular structure of polyester resins can be found elsewhere (Penczek et al., 2005).
The molecular structure of a typical orthophtalic UPR is shown in Figure 1 (Bharatkumar, 2009). Here, the linear moieties, [..]
n
, are an elementary unit of the polyester macromolecular chain, whereas [..]
m
represents a styrene cross-link bridging the two polyester chains together. The number of styrene molecules in the link, m, may vary as 1–3 (Evans et al., 1996). Essentially is that not every elementary polyester unit is linked. The unlinked polyester units are of the form—[OCO–CH2–CH2–COO–CH–CH–O]. The unlinked units are randomly distributed along a polyester chain. Some physical parameters of a typical orthophtalic UPR are the molecular weight—1800, flexural strength ≈71 MPa, the heat deformation temperature (Martens) −332 K (Penczek et al., 2005). A detailed description of polyester resins chemistry can be found elsewhere (Penczek et al., 2005).
Molecular structure of a typical UPR (Bharatkumar, 2009): the moieties [..]
n
are elementary units of the polyester macromolecular chains; the moiety [..]
m
represents a styrene cross-link. UPR: unsaturated polyester resin.
Fillers
The nanofillers were TiO2 of the rutile form (Ukraine) of a low number of active surface sites and the silica–titania fumed oxide (ТАS-40, Ukraine) hereafter referred to as silica–titania fumed compound (STO). The titania particles were characterized with averaged diameter 2Rf ∼ 25 nm and specific surface area Sf ∼ 10 m2/g, whereas STO particles were of 2Rf ∼ 40 nm and of Sf ∼ 40 m2/g. For both the fillers, their mass loading Cf,m in the composites varied as 0.5, 1.5, 3.0, and 5.0%.
The values of Sf have been determined by measuring the amount of physically adsorbed nitrogen gas from adsorption–desorption isotherms according to the standard Brunauer, Emmett, and Teller (BET) method (Gregg and Sing, 1982).
The active centers of titania surface are ТіO (oxygen vacancies with the Ti3+ ions) as either Ті → O bonds or O → Ti bonds (Jang et al., 2012) and ТіOH (Gun'ko et al., 1998). There are same centers on the surface of STO, and also SiO, silanol groups Si–OH, siloxane groups Si–O–Si, and Ti–O–Si bridges (Gunko et al., 2007).
Nanocomposites
To remove organic contaminants and adsorbed water from the surface, the oxide powders underwent thermal treatment at about 400 K during 1.5 hours in air before preparing the nanocomposites.
Nanocomposites for studies have been obtained from UPR solutions mixed manually with the filler into mixtures of a homogeneous consistency. The polymerization of the mixtures occurred at a room temperature during 72 hours.
Experimental methods
A content of volatile products emanated from the samples during its thermal decomposition has been determined using a programmable thermal desorption technique combined with a mass spectroscopic detection via the single-pole mass-analyzer МХ 7304А. The measurement details can be found elsewhere (Pokrovsky, 2000; Gorelov et al., 2015).
Complex permittivity data, ɛ*, can be represented by its real, ɛ1, and imaginary, ɛ2, parts by the relation ɛ* = ɛ1 + i ɛ2. ɛ1 is related to an electric field’s energy stored within the sample, whereas ɛ2, or ɛ” reflects the dissipation or loss of the energy within the medium. Complex permittivity is a large-scale property of dielectrics without specifying the electrical behavior on the atomic scale. The knowledge about complex permittivity for different frequencies or temperatures can help in identifying, for example, microscopic fluctuations of molecular dipoles, the propagation of mobile charge carriers, the separation of charges at interfaces which give rise to an additional (so-called Maxwell-Wagner) polarization. A more comprehensive description of the analysis of dielectric parameters can be found elsewhere (Kremer and Schönhals, 2003).
For dielectric measurements, the samples were prepared in the form of square plates with a surface area of 7 ċ 10−5 m2 and a thickness of 1 ċ 10−3 m. Thin layers of silver were deposited onto both sides of the samples, serving as the electrodes. The samples were subjected to drying process in a vacuum chamber under a nitrogen atmosphere at a temperature of 333 K for one hour. The vacuum chamber pressure was 10−3 Pa. The samples were stored in a desiccator until the dielectric measurements were performed. Dielectric properties were obtained by measuring complex permittivity ɛ* = ɛ1 + i ɛ2 using the computer-controlled “Hioki 3532-50 LCR impedance meter”. Measurements of both the dielectric permittivity ɛ1 and the dielectric loss factor ɛ2 were carried out within the temperature range 77−350 K at fixed frequencies f ranged from 500 Hz to 5.0 MHz. The temperature was changed at the rate of 0.5 K/min and was controlled to an accuracy of ±0.1 K.
A fast timing configuration of the “Ortec” positron lifetime system was used. “Scionix” modules equipped with two XP 2020Q photomultiplier tubes optically coupled with cylindrical BaF2 scintillators (Ø 25.4, 10 mm) operated as the detectors of two different γ-quanta attributed to start (1274.6 keV) and stop (511.0 keV) of a positron lifetime. A 0.4 MBq 22Na positron source sealed by kapton foils (12.5 µm in thickness) was placed between two plates of the same sample (2 mm in thickness). The time resolution of the device was determined to be 240 ps from the prompt curve of a 60Co source.
The analyses of the positron annihilation were performed using LT program (Kansy, 1996) without constrains imposed on lifetime components.
Results and discussion
Thermal decomposition data
Volatile m/z-products of the thermal decomposition and the thermal decomposition curves
Alterations in molecular structure of the polyester resins induced by embedding the nanoparticles manifest themselves in the thermal decomposition spectra. The thermal decomposition mass spectra and the thermal decomposition curves (TD-curves) for some fragments of both the polyester macromolecular chains and the styrene cross-links obtained from the UPR and its oxide nanocomposites have been analyzed elsewhere (Gorelov et al., 2012; Gorelov et al., 2015) and the atomic content of the fragments has been specified.
These studies evidenced that oxide nanoparticles embedded into polyester resins result in breaking the polyester chains and styrene cross-links. Indeed, the TD-curves for decomposition moieties related to both the polyester chains and the styrene cross-links contain, besides a main peak, a low-temperature (LT) shoulder too. The main peak is due to decomposition of basic 3D molecular structure, whereas the latter is caused by emanation of both the unlinked chain and styrene cross-links segments and their fragments unbound to the particles. The unlinked moieties undergo thermal decomposition at relatively LTs Т < 523 K, whereas the decomposition of the polymer bulk 3D network and fragments bound with surface sites of filler particles takes place within the temperature range of 523−823 K.
Next, for both the chain-related and the cross-links-related fragments, their TD-curves vary with increasing the filler loading. The variations include peak’s temperature position, amplitude, width, and LT shoulder’s profile. These variations are different for various fillers and m/z-fragments (m is the mass, z = + 1 is the charge of a fragment) and thus evidence very complex character of interactions between the polyester chains and the styrene cross-links and nanoparticles.
In turn, the indicated alterations in resin’s molecular structure within a nanocomposite are accompanied with correspondent variations in structure-related properties such as mechanical and dielectric ones. In particular, it may be expected that variations in the numbers of the unlinked polyester moieties (NP) and the styrene cross-links (NS) will result in variations in magnitude of the dielectric losses related to the β-relaxation process. To determine what moieties can play as the β-relaxators, a quantitative analysis of the TD-curves has been carried out.
Loading effects in decomposition of the unlinked moieties
The normalized loading dependences of the decomposition output N related to some moieties of the unlinked polyester chains and the styrene cross-links are shown in Figure 2(a) (TiO2) and (b) (STO). For these plots, the output N(Cf,m) for every moiety of a given m/z-value has been estimated as the area S beneath its LT shoulder of the correspondent TD-curve I(Cf,m,T):
Loading dependences for the normalized number (N(Cf,m)/N(0)) of the unlinked m/z—fragments desorbed thermally from the polyester resin nanocomposites filled with TiO2 (a) and STO (b). STO: silica–titania fumed compound.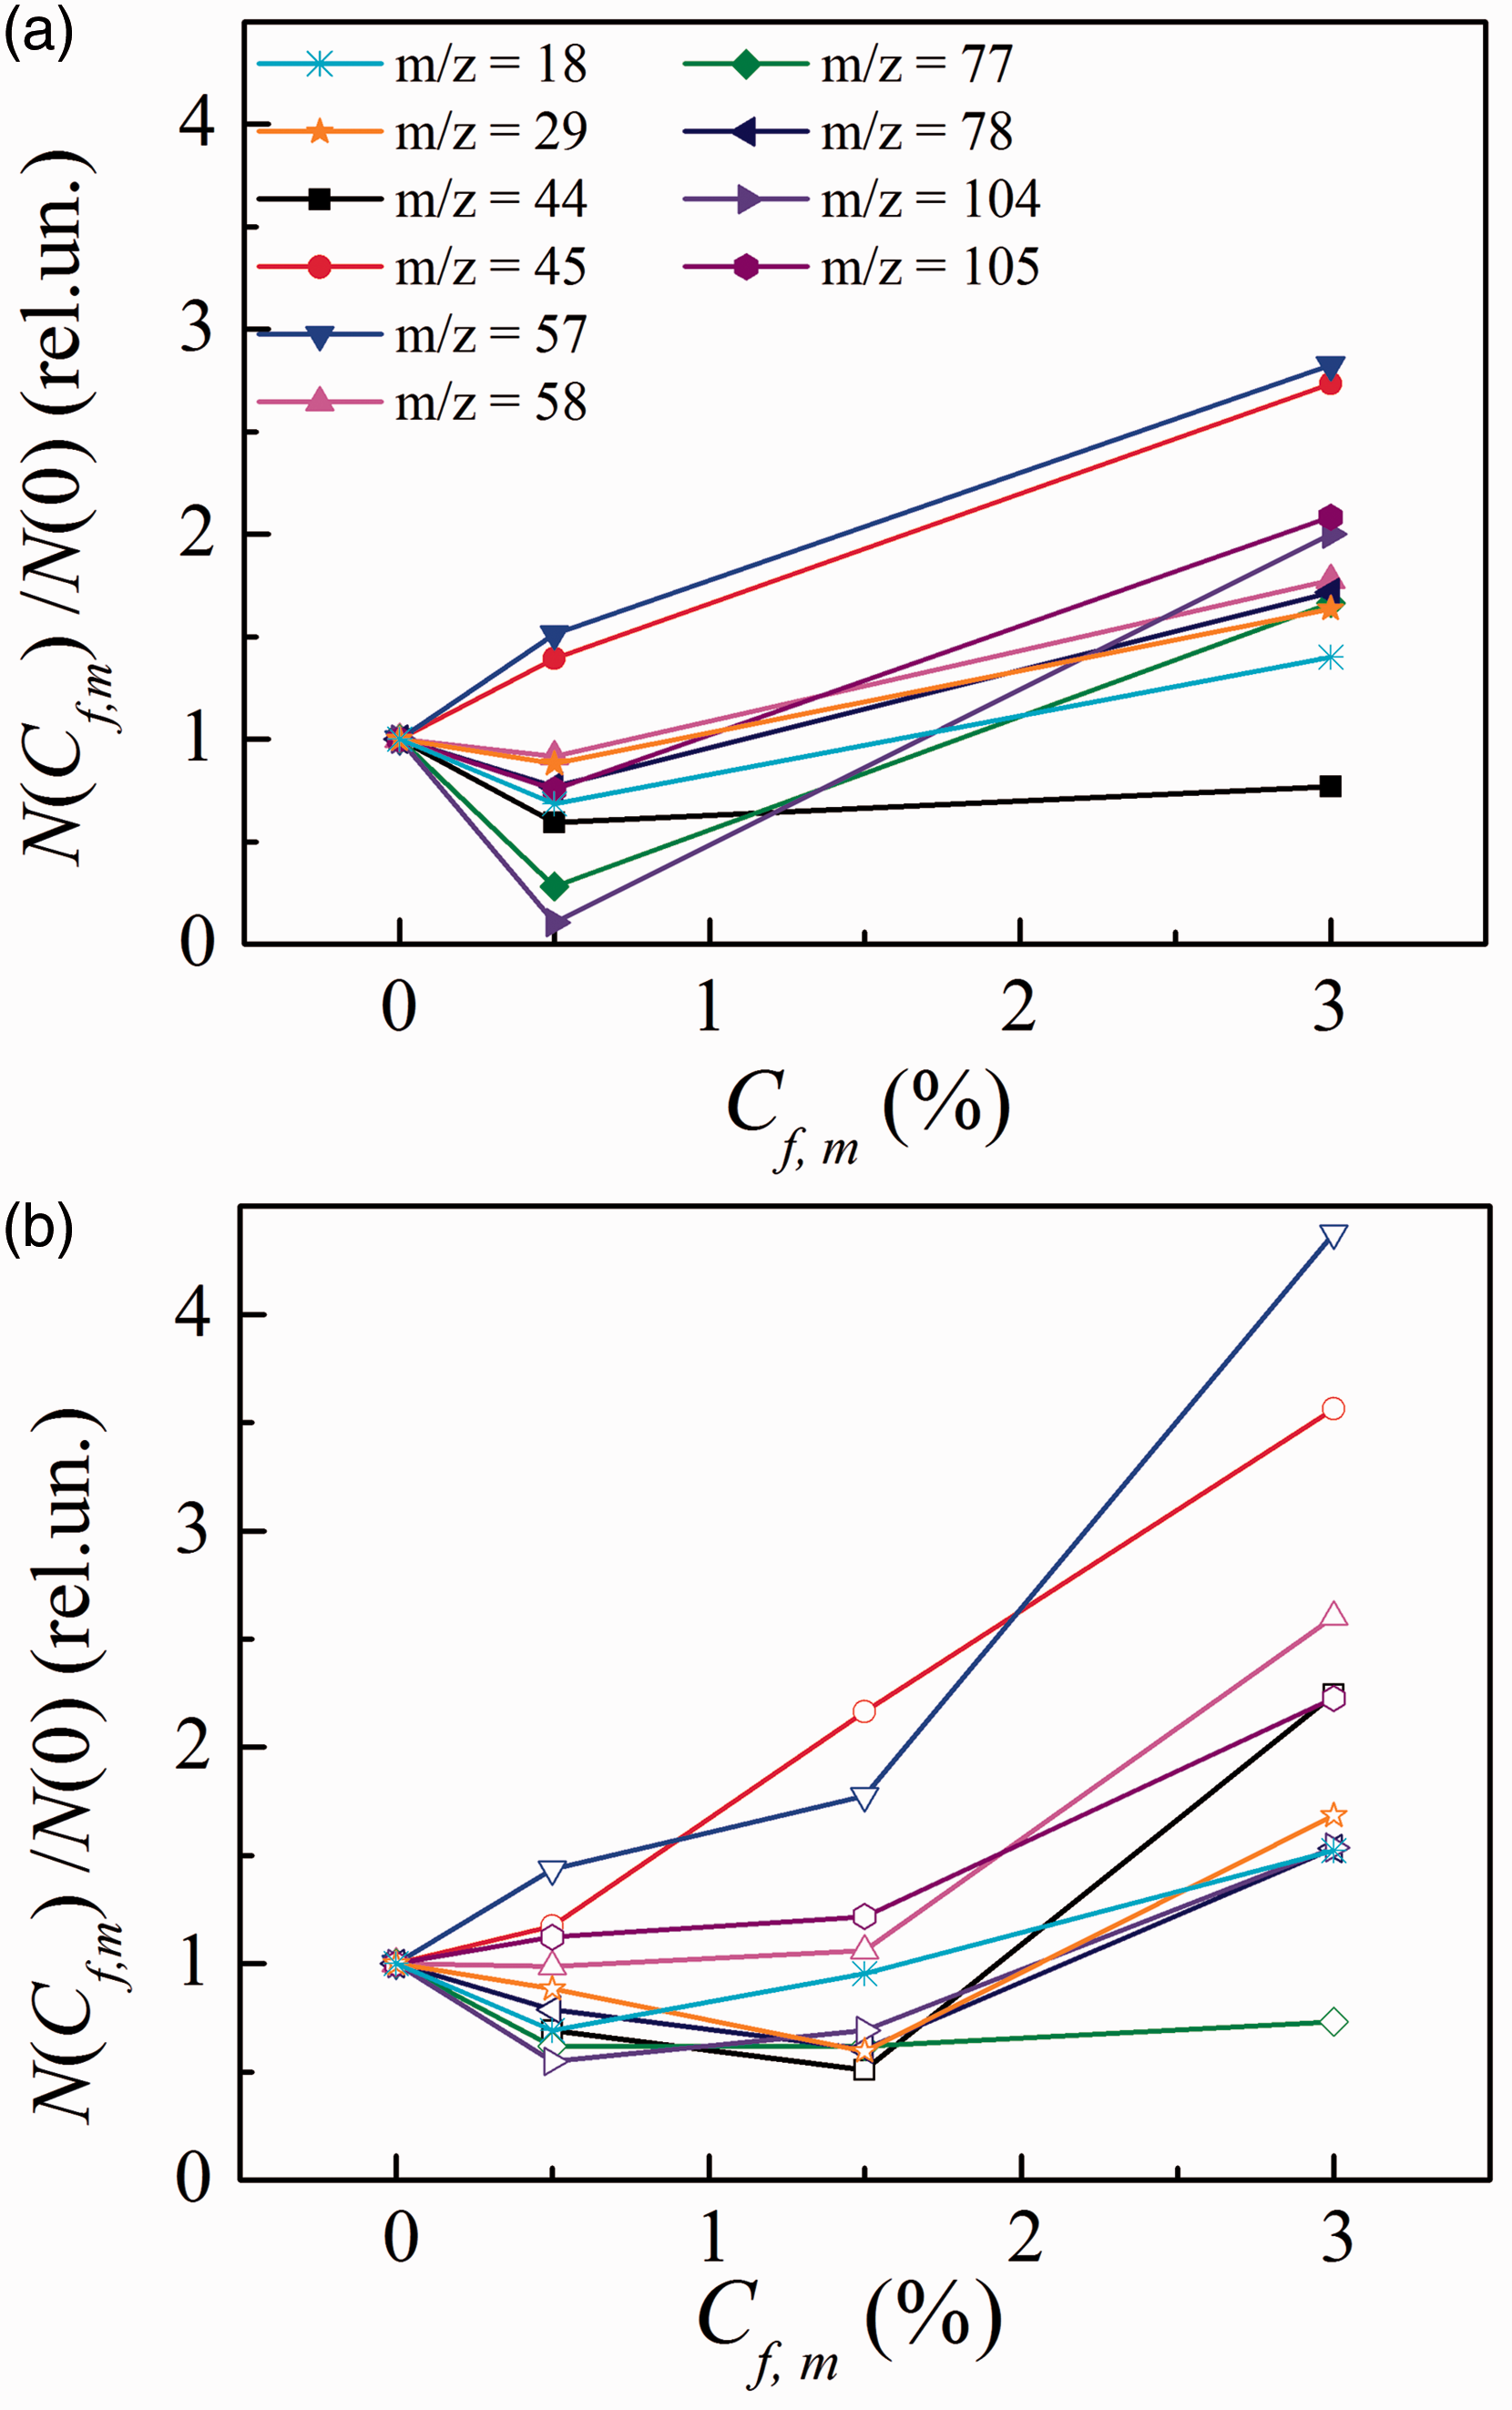

The results presented in Figure 2 can be summarized as follows:
The output of ester and styrene, the principle molecular fragments of polyester resin in the TiO2-filled nanocomposites, varies in the following way: COOH (m/z = 45) and COOCH (57)-moieties grow droningly with increasing Cf,m; COOCH2 (58) and C6H6 (78)-moieties vary poorly for Cf,m ≤ 0.5% and then grow; for the COO (44)-moiety falls at Cf,m ≤ 0.5% and remains unchanged with increasing Cf,m; water molecules (18), COH (29), C6H5 (77), C6H5CHCH2 (104), and C6H5CHCH3 (105)-moieties decrease for Cf,m ≤ 0.5% and then increase with increasing Cf,m.
In the STO-filled nanocomposites, the output varies in the following way: COOH (45)-and COOCH (57)-moieties grow droningly with increasing Cf,m; COOCH2 (58) and C6H5CHCH3 (105)-moieties vary poorly for Cf,m ≤ 1.5% and then grow; C6H5-rings fall for Cf,m ≤ 0.5% and remain unchanged with increasing Cf,m; H2O (18) and C6H5CHCH2 (104)-moiety reduces for Cf,m ≤ 0.5% and then grows; COH (29), COO (44), and C6H6 (78)-moieties decrease for Cf,m ≤ 1.5% and increase when Cf,m rises.
It should be pointed out that COH-moieties (m/z = 29) may arise in both the nanocomposites due to the interaction of the lateral CO-groups (m/z = 28) of the polyester chains (Figure 1) either with water molecules (18) adsorbed in the polymer bulk or with hydroxyl groups located on a surface of nanoparticles. As can be seen from Figure 2, both water molecules and COH-moieties reveal similar behavior with loading in both the nanocomposites.
On the whole, the thermal decomposition data evidence that oxide nanoparticles cause the non-monotonous effect on the output of the desorption products. At low loadings (when Cf,m ≤ 3%), the number of unlinked molecular segments diminishes (as a rule), whereas it increases essentially with increasing loading.
The dielectric permittivity and losses
It may be expected that alterations in the macromolecular structure of polyester resins induced by embedding nanoparticles will impact not only on its thermal resistivity but also on its dielectric properties. Namely, the variation in the number of unlinked segments will determine variations in both the real (dielectric response) and imaginary (β- and α-relaxations) parts of the complex dielectric permittivity of the nanocomposites.
Temperature dependences
When measuring temperature dependences of the relative dielectric permittivity ɛ1(Cf,m,f,T) and the dielectric loss factor ɛ2(Cf,m,f,T) for the unfilled resin (Cf,m = 0) and its nanocomposites, the upper boundary of the temperature range (350 K) was chosen to maintenance structural integrity of samples under testing. Measurements evidence that desorption of water contained within the resin begins at temperatures above 350 K and it followed by subsequent thermal decomposition of the resin as temperature increases further.
As an example, Figure 3 shows temperature dependences of the relative dielectric permittivity ɛ1(Cf,m,f,T) measured at 1, 10, and 100 kHz for both the unfilled resin (Cf,m = 0, the curves marked by “1”) and its nanocomposites (the curves “2”–“5”) filled with TiO2 (Figure 3(a)) or STO particles (Figure 3(b)).
The temperature dependences of the relative dielectric permittivity ɛ1 measured at 1, 10, and 100 kHz for the unfilled UPR (the curves “1”) and its TiO2 (a) and STO nanocomposites (b) with filler mass loadings Cf,m = 0.5 (“2”), 1.5 (“3”), 3.0 (“4”), and 5.0% (“5”). STO: silica–titania fumed compound; UPR: unsaturated polyester resin.
As to the dielectric properties of the unfilled resin, the following four features should be noted.
First, UPR is a polar amorphous 3D network polymer where the polyester chains are cross-linked by styrene bridges that can include either the single styrene molecule or several ones. The frequency–temperature behavior of the complex dielectric permittivity ɛ (0, f, T) of the resin is governed by two basic polarization mechanisms, namely the orientation and the hopping ones over the frequency–temperature range under study (Kao, 2004; Blythe, 1979).
Orientation vibrations and hopping of the lateral fragments of the polyester chains (such as the CO-moieties) and the lateral fragments of the styrene cross-links (namely, the benzene rings C6H5) can contribute in ɛ1(0, f, T) and ɛ2(0, f, T) at higher frequencies (f ∼ 104–106 Hz), whereas the longer (i.e. heavier) segments give their dielectric response via hopping mechanism at lower frequencies (f ≤ 103 Hz). Moreover, there are many unlinked chain fragments, styrene molecules and the uncoupled styrene bridges within the polymer body. All of them are the dipole moieties and thus can also contribute into the dielectric properties at correspondent frequencies.
Second, it can be seen from Figure 3 that the permittivity ɛ1 increases monotonously with increasing temperature. The permittivity increases slowly as temperature increases at T ≤ 300 K. Here, the increasing in ɛ1 is related to more heavy fragments of both the polyester chains and the styrene bridges contribution with increasing temperature.
In the temperature range of 300–320 K, ɛ1(0, f, T)-plots show the fracture which shifts toward higher temperatures with increasing f. At higher temperatures (Т > 300 K), the derivative dɛ1/dT increases—the lower frequency the higher dɛ1/dT. Such the behavior is pronounced at 1 kHz where the heavy segments contribute to the dielectric response. The fracture specifies that the response mechanism is replaced by another one which is seemed to be related to the α-relaxation or so-called “the dipole-segmental relaxation” which is ascribed to the glass transition of the whole 3D macromolecular network (Khodaparast and Ounaies, 2013). The replace in the response mechanism is pronounced in both the unfilled resin and the 5%-filled STO nanocomposite.
Third, at a fixed temperature, ɛ1 decreases as frequency increases. For example, the ɛ1(0, f, T)-values measured at T = 300 K are equal to 4.04 (at f = 500 Hz), 4.0 (at f = 1 kHz), 3.9 (10 kHz), 3.77 (100 kHz), 3.74 (at f = 1 MHz), and 3.45 (at f = 5 MHz), and are close to the values given in the literature (Boenig, 1964).
Finally, the fourth aspect is related to the characteristic α- and β-relaxation processes contributing to the dielectric losses within definite frequency intervals. It is known that the major dielectric relaxation in UPRs is the high temperature α-relaxation or so-called “the dipole-segmental relaxation” which is ascribed to the glass transition of the whole 3D macromolecular network (Yang Y-Sh, 1996; Sanchez et al., 2000), whereas the minor relaxation is the LT β-relaxation which is also known as “the dipole-group relaxation” (Kao, 2004) and originates mainly from local vibration modes of the lateral atomic groups in both the polyester chains (CO) and the styrene cross-links (C6H5), and of the groups terminated the unlinked chains or the uncoupled cross-links as CH3.
Therefore, a rapid increase in ɛ1(0, f, T) occurring at T > 325 K is a manifestation of the α-relaxation process. Also, the ɛ2(0, f, T) dependences testify to the presence not only the α-relaxation process but also the β-relaxation. The broad β peak with a weak maximum is clearly visible on the curve 1 of Figure 4(a) and (b)at T < 300 K, whereas steep and intensive increasing of ɛ2 at T > 300 K corresponds to the LT wing of the α peak. It should be noted that the β peaks appear at frequencies ranged from 1 to 100 kHz.
Temperature dependences of the dielectric loss factor ɛ2 measured at f = 10 kHz for the unfilled resin (the curves “1”) and its nanocomposites filled with 0.5 (2), 1.5 (3), 3 (4) and 5% (5) TiO2 (a) or STO particles (b). STO: silica–titania fumed compound.
As to the nanocomposites, from Figures 3 to 6, one can see that regardless of filler’s type, both ɛ1(Cf,m,T)-plots and ɛ2(Cf,m,T)-plots for the nanocomposites are similar to those for the unfilled resin. At other frequencies, we see the same behavior of ɛ (Cf,m,T) = ɛ1(Cf,m,T) − j·ɛ2(Cf,m,T).
Frequency dependences of the relative dielectric permittivity ɛ1 measured within the frequency range of 500 Hz–5 MHz at T = 300 K for the unfilled resin (the curves “1”) and its nanocomposites (the curves “2”–“5”) filled with TiO2 (а) or STO (b). The values of Cf,m are equal to: 0.5 (curves “2”), 1.5 (curves “3”), 3.0 (curves “4”), and 5.0% (curves “5”). STO: silica–titania fumed compound. Loading dependences of the relative dielectric permittivity ɛ1 for the nanocomposites filled with TiO2 (a and c) or STO (b and d) which are obtained from correspondent frequency dependences measured at T = 300 K (a and b) and T = 90 K (c and d) at fixed frequencies of 1 kHz (points “1”), 10 kHz (points “2”), 100 kHz (points “3”), 1 MHz (points “4”), and 5 MHz (points “5”). STO: silica–titania fumed compound.

Frequency dependences
Figure 5 shows the frequency dependences of ɛ1 measured within the frequency range of 500 Hz–5 MHz at T = 300 K for the unfilled resin (the curve “1”) and its nanocomposites (the curves “2”–“5”) filled with TiO2 (a) or STO (b).
The following three features one can see from Figure 5.
First, the dielectric permittivity of the unfilled resin and its nanocomposites exhibits a general trend to decrease with increasing frequency regardless of the Cf,m-values. Such the frequency behavior of ɛ1 agrees with the theoretical concept that partial contributions related to the hopping and the orientation polarization processes decrease with increasing frequency (Kao, 2004). In our case, the longer dipole moieties from the polyester chains and styrene cross-links both being more heavy and, hence, of a lower mobility will fall out of the polarization at higher frequencies.
Second, there are two steps on the curves—at low (1–5 kHz) and high (1–5 MHz) frequencies. The first step can be ascribed to the β-relaxation process, whereas the second may be related to interference between the α- and β-relaxations.
It is also seen from Figure 5 that regardless of filler type, frequency dependences of the permittivity for nanocomposites are similar to the unfilled resin. Unlike the polyester resin, frequency dependences of the dielectric properties of the oxide fillers are governed by both the ionic polarization and relaxation processes which depend poorly on temperature and do not depend on frequency within the frequency region studied exhibiting the resonant effects at very high frequencies (namely, above 109 Hz).
Therefore, it is not surprising that the frequency dependences of ɛ1 for the nanocomposites resemble one for the unfilled resin. Also, in Figure 5, one can see no distinctions in the frequency dependences of ɛ1 between TiO2 and STO fillers.
Third, the frequency dependences of ɛ1, as well as the temperature ones, show unmonotonous loading effects, namely of lowering the nanocomposite’s dielectric permittivity with increasing filler loading.
Loading dependences of ɛ1
The most interesting effect observed in nanocomposite’s dielectric properties (Figures 3 and 5) is that filling the resin with the oxide fillers results in a lowering of its permittivity ɛ1. The magnitude of this effect Δɛ1(Cf,m) = ɛ1(0) – ɛ1(Cf,m) depends on filler’s type and the loading level. An unusualness of this effect consists in that the permittivity of the TiO2 itself exceeds the permittivity of the neat resin, whereas the permittivity of STO is close to the latter. From the other hand, the well-known mixing formulas predict a monotonous increasing (decreasing) in ɛ1 of mixtures with increasing Cf,m provided that filler’s permittivity is higher (lower) than the permittivity of a polymer matrix (Shihvola, 1999). Since the mixing formulas do not take into account impact of the particle–chain interactions on the polarization processes in a nanocomposite material and thus cannot be adopted for describing the unmonotonous loading dependences observed.
Figure 6 shows the loading dependences of ɛ1 for the nanocomposites filled with TiO2 (a and c) or STO (b and d), which are obtained from correspondent frequency dependences measured at T = 300 K (a,b) or 90 K (c and d) and at fixed frequencies. It can be seen from Figure 6 that embedding of nanosized oxide fillers (at Cf,m ≤ 5%) into the resin results in a non-monotonous lowering of its dielectric permittivity. It is remarkable that the effect takes place over the entire range of measuring frequencies (500 Hz–5 MHz) and temperatures (77–350 K), i.e. the behavior of ɛ1 versus Cf,m did not depend on temperature and frequency.
An independence of ɛ1(Cf,m) on frequency evidences on the physical mechanism that makes the permittivity of the nanocomposites vary with loading remains the same both in the high-frequency region where the dielectric response is caused by vibration of light molecular fragments of the polyester chains and styrene cross-links and in the low-frequency region (f ≤ 103 Hz) where the response is related to vibration of heavy molecular moieties of polymer chains and styrene molecules. The water molecules, if any, should be considered to be active contributors in ɛ1 over the whole frequency region studied (Fontanella et al., 2009).
However, the loading dependences of ɛ1 are different for both the fillers. At T = 300 K, one see the following variations in ɛ1. For the TiO2-filled nanocomposites, the ɛ1(Cf,m) dependences are non-monotonous: they reach their minimal values at Cf,m = 1.5%, then increase with increasing the loading for 1.5% < Cf,m ≤ 3.0%, and remain constant for 3.0% < Cf,m ≤ 5.0 % (Figure 6(a)). For the STO-filled nanocomposites, the ɛ1-values lower within the ranges of 0 < Cf,m ≤ 0.5% and 1.5 < Cf,m ≤ 3.0% but remain unchanged within the ranges of 0.5 < Cf,m ≤ 1.5% and 3.0 < Cf,m ≤ 5.0% (Figure 6(b)).
When comparing the loading dependences measured at 300 and 90 K, it is seen that they are similar for Cf,m ≤ 3%. An decreasing in ɛ1 with loading that is visible at 90 K for 3 < Cf,m ≤ 5% is likely to be caused by a weakening in interaction among neighboring dipoles.
For both the nanocomposites at low loadings (Cf,m ≤ 1.5%), lowering ɛ1(Cf,m) takes place along with decreasing the amount of unlinked chains and violations of the polymeric structure, i.e. when stabilization of the network structure occurs and mobility of the chains increases. As the thermal decomposition data show (Figure 2), the main unlinked moieties which number decreases are styrene itself (C6H5CHCH2) and styrene-related fragments, namely C6H5 and C6H6. The number of the unlinked COH- and COO- moieties diminishes too, whereas the number of COOCH2-moieties remains the same and amount of moieties related to the complex ether (namely, COOH and COOCH) increases slightly.
For both the nanocomposites, resin’s structure is violated, amount of unlinked chains increases, and the thermal resistivity weakens in the composition range of 1.5 < Cf,m ≤ 3.0%. As a result, ɛ1 increases for the TiO2 nanocomposites (the oxide of a small quantity of active surface sites), whereas it decreases further for the STO nanocomposites (the oxide of numerous active surface sites). For the first case, increasing ɛ1 is related to decreasing in mobility of the structural fragments and the growth of structural violations in the macromolecule. The process goes out on a saturation as Cf,m increases and the dielectric response does not vary. For the second case (STO), increasing Cf,m is accompanied with increasing amount of active surface sites, which are able to fasten both the unlinked polyester chains and styrene cross-links and their fragments. Therefore, along with violations in the polymeric structure, another process of a local structural stabilization is seemed to occur in the vicinity of STO nanoparticles. Lowering ɛ1 within the range of 1.5 < Cf,m ≤ 3.0% means that the effect of local stabilization dominates over the process of breaking the macromolecule structure. When the loading increases up to 5% both the processes are likely to compensate each other and the dielectric response does not vary.
On the whole, the effect of non-monotonous loading dependence of nanocomposite’s permittivity on filler loading is due to resin’s molecular structure alterations arising as a result of competition between two processes. The first is breaking the polyester chains and styrene cross-links. The second process is chain–particle interaction. The interaction of the UPR with oxide nanoparticles occurs via the following mechanisms: (1) chemical binding of atoms terminated polyester chains and free styrene bridges; (2) hydrogen binding of both hydrogen and oxygen atoms of polyester chains with hydroxyl groups and water molecules adsorbed on surface of the nanoparticles. It should be mentioned that a chemical activity of STO surface is much higher as compared to those of ruthile-TiO2, since the first contains both Bronsted and Lewis sites, whereas the latter contains the Lewis sites only. Moreover, the number of sites for STO surface is much higher as compared to TiO2. As a consequence, interaction of macromolecular chains with the rutile nanoparticles occurs mainly via hydrogen binding between the oxygens (–O–) in the backbone of UPR and the surface hydroxyls (–OH) of the particles (Richardson, 1977). From the other hand, for both the nanocomposites, the third interaction process is possible too; namely, via fastening the moieties, via hydrogen binding on the surface, or within the DELs in the vicinity of particles. Thus, with increasing the loading, the fastening process (TiO2) is developed slowly as compared to the rate of the binding (STO), due to low number of active surface sites per unit volume in a case of TiO2.
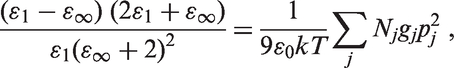
The loading dependences of the dielectric permittivity can also be explained in a frame of classical polarization theory. Indeed, using the Frohlich model for a polar polymer nanocomposite containing several kinds (j) of dipoles which are characterized by the dipole moments pj and the number Nj (per unit volume), the static dielectric permittivity ɛ1 of the material can be expressed by the following equation (Kao, 2004):
To ascertain what moieties can contribute into the dielectric losses, the temperature–frequency behavior of the dielectric loss factor in the nanocomposites has been analyzed.
Beta-relaxation analysis
As an example, Figure 4 shows typical temperature dependences of the dielectric loss factor ɛ2(Cf,m,f,T) measured at f = 5 kHz for both the unfilled resin and its nanocomposites filled with TiO2 (a) or STO (b).
From Figure 4 one can see, that regardless of filler’s type, ɛ2(Cf,m,T)-dependences for both the nanocomposites are similar to those for the unfilled resin. This similarity specifies on an insignificant contribution of intrinsic energy dissipation mechanisms of the oxide fillers to the resulting losses in both the nanocomposites.
The ɛ2(Cf,m,T)-dependences testify to the presence not only the α-relaxation process but also the β-relaxation process in both the unfilled resin and its TiO2 and STO nanocomposites. The broad β peaks with weak maxima are clearly visible in Figure 4 at T < 300 K, whereas steep and intensive increasing of ɛ2 at T > 320 K corresponds to the LT wing of the α peak.
The fact that the peaks related to the beta losses (β peaks) manifest themselves within a very broad frequency range (1–100 kHz) testifies that a lot of dipole relaxators of different values of activation energy are present within both the neat resin and its nanocomposites. As it was mentioned above, the lateral atomic groups in the polyester chains and the unlinked polyester chain segments can play as β-relaxators. Indeed, the magnitude of dielectric permittivity depends on the number of lateral atomic groups in the undisturbed polyester chains and styrene cross-links and also on the number of molecular fragments fastened on the active surface sites of nanoparticles. Besides, the behavior of ɛ1(Cf,m) indicates that unlinked chain segments and styrene cross-links mainly influence on the mobility of dipole moieties.
Other possible contributors may be the disrupted styrene cross-links (the dipole moment of the styrene molecule is equal to 0.13 D (Sinha et al., 1990). The quantity of both the unlinked polyester chain segments and the styrene cross-links in the nanocomposites can vary with the loading due to breaking the cross-links.
One more β-relaxator may be water. Despite of the filling oxides had been annealed before preparing the samples and the samples themselves underwent the heat treatment before measuring the permittivity, the trace water molecules still remain in the nanocomposites. The water-related relaxation known as S-relaxation have recently been observed at mesoporous silica–polystyrene interface in the frequency region of 1–105 Hz (Fontanella et al., 2009) and at TiO2–polydimethylsiloxane interfaces in the kHz-frequency region (Klonos et al., 2016). This relaxation is attributed to water molecules bound at surface hydroxyl groups.
It is essentially that the S-relaxation manifest itself at very high loadings, namely Cf,m ∼ 90%. In our experiments, the nanocomposites contain 18–180 times as low nanoparticles as it is needed to observe distinctly the S-relaxation in ɛ2(T)-plots. However, in a case of polyester resins, oxygen atoms of polyester chains can interact with the surface OH-groups and to form dipolar COH-moieties playing also as β-relaxators.
The quantitative parameters to characterize β-relaxation are the β peak temperature position (Tβ) and the relative β peak magnitude Δɛ2β = ɛ2(Tβ) −ɛ20(Tβ) where ɛ20 is the dielectric loss factor when assuming the β-relaxation is absent.
Figure 7 shows Cf,m-family of Δɛ2β(lg f)-plots for the unfilled resin and its nanocomposites filled with TiO2 (Figure 7(a)) and STO (Figure 7(b)). For the unfilled resin, the dependence of Δɛ2β versus frequency reveals a maximum at about 5 kHz. For both the nanocomposites, β-regions become wider than that of the unfilled resin due to broadening it in the low-frequency region and are split into some narrow peaks. It is the evidence that nanoparticles promote increasing quantity of polar moieties (dipoles) involved in the β-relaxation process. This fact means that both “light” (more movable) and “heavy” dipoles (less movable) appear simultaneously within the resin matrix. Breeding the dipoles may be caused by an appearance of other dipoles after fastening disrupted polyester chains and styrene cross-links on the surface sites of filler nanoparticles.
Frequency dependences of the beta peak amplitude Δɛ2β for the unfilled resin (points “1”) and its nanocomposites (points “2”−“5”) filled with TiO2 (а) or STO (b). The values of Cf,m are equal to: 0.5 (points “2”), 1.5 (points “3”), 3.0 (points “4”), and 5.0 (points “5”). STO: silica–titania fumed compound.
It is possible to notice certain distinctions in frequency dependences of beta peaks amplitudes between the two nanocomposites presented in Figure 7.
For the TiO2 nanocomposites, the amplitudes are maximal at about 5 and 20 kHz on the condition of Cf,m ≤ 3%. Here, the low-frequency peak specifies on considerable molecular mass of the correspondent relaxing dipole moieties, whereas the high-frequency peak is due to lighter dipoles. The benzene ring residues (C6H5) may be the heavy β-dipoles and CO may play as the light ones. At Cf,m = 5%, when the number of unlinked chains and the bridges increases the high-frequency peak shifts toward 100 kHz indicating on more light β-dipoles (e.g. CH3).
For the STO nanocomposites, where the ruptures of the polyester chains and styrene cross-links under filling are accompanied with binding of the unlinked segments to active surface sites the other candidates for β-dipoles should be considered. The heavy β-dipoles corresponding to the 5 kHz-peak exhibit themselves at any loading. At Cf,m ≥ 3% the new low-frequency peak located at 1 kHz appears. Probably, it is related to the styrene molecules (C8H8) fastened on the surface sites of STO nanoparticles. The lighter dipoles corresponding to β peaks located at 20, 50, and 100 kHz contribute at loadings of 1.5, 0.5 and 5, and 3%, respectively. Appearance of such dipoles is caused by fastening of light macromolecule fragments with the surface sites. Besides, the rise of contribution of newly formed dipoles in the ɛ2β magnitude for Cf,m ≥ 3% results in a reduction of ɛ1 for the STO nanocomposites (Figure 7(b)).
Figure 8 shows f-family of loading dependences of the beta peak amplitude Δɛ2β for the nanocomposites filled with TiO2 (a) and STO (b).
Loading dependences of the beta peak amplitude Δɛ2β for the unfilled resin and its nanocomposites filled with TiO2 (a) and STO (b) for frequencies 1 (curves “1”), 5 (curves “2”), 10 (curves “3”), 50 (curves “4”) and 100 kHz (curves “5”). STO: silica–titania fumed compound.
When comparing Δɛ2β(Cf,m) presented in Figure 8 with plots N(Cf,m)/N(0) shown in Figure 2, the atomic composition of the moieties involved into the β-relaxation can be predicted.
For the TiO2 nanocomposites, the comparison shows that the Δɛ2 β (Cf,m) dependences correlate with N(Cf,m)/N(0) for water molecules, COH-moieties, and styrene fragments, namely C6H5-, C6H6- and C6H5CHCH2-, C6H5CHCH3-. The correlations take place over the entire range of frequencies where the β-relaxation occurs. Thus, these moieties may be expected to give the main contribution in the dielectric permittivity and losses.
For the STO nanocomposites, a correlation between Δɛ2 β (Cf,m) and N(Cf,m)/N(0) is visible for water molecules, polyester fragment COO, and styrene fragments, namely C6H6 and C6H5CHCH2. By the other words, water and these three moieties may give the main contribution in the dielectric permittivity.
In STO nanocomposites, the nature of dipoles contributing into the β-relaxation process varies with both frequency and filler loading: at frequencies f ≥ 10 kHz, the COO- and C6H6-fragments can play as β-relaxators over the entire loading interval, and C6H5CHCH2-moieties can play as β-relaxators at f = 1 kHz.
The positron annihilation lifetime spectroscopy
It has been established using the positron annihilation lifetime technique that three channels of positron annihilation of the lifetimes τ1, τ2, and τ3 take place in both the unfilled resin and their nanocomposites. The lifetimes correspond to the self-annihilation of the para-positronium atoms and the annihilation of the free positrons (τ1), to the annihilation of positrons trapped by the structural defects (τ2), and to the pick-off annihilation of the ortho-positronium atoms (τ3). Due to the dominant interpretation of the lifetime components in the literature (Schrader, 1988), the ortho-positronium atoms diffuse into the so-called free volume areas (FVA), which are characterized by the lowered electronic density (ρe) and then annihilate there. It should be noted that in amorphous glassy polymers (like polyester resins), FVA can be located in either ordered or disordered regions (Engbrecht et al., 2013; Jean et al., 2013). For the unfilled resin, the lifetimes are τ10 = 204.1 ps, τ20 = 471 ps, and τ30 = 1914 ps.
Figure 9 shows the loading dependences for the normalized positron annihilation lifetimes τi/τi0 for the polyester resin nanocomposites filled with TiO2 (Figure 9(a)) and STO (Figure 9(b)). All the lifetimes vary unmonotonously with the increasing loading in both the nanocomposites, namely, they are minimal at Cf,m = 1.5%.
Loading dependences for the normalized positron annihilation lifetimes τi/τi0 for the polyester resin nanocomposites filled with TiO2 (a) and STO (b). STO: silica–titania fumed compound.
It is known that τ1 is inversely proportional to the electron density in FVA, whereas τ2 and τ3 are inversely proportional to electron densities on walls of the potential holes trapping positron and ortho-positronium (Brandt et al., 1960). Therefore, the dependencies of τi versus Cf,m testify to non-monotonous increasing in electron density in the particle-trapping defects.
Thus, regardless of both the number of active surface sites and a character of interaction mechanism between polymer chains and the particle surface, an alteration of the 3D polymer structure promoted with oxide nanoparticles is accompanied with non-monotonous increasing in the electronic density within the nanosized structural defects in resin’s bulk.
Conclusions
The thermal decomposition data show that nanosized oxide fillers (namely, titania (rutile) and STO) result in alterations in the molecular structure of the styrene cross-linked polyester resin. The alterations consist of breaking the styrene cross-links and appearing both the unlinked polyester chain segments and the free styrene links. Both the moieties manifest themselves as the LT shoulders on the correspondent thermal decomposition curves.
The dielectric spectroscopy data show that filling the resin with nanosized oxide fillers causes its dielectric permittivity to decrease over the entire ranges of frequencies (500 Hz–5 MHz) and temperatures (77–350 K). The magnitude of this effect depends on filler’s type and its loading level, but does actually not depend on both frequency and temperature. For the TiO2 nanocomposites, the permittivity decreases for Cf,m ≤ 1.5% and then increases, whereas for the STO nanocomposites, the permittivity decreases for Cf,m ≤ 5.0%. For both the fillers, the relation ɛ1(5.0%) ≤ ɛ1(3.0%) < ɛ1(0%) takes place over the entire frequency range studied.
The effect of decreasing at low loadings (when Cf,m ≤ 1.5%) is due to lowering a number of unlinked polyester and styrene moieties in the resin’s bulk and a restriction in vibrating mobility of both the polyester chains and styrene cross-links. The restriction may be related to chemical or hydrogen binding the chains and cross-links to active surface sites of the nanoparticles.
At higher loadings (Cf,m > 1.5%), the process of breaking the polyester macromolecular chains and styrene cross-links enhances in both the nanocomposites. Simultaneously, the process of particle–chains binding goes on; however, it is more strong in STO nanocomposites due to more active surface of STO as compared to those of rutile TiO2. As a consequence, the first process dominates in TiO2 nanocomposites and the permittivity increases, whereas both the processes compensate each other in STO nanocomposites and the permittivity varies slightly. From the other hand, water molecules bound at nanocomposite’s bulk may also contribute in increasing the permittivity at higher loadings.
The oxide nanoparticles impact on the β-relaxation process in the polyester resin over the frequency region of 500 Hz–100 kHz. The magnitude of the β-losses depends non-monotonously on loading for both the nanocomposites. An effect of splitting the β-peaks testifies on alterations occurring in both quantity and content of the relaxing dipoles. It is suggested that the main contribution in the β-losses may come from the polyester chain fragments such as COOH and COOCH2 together with the styrene cross-link fragments such as C6H5, C6H6, C6H5CHCH2, and C6H5CHCH3, and also from water molecules located at oxide–resin interfaces.
An non-monotonous character of the loading dependences of the positron annihilation lifetimes shows that the alterations in the nanocomposite’s structure cause variations in the electron density within the nanocomposites. In both the nanocomposites, the positron annihilation lifetime parameter 1/τ3 is of the maximal value at Cf,m = 1.5%. It can be explained by redistribution in the electron density at the resin–particle interfaces and decreasing in the FVA where the ortho-positronium atoms annihilate.
Footnotes
Declaration of Conflicting Interests
The author(s) declared no potential conflicts of interest with respect to the research, authorship, and/or publication of this article.
Funding
The author(s) received no financial support for the research, authorship, and/or publication of this article.