
Abstract
The pore size distribution of activated carbon is conventionally characterized with nitrogen adsorption measurements at 77 K. The adsorption isotherms are commonly analyzed with a nonlocal density functional theory in combination with a mathematical model for the pore size and geometry. While nonlocal density functional theory is significantly more accurate than the Brunauer–Emmett–Teller theory for gas adsorption, its application to materials characterization is mostly based on a mean-field approximation for van der Waals attractions that is only qualitative in comparison with alternative versions of nonlocal density functional theory or molecular simulations. Toward development of a more reliable theoretical procedure, we compare mean-field approximation-nonlocal density functional theory with three recent versions of non-mean-field methods for gas adsorption at conditions corresponding to experiments for porous materials characterization. The potential applicability of different nonlocal density functional theory methods for pore size distribution predictions is evaluated in terms of the theoretical error bound scale analysis. We find that the weight density approximation is the most reliable for predicting the pore size distribution of amorphous porous materials. In addition to accurate isotherm, weight density approximation yields the theoretical error bound scale for pore size distribution prediction nearly 104 times narrower than that corresponding to mean-field approximation. The new theoretical procedure has been used to analyze the pore size distribution of four activated carbon samples and to predict the adsorption capacities of these materials.
Keywords
Introduction
Activated carbons can be classified as one kind of amorphous porous materials playing important roles in diverse engineering applications (Herdes et al., 2016; Nikolaidis et al., 2016; Ray and Roy, 2013). Because the performance of such material is critically dependent on the pore size and specific surface area, structure characterization is essential before their practical use. However, direct nanoscale analysis is difficult for industrial-level applications.
Pore size distribution (PSD) represents one of the simplest and most broadly used benchmark for characterization of amorphous porous materials (Balzer et al., 2015; Palmer et al., 2011; Wang et al., 2015). PSD is commonly acquired from the isotherm fitting method, not only because of its wide detection range, but also for its reliability and low cost. Specifically, PSD is normally determined from fitting N2 adsorption isotherm at 77 K with the assumptions of a given pore geometry and a suitable mathematical model. While the procedure has been standard in materials characterization, controversies often arise in terms of its fidelity to represent the real material structure and properties beyond adsorption isotherms. On the one hand, there is an apparent diffusion problem at low temperature (Madani et al., 2016), which is consequently affected by the working capacity characterization under practical conditions. On the other hand, N2 molecules are more easily subject to reacting with the surface groups than nonpolar adsorbates, leading to the overprediction of the surface area.
PSDs fitted with a particular adsorption isotherm have been successfully utilized to predict gas adsorptions at other conditions (Sitprasert et al., 2011; Sweatman and Quirke, 2005; Wang and Do, 1997). However, the effective PSD may not be able to represent the physical structure of real porous materials. As PSD is typically obtained by solving the adsorption integral equation (AIE) according to the adsorption isotherm, the outcome for such method is primarily affected by the kernel matrix, which is treated as an a priori hypothesis on the heterogeneous extent of the amorphous materials. Besides, an accurate prediction of the excess adsorption in the confined space remains a challenge since the atomistic structure at the surface is poorly understood. For gas adsorption in small pores, conventional thermodynamic methods and even some statistical-mechanics theories like the nonlocal density functional theory (NLDFT) with the mean-field approximation (MFA) are proven unreliable.
NLDFT has been integrated into the standard software for materials characterization. While NLDFT is built upon an exact foundation, i.e. unique determination of an equilibrium system in terms of particle density distributions, its practical use relies on approximations for the thermodynamic nonideality due to intermolecular interactions. For that purpose, the standard procedure employs a nonlocal weighted density approximation for short-range repulsion and the MFA for longer range attraction. To apply similar ideas for materials characterization, there have been a number of modifications. From a theoretical perspective on the one hand, one may modify the excess Helmholtz free energy functional using weight density approximation (WDA) and density expansion method (Liu et al., 2010; Yu, 2009; Zeng et al., 2009). From a mathematical perspective, on the other hand, the geometry of the confined space may be described with pores beyond the traditional slit pore model (Gor et al., 2012; Jagiello and Olivier, 2009; Landers et al., 2013). In this work, we choose the traditional slit pore for PSD applications and focus on the shortcoming of MFA for calculation of the attractive term of the excess Helmholtz free energy functional. For comparison with existing results, we consider three kinds of NLDFT methods including two WDA and one based on density expansion. For quantitative comparison, the theoretical error bound scale (TEBS) of the numerical PSD solution is proposed to rank the performance of four NLDFT methods to represent the PSDs. For further computer-aided screening of amorphous materials, we introduce a more reliable PSD for understanding the solid heterogeneity. The ultimate goal is to calculate the adsorption capacity of well-characterized activated carbon by high accuracy NLDFT.
Method and experimental validation
Samples and isotherm measurement
The experimental isotherms of sample A, B, and C were from Sweatman and Quirke (2001). Sample D from activated carbon of Huaibei Activated Carbon Co., Ltd for the purpose of mixture gas separation was degassed prior to all gas adsorption measurements (300℃; 3 h; 10−5 kPa). CH4 and CO2 adsorption isotherms were obtained at 298 K using Hiden IGA-2 to test the isotherm within the pressure range from 0.03 to 2 MPa.
Potential model
We treat CH4 and CO2 as Lennard–Jones (LJ) particles. The energy parameters are ɛff/k = 148.10 and 236.14 K for CH4 and CO2, respectively, and the size parameters are σff = 0.381 and 0.364 nm (Maddox and Gubbins, 1997). Here k stands for the Boltzmann constant. As for multiple center character of CO2 molecule, the potential parameters of CO2 are determined by fitting the experimental phase diagram when the temperature at 298 K with the modified Benedicit-Webb-Rubin (MBWR) equation of state (Ihara et al., 2012). In mapping the CO2 properties into those for a LJ system, the cutoff distance is set at 3.5σff.
We follow the slit pore model as in standard materials characterization to represent the pore geometry. The Steele 10-4-3 wall potential is used to describe interaction between a gas molecule and each surface (Steele, 1973). The parameters for the solid wall are ɛss/k = 28.0 K, σss = 0.34 nm, number density ρs = 114 nm−3, and graphite spacing interlayer Δ = 0.335 nm (Cao et al., 2002). The size and energy parameters between solid and fluid are calculated through the standard Lorentz–Berthelot rules.
NLDFT methods
We have tested four kinds of NLDFT methods, symbolized as Mean Field Approximation (MFA), First-order Mean Spherical Approximation (FMSA), WDA-Y, and WDA-L. The main differences of above methodologies lie in the functional form of attractive term in excess Helmholtz free energy (
MFA

FMSA


WDA

Grand canonical Monte Carlo simulation (GCMC)
We adopt Towhee-7.0.4 for GCMC calculations (Martin, 2013) and compare the simulation results with NLDFT predictions. The total number of molecules in the simulation box is 4000. It takes 106 configurational steps for equilibrium and 106 steps for production in each simulation run. GCMC involves three types of trail moves: insertion, deletion, and displacement of gas molecule in the slit pore.
Numerical solution of the AIE
The AIE provides an explicit connection between the PSD function and the adsorption isotherm of a realistic porous material


TEBS
AIE can also be simplified into linear least square problem,
The residue of equation (7) is the main part of forward error control by optimization algorithm. For such ill-posed problem, the error bound of numerical solution from backward error analysis can be calculated from

Multimodels calculation of adsorption capacity
The AIE suggests that, ideally, the PSD function acquired from one gas isotherm is applicable for prediction of the adsorption isotherms of other gases. Figure 1 shows schematically the numerical procedure. Based on the PSD function, we can also predict the adsorption isotherm for mixtures.
Schematic of parameter fitting and prediction route. Red solid line: isotherm fitting; red dash line: pure gas isotherm prediction. Violet line: binary gas isotherm prediction with data from experimental isotherm (solid line) and predicted isotherm (dash line).
The conventional method to predict the adsorption isotherm for a binary gas mixture is based on those for corresponding pure gases within the framework of the ideal adsorbed solution theory (IAST) (Do, 1998). Because the numerical performance of IAST has been well established, it provides a convenient benchmark for calibration of our theoretical predictions. The average deviation between the two methods can be calculated from

For binary systems considered in this work, we calculate
With the experimental and predicted isotherms, computation for adsorption capacity of adsorbent in application of pressure swing adsorption (PSA) can also be made through the published model (Maring and Webley, 2013) in large scale. The working capacity (WC) of the model is defined as the mole concentration of CO2 in the product mixture and the specific work (SW) is calculated from equation (10), where

TEBS comparison
In previous study (Fu et al., 2015a), results in single slit pore of four NLDFT methodologies were all close to the calculation of molecular simulation, for example, the average deviation between MFA and GCMC within reduced bulk density range from 0.002 to 0.5 is merely 0.82%. For further comparison, we calculate the excess density of CH4 and CO2 in series of slit pore at different pressure conditions when the temperature is 298 K to let the inconspicuous differences among methodologies accumulate as the calculation increases. The kernel matrix for each gas can be built consequently.
The numerical solution of PSD is affected by both optimization algorithm in solving AIE for isotherm fitting and theoretical methodologies like NLDFT and GCMC. With the effect of numerical algorithm excluded, the TEBS is used for quantitative comparison to rank the performance of four NLDFT methods with the same potential parameters in calculation for the same size of kernel. The narrower the TEBS is, the more accurate the solution of AIE will be. For a well-posed problem with TEBS equal to 1, such quality can be treated as a baseline for measurement of the distance between numerical and analytical solutions of PSD.
Figure 2 shows the TEBS of PSD with the kernel of both CH4 and CO2. The results from WDA-Y predictions are the narrowest among four theoretical methodologies, nearly 104 times narrower than MFA and very close to that from molecular simulation. Since WDA-Y is the modification of MFA in calculating the attractive term of the excess Helmholtz free energy functional with the correlational factor into consideration (Yu, 2009), which means such method is likely to provide more reliable PSD for amorphous material characterization.
TEBS comparison of methodologies. Kernel of gases: CH4, blue column; CO2, yellow column. TEBS: theoretical error bound scale.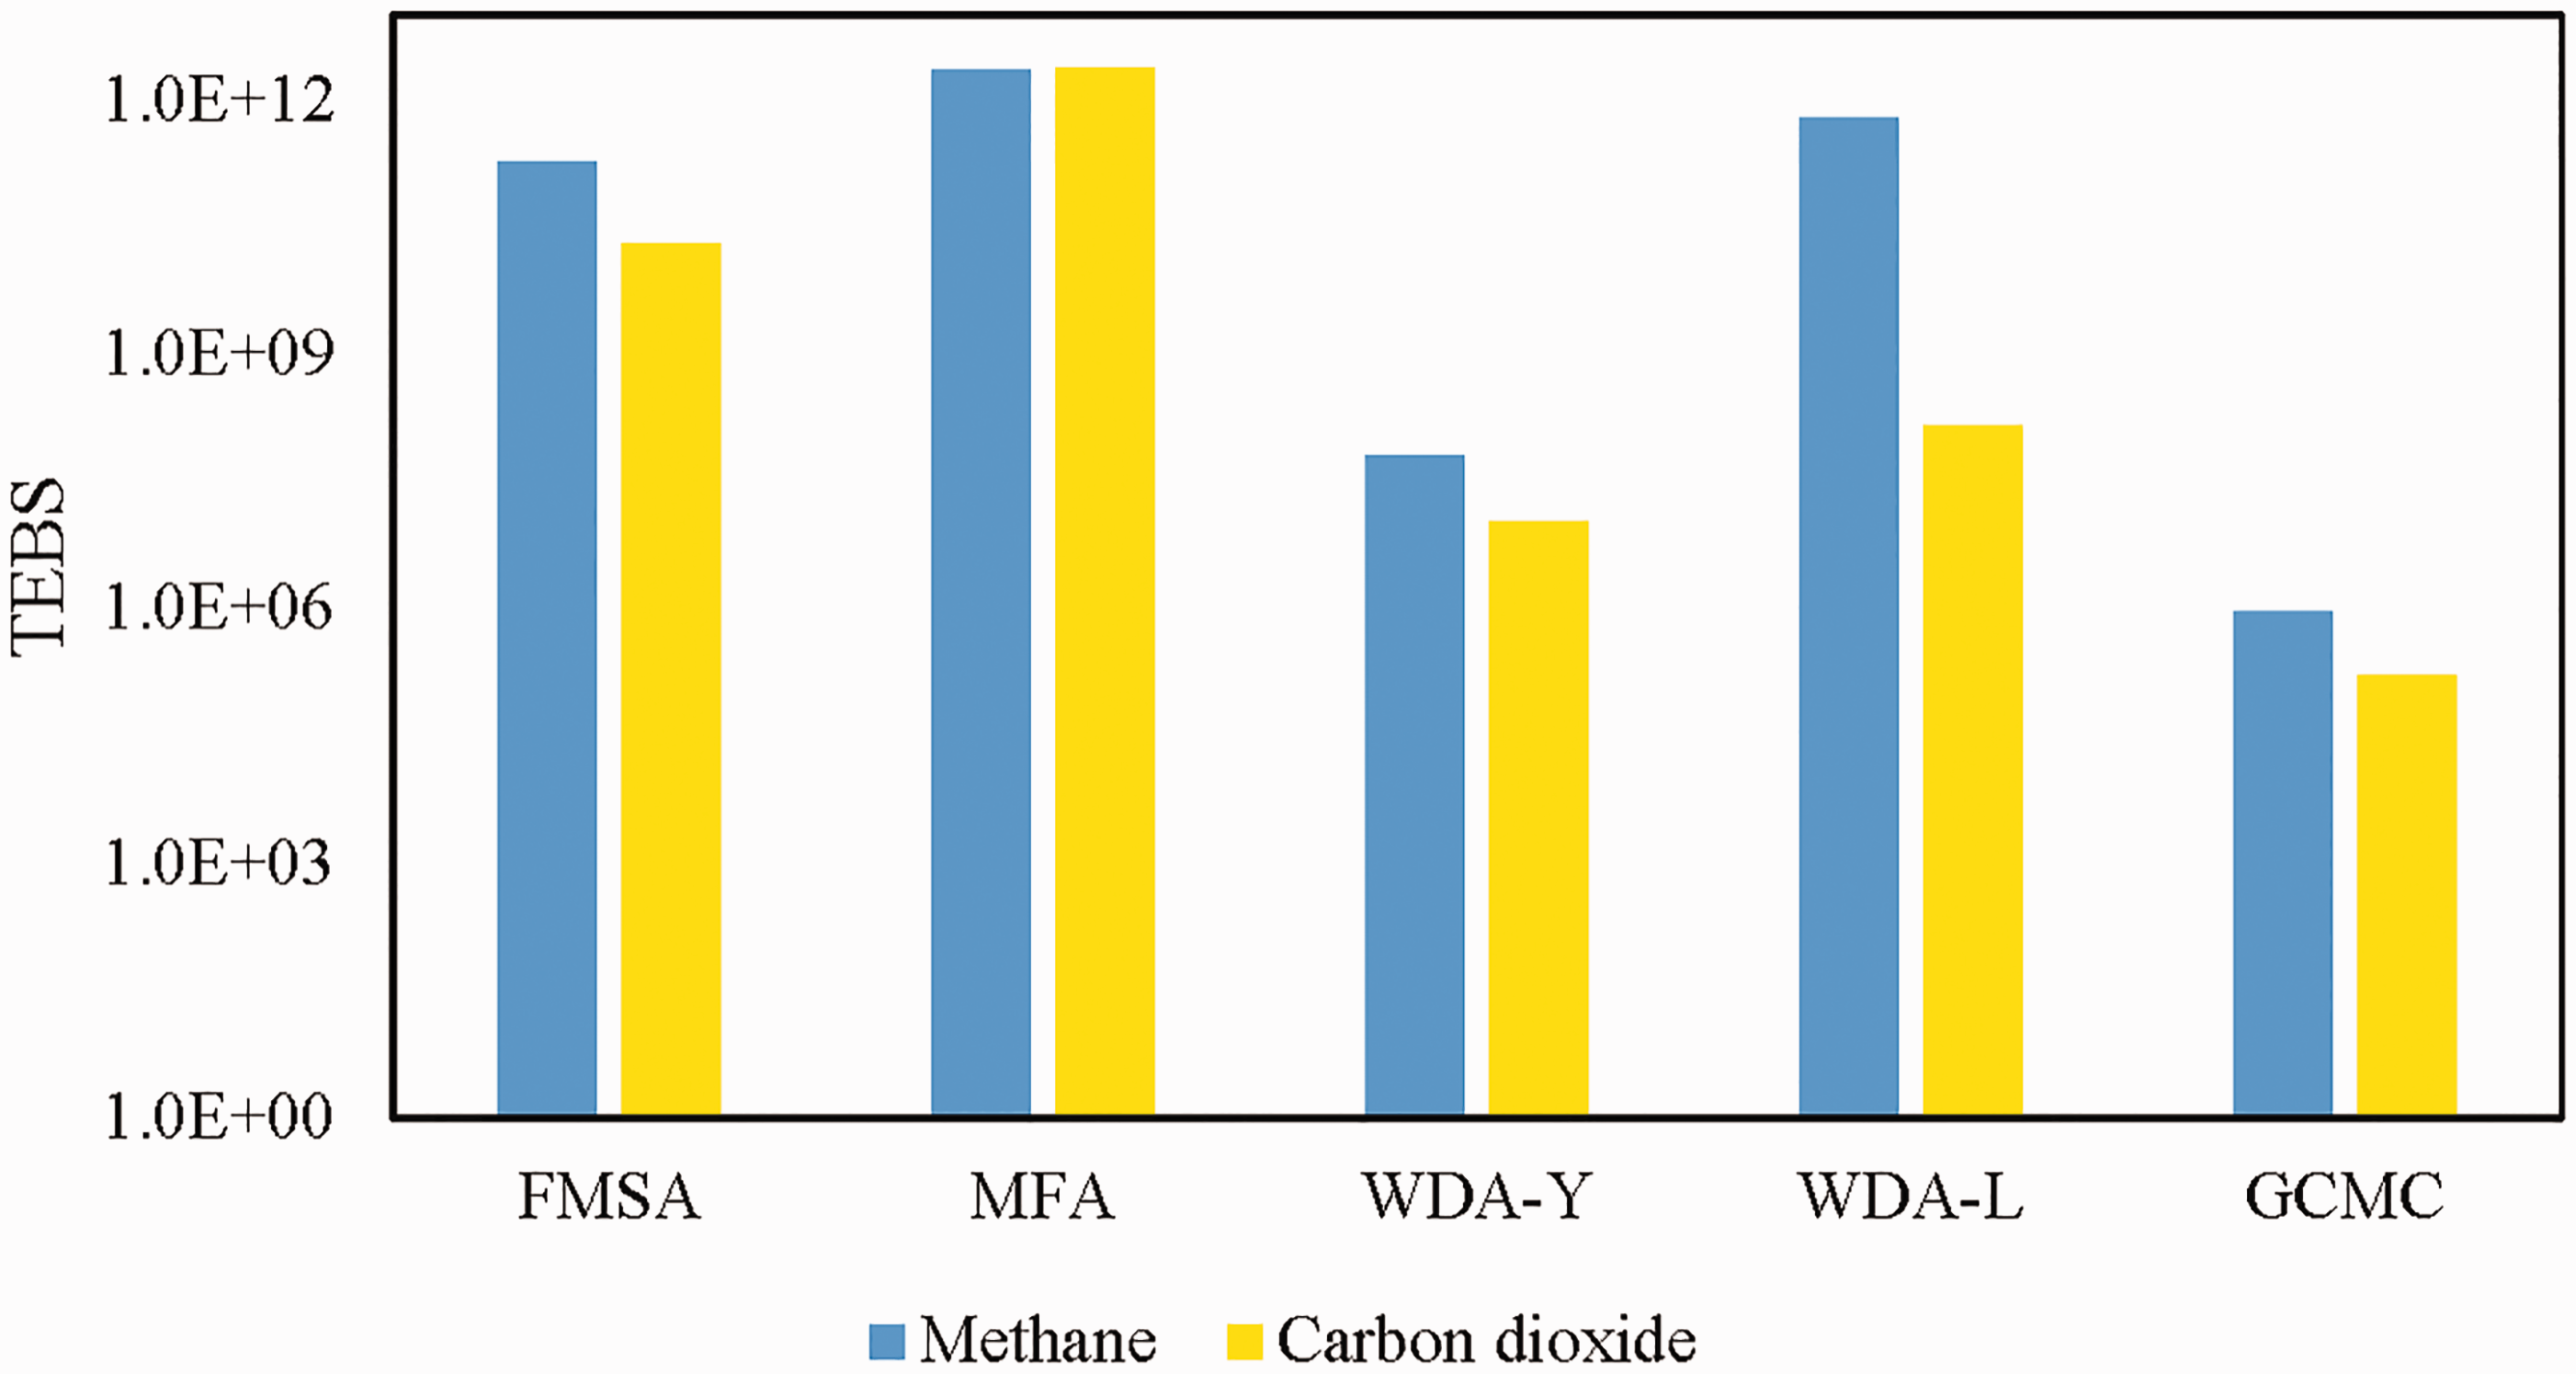
Reasons to account for the distinction between different adsorbates are complex. However, for those methods with TEBS less than 1012, FMSA, WDA-Y, WDA-L, and GCMC, it is obvious that the TEBS of CH4 kernel is a little higher than that for CO2. With the influence of temperature taking into consideration, 298 K is higher than the critical temperature of CH4, while lower than that for CO2. According to a previously published work by Liu et al. (2011), it is random distribution for fluid molecule in supercritical condition and layer-by-layer structure of those subcritical fluids in the slit pore. We conclude it is helpful to adopt subcritical fluid for the calculation accuracy improvement of excess adsorption in the single slit pore and its TEBS value can be reduced consequently. Therefore, in the following calculations the PSD functions are all based on the kernel of CO2.
PSD from isotherm fitting
The CO2 isotherm of four activated carbons is fitted with the kernel calculated by WDA-Y. As shown in Figure 3, the fitting results are in good accordance with the experiment data of four samples, through which the required PSD is also validated for the minimum fitting deviation.
Fitting of CO2 isotherm. Experiment isotherm of samples: ○, A; □, B;  , C; ⋄, D. Calculation result: −, A; -·-, B; –, C; ċċċ, D.
The form of PSD listed in Figure 4 is varied from the reference since different distribution functions. The advantages of such method include no numerical boundary, smooth and nonnegative constraints. Moreover, since no prior function form, the distributed value of the single slit pore is independent of each other.
PSD of samples. Samples: •, A; ▪, B;  , C; ♦, D. PSD: pore size distribution.
Adsorption capacity prediction
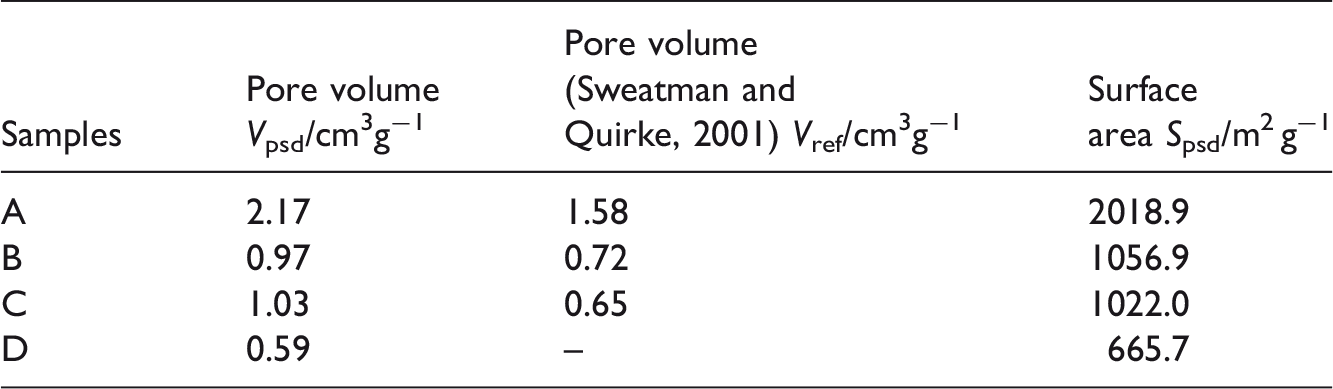
Structural properties analysis of samples.
Average deviation in prediction.

Mole fraction ratio of binary gases,
In Figure 5, the adsorption performances of sample D in PSA process are predicted with the adsorbent quality hypothesizes of weight 1 kg, packing density 617.6 kgm−3, porosity 0.69, and specific heat 1050 J(kg K)−1 at the condition of feed gas pressure 0.1 MPa, adsorption pressure 0.12 MPa, specific heat ratio 1.4, isentropic efficiency 75%, and temperature of gas feeding 298 K. Apparently, the results predicted from the PSD function are consistent with the experiment data. It means half of experimental research cost in previous can be reduced by the calculation based on the PSD of activated carbon with WDA-Y, the accuracy and stability of which is close to GCMC for TEBS comparison while more efficient. Therefore, such procedure is promising for adsorbent screening in large scales.
Multiscale adsorption performance prediction of sample D. (Mole fraction ratio of binary gases, x(CO2):x(CH4) 
Conclusion
First, a novel routine is proposed to make computation for adsorption capacity with the PSD of activated carbon in application of PSA. It is to make use of the characterized PSD for the macroscopic quality prediction of activated carbon.
Second, a term, TEBS, is adopted for theoretical methodologies comparison. The TEBS is better for its quantitative ranking functional. Compared with MFA, it is remarkable that WDA-Y version of NLDFT with the narrowest TEBS of PSD is better for reliable PSD of amorphous materials.
With such methodology, it is not only for qualitative characterization, but also promising in computer-aided screening of activated carbon materials.
Footnotes
Acknowledgements
We feel gratitude for Dr Jia Fu and Mr Cheng Lian at the University of California, Riverside with their constructive discussions, isotherm fitting, and DFT codes. We also give thanks to both Associate Professor Haitao Huang, Professor Shicai Liu, and Associate Professor Kang Sun in National Engineering and Technology Research Center of Forest Chemistry Industry, China, for their kindness help in characterization, activated carbon samples preparation, as well as review advices. Our gratitude also extends to Professor Paul A. Webley in University of Melbourne and Dr Brian Joseph Maring for the shared code of PSA model.
Declaration of Conflicting Interests
The author(s) declared no potential conflicts of interest with respect to the research, authorship, and/or publication of this article.
Funding
The author(s) disclosed receipt of the following financial support for the research, authorship, and/or publication of this article: This work is implemented on scientific computation grid (ScGrid), Chinese Academy of Sciences and supported by the National Sci-tech Support Plan (2015BAD21B05) and China Scholarship Council (201408320127).