
Abstract
Hydrogel nanocomposites were synthesized by solution polymerization of acrylic acid in the presence of sodium alginate biopolymer and TiO2 nanoparticle. TiO2 nanoparticle and N,N-methylene-bis-acrylamide was used as an inorganic and organic crosslinker, respectively. The structure and morphology of the nanocomposites were investigated using X-Ray Diffraction (XRD), Fourier Transform Infra-Red Spectroscopy (FTIR), Scanning Electron Microscopy (SEM), Brunauer-Emmett-Teller (BET) and thermogravimetric analysis techniques. The nanocomposites hydrogel was used for the adsorption of methyl violet dye from water. The influence of TiO2 nanoparticle, sodium alginate content and grafting on adsorption were studied. The results showed that a pseudo-second-order adsorption kinetic was predominant in the adsorption of methyl violet onto the nanocomposite hydrogel. The experimental equilibrated adsorption capacity of the nanocomposite hydrogel agrees with Langmuir isotherm. Maximum adsorption capacity of 1156.61 mg g−1 and adsorption efficiency of 99.6% towards methyl violet were obtained for the hydrogel nanocomposite.
Introduction
Most dyes and their intermediate products have been known to be toxic, carcinogenic or mutagenic (Rindle et al., 1975; Robinson et al., 2001). Dye molecules spreads into surface water, groundwater system, drinking water and accumulates along the food chain. Dyes can be a persistent water pollutant because they do not degrade biologically due to their complex aromatic structures (Crini, 2006). Complete removal of toxic dyes from industrial waste is becoming more important due to their harmful effect on living organism. Methyl violet (MV) dye is extensively used in printing, textile and paint industries (Mittal et al., 2008). This dye has a high tinctorial value with a distinct colour in water even at a low concentration of 1 mg l−1 (Bayramoglu et al., 2009). Hence it is necessary to remove MV from aqueous solution.
A series of methods such as coagulation and flocculation, membrane separation, oxidation or ozonation, electro-coagulation and adsorption have been utilized for the removal of dyes from wastewater (Gimbert et al., 2008; Kim et al., 2005; Singh et al., 2013). Among these techniques, adsorption has been found to be an economical, simple and efficient process for the removal of dyes in aqueous solution (Atta et al., 2013; Raizada et al., 2014; Walker et al., 2003). Synthetic and natural biopolymer-based adsorbents have been produced and used for the adsorption of dyes from aqueous solution (Prado et al., 2004; Xua et al., 2006). Applying a user and eco-friendly material is becoming more important in the present frontier research for the removal of dyes from aqueous solution.
Sodium alginate (SA) is an anionic natural, biodegradable and renewable biopolymer that has drawn considerable interest in recent years. It is a linear polymer that consists of poly-β-1,4-
In recent years, nanocomposite hydrogels have been widely used in various application (Bergaya et al., 2013; Jiao et al., 2015, 2016; Liu et al., 2010; Thakur et al., 2016). Nanocomposite hydrogels are three-dimensional networks of hydrophilic polymers that can absorb and maintain a large quantity of water in the presence of nanoparticles (NPs). The incorporation of NP into the hydrogel matrix results in improved mechanical strength, high adsorption capacity and reduced cost (Haraguchi et al., 2002). Due to low cost, chemical stability, negligible toxicity, strong oxidizing power, photostability and unique semiconducting properties, TiO2 NPs are widely used in various applications such as photocatalysis, pigments, drug delivery, dye-sensitized solar cells and others (Chen and Mao, 2007). However, recovery of TiO2 NPs from the solution after the completion of the reaction, time consumption and easy aggregation are the problems of TiO2 NPs as an adsorbent or a photocatalyst in aqueous solution (Chong et al., 2010). These shortcomings have reduced the applications of TiO2 NPs in water treatment. The carbonaceous material with TiO2 NPs shows improved TiO2 performance in water treatment (Bartl et al., 2004). Here, we incorporated TiO2 NPs in the hydrogel (SA-g-PAA) matrix and used this hydrogel nanocomposite (SA-g-PAA/TiO2) for the removal of MV in aqueous solution. We report a very high adsorption capacity of 1156.61 mg g−1 of SA-based hydrogel for the removal of MV in comparison to available reports. For example, the hydrogel prepared by Maity and Ray (2014) was reported to have an adsorption capacity of 359 mg g−1 for the removal of MV. An adsorption capacity 346.42 mg g−1 of chitosan copolymerized with acrylic acid (AA), hydroxyethyl methacrylate and sodium acrylate for MV uptake has been reported by Mandal and Ray (2014).
In the present work, we report the TiO2 NPs incorporated SA-g-PAA hydrogel nanocomposite with high porous structure and high percentage grafting for MV dye removal and successfully achieved high adsorption capacity (1156.61 mg g−1). The effect of different reaction parameters like reaction time, reaction temperature, monomer, initiator, amount of solvent, pH and effect of crosslinker was optimized to get maximum grafting of AA onto SA. The zeta potential of hydrogel nanocomposite (SA-g-PAA/TiO2) was calculated to understand the mechanism of MV adsorption onto SA-g-PAA/TiO2.
Experimental
Materials
SA, AA, potassium persulphate (KPS), N,N-methylene bisacrylamide (MBA), TiO2 NPs ≥21 nm and MV were purchased from Aldrich. All chemicals were used without further purification. All the reactions were carried out by using deionized water.
Synthesis of SA-g-PAA/TiO2 hydrogel nanocomposite and SA-g-PAA hydrogel
Optimized grafting parameters for the synthesis of SA-g-PAA hydrogel.

The synthesis of SA-g-PAA hydrogel was similar to SA-g-PAA/TiO2 hydrogel nanocomposite except the presence of TiO2 NPs. To get the maximal percentage grafting of AA onto SA, the following reaction parameters were optimized: initiator concentration, monomer concentration, crosslinker concentration, reaction time, temperature and pH (Table 1).
The percentage grafting (Pg) and percentage grafting efficiency (Pge) were computed in the following way


Instrumental analysis
X-ray diffraction analysis was performed on a Rigaku Ultima IV, X-ray diffractometer employing Cu Kα radiation of the wavelength of 1.5406 Å at 45 kV/40 mA. The infrared spectrum was acquired on a Perkin-Elmer Spectrum 100 spectrometer using KBR pallet method in the spectral range of 4000–400 cm−1 with a resolution of 4 cm−1. The surface morphologies and elemental analysis were examined using a scanning electron microscopy (TESCAN, VEGA SEM) under a 20 kV electron acceleration voltage after coating the sample with a layer of the carbon film. The thermal studies were evaluated using a thermogravimetric analyser (Perkin-Elmer TGA 4000) heated from 30 to 900℃ at a heating rate of 10℃ min−1 in a nitrogen atmosphere. The specific surface area (BET), pore volume and pore size distribution were measured by nitrogen adsorption–desorption measurements using Micrometrics, ASAP 2020, surface area and porosity analyser.
Zeta potential measurements
A 5 mg of sample was added to 30 ml of deionized water followed by stirring about 24 h. The 0.1 M NaOH and 0.1 M HCl solutions were used to adjust the pH of the mixture. After stirring the solution was kept for 1 h in order to settle down the mixture. The zeta potential of supernatant liquid was evaluated by a Zetasizer Nano-ZS, ZEN3600 (Malvern Instruments Limited, UK).
Adsorption experiments
The adsorption experiments of MV solution prepared in the laboratory were carried on a thermostat water bath at 25℃ at 200 rpm. Batch adsorption experiments were performed to optimize the experimental parameters such as the amount of TiO2 NP, solution pH and adsorbent dose. The pH values (2.0–11.0) and adsorbent dose (5–40 mg) were optimized at the determined initial MV concentration of 100 mg l−1. The pH values of MV solutions were adjusted with 0.1 M NaOH and 0.1 M HCl. In all typical batch experiment, 30 mg of the hydrogel nanocomposite was immersed in 50 ml of dye solution of initial concentration 100 mg l−1. The samples were withdrawn from the water bath at predetermined time intervals and the suspensions were filtered out. The percentage of dye adsorption corresponds to a wavelength of 584 nm using UV/VIS spectrophotometer (Shimadzu, UV-2450, UV-Vis spectrophotometer) and was calculated using equation (3)

Adsorption isotherm studies were executed by agitating a series of vials by adding the optimized amount of adsorbent (30 mg) and 50 ml of MV solution of various concentrations in a thermostat rotary shaker at neutral pH with a constant speed of 200 rpm until equilibrium was reached. Adsorption equilibrium studies were evaluated at the temperature 25, 35 and 45℃. The adsorption capacity of adsorbent for MV was calculated using the following formula

Adsorption kinetic studies were carried out with three different initial dye concentrations, i.e. 100 and 150 mg l−1 with stirring at 200 rpm and operated at 25℃. In kinetics studies, 0.2 g of adsorbent was used at neutral pH. The mixture was stirred until the equilibrium is attained. The sample aliquots were withdrawn at various intervals of time, filtered and the concentrations of MV were determined.
Results and discussion
Mechanism
During the grafting of poly(acrylic acid) chains onto SA, –OH and –Na groups are the active sites. Initiation process involves the dissociation of KPS to generate SO4−* radicals that further react with water molecules to give OH*. The active sites of the monomeric species were produced by the synergy of SA with the SO4−* and OH* radicals. The graft copolymer obtained by the grafting of poly(acrylic acid) chains onto SA further gave crosslinked network in the presence of MBA (Scheme 1). The polymerization reaction was terminated either by the abstraction of hydrogen or the reaction among the activated chains.
Optimization of the grafting parameters for the synthesis of SA-g-PAA hydrogel
Effect of initiator concentration
The effect of initiator concentration on percentage grafting and grafting efficiency was investigated by taking initiator concentration from 0.003 to 0.011 mol l−1 as shown in Figure 1(a). It was found that percentage grafting and grafting efficiency increased to 362.2 and 152.5 up to concentration 0.007 mol l−1 of KPS. Further raise in KPS concentration decreased the percentage grafting and grafting efficiency. Initially an increase in the KPS concentration enhanced percent grafting and grafting efficiency; this is due to the generation of a high number of radical active sites and excessive formation of radical sites at higher KPS concentration, which led to the termination of the reaction (Shukla and Sharma, 1987).
Variation of percentage grafting (Pg) and percentage grafting efficiency (Pge) with (a) initiator concentration, (b) reaction time, (c) solvent concentration, (d) pH, (e) temperature and variation of percentage grafting (Pg) with (f) monomer concentration, (g) crosslinker concentration.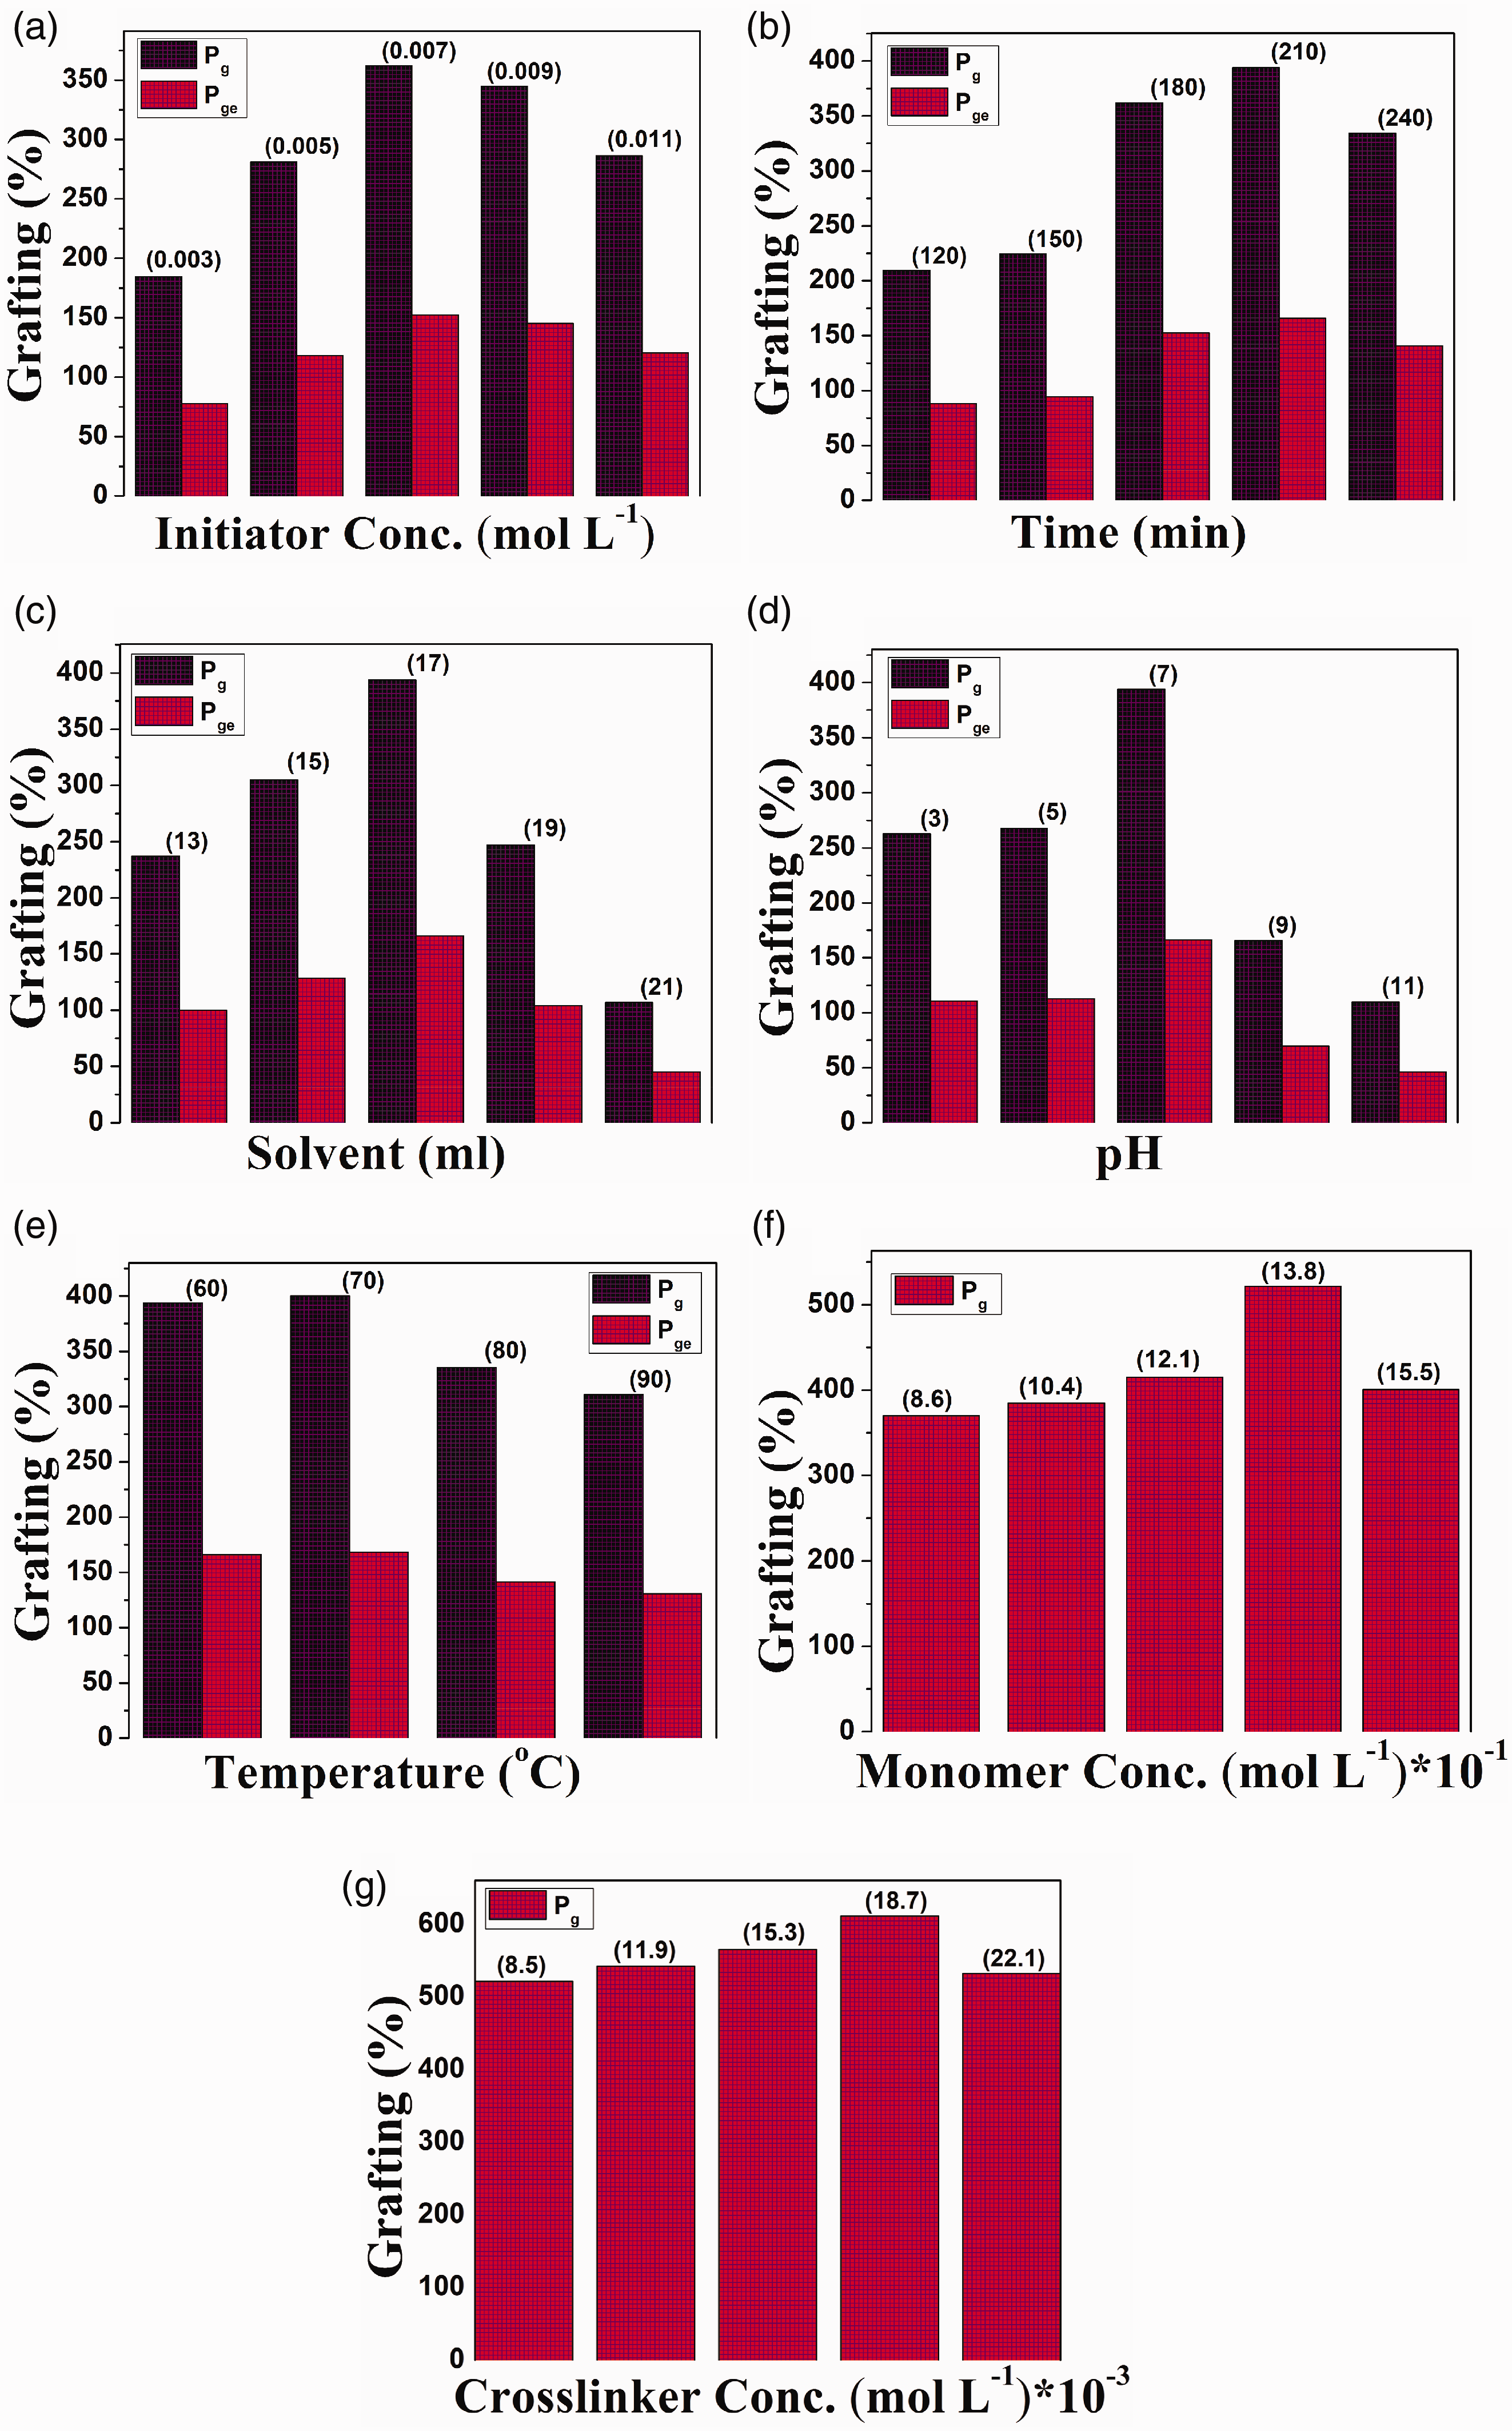
Effect of reaction time
The percentage grafting and grafting efficiency were boosted with time from 120 to 210 min and then dropped from 210 to 240 min (Figure 1(b)). 394 and 165.9 were the maximum percentage grafting and grafting efficiency achieved at 210 min. The initial rise in Pg and Pge could be assigned to the formation of more active sites on SA and AA via interaction between radical and substrate. The decline in Pg and Pge after 210 min is ascribed to less availability of radical active sites and amount of radical active sites diminishes at too longer irradiation time (Kaith et al., 2009).
Effect of solvent
The grafting of AA onto SA was affected by solvent concentration (13–21 ml) as presented in Figure 1(c). Up to 17 ml of solvent volume, both percentage grafting and grafting efficiency first increased and beyond 17 ml of solvent volume, percentage grafting and grafting efficiency decreased. The hydroxyl radical produced by water could be attributed to the propagation step in the polymerization reaction which caused an initial increase in percentage grafting and grafting efficiency. The high amount of solvent led to the generation of excessive hydroxyl radicals, which were responsible for the termination of the reaction, which further obstructed the graft copolymerization process.
Effect of pH
The pH of the samples was adjusted by using stock solution HCl (0.1 N) and NaOH (0.1 N) with further dilution. Figure 1(d) shows an optimal pH of 7 for the percentage grafting and grafting efficiency. Higher grafting of AA onto SA at pH 7 can be ascribed to the high rate of initiation than the rate of termination. In a basic medium, generated OH* radical reacts with substrate-free radical to stop the chain reaction and hence percentage grafting and percentage efficiency decreased.
Effect of temperature
The grafting of AA onto backbone (SA) was investigated under temperature variation from 60 to 90℃ (Figure 1(e)). The optimized temperature was 70℃ with values 400 and 168.42 of percentage grafting and grafting efficiency, respectively. The rise in percentage grafting and grafting efficiency up to temperature 70℃ is due to the enhancement in the diffusion of the monomer as well as the activation of macroradicals. The increase in the probability of chain transfer reaction which led to the formation of homopolymers and acceleration of termination reaction could be the reason for the decline in percentage grafting and percentage efficiency at high temperature (Gupta and Chapiro, 1989) beyond 70℃.
Effect of monomer
The percentage grafting in SA-g-PAA hydrogel was examined by varying the monomer concentration from 0.86 to 1.55 mol l−1(Figure 1(f)). At initial stages from 0.86 to 1.38 mol l−1, the percentage grafting increased up to 521.6 and from 1.38 to 1.55 mol l−1, it decreased to 385. The reduction in percentage grafting at high monomer concentration could be assigned to the formation of homopolymers of AA and increased viscosity which hindered the mobility of free radicals onto active sites (Nasef and Hegazy, 2004). Hence the rate of homopolymerization is more than the rate of graft copolymerization at high monomer concentration.
Effect of crosslinker
The level of grafting in SA-g-PAA hydrogel was checked by changing the crosslinker concentration from 0.008 to 0.022 mol l−1 (Figure 1(g)). The higher activity of MBA and enhancement in branching reactions caused the acceleration in the percentage grafting up to 0.018 mol l−1 of MBA concentration. Deceleration of percentage grafting and at high concentration after 0.018 mol l−1 is attributed to the formation of tightly crosslinked graft structure which retards the movement as well as suppresses the monomer diffusion (Nasef and Hegazy, 2004).
FT-IR characterization
The infrared spectra in the range of 4000–400 cm−1 for SA and SA-g-PAA/TiO2 are shown in Figure 2(a). The peaks at 3435 and 2924 cm−1 indicate the stretching of the –OH groups and the C–H stretching of the CH2 groups, respectively.
(a) FTIR of SA and SA-g-PAA/TiO2, X-ray diffraction patterns for (b) SA-g-PAA/TiO2, (c) SA-g-PAA/TiO2 loaded MV. FTIR: Fourier Transform Infra-Red Spectroscopy; MV: methyl violet; PAA: Poly(acrylic acid); SA: sodium alginate.
The low-intensity peaks at 949 and 1104 cm−1 are attributed to arabinosyl units and glycosidic linkage is confirmed by the presence of a broad peak at 895 cm−1. The grafting of AA on SA is supported by a new characteristic adsorption band 1718 cm−1, assigned to C=O stretching of poly(acrylic acid) in the spectrum of SA-g-PAA/TiO2. The bands at 627 (corresponding to stretching vibration of Ti–O) and 1404 cm−1 (corresponding to stretching vibrations of Ti–O–Ti) depict the presence of TiO2 NP in SA-g-PAA/TiO2.
XRD
The XRD of SA-g-PAA/TiO2 shows the crystalline peaks at 25.42°, 27.81°, 36.28°, 37.97°, 48.21°, 53.97°, 55.35°, 62.84° and 68.84° which confirm the presence of anatase phase of TiO2 NP as per JCPDS card No. 83-2243 (Dhayal et al., 2014) (Figure 2(b)). The broadness in peak is due to graft copolymerization. The broadness confirms the grafting of poly(acrylic acid) chains onto SA. The disappearance of the crystalline peaks was observed after the uptake of MV (Figure 2(c)). The transition from crystalline to amorphous may be due to the diffusion of MV dye into the micropores and macropores of SA-g-PAA/TiO2 hydrogel nanocomposite (Juang et al., 2006).
Electron microscopy – SEM and TEM
SEM was employed to study the morphology after dye adsorption and chemical modification (Figure 3). The surface morphology of SA is found to be smooth (Figure 3(a)), whereas, after grafting of AA on SA, the surface morphology becomes rougher (Figure 3(b)).The introduction of TiO2 NP into SA-g-PAA hydrogel increases the roughness of surface (Figure 3(c)), which is desirable for the adsorption of MV dye.
SEM images of (a) SA, (b) SA-g-PAA, (c) SA-g-PAA/TiO2, (d) MV loaded SA-g-PAA/TiO2, (e) TEM images of SA-g-PAA/TiO2 and (f) EDS of SA-g-PAA/TiO2. MV: methyl violet; PAA: Poly(acrylic acid); SA: sodium alginate.
The internal pores can be seen in the morphology of SA-g-PAA/TiO2 hydrogel nanocomposite, which favours the intraparticle diffusion of MV dye as explained above. Hence, TiO2 NP was sufficient to create well-developed pores with uniform distribution leading to large surface area and porous structure. The pores and surface of SA-g-PAA/TiO2 hydrogel nanocomposite were entirely occupied by MV as noted in Figure 3(d). Furthermore, this confirms the adsorption of MV dye by SA-g-PAA/TiO2 hydrogel nanocomposite. Figure 3(e) shows the TEM images of SA-g-PAA/TiO2, where TiO2 NP was observed embedded inside the SA-g-PAA hydrogel. Also, incorporation of TiO2 NPs into SA-g-PAA hydrogel is supported by the presence of Ti and O peak in the EDS of SA-g-PAA/TiO2 hydrogel nanocomposite (Figure 3(f)).
Thermogravimetric analysis
The thermogravimetry/differential thermogravimetry (TG-DTG) curves of SA-g-PAA and SA-g-PAA/TiO2 nanocomposite are depicted in Figure S1. The initial weight losses of 6.2 and 5.7% for SA-g-PAA and SA-g-PAA/TiO2 nanocomposite, respectively, in the temperature range 30–140℃ were attributed to the loss of adsorbed water. The weight loss of SA-g-PAA (34.6%) and SA-g-PAA/TiO2 (32.6%) from 145 to 296℃ was assigned to the splitting of glycosidic bonds and desiccation of saccharide rings (Wang and Wang, 2010). The third decomposition temperature from 330 to 530℃ with weight loss 35.7% (SA-g-PAA) and 31.5% (SA-g-PAA/TiO2) implying the loss of crosslinked network structure and formation of the anhydride with the removal of water molecules from the carboxylic groups of polymer chains (Bao et al., 2011). It can be seen from Figure S1 that the decomposition rate of SA-g-PAA/TiO2 is less than that of SA-g-PAA. The TG/DTG results revealed that the TiO2 could behave as a thermal barrier and thus increase the thermal stability of SA-g-PAA hydrogel.
BET
The surface area and pore structure of SA-g-PAA and SA-g-PAA/TiO2 nanocomposite were determined by employing the nitrogen isothermal adsorption technique. The nitrogen adsorption–desorption isotherms and pore size distributions of SA-g-PAA and SA-g-PAA/TiO2 nanocomposite are represented in Figure S2. The isotherm profile of SA-g-PAA/TiO2 demonstrates small hysteresis loop that can be categorized as type IV. The surface area, average pore diameter and total pore volume were enhanced after the incorporation of TiO2 NPs onto the grafted SA-g-PAA hydrogel (Table S1). The interfacial interactions between SA-g-PAA hydrogel and TiO2 NP have great influence on pore structure of the material as evident from this study (Ghorai et al., 2013). SEM study well supported this result as well-developed pores can be seen clearly in the surface morphology of SA-g-PAA/TiO2 hydrogel nanocomposite in comparison to SA-g-PAA hydrogel, i.e. surface area and pore volume of SA-g-PAA hydrogel were increased after the doping of TiO2 NPs.
Application of SA-g-PAA/TiO2 hydrogel nanocomposite for MV removal
Effect of TiO2 NP
The percentage removal of MV by SA-g-AA/TiO2 hydrogel nanocomposite is higher than that of SA-g-PAA hydrogel. It was 99.6 and 85% with SA-g-PAA/TiO2 and SA-g-PAA, respectively. The introduction of TiO2 NPs in the SA-g-PAA hydrogel network improved the porosity of the hydrogel. The penetration of MV molecules into the hydrogel nanocomposite network enhanced by this highly porous structure might be the cause of the relative increase in the percentage adsorption of MV. Also, at pH values above 6.8, the TiO2 NP behave as an anionic centre (Bouzaida et al., 2004). This anionic centre participates in the electrostatic attraction with MV thus further contributing to the increased removal percentage. The percentage adsorption was found to be 96.7 and 99.6 for SA-g-PAA/TiO2 having 25 and 100 mg of TiO2 NP, respectively. With further enhancing TiO2 NP amount to 150 mg the percentage adsorption decreases to 97.8 (Figure 4(a)). This may be ascribed to the formation of a denser network and reduction in elasticity of hydrogel network by the higher amount of TiO2 NP. Hence 100 mg of TiO2 NP was used as the optimum amount in the preparation of the SA-g-PAA/TiO2 nanocomposite.
(a) Effect of TiO2 on percentage adsorption, (b) effect of pH on percentage adsorption, (c) effect of pH on zeta potential of SA-g-PAA/TiO2 hydrogel nanocomposite and effect of (d) adsorbent dose, (e) dye concentration, (f) ionic strength on percentage adsorption of MV using SA-g-PAA/TiO2 hydrogel nanocomposite, (g) change in adsorption capacity of SA-g-PAA/TiO2 for MV with temperature, (h) plot of ln Kd versus 1/T for adsorption of MV by SA-g-PAA/TiO2 hydrogel nanocomposite. MV: methyl violet; PAA: Poly(acrylic acid); SA: sodium alginate.
Effect of pH
The percentage removal of MV as a function of pH (2–11) is shown in Figure 4(b). It is clear from Figure 4(b) that the percentage removal of MV increases with increasing pH from 2 to 7 and beyond pH 7 it becomes constant. The maximum percentage removal was 99.6 at pH 7. The point of zero charge (pzc) may influence adsorption because the surface of adsorbent acquires positive charge at pH less than pzc which is favourable for adsorption of anion, whereas for adsorption of cation pH should be greater than pzc. It was noted that SA-g-PAA/TiO2 hydrogel nanocomposite exhibits pzc at pH 4.47 (Figure 4(c)). Hence due to repulsive forces between SA-g-PAA/TiO2 hydrogel nanocomposite and MV, percentage adsorption is expected to reduce in an acidic condition (pH<pzc). Under acidic conditions, the adsorption of the dye onto the SA-g-PAA/TiO2 hydrogel nanocomposite was decreased due to the involvement of H+ ions, which limit the contact between the dye molecule and the nanocomposite (i.e., repulsive forces come into play). Ionization of carboxylic acid groups of the grafted chains could increase the negative charge on the adsorbent surface which increases the percentage adsorption of MV dye under basic environment (Scheme 2). The high adsorption efficiency is assigned to ionic complex formed between cationic MV and the anionic SA-g-PAA/TiO2 hydrogel nanocomposite (–COO− or TiO2−). All experiments were carried out at neutral pH which is the closest pH to most real sample. This neutral pH adds more value to the application of this adsorbent.
Effect of adsorbent dose
The uptake of dye increases from 68.2 to 99.6% with increasing adsorbent dose from 5 to 30 mg in 50 ml of MV solution and afterwards, no dramatic change in percentage removal (Figure 4(d)). The increase in percentage removal with increase in dose is due to enhanced surface area and availability of more adsorption sites on the SA-g-PAA/TiO2 hydrogel nanocomposite.
Effect of dye concentration
Figure 4(e) presents the effect of the amount of MV as an adsorbate on the percentage removal utilizing hydrogel SA-g-PAA as an adsorbent. It can be noticed that with the rise in MV concentration from 100 to 1092 mg l−1, percentage removal of MV declined from 100 to 48.9. Initially, a maximum number of MV molecules adsorbed on SA-g-PAA surface which results in high percentage removal. Saturation of the adsorption sites of SA-g-PAA hydrogel has been reached at higher dye concentrations caused by lower percentage of adsorption.
Effect of ionic strength
The effect of ionic strength on the percentage removal of MV by hydrogel nanocomposite SA-g-PAA/TiO2 was examined using NaCl solution with a concentration from 0.01 to 0.1 M as shown in Figure 4(f). The percentage removal of MV declined with enhancing in ionic strength of Na+ cation. This result can be explained by the competition between Na+ cation and MV cationic dye for the adsorption sites of negatively charged surface of SA-g-PAA/TiO2 hydrogel nanocomposite thereby reducing the electrostatic interaction between MV and SA-g-PAA hydrogel. By increasing the concentration of Na+, ionic atmosphere may shield the MV from the negatively charged surface of SA-g-PAA/TiO2 hydrogel nanocomposite, which decreases the adsorption of MV.
Effect of temperature
The dependence of adsorption ability on temperature is shown in Figure 4(g). It was found that the adsorption capacity of SA-g-PAA/TiO2 hydrogel nanocomposite for MV reduced from 728.93 to 698.71 mg g−1 with an increase in temperature from 25 to 45℃, which indicates the exothermic nature of the adsorption. The thermodynamic parameters, viz. enthalpy (ΔH°, kJ mol−1), Gibb’s free energy (ΔG°, kJ mol−1) and entropy (ΔS°, J mol−1 K−1) changes were determined to investigate the nature and spontaneity of MV adsorption on SA-g-PAA/TiO2 hydrogel nanocomposite by using the following equations


Adsorption kinetics
The adsorption kinetics of MV uptake by the hydrogel in aqueous medium depends on the contact time of MV and SA-g-PAA/TiO2 hydrogel nanocomposite. The adsorption process constitutes the movement of MV from aqueous solution to the external surface of hydrogel and then from the hydrogel surface into the inner sites which is responsible for pore diffusion. The pseudo-first-order, pseudo-second-order and intraparticle diffusion models were employed to understand the adsorption mechanism. The pseudo-first-order and pseudo-second-order along with equation are given in supplementary file. The pseudo-first-order parameters K1, qe and correlation coefficient (R2) were calculated from Figure 5(a) and described in Table S3. The inapplicability of this model was confirmed by the disagreement between the estimated qe values and experimental values. The pseudo-second-order parameters K2, qe and R2 were examined from the linear plot of t/qt and t (Figure 5(b)) and listed in Table S3. The good agreement of pseudo-second-order kinetic model is supported by the high R2 values and the similarity between the calculated and experimental adsorption capacities. It can be seen that pseudo-second-order rate constant decreases with increase in the initial MV concentration, which may be due to competition among the MV molecules for the nanocomposite surface active sites at a high initial MV concentration. The transfer of MV from outside surface to the pores of the hydrogel can be explained by using the intraparticle diffusion model. The linear form of intraparticle diffusion kinetic model (Weber et al., 1963) can be given as
Adsorption kinetics of MV (a) pseudo-first-order, (b) pseudo-second-order and (c) intraparticle diffusion models using SA-g-PAA/TiO2 hydrogel nanocomposite. MV: methyl violet; PAA: Poly(acrylic acid); SA: sodium alginate.

Adsorption isotherm
Langmuir and Freundlich isotherms (Figure 6) were used to provide information on the effect of temperature on the adsorption of MV onto the SA-g-PAA/TiO2 hydrogel nanocomposite. The details of isotherm model are discussed in the supplementary information. The Langmuir model assumes that the adsorption occurs on a uniform surface of SA-g-PAA/TiO2 with monolayer coverage of MV dye molecules. The plot of Langmuir model and Langmuir parameters is displayed in Figure 6(b) and Table S4. High correlation coefficient (R2) suggests that the adsorption of MV onto the SA-g-PAA/TiO2 hydrogel nanocomposite is best described by Langmuir model. In the initial MV concentration range of 650–1100 mg l−1, the RL values were determined between 0 and 1 as presented in Figure 6(a), which further confirm the applicability of the Langmuir model. These results demonstrate the homogeneity of SA-g-PAA/TiO2 hydrogel nanocomposite, i.e. each MV molecule requires same energy for adsorption and there is monolayer surface coverage of SA-g-PAA hydrogel nanocomposite. The disagreement of Freundlich model is pointed from the low values of R2 (0.77–0.94) compared to those reported by Langmuir model (Figure 6(c), Table S4).
(a) RL versus initial MV concentration, (b) Langmuir isotherm and (c) Freundlich isotherm. MV: methyl violet.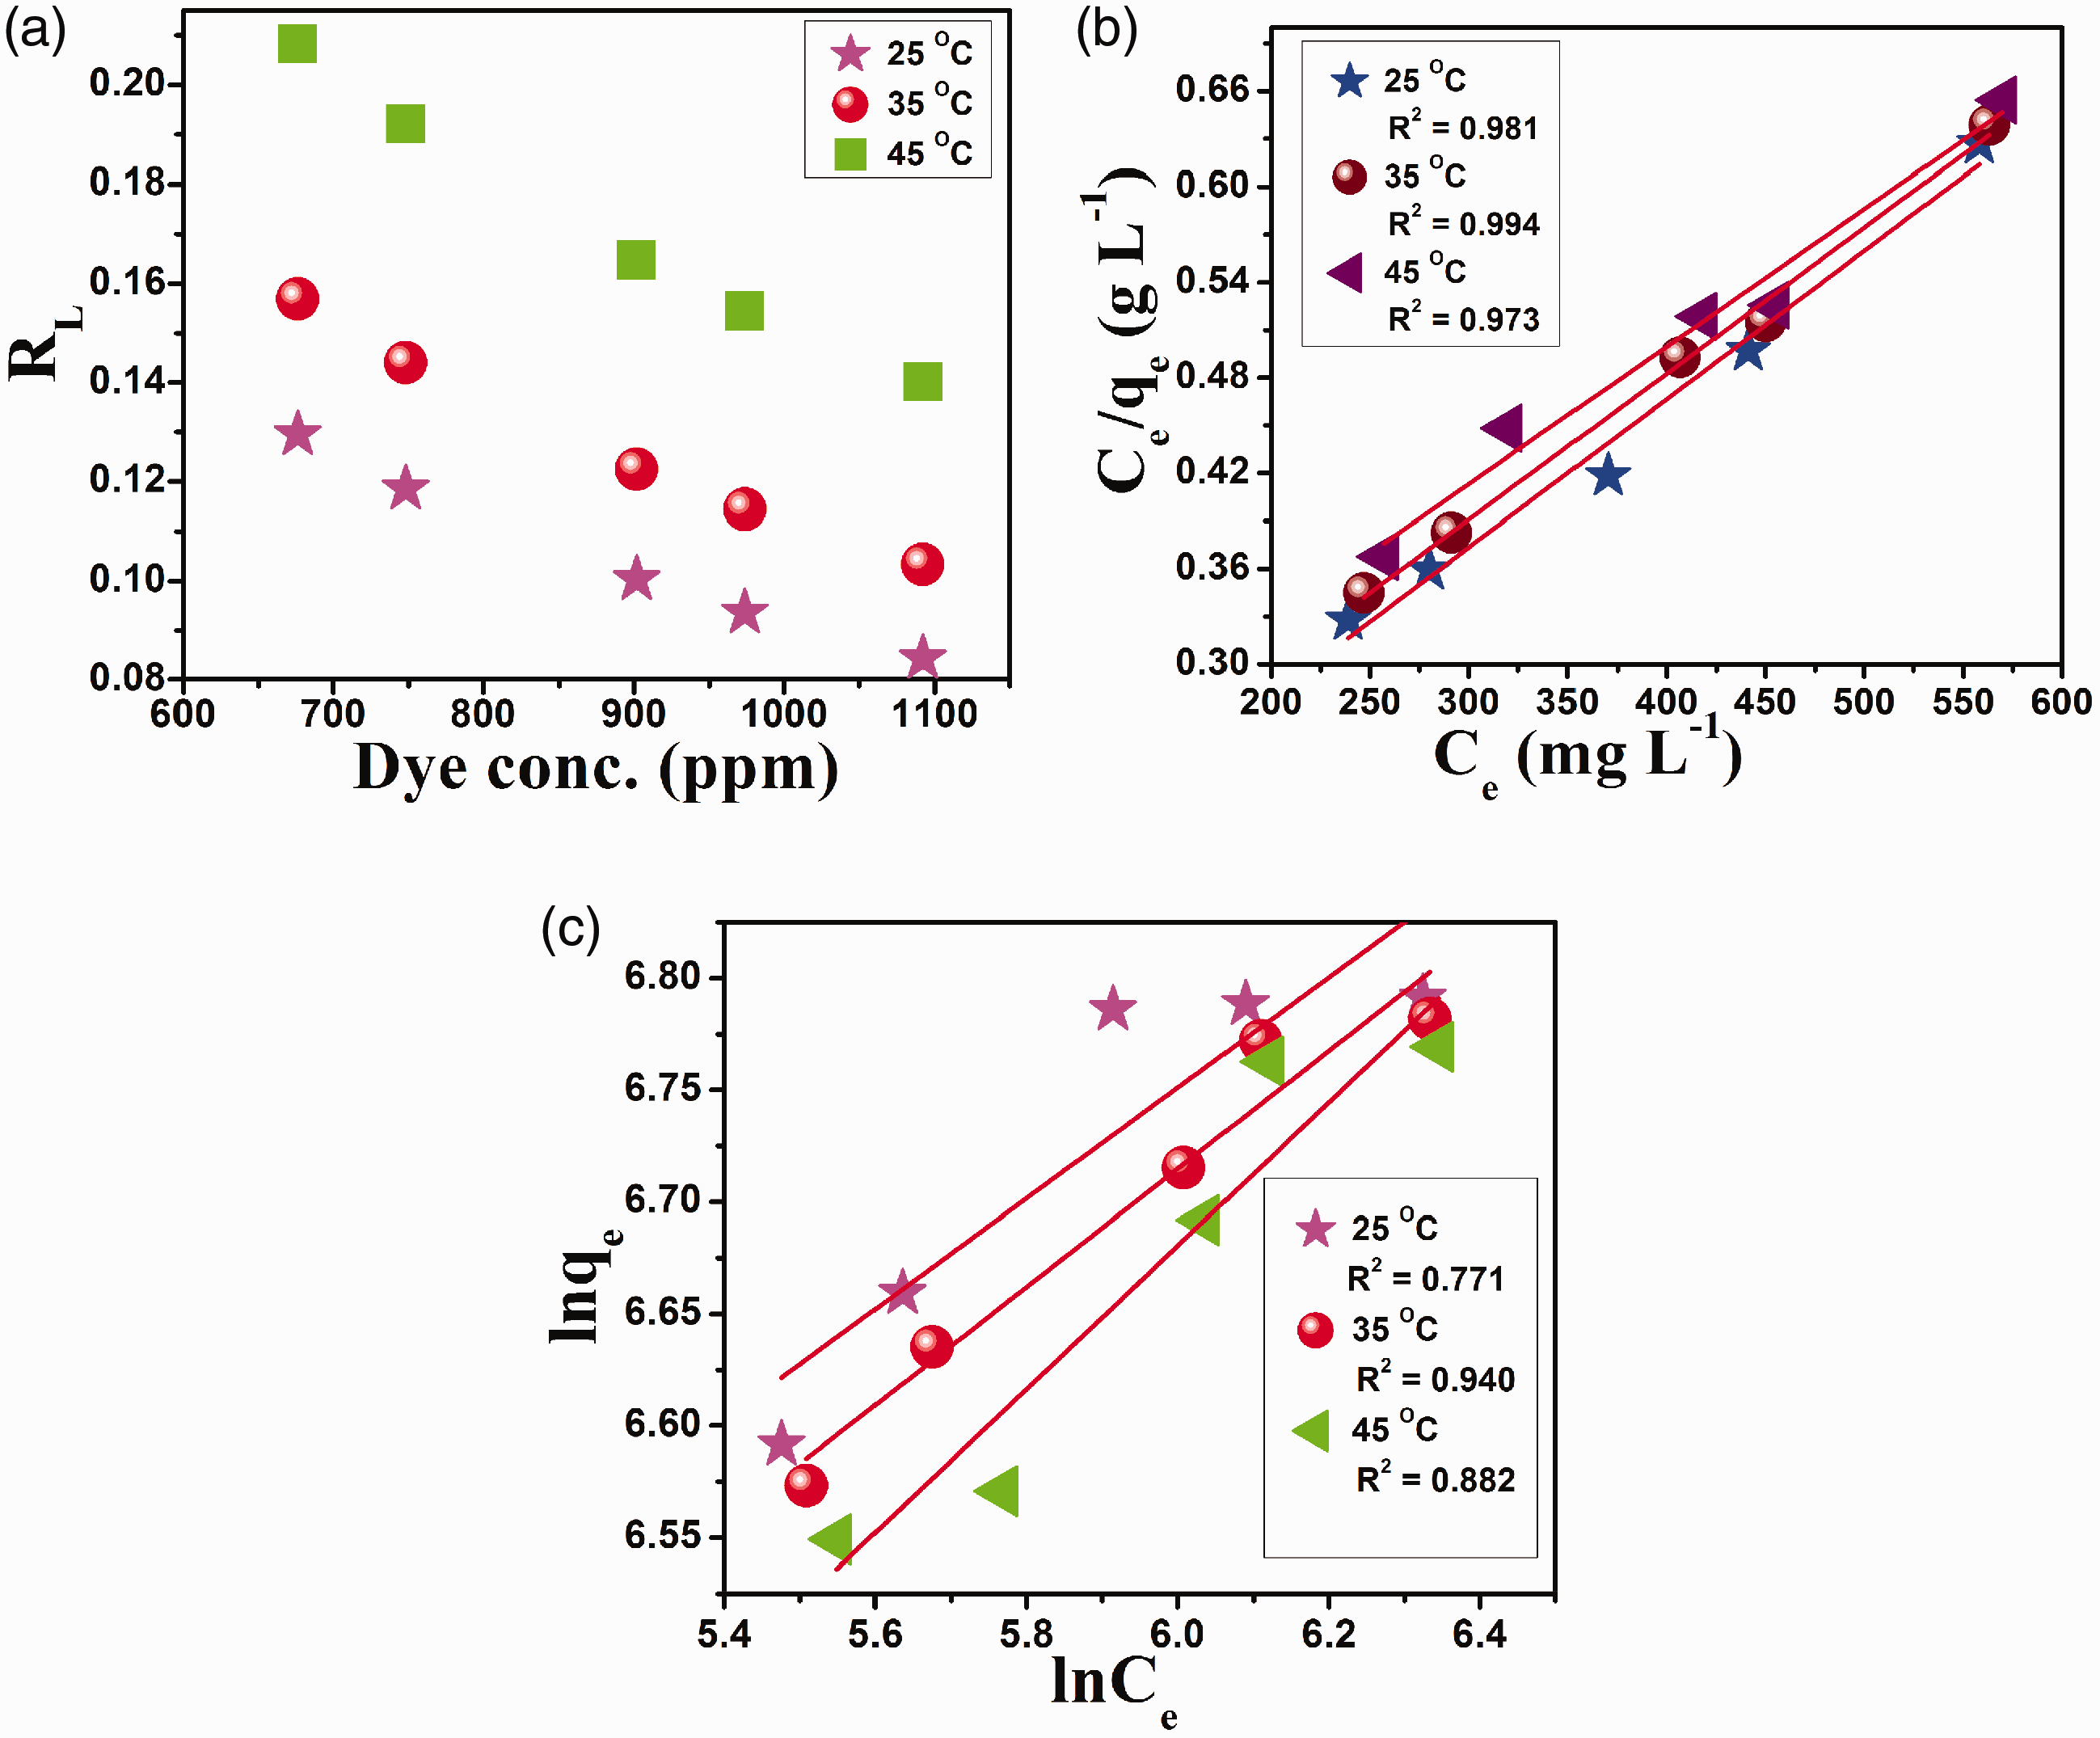
Comparison of the adsorption capacity of SA-g-PAA/TiO2 with various adsorbents
Comparison of adsorption capacity of SA-g-PAA/TiO2 hydrogel nanocomposite with other reported various adsorbents for MV dye.

Conclusion
In this work, we report the fabrication of SA-g-PAA and SA-g-PAA/TiO2 nanocomposite by a free radical graft copolymerization method. Characterization methods showed the presence of TiO2 in the hydrogel matrix and its presence was confirmed by the shift of absorption band in FT-IR. The SA-g-PAA/TiO2 nanocomposite exhibits good capacities for MV dye removal from aqueous solution. The SA-g-PAA/TiO2 hydrogel nanocomposite showed higher adsorption capacity in comparison to several described adsorbents utilized for MV dye removal. High surface area, high pore volume and unique structure generated by introduction of TiO2 NPs in the hydrogel matrix of AA grafted onto SA which caused high adsorption capacity of hydrogel nanocomposite. Hence, SA-g-PAA/TiO2 hydrogel nanocomposite adsorbent can be effectively utilized in water treatment for selective removal of cationic dyes.
Schematic diagram of SA-g-PAA hydrogel. PAA: Poly(acrylic acid); SA: sodium alginate. Plausible mechanism for interaction of MV with SA-g-PAA/TiO2 hydrogel nanocomposite. MV: methyl violet; PAA: Poly(acrylic acid); SA: sodium alginate.

Footnotes
Declaration of Conflicting Interests
The author(s) declared no potential conflicts of interest with respect to the research, authorship, and/or publication of this article.
Funding
The author(s) disclosed receipt of the following financial support for the research, authorship, and/or publication of this article: We acknowledge with gratitude the following for their financial supports: The Centre for Nanomaterials Science Research, University of Johannesburg, South Africa; the Faculty of Science, University of Johannesburg, South Africa and the National Research Foundation, South Africa.