
Abstract
Polyaniline was synthesized by the chemical oxidative polymerization procedure at room temperature employing hydrogen peroxide (H2O2) as oxidant and ferrous chloride (FeCl2·2H2O) and vanadyl sulphate (VOSO4·H2O) as co-catalysts, respectively. The obtained polymers were characterized by high resolution powder X-ray diffraction, Fourier transform infrared spectroscopy, Raman, UV–Visible, photoluminescence spectroscopy, thermogravimetric Field Emission Scanning Electron Microscopy (FESEM) and Transmission Electron Microscopy (TEM) techniques. Ordered arrangement indicative of semi-crystalline nature of polyaniline was evidenced from the presence of intense reflection at d = 13.72 Å in the powder X-ray diffraction pattern followed by two lesser intense peaks at 4.61 and 3.47 Å. Fourier transform infrared spectroscopy and Raman spectroscopic results indicated the polyaniline to be emeraldine salt form. Fibrous morphology was observed in scanning electron microscope images. Nearly 93% of Methyl Orange dye was adsorbed in 30 min by the ordered polyaniline at room temperature. No significant difference in the crystallinity and/or ordering was noticed in the powder X-ray diffraction pattern after dye adsorption. The correlation between the ordered structure of polyaniline and its higher adsorption property derived in the current study has the potential to fabricate devices consisting polyaniline to detect dye molecules.
Keywords
Introduction
The role of polymers in today’s world is gradually becoming indispensable. Owing to the excellent thermal stability, tunable conductivity, ease of synthesis, facile doping chemistry, the investigation on polyaniline (PANI) dominates over other equally interesting and intrinsically conducting polymeric systems such as polypyrrole, polythiophenes, polyphenylenevinylene and polyacetylene (Bhadra et al., 2009; Huang and Kaner, 2004). PANI finds applications in various electrochemical devices including batteries, capacitors, electrochromic windows and displays, actuators, photovoltaic and light-emitting electrochemical cells (Huang, 2006; Zhang and Wang, 2006). The insoluble and infusible nature of PANI hampers its use in various applications. This has been successfully overcome by fabricating composites or blends of it (Khanna et al., 2005; Liu et al., 1993; Sivakumara and Gedanken, 2005). Though few studies have devoted on the application of PANI as an adsorbent for harmful organic dye molecules (Ayad and El-Nasr, 2010; Mahanta et al., 2008, 2009; Patra and Majhi, 2015), our interest was aimed to generate PANI consisting of periodic arrangement of amine and imine nitrogen that can possibly result in a macroscopically ordered structure. Such structures can effectively be employed as effective adsorbers of charged dye molecules. As PANI has been compared to many inorganic semiconductors and metals from the point of view of band gap, the ordered arrangement if achieved would mimic the inorganic layered compounds and could be used to correlate the structure with the adsorption property (Lei et al., 2014; Rives, 2001). Polymerization of aniline is typically achieved by chemical oxidation, electrochemical oxidation and catalytic oxidation processes (Eftekhari and Afshani, 2006; Genies et al., 1990; Liu and Zhang, 2009; Long et al., 2011; Palaniappan and John, 2008). Generally, the polymerization procedure carried out at room temperature using oxidants (inorganic salts or H2O2) or enzymes results in disordered arrangement of PANI as revealed from X-ray diffraction experiments (Bhadra and Khastgir, 2008; Bhadra et al., 2006; Pouget et al., 1991; Sanches et al., 2013). Formation of an ordered PANI has been achieved under controlled synthetic conditions following two-step processes by changing the temperature of the growth of PANI (Surwade et al., 2009; Swapna Rao et al., 2002; Tang et al., 2009). Majority of the reports have employed Fe2+/H2O2 as the catalyst/oxidant to generate nanofibres of PANI (Blaha et al., 2011; Sun et al., 1997; Wang et al., 2007), the possibility of stacking PANI chains in a particular orientation resulting in an ordered arrangement has not yet been explored. In this paper, a single-step and one-pot synthesis of ordered semi-crystalline PANI-ES by the chemical catalytic polymerization using H2O2/FeCl2·2H2O and H2O2/VO(SO4)·H2O are described. Additionally, the adsorption capacity of the resulted samples towards Methyl Orange (MO) dye has been evaluated and compared with disordered systems.
Experimental analysis
Synthesis of PANI
Five millilitres of aniline (99.0%, Merck) monomer was mixed in 200 ml of 2 M HCl. To this solution, 0.0102 g of FeCl2·2H2O (CDH, 99.0%) was added keeping the molar ratio of metal salt: aniline as 1:500. 0.01336 g of VOSO4·H2O (CDH, 96.0%) was used in place of FeCl2·2H2O. To the mixture of aniline and the metal salt, 10 ml of hydrogen peroxide (H2O2) (30 v/v %, Merck) was added. The resultant mixture was stirred for 24 h at room temperature. The colour of the solution gradually changed from pale green to dark green. The dark green coloured product was separated by filtration and washed with dilute HCl, acetone and with acetonitrile (99.8%, Merck, HPLC grade). PANI was also synthesized following the published report using potassium persulfate (KPS) as the oxidant (Tang et al., 2009). For this, 3.1 ml of (0.15 M) aniline was mixed with 20 ml of HCl (1 M). To this 60 ml of double distilled water along with 7.6 g (0.0281 mol) of KPS dissolved in 50 ml of double distilled water was added. A deep green coloured product appeared after stirring this mixture for 4 h. Further washing was done with methanol and it was dried at 60℃.
Characterization methods
Powder X-ray diffraction (PXRD) patterns of the samples were recorded using a high resolution PANalytical Empyrean diffractometer equipped with PIXcel3D detector, employing monochromatized Cu Kα radiation (λ = 1.5418 Å) with a scan rate of 1.0 s/step and step size 0.02° at 25℃. FTIR spectra of the powder samples were recorded using Perkin Elmer 2000 infrared spectrometer employing KBr disks at room temperature. The spectra were collected with 64 scans in a wavelength range of 4000–400 cm−1. Raman spectra of the samples were recorded in compact form using a Renishaw spectrometer via microscope system equipped with an Ar+ laser (λ = 785 nm). The scanning electron microscopic (SEM) images of the samples were captured using a scanning electron microscope (MIRA3 XM TESCAN). TEM images were captured using TECNAI (FEI, Electron Optics) electron microscope operating at 200 kV. Thermogravimetric (TG) traces of the samples were collected using the simultaneous TG analyser (TA instruments Q 500) in the temperature range of 30–900℃ under flowing nitrogen (50 ml/min) at a heating rate of 20℃/min. Photoluminescence spectroscopy measurements of the samples were performed at room temperature using a Cary Eclipse fluorescence spectrophotometer. UV–visible absorbance data of samples in solution form (in N-methyl pyrrolidine) were collected over the spectral range 200–800 nm using UV–visible spectrophotometer (Perkin-Elmer Lambda 35).
Adsorption experiment details
Adsorption experiments were carried out using batch method. Aqueous solution of MO (85%, Thomas Baker) dye was prepared by dissolving a known quantity of the dye in 100 ml of double distilled water. The initial dye concentration was varied from 16 to 80 mg/l. In the adsorption experiments, a predetermined amount of PANI (25 mg) was added to dye solutions of different initial concentrations. The resulting suspension was stirred at room temperature under dark conditions until the equilibrium was reached. The samples were collected from the reaction beaker followed by centrifugation. The concentration of dye after the experiment was determined from the measurement of UV–visible absorbance data collected at λmax of 464 nm. The effect of adsorbent dosage was studied by fixing the dye concentration at 16 mg/l and the amount of adsorbent was varied from 10 to 40 mg. All the adsorption experiments were performed at room temperature and the duration of 30 min has been fixed.
Results and discussion
Synthesis and X-ray diffraction analysis of PANI
Polymers in general are amorphous in nature. However, semi-crystalline state has been observed for PANI as they have been obtained mostly in salt form. For PANI, powder X-ray data in the 2θ range of 20° and above is usually reported. Only few papers described the PXRD data of PANI below 2θ of 20° and elaborated crystallographic orientations of PANI (Bhadra and Khastgir, 2008; Bhadra et al., 2006; Jozefowicz et al., 1989; Pouget et al., 1991). In some of recent reports, the reflection around the 2θ value of 6° has been observed, but they were of low intense (Ayad and Zaghlol, 2012; Zhang et al., 2016). The PXRD pattern of the PANI produced by one-pot catalytic polymerization process using H2O2 and FeCl2·2H2O is shown in Figure 1(a). Reflections at 2θ = 5.6, 20.1 and 25.5° were observed in the PXRD pattern suggestive of ordering of PANI. The reflections at 2θ = 20.1 and 25.5° have been reported to arise from the parallel and perpendicular periodicity of the polymeric chains in PANI (Tang et al., 2009; Wang et al., 2007). However, they have been related to the intense reflection at 2θ = 5.6° observed in our sample. If the reflection at d = 13.72 Å is considered as 001 (hkl) reflection, the other two intense reflections at d = 4.61 and 3.47 Å can be assigned as (002) and (003), respectively. The highly ordered arrangement of PANI in our sample can be the result of formation of linear 1D emeraldine salt arising from the doping of the PANI with HCl. Such a backbone often can induce the self-assembly of PANI fibres.
(a) PXRD pattern, (b) FTIR, (c) Raman and (d) TGA and DTG of PANI synthesized using H2O2 and FeCl2·2H2O. DTG: Derivative thermogravimetric plot; FTIR: Fourier transform infrared spectroscopy; PANI: polyaniline; PXRD: powder X-ray diffraction; TGA: Thermogravimetric analysis.
FTIR spectrum of the sample suggested the PANI to be in emeraldine salt form (Figure 1(b)). Bands in the region 1550–1560 and 1490–1500 cm−1 were assigned to the ring stretching vibration of quinoid and benzenoid rings, respectively. Peaks positioned around 1300 cm−1 were due to the (C–N) stretching of secondary aromatic ring. A weak shoulder at 1230–1240 cm−1 was assigned to the stretching of polaron (C–N–C) (Huang et al., 2014). Intense broad peak observed at 1140–1180 cm−1 arise due to vibration mode of (B-NH+=Q) or (B-NH+-B) states and it is characteristic of doped ES form (Bhadra et al., 2006; Zhang et al., 2011). Peak at 3220 cm−1 could be attributed to the N–H stretching mode arising from the hydrogen bonding interaction. IR peaks in the region 800–900 cm−1 were mainly due to the p-disubstituted benzene intermediates formed during polymerization of aniline (Ayad and Zaghlol, 2012; Li and Wang, 2004; Tang et al., 2009). The appearance of these bands hinted the propagation of polymerization in a linear head-to-tail fashion (Bhadra et al., 2006). Further confirmation of the formation of ES form of PANI has been sought from Raman spectroscopy. Intense bands positioned at around 1600 cm−1 were due to the C–N stretching and were typical of the ES form of PANI (Figure 1(c)). Appearance of bands in the regions 1330–1345 and 1380–1400 cm−1 could be attributed to the –(C–NH+) stretching of polarons and bipolarons (Bhadra et al., 2006). Following the literature, characteristic Raman bands due to EB form (1240 cm−1 (ν(C–N)) and 1464 cm−1 (ν(C=N))) were absent in our sample. Additionally, the bands at 1171 cm−1 indicated the vibration modes of ES form (δ(C-H)), confirming our sample to be ES form of PANI (Blaha et al., 2011). Other bands at 409, 448 and 519 cm−1 could be assigned to wagging and deformation modes of (C–N–C) bond. In Figure 1(d), TGA and DTG traces of the PANI sample are presented. Thermal stability up to 300℃ was exhibited by this sample which was higher than the degradation temperature reported for disordered samples (Chan et al., 1989). From the DTG traces, the presence of five-step mass loss (for the ordered PANI) was noticed. The first step till 68℃ might be due to the departure of moisture from the sample. Removal of the acid dopant and evolution of other thermolabile components (such as small oligomers) occurred in the second step spanning between 150 and 230℃ (Bhadra and Khastgir, 2009; Chan et al., 1989). In the third step (300–340℃), degradation of polymer took place. PANI synthesized using H2O2 and VOSO4·H2O also produced a similar ordered arrangement signifying the semi-crystalline nature of the sample with its FTIR, Raman spectroscopic results and the thermal behaviour being more or less similar to the PANI produced using H2O2 and FeCl2·H2O (Figure 2(a) to (d)). SEM images of the samples obtained using H2O2 in the presence of co-catalysts FeCl2·2H2O and VOSO4·H2O are presented in Figure 3. The fibrous morphology of the samples was quite evident and it suggested that stacking of these fibres might be leading to the observed ordering in PXRD patterns. Generally, fibrous morphology of PANI has been reported whenever H2O2 was used together with heating or sonochemical conditions (Blaha et al., 2011). The fibrous morphology of PANI was also evident in the TEM image of the sample (Figure 4).
(a) PXRD pattern, (b) FTIR, (c) Raman and (d) TGA and DTG of PANI synthesized using H2O2 and VOSO4·H2O. DTG: Derivative thermo gravimetric plot; FTIR: Fourier transform infrared spectroscopy; PANI: polyaniline; PXRD: powder X-ray diffraction; TGA: Thermogravimetric analysis. SEM images of PANI synthesized using H2O2 and with co-catalysts (a) FeCl2·2H2O and (b) VOSO4·H2O. PANI: polyaniline; SEM: scanning electron microscope. TEM image of PANI synthesized using hydrogen peroxide (H2O2) and ferrous chloride (FeCl2·2H2O). PANI: polyaniline; TEM: Transmission Electron Microscopic image.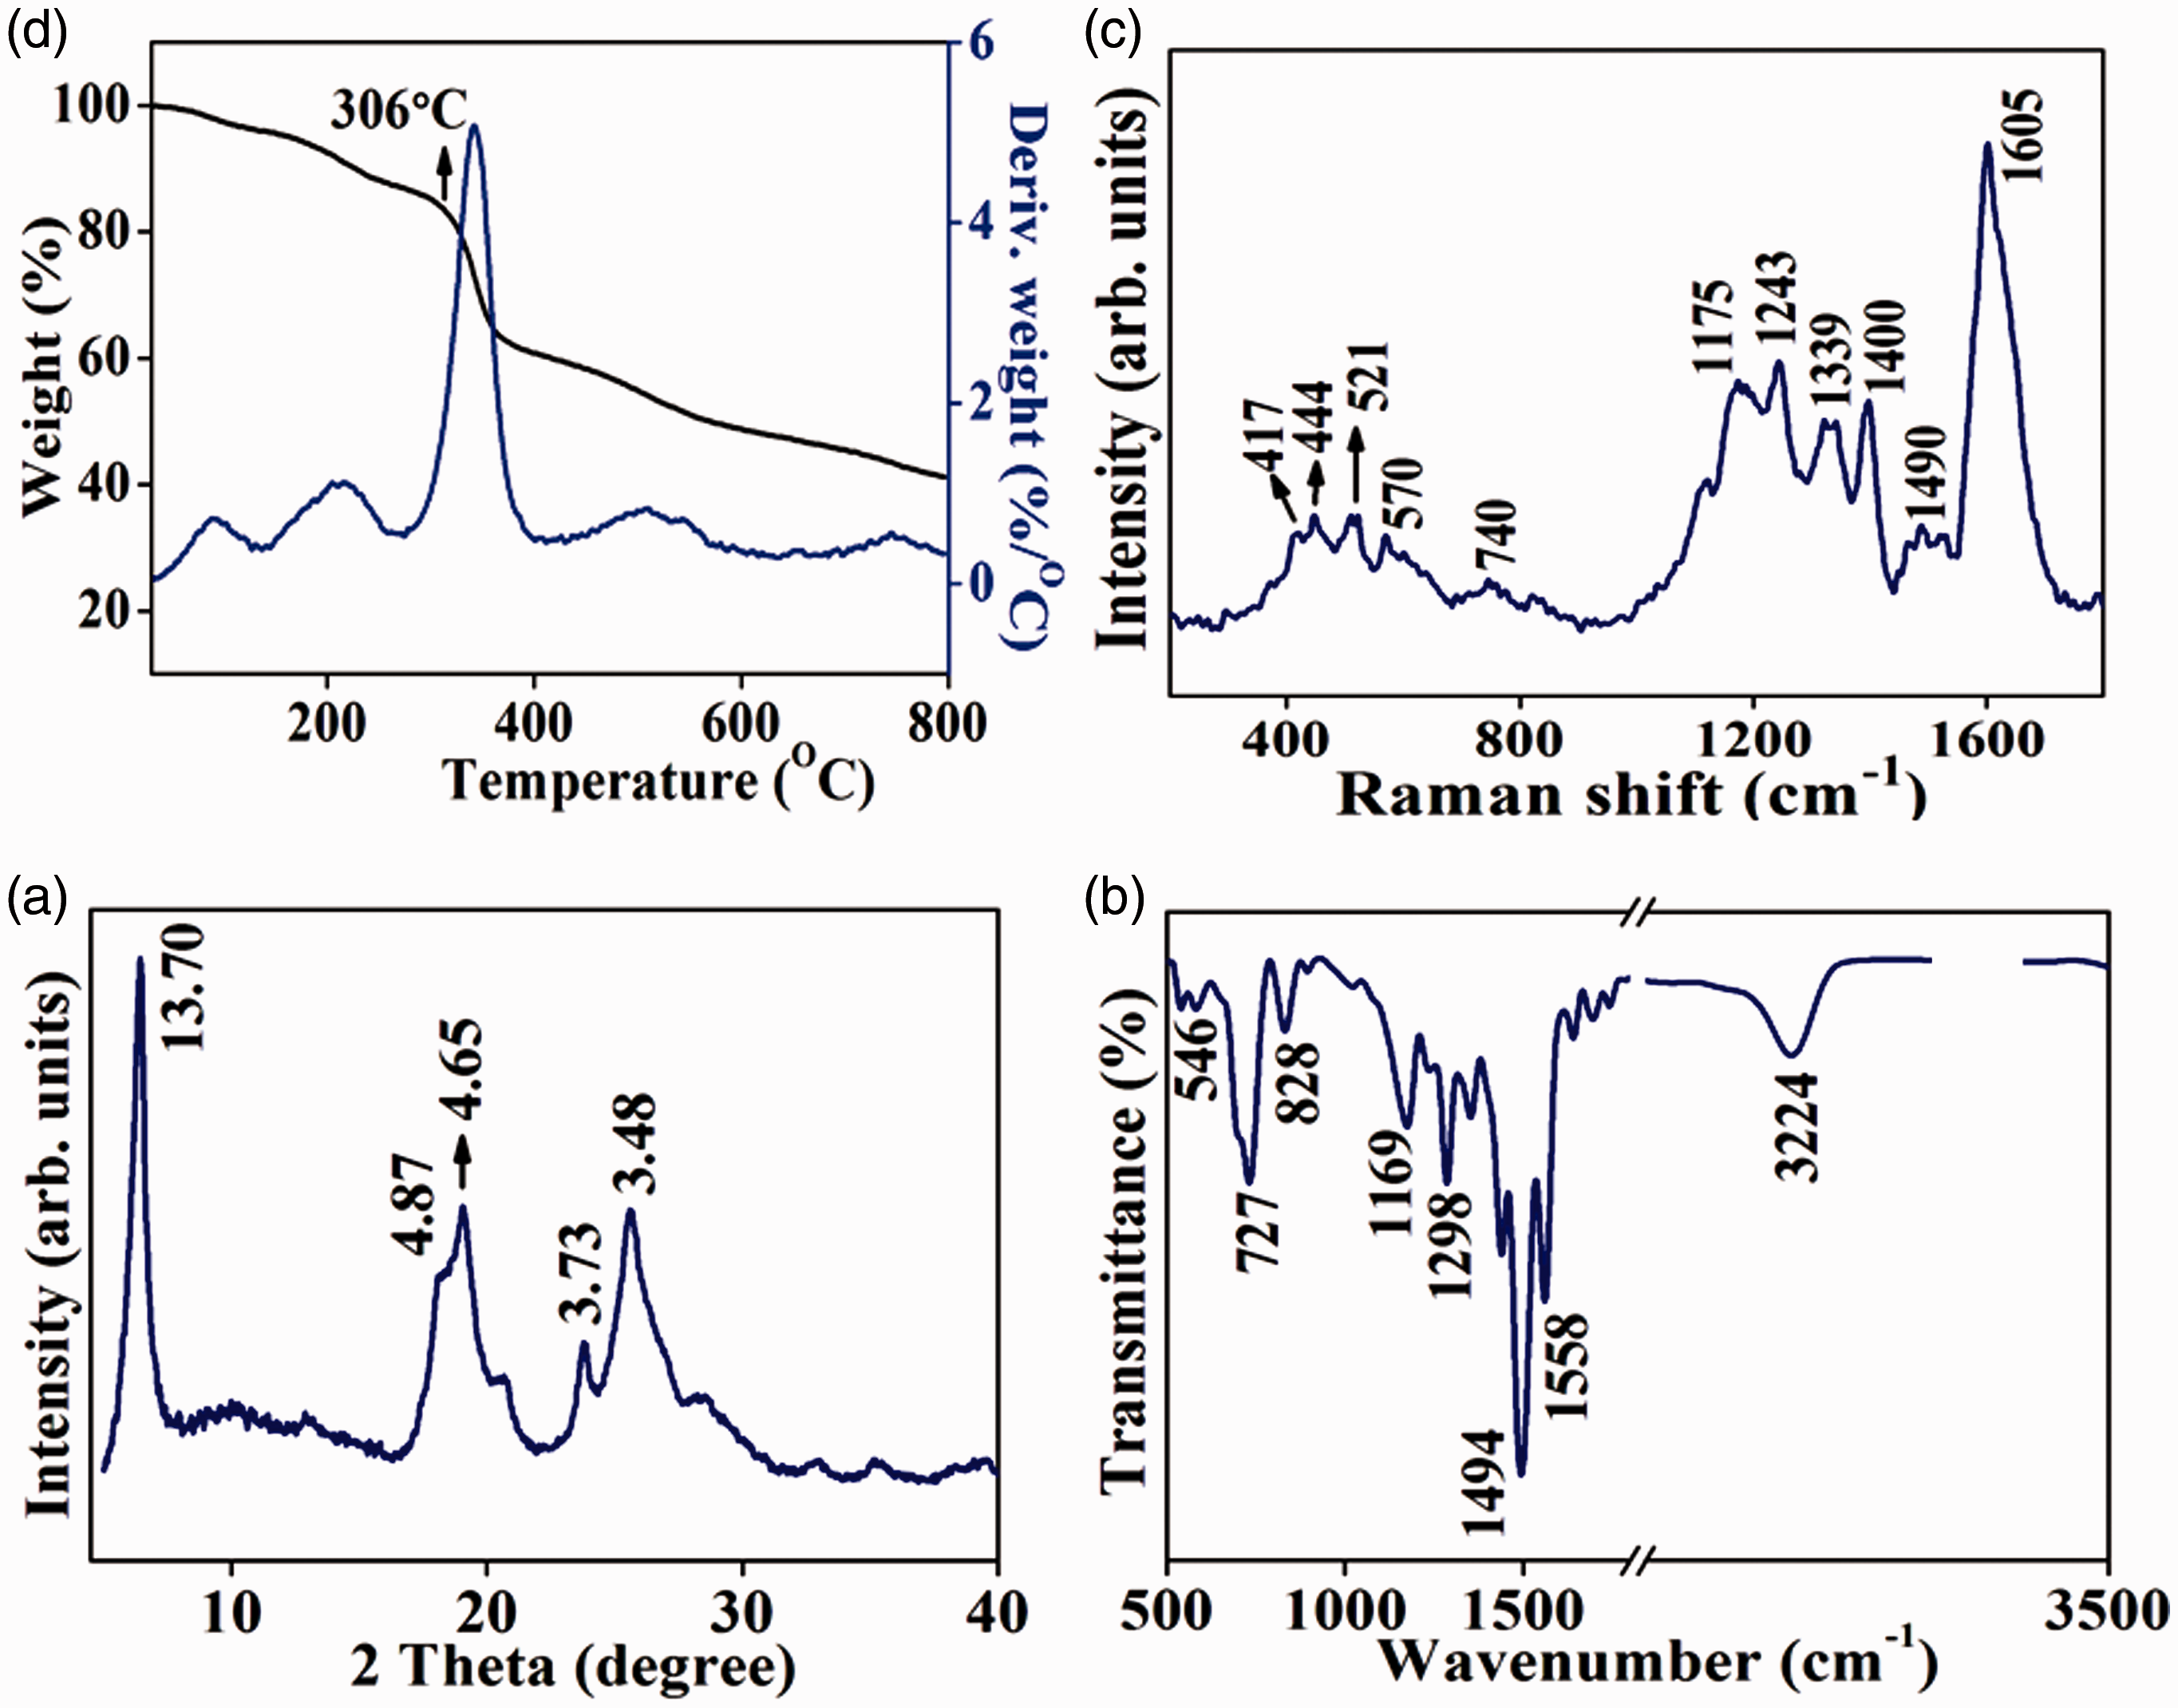


The UV–visible absorption spectra of the ordered PANI obtained (using FeCl2·2H2O as well as VOSO4·H2O as co-catalysts) are presented in Figure 5. The spectral features closely resembled with the data available in the literature (Blaha et al., 2011; Sun et al., 1997; Zhang et al., 2016). A maxima in the region of 340–390 nm assignable to the (π–π*) transition (B-band), followed by a band at 614 nm (Q-band) were observed for the sample obtained using H2O2 and FeCl2·2H2O. The Q-band is considered as exciton-like transition from the highest occupied level centred on the benzenoid rings to the lowest unoccupied energy level centred on quinoid units (Shimano and MacDiarmid, 2001). It showed a blue shift to 570 nm for the PANI sample prepared using H2O2 and VOSO4·H2O, suggesting a possible change in the ratio of the benzenoid and quinoid units in it. The reduced intensity of the Q-band was attributed to the quenching effect caused due to the doping of the quinoid rings by the chloride ion in the emeraldine salt form (Blaha et al., 2011).
UV–visible spectra of PANI (in NMP solution) synthesized using H2O2 with FeCl2·2H2O (in black) and VOSO4·H2O (in blue) as co-catalysts. NMP: N-methyl pyrrolidine; PANI: polyaniline.
Adsorption of MO dye by PANI-ES sample
It is conceived that higher affinity towards the exposed regions of amine and imine units present in the ordered PANI may promote higher affinity of charged dyes and thus resulting in efficient adsorption of molecules. With this idea, adsorption of MO dye molecule containing sulphonic acid groups by ordered and disordered PANI was investigated. The studies available in the literature on the use of PANI as dye adsorber have been centred on the disordered PANI (Ayad and El-Nasr, 2010; Mahanta et al., 2008, 2009). In Figure 6, the results from the adsorption experiments are presented. The ordered sample adsorbs faster than the amorphous PANI illustrating the advantage of an ordered arrangement for adsorption. The removal efficiency is studied using percentage removal capacity.
(a) and (b) Plot of absorbance of MO dye versus wavelength in the presence of ordered PANI (synthesized using FeCl2·2H2O and H2O2; VOSO4·H2O and H2O2) at various time intervals and (c) plot of absorbance of dye using disordered PANI (synthesized using K2S2O8) at various time intervals, i.e. at t = 0 min (black), t = 30 min (red), t = 60 min (green) and t = 90 min (navy blue). MO: methyl orange; PANI: polyaniline
The percentage removal (R %) of dye was calculated using the following relationship

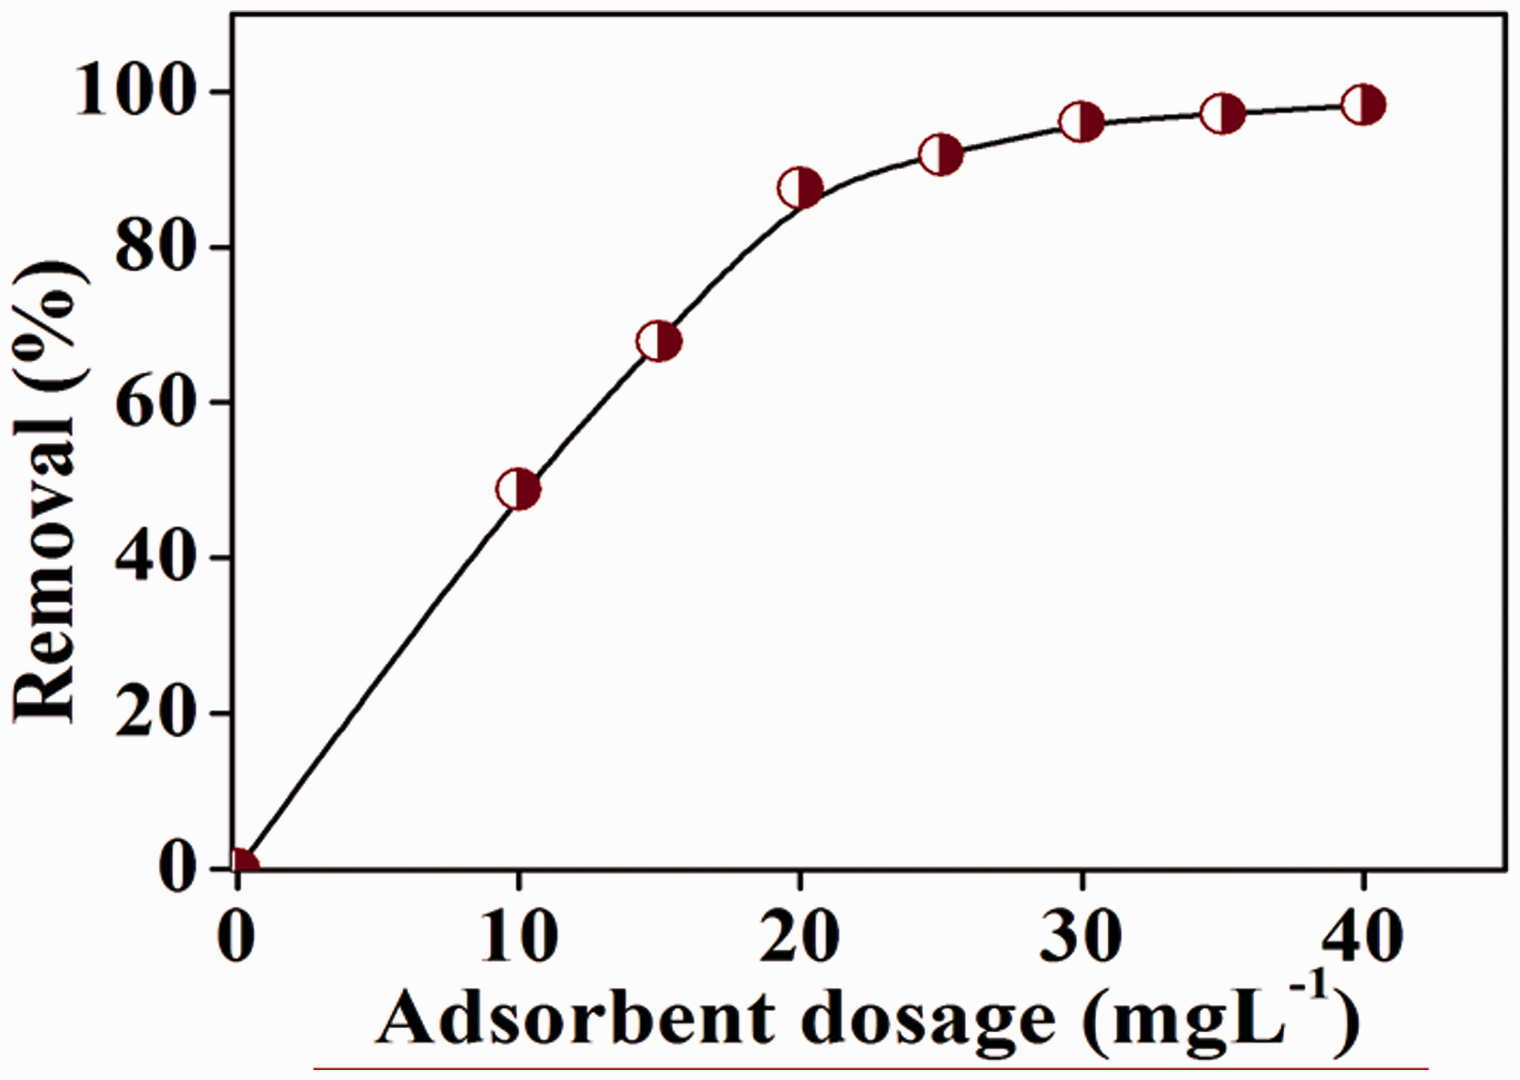
Figure 7 shows the concentration profile of the dye at specified time intervals for all the three samples illustrating the achievement of adsorption equilibrium for the ordered PANI sample. Nearly 93% of dye was adsorbed within 30 min by the sample as compared to the disordered one (44% of dye in 30 min). This reinforced that ordered PANI might possess higher surface area, providing large number of basic sites for the dye molecules. By this way, enhanced adsorption capacity was exhibited by the ordered PANI. Results from the adsorbent dosage variation study showed that on increasing the amount of adsorbent there was an increase in the dye removal efficiency till the attainment of equilibrium state (Figure 8). The amount of MO dye increased from 48% to almost 96% when the adsorbent dosage was increased from 10 to 30 mg, beyond which the adsorption equilibrium was attained indicating maximum filling of the basic sites in the PANI.
Concentration profile of the adsorption of MO dye using ordered PANI synthesized using H2O2 and FeCl2·2H2O (in black) and amorphous PANI synthesized using K2S2O8 (in red). MO: methyl orange; PANI: polyaniline. Effect of adsorbent dosage (ordered PANI synthesized using H2O2 and FeCl2·2H2O) on MO dye adsorption. MO: methyl orange; PANI: polyaniline.
To further examine the adsorption efficiency, the adsorption experiments with different initial dye concentration were carried out for a fixed time interval. The results from these experiments are shown in Figure 9. It was evident that even 25 mg of adsorbent could successfully remove approximately 50% of the dye from a concentrated dye solution (80 mg/l).
Effect of initial dye (MO) concentration on adsorption using ordered PANI (synthesized using H2O2 and FeCl2·2H2O). MO: methyl orange; PANI: polyaniline.
The degree of ionization of the dye molecule depends on the pH of the solution. On adding PANI-ES to the dye solution, the pH may be decreased to reach acidic range. The addition of sulphonated dye (MO) to the acidic solutions may be promoting complete ionization of it. The exposed anionic sulphonate group might possibly interact with the positively charged imine nitrogen of the doped PANI chains (Patra and Majhi, 2015). This electrostatic force of attraction might be the main driving force leading to the enhanced adsorption of the investigated dye. Therefore, the presence of PANI in salt form plays a crucial role in bringing down the pH to the acidic range as against the EB form (Shimano and MacDiarmid, 2001). The PXRD patterns of PANI before and after the use in adsorption experiments are presented in Figure 10. No significant difference in the crystallinity and/or ordering of the polymer was noticed after adsorption. This negated the possibility of secondary doping of PANI by the dye molecules.
PXRD patterns of PANI emeraldine salt before (in black) and after (in blue) adsorbing MO dye molecule. MO: methyl orange; PANI: polyaniline; PXRD: powder X-ray diffraction.
Conclusions
One-pot oxidation of aniline with H2O2 in the presence of ferrous chloride as co-catalyst produced highly ordered arrangement of HCl-doped PANI fibres. Such ordered arrangement also resulted for samples made using VOSO4·H2O as a co-catalyst with H2O2. Taking advantage of the ordered amine and imine units in PANI, its effective role as a remover of MO dye by adsorption process at room temperature has been demonstrated. Such efficient removal was not observed with PANI obtained from established procedures. The results from the present study can be extended as an additional tool to make use of PANI as an effective sensor for the removal of dye molecules.
Footnotes
Acknowledgements
The usage of facilities of CIF is gratefully acknowledged.
Declaration of Conflicting Interests
The author(s) declared no potential conflicts of interest with respect to the research, authorship, and/or publication of this article.
Funding
The author(s) disclosed receipt of the following financial support for the research, authorship, and/or publication of this article: Authors thank University of Delhi and DU-DST PURSE grant for the financial assistance to carry out this work. One of the authors, PC thanks UGC, Govt. of India for the fellowship support