
Abstract
Adsorption of the gold–thiosulfate complex ion (
Introduction
Activated carbons (ACs) are highly porous carbonaceous materials that possess a unique set of properties: a well-developed reproducible microporous structure, a large internal surface area, a high degree of surface reactivity, and an adsorption capacity that makes them effective and versatile adsorbents (Hu et al., 2000; Lee et al., 2006; Poinern et al., 2011). In the gold hydrometallurgy industry, AC is used for the adsorption of Au(I) in the form of


The thiosulfate system extracts gold from carbonaceous ores; however, the gold–thiosulfate complex does not effectively adsorb onto AC. This renders the widely accepted CIP or CIL technology useless for the thiosulfate system (Zhang and Dreisinger, 2002). Early research also confirmed that AC (in its pristine form) does not adsorb the gold–thiosulfate complex. Mohansingh (2000) studied the adsorption of gold onto AC by varying parameters and varying the concentration of different species in solution and found that gold from copper–ammonium–thiosulfate solution did not adsorb well onto AC and the maximum adsorption capability of gold on AC was 0.267 kgt−1 AC by calculation. Kononova et al. (2001) also studied sorption recovery of gold from thiosulfate solutions with a concentration of 9.5–17.9 mgl−1 after leaching of products. The maximum recovery percentage of gold on AC was 16.9%, possibly because of the high anionic charge of the thiosulfate complex and the bulkiness of the thiosulfate ions compared to gold cyanide. Yu et al. (2015) fabricated AC impregnated with cupric ferrocyanide species to recover the gold from thiosulfate solution. However, the whole adsorption capacity was lower and the adsorption mechanism is not clear, which is not ideal for commercial applications. In this paper, adsorption of the gold–thiosulfate complex ion (
Experimental
Materials
The silver ferrocyanide-impregnated AC used in this work, AC-Ag-R-FC (AC: activated carbon, Ag: silver nitrate, R: heating, FC: potassium ferrocyanide), was prepared in our laboratory. The details of the preparation of this adsorbent have been described later. A commercial coconut shell AC was also used in this work for the adsorption of
The reagents of sodium thiosulfate (
Methods
Preparation of AC (AC-Ag-R-FC-modification)
There grams of adsorbent were placed in a 50 ml beaker with 20 ml of 1–100 m mol l−1
Then, 1–20 m mol l−1

Preparation of
First, 1 mol l−1
Adsorption tests
The tests of the adsorption of

pH
The effects of variable pH on adsorbent performance was conducted with 1.0 g of each adsorbent added to 100.00 ml of 10 mgl−1
Point of zero charge (PZC) measurements
The pHpzc (pH value at which the surface has a zero net charge) was determined by the so-called pH drift method (Guedidi et al., 2013). The pH of deoxygenized
Apparatus
Chemical analysis
AAS-300 (PerkinElmer, USA) atomic absorption spectrometry with deuterium background corrector and hollow cathode lamp was used. The operating conditions were as follows: Au: wavelength, 328.07 nm; slit width, 2.71 nm; lamp current, 10 mA; Ag: wavelength, 328.1 nm; slit width, 1.3 nm; lamp current, 10 mA.
Morphology
Scanning electron microscopy (SEM) was used to characterize the morphology. Samples were deposited on graphite plates and examined by a LEO 1530 electron microscope.
The surface area and porosity properties of the absorbents were determined by nitrogen (
X-ray photoelectron spectroscopy (XPS)
XPS measurements were performed using a ULVAC-PHI Inc. XPS instrument. This system used a focused monochromatic Al–Kα X-ray source for analysis. Initially, a survey scan identified all the detectable elements, through a high generation energy and a short dwell time (Boudou et al., 2003). Next, the instrument conducted narrower and more detailed scans of selected peaks, so as to quantify chemical state information with a low generation energy and a long dwell time. XPS data have provided information on the surface chemical nature of the functional groups through analysis of the C 1s, N 1s, O 1s, Fe 2p, S 2p, Ag 3d, and Au 4f spectra. After baseline subtraction, the curve fitting was performed assuming a mixed Gaussian–Lorentzian peak shape (the ratio of Gaussian to Lorentzian form was equal to 0.3). The C 1s electron binding energy corresponding to graphitic carbon was referenced at 284.8 eV for the calibration (Guedidi et al., 2013).
Results and discussion
The preparation of AC
Through preliminary exploration experiments that design a typical synthesis, 3 g AC was placed in 20 m mol l−1
To compare the effects on gold adsorption of AC with different degrees of modification, we designed five different modification processes: AC-Ag, AC-Ag-R, AC-Ag-R-FC, AC-AgFC, AC-FC (AC: activated carbon, Ag: silver nitrate, R: heating, FC: potassium ferrocyanide). From Figure 1, the results of these experiments show that the recovery rate of gold on the carbon in AC-Ag-R-FC was the highest (up to 70.89%). The AC treated with The effects of the AC modification process on the recovery percentage of gold (0.01 mol l−1 
Characterization of ACs
Figures 2 and 3 show the N2 adsorption–desorption isotherms and PSDs of carbon samples, respectively. Surface area and pore volume properties are summarized in Table 1. From the N2 isotherms (Figure 3), it is evident that the different processing approaches do not affect the isotherm shape; they are typical of microporous–mesoporous adsorbents (type I and IV in the IUPAC classification) with a hysteresis loop (H4 types) in the desorption branch at relative pressure ratios of approximately 0.5. According to the classification of the IUPAC, the diameter of adsorbent pores is as follows: less than 2 nm is micropores, between 2 and 50 nm is mesopores, and more than 50 nm is macropores (Njoku and Hameed, 2011). The average pore width of the absorbents was found to be approximately 2.8 nm (Table 1), which indicates mesoporosity. The PSD of the absorbents displayed in Figure 3 indicates that most of the pores are in the micropore and mesopore range.
Adsorption–desorption isotherms of N2 at 77.4 K on activated carbon prepared at different conditions. Pore size distribution for activated carbon prepared at different conditions. Textural characteristics of activated carbons prepared at different conditions. AC: activated carbon; BET: Brunauer–Emmett–Teller; Ag: silver nitrate, R: heating, FC: potassium ferrocyanide. Surface area of BET. Total pore volume of BET.


The N2 isotherms at 77 K exhibited a considerable decrease of the BET surface area (Table 1, SBET = 958.4 m2 g−1 for AC-AgFC, 902.7 m2 g−1 for AC-FC, 830.1 m2 g−1 for AC-Ag, 1019 m2 g−1 for AC-Ag-R, and 1044 m2 g−1 for AC-Ag-R-FC) of the modified carbon compared to the pristine AC (SBET = 1946 m2 g−1). As can be observed from SEM (Figure 4), the decrease in the specific surface areas after modification was related to reagent deposition on the surface of AC or pore collapse. Additionally, the specific surface area of heated AC is larger than that observed for other types of sorbents. As shown in Table 1, heating can increase both the average pore diameter of the AC and the specific surface area.
Scanning electron microscope (SEM) micrograph of activated carbon at different conditions (AC-Ag-R-FC-Au: the AC-Ag-R-FC after adsorption of gold). (a) AC, (b) AC-Ag-R-FC, and (c) AC-Ag-R-FC-Au. AC: activated carbon, Ag: silver nitrate, R: heating, FC: potassium ferrocyanide.
Figure 4 illustrates the exposed porosity and surface morphology as measured by SEM. SEM images of AC, AC-Ag-R-FC, and AC-Ag-R-FC-Au show that the pores of AC-Ag-R-FC collapse and deposit particles of native silver (Ag) and
Adsorption tests
Effects of the pH in artificial aqueous solution
As can be observed from the results shown in Figure 5(a), the pH variation affected gold adsorption (i.e. the recovery percentage of gold was severely promoted at the lower pH values) and then started to level off at pH ≥ 7.0. Figure 5(b) shows that the pHzpc value of 7.25 was obtained for AC-Ag-R-FC, so that for pH values lower than pHpzc, the adsorbent presented a positive surface charge that promoted the adsorption of The effects of the pH in artificial aqueous solution on the recovery percentage of gold (10 mg l−1 of 
Effect of gold concentration and temperature
We performed experiments at different temperatures and initial gold concentration with the purpose of determining the adsorption capacity of AC-Ag-R-FC for The effects of gold concentration on the recovery percentage of gold at different temperatures in artificial aqueous solution (pH = 8.5).
Adsorption isotherm
To examine the relationship between adsorbed (qe) and aqueous concentration (ce) at equilibrium, sorption isotherm models are widely employed for fitting the data, of which Langmuir and Freundlich equations are most widely used. The Langmuir model supposes that adsorbate substances was monolayer adsorption, and no interaction between adsorbed substances on homogeneous surface (Gonen et al., 2004). Freundlich model is suitable for nonideal adsorption on heterogeneous surfaces (Al-Othman et al., 2012). The heterogeneity is caused by the presence of different functional groups on the surface and various adsorbent–adsorbate interactions. In order to obtain the equilibrium data, sorption experiments on AC-Ag-R-FC, in which initial
Each Adsorption isotherm testing was implemented after 1.0 g of AC-Ag-R-FC was added into 100 ml of solution, which contains 20, 30, 50, and 100 mgl−1 of 

Figure 7 shows the plots of 1/c versus 1/qe for the Adsorption isotherm of the complex ion Adsorption isotherm model parameters of the complex ion AC: activated carbon, Ag: silver nitrate, R: heating, FC: potassium ferrocyanide.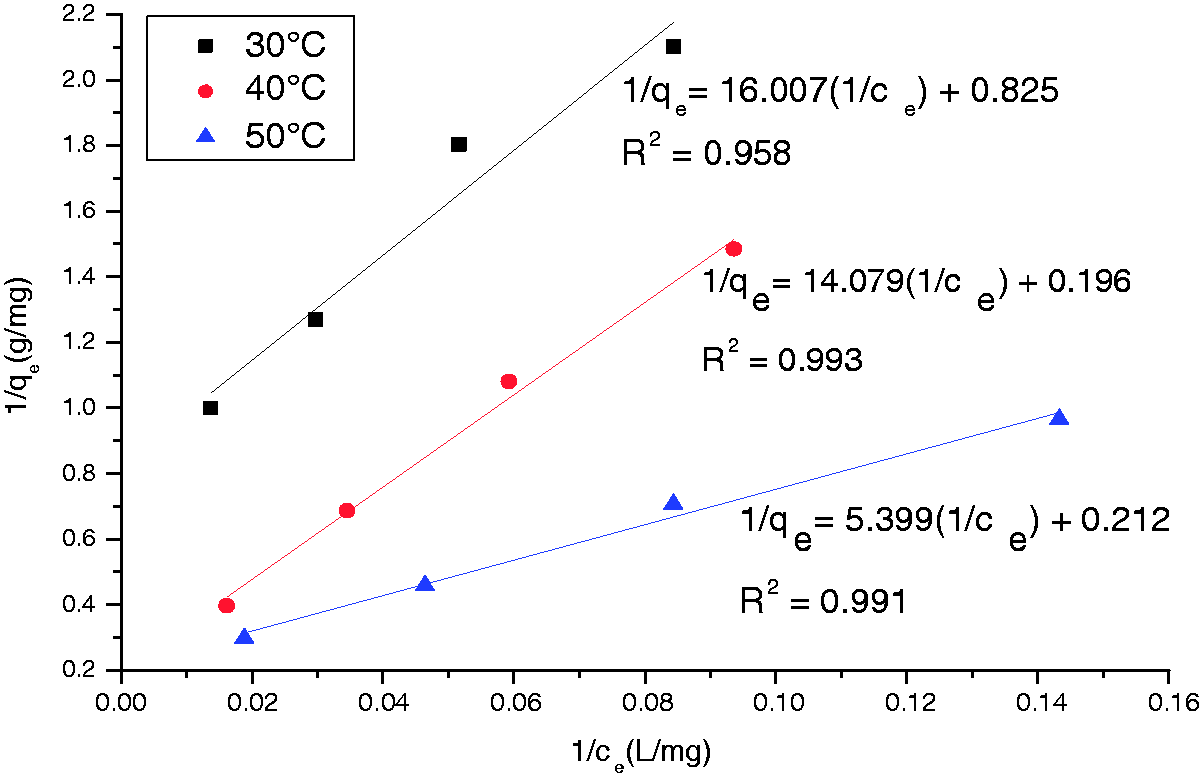

Figure 8 shows the plots of logce versus logqe for the Adsorption isotherm of the complex ion 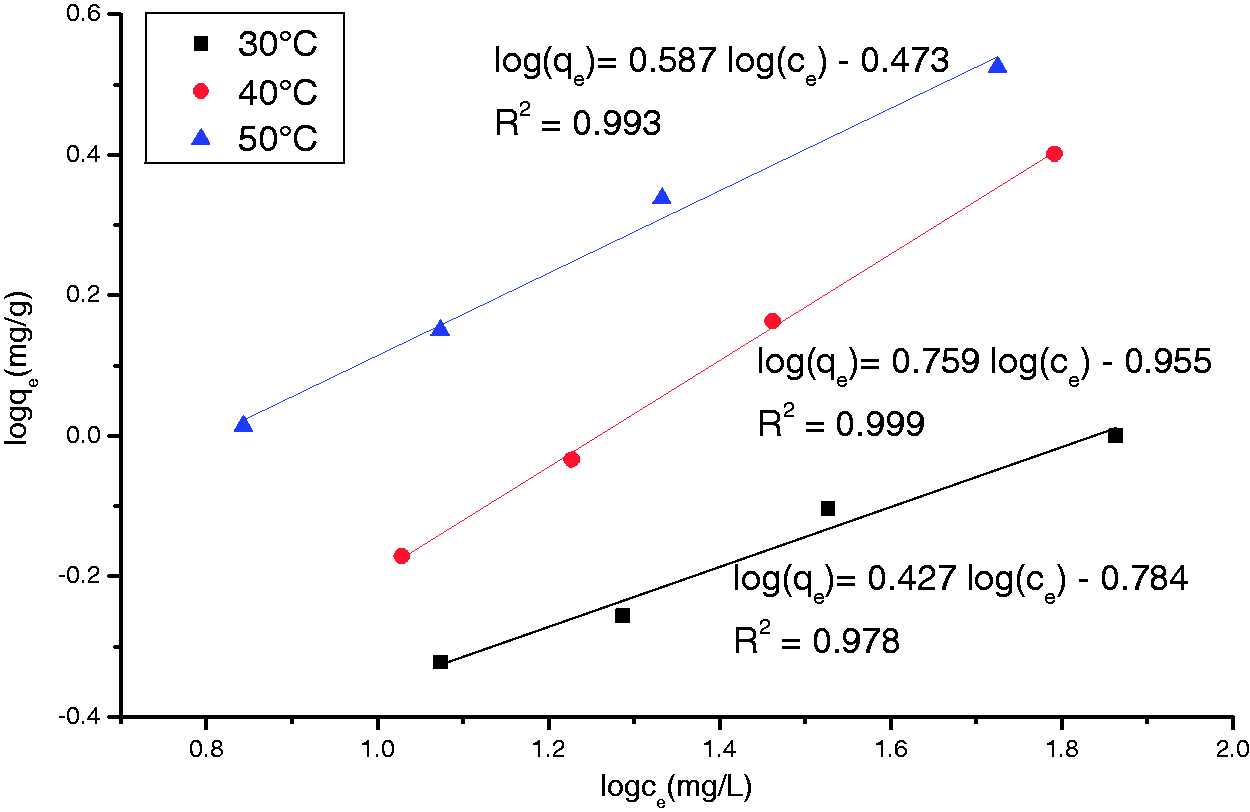
As can be observed from Figures 7 and 8 and Table 2, the
Adsorption kinetics
Adsorption kinetics can provide valuable information about the reaction pathways and mechanism of the reactions. Pseudo-first-order, pseudo-second-order models, and the intraparticular diffusion model were tested for their abilities to describe the process of 


Figure 9(a) to (c) shows the pseudo-first-order kinetic model, pseudo-second-order kinetic model, and intraparticle diffusion model of Adsorption kinetic model of Adsorption kinetics model parameters of the complex ion AC: activated carbon, Ag: silver nitrate, R: heating, FC: potassium ferrocyanide.

Generally, the intraparticle diffusion models possess two lines that attributed to phenomena such as initial surface adsorption and subsequent intraparticle diffusion. It was reported that sole limiting step of intraparticle diffusion needs respective plot of qt versus t1/2 pass through the origin (C value to be zero) (Ghaedi et al., 2013). The values of C (intercept) highly depend on the amount of adsorbent and initial gold concentration. Figure 9 and Table 3 (the values of C) suggested the linear portion of the curve does not pass through the origin. It may be concluded that the adsorption mechanism of this adsorbate is a rather complex process and that the intraparticle diffusion was not the only rate-controlling step (Al-Othman et al., 2012).
Adsorption mechanism
To understand the adsorption mechanism, surface chemical groups of the AC were also characterized by XPS. Figure 10 presents the C 1s, N 1s, O 1s, Fe 2p, Ag 3d, S 2p, and Au 4f spectra of treated AC before and after adsorption of the gold–thiosulfate complex. Deconvolution of the C 1s, N 1s, O 1s, Fe 2p, Ag 3d, S 2p, and Au 4f spectra resulted in several peaks as shown in Figure 10 and the signal attribution shown in Table 4.
XPS analysis of AC-Ag-R-FC and AC-Ag-R-FC-Au. AC: activated carbon, Ag: silver nitrate, R: heating, FC: potassium ferrocyanide. The XPS analysis of AC-Ag-R-FC and AC-Ag-R-FC-Au. AC: activated carbon, Ag: silver nitrate, R: heating, FC: potassium ferrocyanide.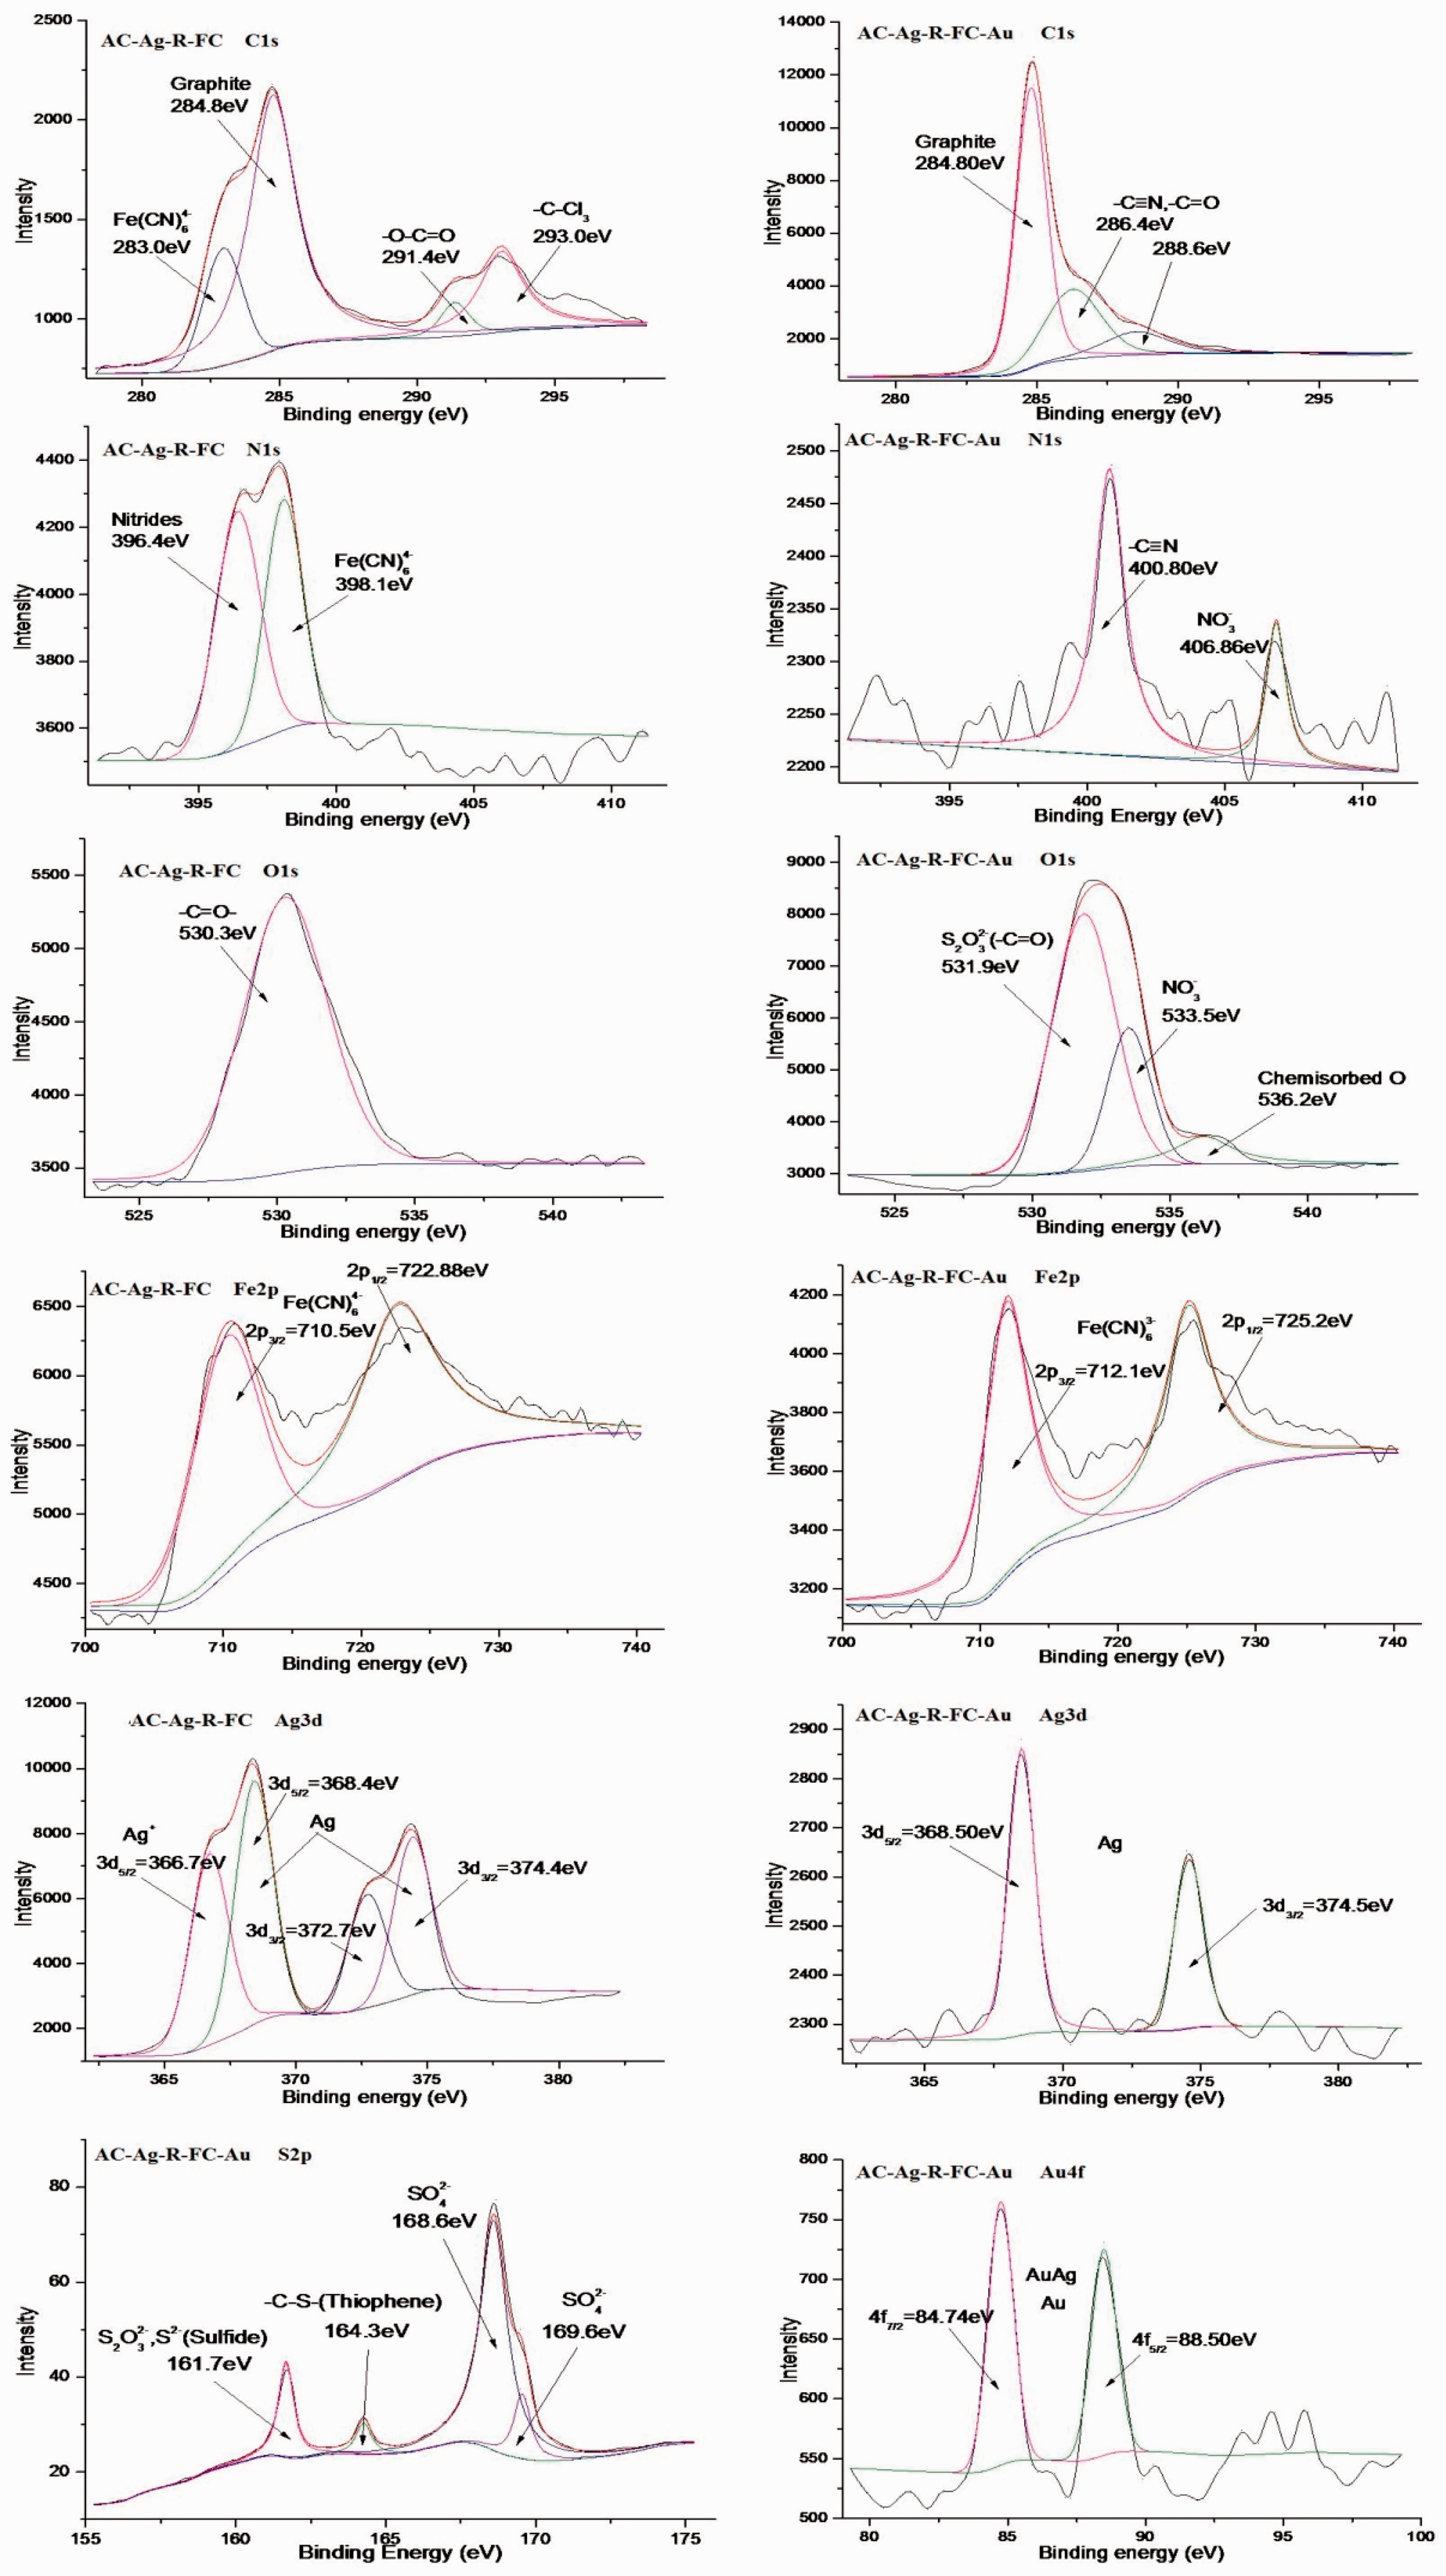

As shown in Figure 10 and Table 4, comparison of the XPS core-level detailed scans of carbon before and after use in the solution showed that the spectra of C 1s, N 1s, and Fe 2p were altered and that the energy increased; this may be caused by the transformation of
Harish et al. (2011) reported that a redox reaction occurs between gold(III) chloride and potassium hexacyanoferrate(II) leading to the formation of a charge transfer band and the conversion of hexacyanoferrate(II) to hexacyanoferrate(III) (as evidenced by the emergence of new absorption peaks in UV–Vis spectra) and that the Au complex may be , which is not feasible via a simple chemical or electrochemical reaction (Machado et al., 2011). In the adsorption process at lower pH (pH < 7.2), 


In equations (10) and (11), x = 1, y = 3. The chloride ion of equations (12) and (13) which acted as catalytic is from the preparation of gold–thiosulfate complex.
This adsorption mechanism might occur by two cases: At first, the gold–thiosulfate complex concentration on surface of modified AC increased by surface forces, then (i) under acidic conditions, the adsorbed
Conclusions
The test results and mechanism of adsorption predict that AC-Ag-R-FC is a promising material for use in
Footnotes
Authors’ contribution
FZ and XH contributed equally to this work.
Acknowledgements
Talent Startup Project of Kunming University of Science and Technology (14118602, KKSY201307056); Research Center for Analysis and Measurement, Kunming University of Science and Technology (20150308); Young Scholar of the graduate student in Yunnan province in 2015.
Declaration of Conflicting Interests
The author(s) declared no potential conflicts of interest with respect to the research, authorship, and/or publication of this article.
Funding
The author(s) disclosed receipt of the following financial support for the research, authorship, and/or publication of this article: This work was financially supported by the National Natural Science Foundation of China (51674128).