
Abstract
The methods of low-temperature 1H NMR and IR spectroscopy, densitometry, and adsorption from solutions are applied to study the influence of “wetting–drying” compaction on the adsorptive characteristics of the nanosilica A-300 in relation to water and gelatin. It was shown that if the bulk density changes from 0.05 to 0.25 g/ml, the protein adsorptive capacity of the nanosilica decreases no more than by 30%, which, apparently, is connected with the decrease of the part of the surface, available for the protein molecules. Interfacial energy in relation to water increases from 37 to 52 mJ/m2 if the bulk density increases and this is connected with the increase of the contribution from minor clusters (nanodrops) adsorbed on the surface water.
Introduction
Nanosilicas, obtained under the high-temperature hydrolysis of the silica chloride in hydrogen–air flame, have been used for years as enterosorbents and mineral fillers of the pharmaceutical forms (Blitz and Gun’ko, 2006; Degussa, 1997; Gun’ko et al., 2001). They represent hierarchical structure formation wherein the primary SiO2 particles range within the size of few nanometers. During the process of synthesis, the primary particles agglutinate, resulting in the formation of aggregates and agglomerates, thus resulting in the linear dimensions of few microns.
Sorptive characteristics of nanosilica in biological fluids depend on its ability to bound protein molecules. The standard protein, to measure the protein adsorptive capacity of nanosilicas, is gelatin (Bergna and Roberts, 2005; Dawson et al., 1986; Pharmacopeia article 42U-82/224-889-00 Siliks). In organisms, the proteins that should be removed developed as a result of necrotic phenomena. Hence, in such case different types of toxicosis of gastrointestinal tract appear in the form of complexes with low-molecular toxic substances. Effective removal of proteins from the zone of wound infection or gastrointestinal tract is fundamental for the wide usage of the enterosorbents on the basis of nanosilica in medicine. Amorphous nanosilica is permitted for use without any restriction in medicine and food industry as food additive E551 by itself. It displays adaptogenic and immunomodulatory characteristics and is advantageous for fight against internal infection due to the high adsorption capacity to protein toxins (Blitz and Gun’ko, 2006; Gerashchenko, 2014; Kulik et al., 2012). Also, another promising direction of the biomedical appliance of nanosilicas is the creation of composite materials, which include silica and immobilization of any medicinal substances on its surface (Chuiko and Pentyk, 1998).
One of the leading methods to produce nanocomposite materials on the basis of silica is the impregnation of dry silica powder by aqueous or organic solution of biologically active substances, succeeded by the removal of solvent from the formed composite. However, in the process of dehydration the compaction of silica occurs by several times due to the change of gaps between its particles and decrease in the volume of internal hollownesses within the aggregates. Hence, the objective of the present study is to investigate the influence of the wet silica powder compaction followed by the dehydration of them on the adsorptive characteristics and structure of the hydrated film of silica particles.
Materials and methods
Materials
One run tests on the nanosilica A-300 with the specific surface of 295 m2/g (in accordance with the manufacturer’s certificate), produced on the Kalush Pilot Plant of the Chuiko Institute of Surface Chemistry. The bulk density of the initial silica was 45 mg/ml. Damp silica powder was prepared by adding required amounts of water in the range between C(H2O) = 0.3 and 5 g/g to the initial substance. This range corresponds to the wetting of the sample until the beginning of the gelling process. Silica balancing by water has been performed under its rapid mixing over a period of 0.5 h, succeeded by holding it in wet condition for three days. Then the damp samples were dried at a temperature of 450 K for almost 6 h (further “wetting–drying” compaction). Higher temperatures are due to inappropriate use of the growth of specific energy consumption. Bulk density was determined by volumetric method. In this, 25 ml of silica (after air dried) was poured into 100 ml of graduated glass cylinder and was weighed by electronic scales with relative mean errors ±0.01 mg at 290 K.
In order to change the adsorptive characteristics of the nanosilica A-300 with different bulk densities in relation to proteins, edible gelatin from brand “Merk” was used, and this could ultimately fulfill the requirement of the European Pharmacopoeia (Belgium).
1H NMR-spectroscopy
The NMR spectra were recorded using a NMR spectrometer of high-resolution Varian Mercury (operating frequency 400 MHz). The 90° probe pulse with a duration of 3 μs and bandwidth of 20 kHz was used. Further, the temperature was controlled by Bruker VT-1000 device with relative mean errors ±1 K. The intensity of signals was determined by measurement of area of peaks in the assumption of their Gaussian shape with relative mean errors ±10%. To prevent super cooling of water in the studied objects, the measurements of the concentration of unfrozen water were carried out on heating of samples preliminarily cooled to 210 K. The NMR technique for measurements and determination of thermodynamic characteristics and radii of clusters of bound water has been described in detail as given below (Gun’ko and Turov, 2013; Gun’ko et al., 2005, 2009, 2012; Turov and Gun’ko, 2011; Turov et al., 2016).
NMR measurements were performed on silica samples, prepared beforehand at wetting with different amounts of water in a range of C(H2O) = 0.3–5 wt%, followed by drying. Thereafter, the samples were placed in a 5 mm NMR vial followed by addition of 1.1 wt% (relative to weight of silica) of distilled water to get wet powder of silica after thorough mixing by shaking the vial for 1–2 min. Then, after reaching the adsorption equilibrium (1–2 h) the vial was tightly closed with plastic stopper and was placed in the NMR spectrometer probe.
In order to determine the geometrical dimension of clusters of adsorbed water, Gibbs–Thomson relation was used. This was in association with the radius (R) of the pore that contains water, with the reduction of freezing temperature (Aksnes and Kimtys, 2004)

The influence of the solid surface enlarges upon several molecular layers deep into the liquid phase (Frolov, 1982). The process of freezing (fluctuation) of bound water corresponds to the changes in the Gibbs free energy, conditioned upon the effects of limited space and nature of interfacial surface. The water characteristics that correspond to the volumetric water freezes at 273 K, and when the temperature decreases (excluding the effect of overcooling), the layers of water close to the surface freeze. For the change in free energy of bound water (ice), the following proportion holds true

Interfacial energy of water on the boundary with solid particles or in its aqueous solutions can be determined as the module of total decrease of water free energy, conditional upon the presence of the phase boundary (Gun’ko and Turov, 2013; Gun’ko et al., 2005, 2009, 2012; Turov and Gun’ko, 2011; Turov et al., 2016), and this is clearly depicted from the equation given below

Gelatin adsorption
The protein adsorptive capacity of the compacted nanosilica was estimated by its interaction with gelatin (М = 350,000), which is used for determination of activity of sorptive-detoxicative products (Bergna and Roberts, 2005; FC42U-82/224-889-00 Siliks). For this purpose, the samples of nanosilicas (weight 0.2 g) together with 25 ml of 0.6% gelatin were allowed to be shaken for 1 h and this was succeeded by the settling of the sorbent in centrifuge and determination of the adsorbate equilibrium concentration in centrifugate. The adsorption value was calculated as the difference between the initial and equilibrium concentration—mass of silica in the sample ratio. After the adsorbtion of protein onto silica the supernatant fluid was collected and the amount of gelatin was determined by using the biuret reaction. This method is based on the formation of a biuret complex of protein peptide bonds with bivalent copper ions. In this method, KOH, CuSO4, and sodium citrate were used as biuret reagent. In the formed complex, copper gets binded with four nitrogen atoms by coordination bonds and with two oxygen atoms by the electrostatic interactions. The full complex is formed only with peptides consisting of more than four residues. The equilibrium concentration was determined by the colorimetric method using KFK-2MP device (Bergna and Roberts, 2005; FC42U-82/224-889-00 Siliks). The optical density of the solution (in direct proportion to polypeptide concentration) was determined under the wavelength of 540 nm in 10 mm basin in 30 min after the probe selection. Moreover, the optical density of the solution was consequently determined using the spectrophotometer Specord M-40 (Carl Zeiss, Jena, Germany) under the wavelength of 560 nm in 10 mm basin.
FTIR spectroscopy
IR spectra of dried silica samples were recorded by using a FTIR Thermo Nicolet spectrophotometer (Germany). For this KBr pellets were prepared with 1:5 ratio of the samples with dry KBr powder.
Microscopy
Desktop scanning electron microscope Phenom Pro at acceleration voltage 10 kV was used to study silica samples.
Results and discussion
SEM image of the initial silica sample is shown in Figure 1. Nonporous primary silica nanoparticles (10–15 nm) form agglomerates, with sizes of 50–100 nm. The textural porosity of nanosilica is conditional upon the pore spaces between nanoparticles in aggregates (nanopores of the radius R<1 nm and mesopores of the radius 1 < Rp < 25 nm) and hollownesses between aggregates in agglomerates (macropores of the radius Rp > 25 nm).
SEM image of the nanosilica A-300 with the bulk density of 45 mg/ml.
Bulk density of nanosilica—the degree of its wetness diagram is depicted in Figure 2. Here it can be seen that with increase of wetness the bulk density increases monotonically and reaches to its maximum of 250 mg/ml. This is roughly five times higher than the bulk density of the initial silica.
The dependency of bulk density of the dry nanosilica A-300 powder on the degree of its previous wetness (g/g).
The water in 1H NMR spectra (Figure 3) adsorbed on the silica samples with different bulk densities (different degrees of wetness) appears in the form of one signal; the chemical shift of which is proximate to 5 ppm is close to the chemical shift of liquid water and corresponds to water polyassociates, each water molecule in which forms at the average 2.5 hydrogen bonds (Gun’ko and Turov, 2013; Gun’ko et al., 2009; Turov and Gun’ko, 2011). As the temperature falls, the intensity of water signal decreases since the part of the interfacial water freezes. The part of the water that freezes at the T< 260 K is strongly bound water (SBW), the rest of the water is weakly bound water (WBW) (Figure 4(a)). A sample designated in Figure 3(d) as a “grid” meets silica prewetted with the amount of water, which is sufficient to form a gel (C(H2O) = 3–5).
Recorded at different temperatures 1H NMR spectra of water, adsorbed on the surface of the nanosilica A-300 with different bulk densities. Temperature dependences of nonfreezing water concentration (a), change in the Gibbs free energy (b), and radial distribution of water polyassociates in strongly hydrated powders of nanosilica A-300 (CH2O = 1100 mg/g) with different bulk densities (c).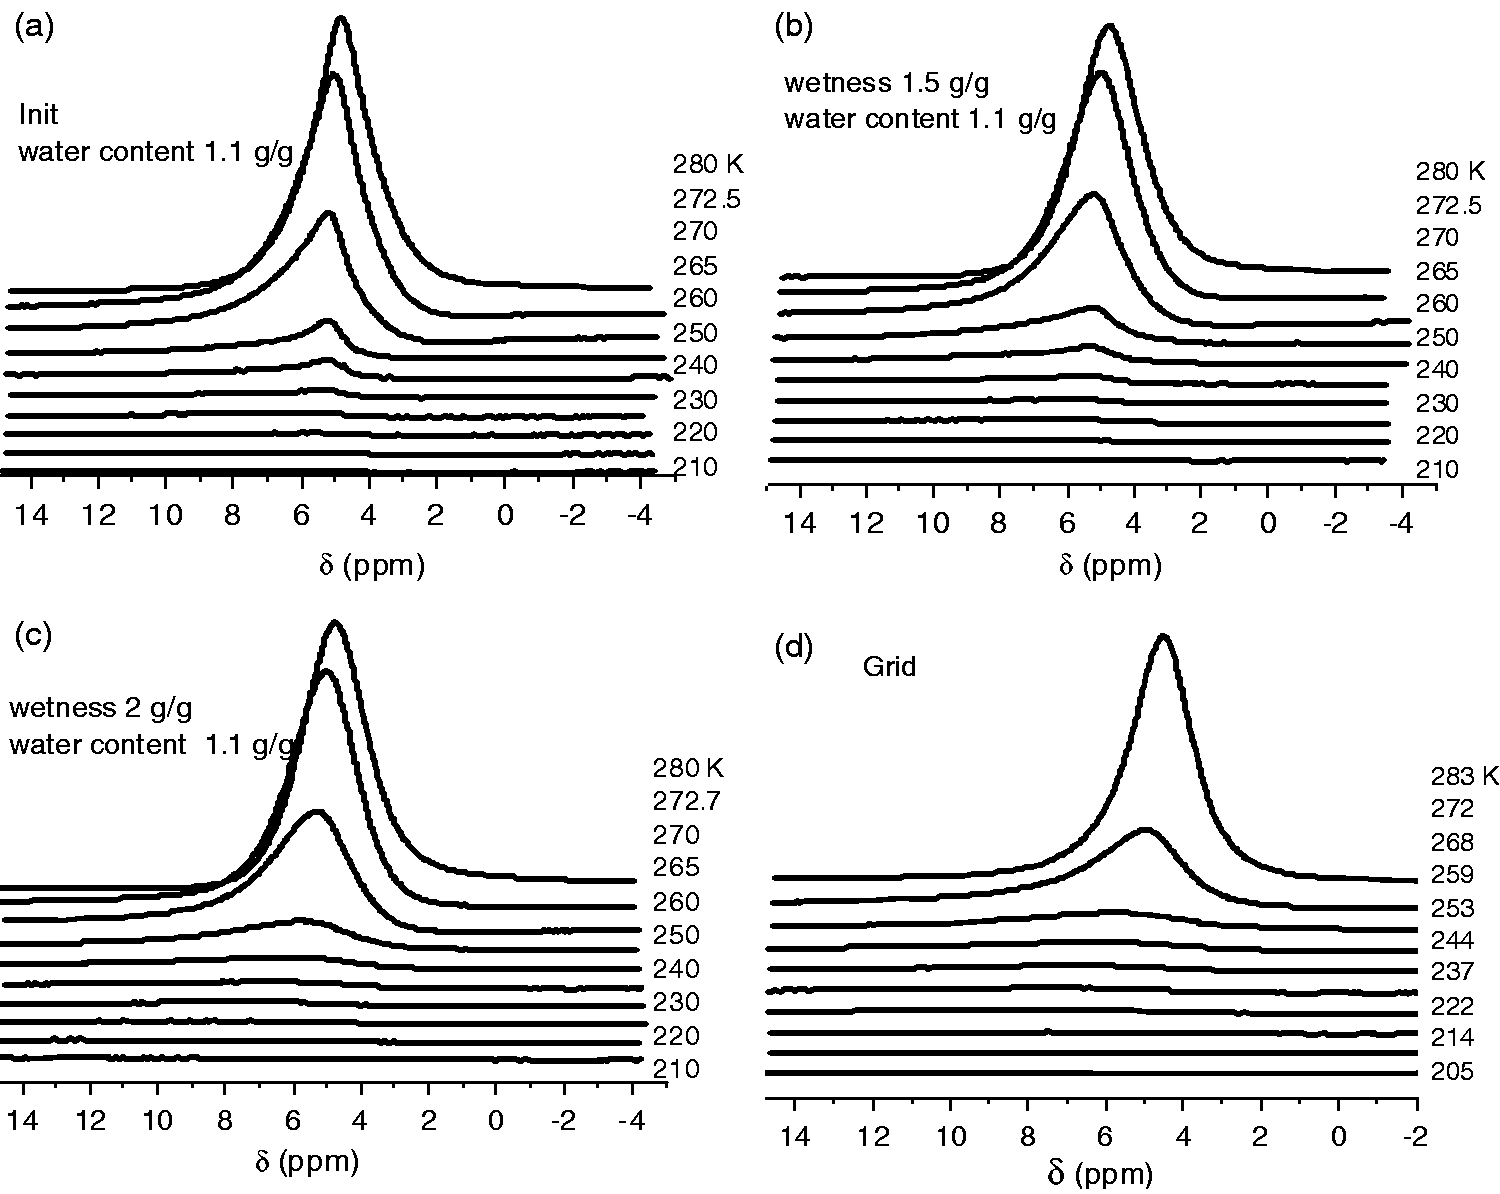

Thermodynamic characteristics of water, adsorbed by the nanosilica A-300 with different degrees of compaction, where CH2O = 1100 mg/g.

From Table 1, it could be noticed clearly that with a rise of bulk density the amount of SBW increases monotonically, even though if Cb = 300 mg/ml, its amount is 170 mg/g and no more than 10% of the total volume of hollownesses between the silica particles, which can be estimated on the basis of the bulk and volumetric densities of silica ratio (2.3 g/ml) (Iler, 1979). Thus, wetting of silica in the process of its production does not lead to the formation of solid agglutinate particles with high bulk density. The interfacial energy characterizes the total interaction between silica and aqueous medium and is within the range from 11 to 15 J/g (from 37 to 51 mJ/m2), which confirms a relatively weak change in the structure of aggregates of silica in the process of its hydraulic compaction.
The maximal changes are observed on the radial distributions of water polyassociates that form the hydrated film of nanosilica particles determined in accordance with equation (1). Their sizes are in the range from 0.6 to 100 nm. The main part of water forms nanodrops, with a radius of 4–100 nm. The total volume of this type of water polyassociates, mainly conditional upon the WBW, is more than 80%. Moreover, in the area of minor water clusters on distributions, recorded maxima are corresponding to R = 1 and 1.5 nm. A minimum volume of water, which is a part of clusters with R = 1.5 nm, corresponds to the initial silica with the bulk density Cb = 50 mg/ml, and maximum for the sample with Cb = 250 mg/ml. The mentioned peculiarities are determined by the change of interparticle distances in aggregates of silica under the condition of its wetting. Overall the changes are not so prominent, and this ultimately concludes the weak influence of “wetting–drying” compaction on the adsorptive characteristics of silica particles in relation with the water molecules.
The dependency of the protein adsorptive capacity of the nanosilica A-300 with different bulk densities is given in Figure 5. The measurements were taken by using photocolorimeter KFK-2MP with green filter (λ = 540 nm) and path length of 10 mm. The measurement peak was recorded at 560 nm. As it can be seen from the figure, the received results differ insignificantly. Small differences in adsorption values were obtained by different methods, probably due to the smaller width of the absorption spectrum using of photocolorimeter. With an increase of Cb one may observe some decrease of the protein adsorption, which is connected with the decrease of the available surface in silica aggregates. If the bulk density of the samples is less than 200 mg/ml (C(H2O) < 3 g/g), the decrease of adsorption is less than 30% and this allows the material to be utilized as enterosorbents and biologically active supplements (Blitz and Gun’ko, 2006; Gerashchenko, 2014; Kulik et al., 2012).
The dependency of the maximum gelatin adsorption value on the concentration of water used for the “wetting–drying” compaction of nanosilica in accordance with photocolorimeter (1) and spectrophotometer (2) data.
IR spectra of the nanosilica A-300 samples with different amounts of water, which was used for the hydraulic compaction, are shown in Figure 6(a) and (b). Before taking IR measurements the samples were calcined at 410 K over a period of 3 h in such a way that the residual water content is less than 2%. The characteristic line in spectrum, due to change in the process of hydraulic compaction of the sample, is a band of the free silanol groups adsorption (ν = 3745 cm-1) (Figure 6(b)). The dependence of the signal intensity of free OH groups (calculated in accordance with the peak area) on the amount of wetting liquid (C(H2O)) is given in Figure 6(c). Although it can be seen from the figure that if the sample is wet with a small amount of water (CH2O = 0.3 g/g), the intensity of the band decreases considerably. The further growth of the wetting liquid amount leads only to the slight fall of the signal intensity of free silanol groups. In the research (McCool et al., 2006) it was demonstrated that the specific surface of the adsorbent might be estimated in accordance with the relation between the intensities of free silanol group bands and the volume Si–O oscillations overtone (ν = 1870 cm−1). From the IR spectra given in Figure 6(a), the intensity of volume Si–O oscillations remains constant under the “wetting–drying” compaction of silica by different amounts of water. Thus, it can be concluded that in the process of such compaction, the specific surface of silica decreases slightly. Considering that the concentrations of residual water were similar, it is assumed that the decrease of Si–OH group’s intensity occurs due to the change in the morphology of the pore volume in silica aggregates, appearing under the adhesion of initial particles.
IR spectra of nanosilica after the “wetting–drying” compaction (a, b) and the change in the disturbance degree of silanol groups (ν = 3745 cm−1) depending on the amount of water at the surface of SiO2 (c).
Conclusions
The compaction of amorphous nanosilicas with water and drying allows increasing the bulk density from 0.05 to 0.25 g/ml without considerable loss of protein-holding adsorption capacity. The further growth of the amount of wetting water may reduce the adsorption capacity to 25% of the initial. For the repeatedly moistened powders, the process of compaction goes along with some changes in the radial distributions of adsorbed on the silica surface water polyassociates (nanodrops), consisting in the growth of contribution from nanodrops of the radius 0.6–2 nm. The interfacial energy of silica surface in relation to water may increase from 11 J/g (37 mJ/m2) for the initial powder (Cb = 50 mg/ml) to 15 J/g (51 mJ/m2) at Cb = 200 mg/ml. The protein adsorptive capacity of the nanosilica A-300 in relation to gelatin decreases with the increase of bulk density no more than by 30%, which allows the usage of compacted forms of silica as enterosorbents and carriers of medications.
Footnotes
Declaration of Conflicting Interests
The author(s) declared no potential conflicts of interest with respect to the research, authorship, and/or publication of this article.
Funding
The author(s) received no financial support for the research, authorship, and/or publication of this article.