
Abstract
Red mud was activated by a digestion–precipitation method, resulting in a mesostructure with high surface area, and the activated red mud was further used as the adsorbent for methylene blue removal. The physicochemical properties of the resultant samples were characterized by X-ray diffraction, Fourier transform infrared spectroscopy, thermogravimetry analysis, and nitrogen sorption techniques. Batch studies were measured to investigate the influence factors including adsorbent dosage, contact time, pH, and initial concentration. It was revealed that the activated red mud was highly efficient for removal of methylene blue. Adsorption experiments were found to be better achieved in faintly acidic and alkaline conditions, where the adsorption capacity of activated red mud and activated red mud-200 reached 232 and 274 mg/g at pH 7.0, respectively. Langmuir, Freundlich, Temkin isotherms, and pseudo-second-order kinetic model fitted the experimental data well, demonstrating an electrostatic interaction mechanism.
Introduction
Synthetic dyes are common pollutants discharged from many industries such as paint, plastics, food, textile, rubber, etc. (Hajjaji et al., 2016; Rafatullah et al., 2010). Up to now, more than 100,000 kinds of commercial dyes exist, and over 700,000 tons of synthetic dyes are produced every year (Asfaram et al., 2016; Hou et al., 2013). Due to its good solubility, high toxicity, and broad application, many diseases such as vomiting, dermatitis, cancer, gene mutations, and mental confusion in people are connected with colored dye effluents (Bhatnagar et al., 2011). Methylene blue (MB), one kind of common industrial dyes, is usually used for dying wood, silk, and cotton. It is harmful to human beings, animals, and plants. So, the treatment of wastewater containing such dye is very important. Now, there are four main categories for treating dye wastewater: (i) biological, (ii) physical, (iii) chemical, and (iv) acoustical, radiation, and electrical processes (Gupta, 2009). Among these methods, currently adsorption has been considered to be the most promising way for overall treatment because it is quick, easy, and economical. Carbon-based materials such as activated carbon, carbon nanotubes, mesoporous carbon and so on, have been proved to be the most promising adsorbents for dye removal, but their use is sometimes restricted in view of their high cost (Kannan and Sundaram, 2001; Norzilah et al., 2011; Yuan et al., 2007). So, the exploitation of new effective and low-cost adsorbents for the effluent treatment is very necessary.
Red mud, a large scale waste residue from alumina industry, is harmful to the environment due to its highly alkaline and saline properties (Hu et al., 2016a, 2016b). And its safe treatment, disposal, or re-use is a complex problem that long-term plagues the researchers. Development of adsorbent based on red mud for wastewater treatment can provide many advantages for pollution control, since it is an environmental-friendly process that can not only reduce costs but also save raw materials. Red mud is a high alkaline material, and thus can't be directly added into the water. So, before using red mud, it needs to be neutralized (Zhou and Haynes, 2010). Genç-Fuhrman et al. (2004) investigated the arsenic adsorption characteristics of neutralized red mud, and its adsorption capacity was comparable with commonly used adsorbents. Also, Gupta et al. (2004) and Tor et al. (2009) used activated red mud (ARM) for phenol and chlorophenols removal, and batch studies showed that the red mud was an efficient, rapid, and economic adsorbent. Recently, several researchers found that red mud could be successfully used as the adsorbents for dye removal (de Souza et al., 2013; Gupta et al., 2004; Ratnamala et al., 2012; Tor and Cengeloglu, 2006). However, the research about dye and red mud are really rare, and the adsorption mechanism is also unclear. So, it is very necessary to continue more studies on red mud for efficient removal of various dyes. In addition, further research are also needed to make clear about the adsorption mechanism between red mud and dyes.
In this work, the ARM was taken as the adsorbent for MB removal. The aim of this study was to find out a low-cost adsorbent for wastewater treatment, as well as search a new way for using red mud. The affecting factors including adsorbent dosage, contact time, initial pH, and concentration, were studied in detail. Additionally, to better understand the adsorption processes, thermodynamics (Langmuir, Freundlich and Temkin models) and kinetics were also selected to fit the experiment data.
Experimental section
Materials and synthesis
The red mud (RM) sample was obtained from Henan Zhongmei Aluminum Corporation (China). HCl, NH4OH, and MB were supplied by Tianjin Guangfu Fine Chemical Co.
The RM was smashed and the particles below 60 meshes were used for experiments. In the activation procedure, 10 g of RM powder was mixed with 100 mL of 6 M hydrochloric acid solution, and the mixture was digested at 90℃ in an oil-bath heater for 2 h. Then, ammonium hydroxide was added to the mixture to adjust the pH around 8. The sample was washed with excessive water until the pH ≈ 7, dried at 110℃ overnight, and referred to ARM. The ARM was then annealed in muffle furnace at 200℃ for 12 h, which was denoted as ARM-200. These two samples were smashed and the particles below 60 meshes were used for the adsorption experiments.
Characterization
X-ray diffraction (XRD) patterns were collected on a Bruker D8 Focus Diffractometer with Cu-Kα radiation (λ = 0.15418 nm) operated at 40 kV and 40 mA, with a scanning range from 10° to 80° (2θ). Fourier transform infrared spectroscopy (FT-IR) spectra were measured on a Bruker Tensor 27 spectrometer with KBr pellet technique, and the ranges of spectrograms were from 4000 to 400 cm−1. Nitrogen adsorption–desorption isotherms were determined on a Quantachrome NOVA 2000e analyzer at liquid nitrogen temperature (−196℃). Before the measurements, each sample was degassed at 110℃ overnight. The surface area (SBET) of the sample was obtained by the Brunauer–Emmett–Teller (BET) method, the total pore volume (Vtotal) was estimated from the volume adsorbed at a relative pressure (P/P0) of 0.99, and the pore size distribution was calculated from the adsorption isotherm by the nonlocal density functional theory (NLDFT). Thermogravimetric analysis was conducted on a TA SDT Q600 analyzer in N2 atmosphere with a heating rate of 10℃ min−1 using α-Al2O3 as the reference.
Adsorption experiments
In this work, all the tests were measured at room temperature (25 ± 2℃), and the initial pH of the solution was adjusted by NH4OH (0.1 mol/L) and HCl (0.1 mol/L) solution. To investigate the influence of contact time and initial concentration, 50 mg of ARM and ARM-200 were added into 50 mL of MB solution with three different initial concentrations (100, 200 and 300 mg/L) at pH = 7. The optimum pH and adsorbent dosage were also investigated by batch tests at different pH (3 to 11) and dosage (0 to 2.0 g/L). In order to obtain the adsorption equilibrium, the mixture was vigorously stirred for 2 h, then centrifuged at 6,000 r/min, and the final supernatants were analyzed by a UV spectrometer (SP-722) at λmax = 660 nm.
Results and discussion
Materials and characterization
RM is a byproduct from aluminum industry. Its main compositions are Al2O3, SiO2, CaO, Fe2O3, TiO2, Na2O, and K2O, which have been previously described by Cao et al. (2014a, 2014b). The powder XRD patterns of RM, ARM, and ARM-200 are shown in Figure 1. The as-received RM is a complex mixture that contains katoite, tilleyite, bayerite, hematite, lepidocrocite, and rutile (compared with the JCPDS Data File). After activation, the main complex compounds, such as katoite and tilleyite, are decomposed, and most of sodium and calcium are removed. Furthermore, it causes dispersion of dissolved metal oxides as hydroxides which leads to formation of pores thereby increasing the surface area (Hu et al., 2016a, 2016b). Meanwhile, the intensities of Fe- and Al-containing species are decreased obviously. Specifically, the main phases in ARM are bayerite, rutile, and hematite. After being annealed at 200℃, the intensities of the bayerite, rutile, and hematite peaks become stronger. This indicates that the activation process makes great changes in the RM.
(a) XRD pattern of the RM, ARM, and ARM-200; (b) XRD patterns of the raw RM and the corresponding JCPDS files ((1) katoite (Ca2.93Al1.97(Si0.64O2.56)(OH)9.44) JCPDS 77-1713; (2) tilleyite (Ca5Si2O7(CO3)2), JCPDS71-2079; (3) bayerite (Al(OH)3), JCPDS83-2256; (4) hematite (Fe2O3), JCPDS85-0987; (5) lepidocrocite (FeO(OH)), JCPDS74-1877; (6) rutile (TiO2), JCPDS76-0326).
The morphologies of the RM and the ARM-200 are shown in Figure 2. It is seen that the raw RM is composed of a large quantity of random huge agglomerates. After activation, the larger particles are decomposed, formatting a number of small nanoparticles. And these particles are tend to agglomerate, resulting in a looser structure with many pores (Figure 2(c) and (d)), which should be beneficial for the adsorption performance of the samples. The energy dispersive x-ray spectroscopy images of the RM and ARM-200 are shown in Figure 2(c) and (f), respectively. It is observed that the raw RM contains many elements such as Al, Si, Fe, Ti, Na, K, and Ca. After activation, most of Na and Ca are removed. This is in accordance with XRD results in Figure 1.
SEM images of the raw RM (a, b) and the ARM-200 (e, f), and the energy dispersive x-ray spectroscopy data of RM (c) and ARM-200 (f).
Figure 3 shows the FT-IR spectra of RM, ARM, and ARM-200. All the samples show two peaks at around 3450 and 1643 cm−1, corresponding to the stretching vibration of –OH (Sushil and Batra, 2012). This is likely caused by the presence of H2O or hydroxyl compounds in the samples. In the RM and ARM samples, bands at 1498, 387 and 1400 cm−1 corresponding to the FT-IR spectra of RM, ARM, and ARM-200.
The textural properties of RM, ARM, and ARM-200 are measured by N2 sorption techniques, and the results are shown in Figure 4 and Table 1. From Figure 4, the isotherms of as-received red mud are of type III, indicating a non-porous structure. While, the isotherms of ARM and ARM-200 are of classical type IV nitrogen sorption isotherms with a type H3 hysteresis loops, typical for mesoporous materials (Cao et al., 2014a; Deng et al., 2013). Noticeably, for ARM-200 sample, when the relative pressure (P/P0) is above 0.85, the nitrogen-adsorbed volume rises sharply, revealing the presence of abundant large mesopores or macropores. The SBET and Vtotal of the RM are 56 m2/g and 0.08 cm3/g, respectively, which increase to 207 m2/g and 0.31 cm3/g (ARM) and 381 m2/g and 0.90 cm3/g (ARM-200) after activation. This maybe because the sodium and calcium ions are removed during the acid–alkali treatment whereas some hydroxides are formed simultaneously. Then, the main compositions of RM can be redistributed during drying in 110℃, resulting in a loose structure of ARM. In addition, a certain temperature (200℃) can also eliminate some volatile matter, further increasing the surface area and pore volume. The pore size distribution curves of ARM and ARM-200, calculated from the NLDFT model, exhibiting three broad peaks centered at around 3.8, 5.4, and 8.1 nm, respectively, revealing a relative uniform mesostructure of both ARM and ARM-200 samples.
(a) Nitrogen adsorption–desorption isotherms and (b) the corresponding pore size distribution curves of RM, ARM, and ARM-200. The parameters of Langmuir, Freundlich, and Temkin isothermal for adsorption of MB.

The TG-derivative thermogravimetric (TG-DTG) results of RM and ARM-200 are shown in Figure 5, and all the samples are dried at 110℃ overnight before the tests. The TG curves show a weight loss of 12% and 15% from 30℃ to 800℃ for RM and ARM-200, respectively. For RM (Figure 5(a)), the weight loss of 1.3% from 30℃ to 232℃ can be attributed to the physical adsorption water evaporation (Zhu et al., 2014a). From 232℃ to 450℃, the TG curve exhibits a weight loss of 6.6%, accompanied by a weight loss peak at 255℃ in the DTG curve, which can be attributed to the decomposition of goethite, gibbsite, and boehmite to hematite, boehmite, and alumina, respectively (Cao et al., 2014a, 2014b). Noticeably, a strong peak at the temperature from 600℃ to 700℃ in DTG curve with the mass loss of 3.3% can be observed in the sample of RM, corresponding to the decomposition of calcite and tilleyite. After 700℃, the weight loss can be attributed to the decomposition of silicon aluminate compounds (such as katoite). Figure 5(b) shows the thermal property of ARM-200 sample. It is shown that ARM-200 (6.7%) has more weight loss than RM (1.1%) before 200℃, probably because the loose structure of ARM-200 is conductive for adsorption water. From 220℃ to 669℃, the weight loss of 4.9% can be due to the decomposition of goethite, diaspore, and boehmite. And this makes great contribution to the formation of pores (Hu et al., 2016). Compared with RM and ARM-200, no obvious weight loss can be seen at around 600℃ in ARM-200, indicating that the calcite almost completely wiped out after acid–alkali treatment.
TG-DTG curves of (a) RM and (b) ARM-200.
Effect factors (adsorbent dosage, contact time, dye concentration, and initial pH)
To obtain the optimal dosage of the adsorbent, batch adsorption experiments were conducted with 0.25 to 2 g/L of adsorbent. The concentration of MB is 200 mg/L, and the results are presented in Figure 6. The percentage adsorption of MB increases with the increase of the adsorbent dosage. At the adsorbent dosage below 1 g/L, the removal efficiency increases sharply. However, further increase in the quantity of adsorbent from 1 to 2 g/L, only a slight increase of MB adsorption can be observed by 2% and 5% for ARM-200 and ARM, respectively. Similar results were reported earlier in adsorption of Congo Red (Tor and Cengeloglu, 2006) and Remazol Brilliant Blue dye (Ratnamala et al., 2012) by red mud, that the removal of dyes increased with increase in dosage, however, beyond a critical quantity, any additional red mud dosage had little contribution to the adsorption process. From Figure 6, we can see that the removal efficiency of MB is high enough when the dosage is 1 g/L. Therefore, 1 g/L of adsorbent is chosen in the subsequent experiments.
The adsorption efficiency of MB with different adsorbent dosages (pH = 7.0, T = 25 ± 2℃).
Figure 7 shows the plots of the adsorption capacity of ARM (Figure 7(a)) and ARM-200 (Figure 7(b)) with time at three different MB concentrations. The equilibrium can be achieved within 40 minutes for both ARM-200 and ARM. Furthermore, the removal of MB is rapid at the first 10 min, and a slower second stage of gradual adsorption from 10 to 40 min. Finally, the MB adsorption can reach equilibrium after 40 minutes, which is a little faster in comparison to many synthesized adsorbents (Liu et al., 2014; Yue et al., 2011). As at the initial time, due to the higher concentration of the solution, the driving forces are very strong, leading to a fast adsorption rate. But when the adsorption proceeds, the concentration of solution reduces while approaching equilibrium and the adsorption rate decreases. Noticeably, the adsorption capacity of ARM-200 is much higher than that of ARM, especially at high initial concentration of MB, which can be attributed to the high porosity of ARM-200 resulting in more surface adsorption sites. When the MB concentration enlarges from 100 to 300 mg/L, the equilibrium adsorption capacities increase from 90.8 to 232.2 mg/g and 93 to 274 mg/g for ARM and ARM-200, respectively, which are much higher than other early reported adsorbents (Table 2).
The adsorption efficiency for MB with different contact time: (a) ARM; (b) ARM-200 (pH = 7.0, T = 25 ± 2℃). Comparison of the MB adsorption capacities of various adsorbents.

The adsorption results of ARM and ARM-200 at different MB concentrations are studied in detail (Figure 8). The equilibrium adsorption capacity of the two samples decreases with the increase of the initial dye concentration. This can be attributed to the existence of more dye molecules or ions in solution at higher concentration, thus more intense completion occurs between the adsorbate and available binding sites of the adsorbent, leading to higher adsorption (Ahmad and Alrozi, 2010; Hou et al., 2013). Noticeably, the MB adsorption capacity of ARM-200 (SBET, 381 m2/g, Vtotal, 0.90 cm3/g) is higher than that of ARM (SBET 207 m2/g, Vtotal 0.31 cm3/g) in various dye concentration, probably due to the different surface area and pore volume of the adsorbents. The high surface area and large pore volume of the adsorbent can provide more adsorption sites, so as to increase the MB removal percentage. What's more, the removal efficiencies of ARM are decreased more obviously than that of ARM-200 sample from 100 to 300 mg/L, suggesting a better adsorption ability of ARM-200.
The adsorption efficiency for MB with different initial concentrations (pH = 7.0, T = 25 ± 2℃).
The pH of the solution is a very important factor affecting the ionization degree of dye molecules and the surface charge of the adsorbent (Cengeloglu et al., 2006; Ren et al., 2013). In this study, batch experiments are performed over a pH range of 3–11. The dye concentration and adsorbent dosage are 200 mg/L and 1 g/L, respectively, and the experimental results are shown in Figure 9. The adsorptions of MB on both RM and ARM-200 are favorable at higher pH. Indeed, the MB removal efficiency increases sharply in the pH range 3–5. When the initial pH is above 5.0, only a slight increase of absorption amount of MB can be observed in both ARM and ARM-200, where the maximum adsorption of MB is achieved at pH 9.0. Red mud is a mixture of oxides containing abundant surface hydroxyl groups, while MB is a cationic dye molecule. The adsorption mechanism between the dyes and the adsorbent surface can be attributed to the ionic interactions. In aqueous solution, the adsorbent surface will be positively charged (Cengeloglu et al., 2007; Ozcan et al., 2011). At lower pH condition, the MB molecules are apt to dissociate into ions which is unfavorable for adsorption (electrostatic repulsion). With the increase of solution's pH, the MB species are transformed into molecular form. Also, the adsorbent surface will be negatively charged, and the MB molecules are easily adsorbed on the negative surface of the adsorbent. Therefore, we can deduce that the adsorption mechanism between the MB and the adsorbent is derived from electrostatic interaction. Similar trends are also reported earlier in adsorption reactive blue (KNR), acid red, and direct blue (B2RL) (Wang et al., 2009). The chemical interaction between MB and hydroxylated surface of red mud can be represented schematically in Figure 10.
The effect of pH of the initial solution on the MB adsorption efficiency (T = 25 ± 2℃). The schematic mechanism for the removal of MB by ARM samples.

Adsorption isotherm
Adsorption isotherms are usually used to investigate the adsorption process and estimate the adsorption ability of an adsorbent. In this work, the MB species adsorption on the ARM and ARM-200 are analyzed by three different adsorption models (Langmuir, Freundlich, and Temkin). In general, the Langmuir isotherms are commonly used to describe the monolayer adsorption process over a homogenous surface, where no interaction between adsorbed molecules existed (Amin, 2009; Malik, 2003). The isotherms are calculated as follows

Additionally, to confirm whether the MB adsorption process is favorable for monolayer adsorption, the experimental data are evaluated by dimensionless constant separation factor (RL). The RL is calculated as follows (Singh et al., 2006; Yu et al., 2013)

The Freundlich isotherms are usually used for fitting the multilayer sorption on heterogeneous surface (Akin et al., 2012; Tor et al., 2006). The equation is calculated as follows

The above equation can be converted into a linear equation

The derivation of the Temkin model takes into account the interactions between the adsorbates, assuming that the decline of the adsorption heat is linear (Yu et al., 2013). And the equation is described as follows

The equation can be transformed into a linear form


In the Temkin model, k1 is the Temkin isotherm energy constant, and k2 is the Temkin isotherm constant corresponding to the maximum binding energy.
The fitting results of the three adsorption models of MB adsorption by ARM and ARM-200 are shown in Figure 11, and the detailed results are given in Table 1. In this study, the qm of ARM and ARM-200 are 232.2 and 274 mg/L, respectively, suggesting a superior adsorbent system. The correlation coefficient (R2) obtained from Langmuir model are 0.99 and 0.86 for ARM and ARM-200, respectively. Moreover, the dimensionless constants (RL) of the two samples are in the range of 0–1, indicating that they are all suitable for MB adsorption. In Figure 11(b), the R2 values of ARM and ARM-200 calculated from Freundlich isothermal model are 0.96 and 0.98, respectively, revealing a good applicability of the Freundlich isotherm for the two samples. In addition, the values of 1/n are 0.447 and 0.723 for ARM and ARM-200, respectively, indicating that the samples are favorable for MB adsorption (Rauf et al., 2008). Noticeably, for ARM sample, Langmuir and Temkin models fit the experimental data better than Freundlich model. While, the experimental data of ARM-200 sample fit better with the Freundlich and Temkin models. These results suggest that the adsorption of MB on ARM is monolayer adsorption process, while multilayer sorption occurs on ARM-200.
(a) Langmuir, (b) Freundlich, and (c) Temkin isotherms for adsorption of MB onto the ARM and ARM-200.
Adsorption kinetics
To disclose the adsorption kinetics of MB on the ARM and ARM-200, the tests are carried out at three different dye concentrations (100, 200, and 300 mg/L). The pseudo-first-order kinetic model is expressed as follows (Zhou and Haynes, 2012; Zhu et al., 2014b)

The pseudo-second-order kinetic equation is described as follows (Fu et al., 2011)

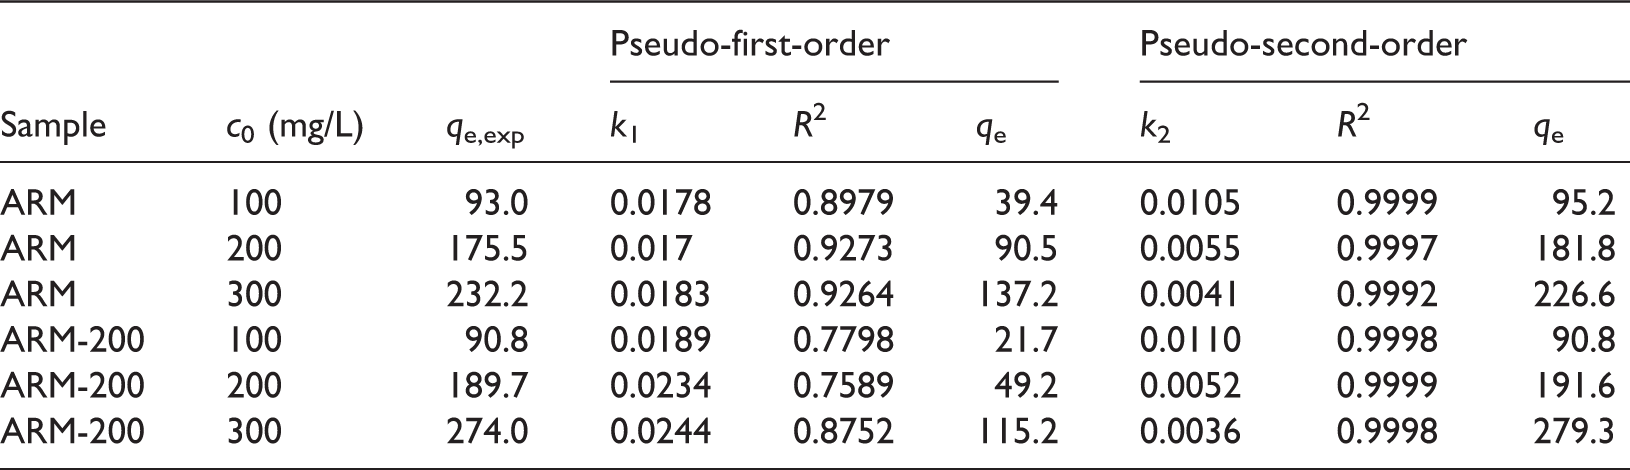
The fitting plots and corresponding parameters of the two kinetic models of MB adsorption by ARM and ARM-200 in three different initial concentrations (100, 200 and 300 mg/L) are shown in Figure 12 and Table 3, respectively. The qe of the second-order model is very close to the theoretical vales. Moreover, the correlation coefficients (R2) of the two samples calculated by the second-order kinetic model (>0.999) are much larger than that estimated from the first-order kinetics model (<0.93), suggesting a better applicability of the second-order model. As we know, the pseudo-second-order model assumes that the rate limiting step is chemisorption (Fu et al., 2011). So, we can deduce that the dye ions and adsorbent are connected through charge neutralization or electrostatic interaction.
The pseudo-first-order and pseudo-second-order model of the MB adsorption processes with ARM (a, b), and ARM-200 (a′, b′). The pseudo-first-order and pseudo-second-order kinetic parameters for the adsorption of MB.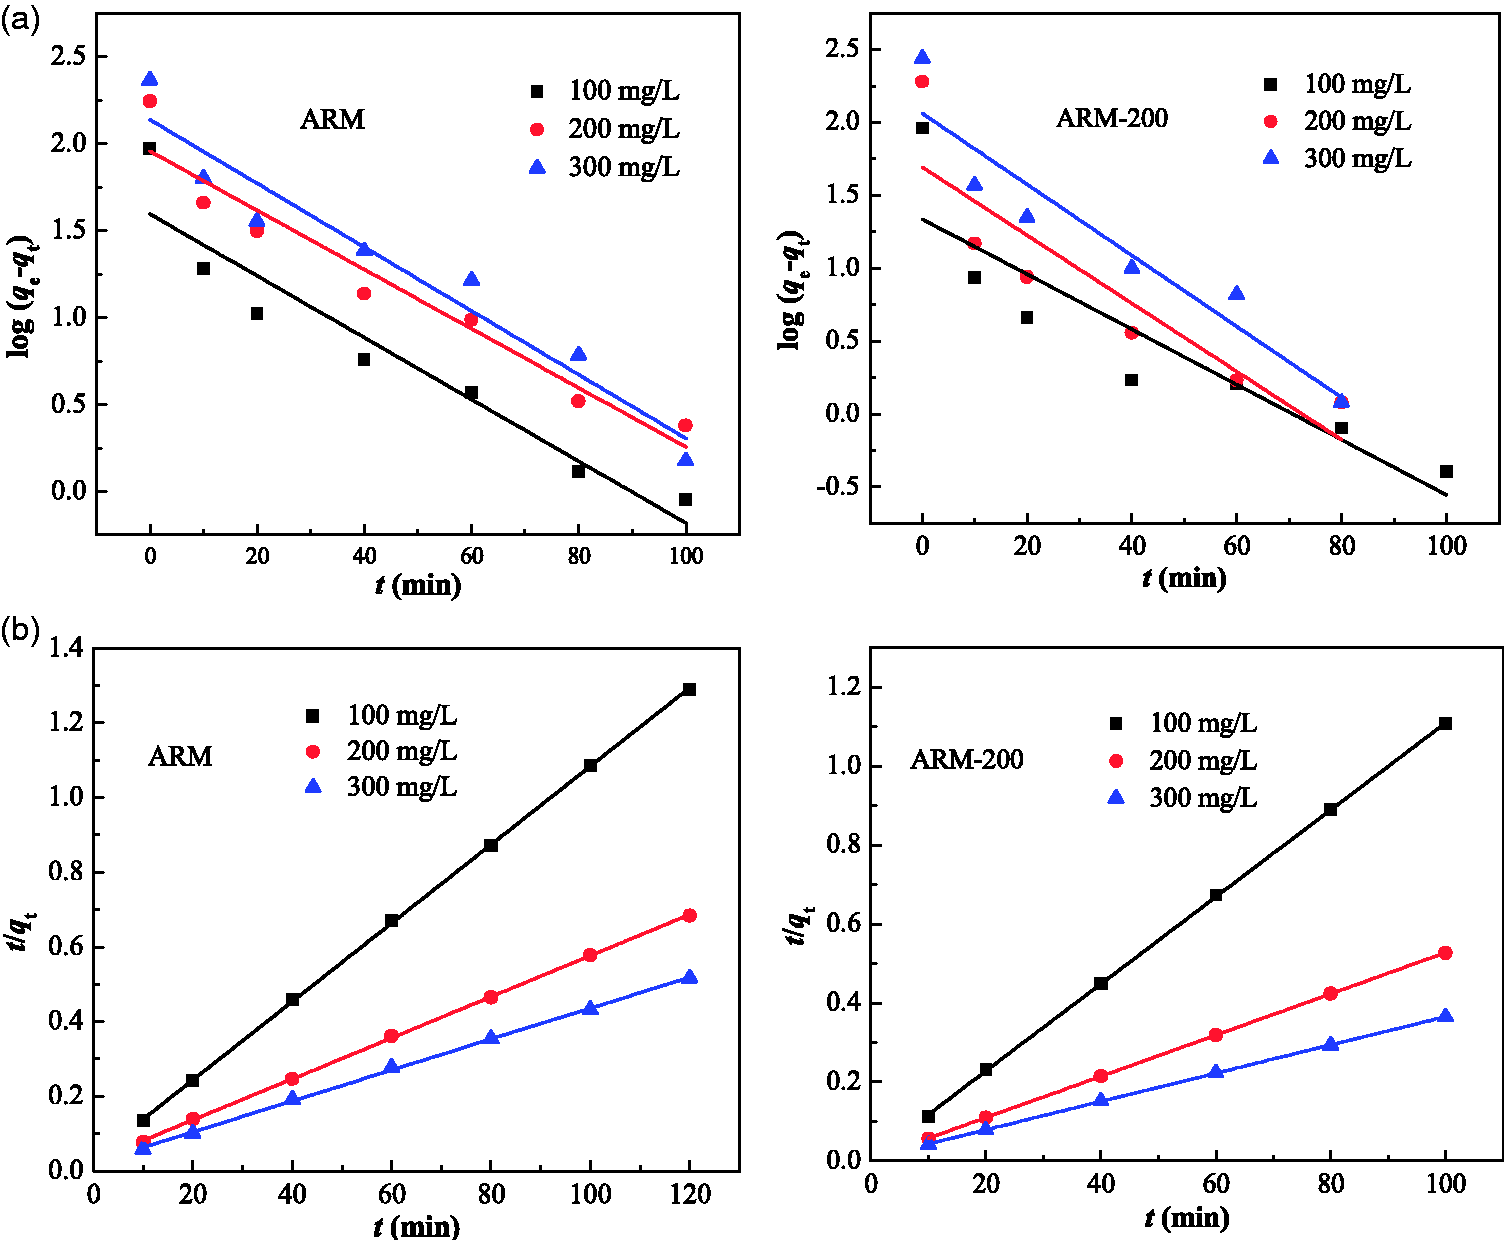
Conclusions
The RM was activated by the hydrochloric acid digestion and ammonium hydroxide precipitation, and further thermal treatment, exhibiting excellent adsorption capacity for MB removal. The activation process changed the strong alkalinity of RM, reduced the toxicity, and significantly improved the specific area and porosity. Batch experiments showed that the initial pH could affect the capacity of adsorbents obviously, and the optimum pH was 9.0. The two samples had a fast adsorption rate and could reach equilibrium within 40 minutes. The adsorption behaviors of MB onto the ARM and ARM-200 matched well with Langmuir, Freunlich, and Temkin isotherm indicating that the adsorption process mixed with monolayer and multilayer. The kinetics of the MB adsorption fitted the pseudo-second-order model better indicating that the main mechanism of adsorption was electrostatic interaction. In addition, red mud is derived from industrial waste and has much low cost, which can be used as an alternative adsorbent for dye removal from wastewater.
Footnotes
Declaration of Conflicting Interests
The author(s) declared no potential conflicts of interest with respect to the research, authorship, and/or publication of this article.
Funding
The author(s) disclosed receipt of the following financial support for the research, authorship, and/or publication of this article: The National Natural Science Foundation of China (21421001, 21573115), the Natural Science Foundation of Tianjin (15JCZDJC37100), and the 111 project (B12015).