
Abstract
Why do people in authoritarian countries think more positively of their governments than people in democratic countries? Existing research suggests three explanations: (1) people in authoritarian countries lie; (2) people in authoritarian countries are indoctrinated; and (3) authoritarian governments have better performance than their democratic counterparts. In this study, I explore a fourth explanation – people in authoritarian countries apply lower standards. To test it, I apply the anchoring vignettes method developed by Gary King and others to original data from China, Vietnam, Russia, Mexico, and the United States, and from the cities of Beijing and Taipei. Adding a case study of Taiwan’s economic trajectory as a robustness check, I conclude that people in authoritarian countries tend to use lower standards when reporting political trust and government responsiveness, but the lower standards are likely to be caused by fast economic growth rather than authoritarianism.
Introduction
Scholars who have attempted public opinion surveys in authoritarian countries have a curious observation. In spite of institutions devoid of electoral accountability, authoritarian regimes enjoy rather favourable public opinion (Shlapentokh, 1985). Norris (2011: 87) compares the institutional confidence in 50 countries and finds more confidence in autocracies than in any type of democracies. Herein lies the puzzle: how come authoritarian governments outperform their democratic counterparts at the latter’s own game?
The literature suggests three explanations. First, respondents in authoritarian countries lie due to repression (Newton, 2001; Shlapentokh, 1985). Second, people in authoritarian governments are indoctrinated through media control and cultural influence (Kennedy, 2009; Lu and Shi, 2014). Third, authoritarian governments earn their approval by better performance in economic development (Dickson, 2016; Wang, 2006), responsiveness (Chen et al., 2016; Tang, 2016), and institutional adaptation (Dickson, 2004; Nathan, 2003).
These explanations are insightful but are still steps away from a full picture, because they leave open the possibility that the more favourable opinion in authoritarian is a result of lower standards of judgement. In democracies, failing to elect one’s candidates may permeate an opposition mentality in the electorate, predisposing them to tougher evaluation, whereas in authoritarian countries that tolerate no credible opposition or free press, people have less exposure to governments’ shortcomings and therefore have less to expect.
In this article, I explore this possibility using anchoring vignettes, a method originally created to enhance the comparability of cross-cultural surveys (King et al., 2004). My study paints a nuanced picture. My initial online survey in China, Vietnam, Russia, Mexico, and the United States did find evidence that people in authoritarian countries apply lower standards when it comes to political trust and government responsiveness, especially when we compare full authoritarian countries and full democracies. Yet, it was inconclusive whether the relationship was causal. Aiming for a stronger causal interpretation, I conducted a follow-up survey in the cities of Beijing and Taipei. Controlling for culture, language, and population, I compared political systems with two competing explanations of standards of judgement: levels of economic development and rates of economic growth. My final analysis favours rates of economic growth as the explanation.
My study makes four contributions to the research of public opinion and authoritarian politics. First, it is the first direct investigation of lower standards as a possible cause of authoritarian resilience. Second, it shows that more favourable public opinion is not an inherent feature of authoritarianism but rather a product of fast economic growth. Third, expanding the economic voting literature, it uncovers a new way in which economic growth can benefit political leaders, both democratic and authoritarian. Finally, it shows that neglecting standards may lead to wrong prediction of political behaviour and inaccurate assessments of government performance.
Lower standards in authoritarian countries
Numerous studies, including my more up-to-date rundown in the Supplemental appendix, show that authoritarian governments enjoy more favourable public opinion (Klingemann, 1999; Nathan, 2007). Because democracy has been touted as the final answer to responsive government, authoritarian governments’ upper hand cries for an explanation (Dahl, 1989; Sen, 2009). This study approaches the puzzle through people’s standards of judgement. Is it possible that people in authoritarian countries apply lower standards when evaluating their governments? This explanation departs from the existing explanations reviewed earlier in that even if people in authoritarian countries are forthright in their answers, are not brainwashed, and are aware of their governments’ objective performance, they may still express more favourable opinion simply because they have lower reference points.
Human judgement is comparative in nature (Mussweiler, 2003). It is a process of comparing a target with a pertinent standard. This is how consumers evaluate products and citizens in the United Kingdom and the United States evaluate their governments (Curtice and Heath, 2012; Kimball and Patterson, 1997). Unfortunately, in the crowded field of authoritarian public opinion, standards command little attention. This inattention has its costs. First, as the judgement and choice literature suggests, people who use different reference points may pronounce the same judgement yet still make different choices (Fischhoff, 1983; Johnson and Puto, 1987). Therefore, the same opinion may imply different behaviours if the underlying standards are different. Overlooking this nuance will hinder scholars’ ability to predict behaviour with opinion. Second, subjective evaluations are often used to infer objective government performance (Li, 2013), but they will make for poor inferences when not being anchored to the same standards.
One body of research that sees this play out is immigration studies. Immigrants to Western Europe tend to report more trust in their host countries’ governments than the native Europeans do (Adman and Strömblad, 2015; Röder and Mühlau, 2012), primarily because immigrants use the corrupt and undemocratic governments in their home countries as standards (Adman and Strömblad, 2015; Röder and Mühlau, 2012).
I posit two reasons why people in authoritarian countries may have lower standards. First, in a democratic country, there is always a large segment of electorate that fails to elect their preferred parties. This experience inculcates a sense of ‘being in the opposition’, which disposes the electorate to more stringent judgement. Second, people in democratic countries are exposed to more critical information about their governments. Criticisms from opposition parties and free press set the parameters of what to expect from the governments. By fighting a president’s overreach of executive power, for example, an opposition party helps shape citizens’ conception of the boundaries of executive power. By contrast, people in authoritarian countries have less such exposure and they have narrower visions of what their governments can, and should, deliver. They have less to expect and lower standards to apply.
Five-country survey
The above theory suggests a negative association between authoritarianism and standards of judgement (H1). A major challenge to testing this hypothesis is measuring standards, which are not directly observable. A promising tool is the ‘anchoring vignettes’ method developed by King et al. (2004); King and Wand (2007); Wand et al. (2011). The method was originally invented to correct for differential item functioning (DIF) in cross-national surveys – namely, people mean different things by the same words. By ‘an affluent life’, a person in a poor country may mean ‘having enough to eat’, whereas a person in a rich country may mean owning a four-bedroom house and two cars. Because DIF implies different standards, the method enables researchers to derive different standards.
Survey design
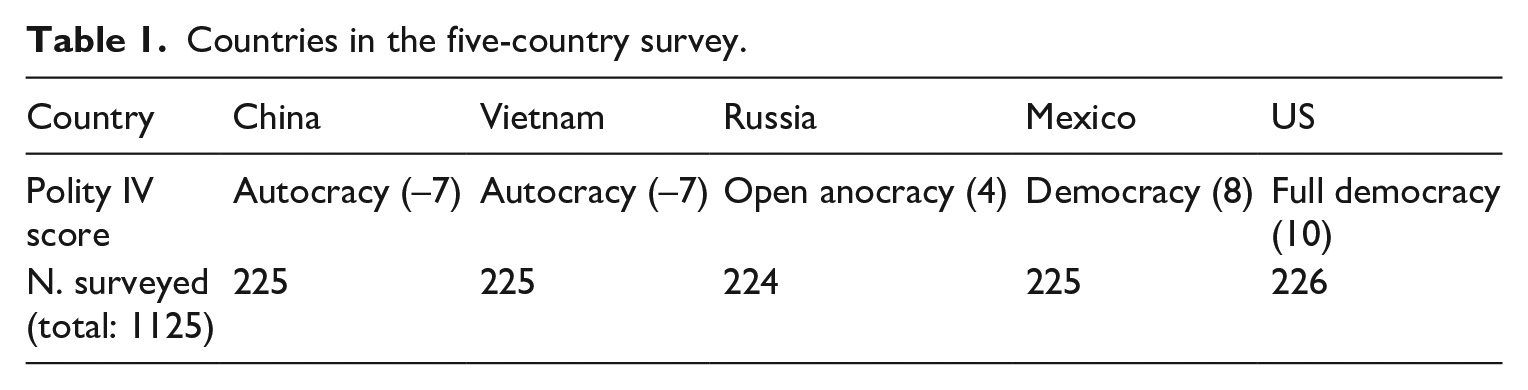
In 2017, I conducted an online survey in China, Vietnam, Russia, Mexico, and the United States as the first step to test H1. My case selection is driven by considerations, including survey service availability in a certain country, my research budget, and the need to diversify regime types. Rated by Polity IV as an autocracy, an autocracy, an open anocracy, a democracy, and a full democracy, the five countries represent a diverse range of regime types. The five countries are admittedly a small sample out of all countries, yet this limitation can be complemented by the additional layers of analyses I will present later.
As Table 1 shows, a total of 1125 respondents were polled, around 225 respondents in each country. Respondents were asked to answer questions of key variables. I applied quotas on gender, age, and education in the sampling process to make my samples match those in the World Value Surveys 2010–2012 Wave (the quotas are presented in Table S1 in the Supplemental appendix). The same questionnaire was presented in Chinese, Vietnamese, Russian, Spanish, and English for respondents in China, Vietnam, Russia, Mexico, and the United States, respectively.
Countries in the five-country survey.
I focus on two opinions: trust in the national government and responsiveness of the national government. Following King et al.’s (2004) design, I first asked the respondents what I call the self-rating question:
How much trust do you have in your national government?
Complete trust (5)
A great deal of trust (4)
A moderate amount of trust (3)
A little trust (2)
None at all (1)
Then, the respondent was asked to answer four vignette questions associated with four vignettes. As King et al. (2004) recommended, I randomised the order of the four vignette questions for each respondent. Each of the four vignette questions came with the following options:
Complete trust (5)
A great deal of trust (4)
A moderate amount of trust (3)
A little trust (2)
None at all (1)
How much trust does Mike have in his national government?
How much trust does Jennifer have in her national government?
How much trust does Paul have in his national government?
How much trust does Jasmine have in her national government?
The vignettes focussed on tax reform because it is an issue that respondents across the countries should understand and relate to. By these criteria, tax reform is preferable to issues like pension reform because the latter is less relatable to younger respondents. In addition, because the concept these vignettes were intended to capture was political trust, I needed an issue in which the government has a potential conflict of interest, where the masses and the government may prefer different tax rates. In this sense, tax reform is preferable to issues like food safety because the latter involves no obvious conflict of interest for the government. Since trust finds its purest expression in uncertain and unfavourable circumstances, I deliberately created characters who were ignorant of the policy details but aware of its potential negative influence.
By comparing different respondents’ ratings for the same vignette, we can know if there is DIF (i.e. different standards). By comparing different respondents’ positions relative to the hypothetical individuals in vignettes, we may correct for DIF. To illustrate, suppose we have two respondents from two countries, Self1 and Self2, who both rate their own trust as a moderate amount (3). Also suppose that the two respondents have different ratings for the vignette questions. Self1 rates Mike’s, Jennifer’s, Paul’s, and Jasmine’s trust as complete (5), a great deal (4), a moderate amount (3), and a little (2), while Self2 rates the trust of these same individuals as a great deal (4), a moderate amount (3), a little (2), and none at all (1). In giving higher overall ratings to the vignettes, Self1 shows lower standards than Self2. As Figure 1 illustrates, we can stretch the rubber bands to match the two respondents’ frames of reference and make their responses comparable. It turns out that although the two respondents give the same self-rated responses, their responses indicate different realities, with Self2’s government being more responsive. We can apply the logic of rubber-band-stretching and recode the self-ratings based on one’s position relative to those of the hypothetical individuals. Thus, a respondent may be placed in one of the nine possible positions: below Jasmine’s (1), same as Jasmine’s (2), between Jasmine’s and Paul’s (3), same as Paul’s (4), between Paul’s and Jennifer’s (5), same as Jennifer’s (6), between Jennifer’s and Mike’s (7), same as Mike’s (8), and above Mike’s (9). Because Self1’s position is the same as Paul’s and Self2’s position is the same as Jennifer’s, the DIF-corrected ratings for Self1 and Self2 ratings become 4 and 6.
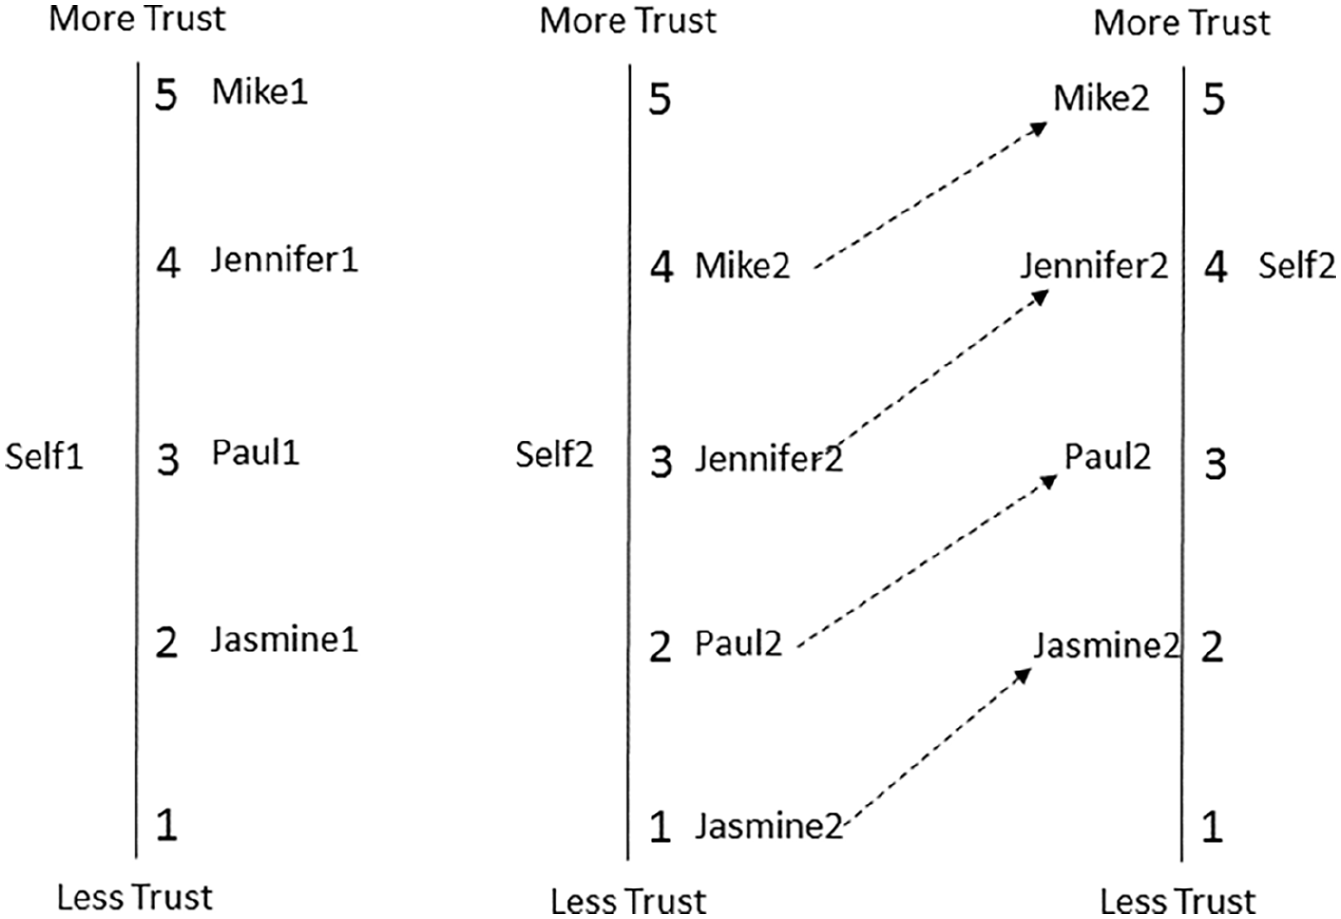
Illustration of anchoring vignettes method.
The above example is a straightforward scenario because the two respondents both rank the vignettes in my intended order – Mike’s government being the most responsive and Jasmine’s being the least responsive. But in practice, respondents may deviate from this order or create ties by giving the same rating to different vignettes. If respondents’ orders and those of a researcher differ systematically, it indicates that the vignettes are poorly written and do not effectively reflect their intended orders. To know if this problem exists, I examined all the respondents’ average rating for each vignette, and their aggregate-level orders of vignette ratings are consistent with my intended orders. Still, individual respondents may still have different vignette orders or ties. I employed the ordered probit approach to assign single-valued DIF-corrected rating to such individuals (King and Wand, 2007). I explained the technical details in the Supplemental appendix.
When composing the vignettes, I strove to meet two measurement assumptions of the anchoring vignettes method: response consistency and vignette equivalence (King et al., 2004). Response consistency means that respondents rate vignettes and themselves the same way. This assumption would be violated if the respondent perceives major differences between themselves and the hypothetical individuals in the vignette and sets different thresholds for what amounts to, say, a highly responsive government. The key to meeting this assumption is making the vignettes relatable to respondents. This specifically requires the vignettes to be intelligible, realistic, and familiar to respondents. As explained, the theme of the above vignettes – tax reform – meets this requirement. In an additional effort to make the vignettes relatable, I gave the hypothetical individuals names considered common in the surveyed countries.
The second assumption, vignette equivalence, means that all the vignettes for a concept are perceived by respondents as representing that concept on a single dimension. In other words, the vignettes should capture different levels of the same concept. This assumption would be violated if some respondents have different or wrong understandings of the vignettes, like being confused over if the word stock means stock shares or livestock. My vignettes tried to meet this assumption through concrete examples and precise language.
Guided by the two assumptions, I designed the following questions for government responsiveness in policy making. Same as the questions about political trust, the self-rating question below was asked first.
How responsive is your national government in making policies that address citizens’ needs?
Extremely responsive (5)
Largely responsive (4)
Somewhat responsive (3)
Not very responsive (2)
Not responsive at all (1)
Then four vignette questions were asked. They were shuffled for each respondent and they had the same five options: 1
Extremely responsive (5)
Largely responsive (4)
Somewhat responsive (3)
Not very responsive (2)
Not responsive at all (1)
How responsive is Charles’s national government in helping solve local problems?
How responsive is Susan’s national government in helping solve local problems?
How responsive is Patrick’s national government in helping solve local problems?
How responsive is Tom’s national government in helping solve local problems?
I centred the vignettes on school building safety regulations because it is close to an issue of consensus, in the sense that most people would think a government responsive for meeting the public demand to enact school building safety regulations. Contrast this to an issue of controversy, say, expanding immigration. Even if a government’s pro-immigration policies have public support, a hard-line respondent could still think of it as being unresponsive. If numerous, such cases could violate the assumption of vignette equivalence.
Results
The self-ratings for the two opinions are reported in Figures 2 and 3. As expected, they show more favourable public opinion in authoritarian countries. In the stacked bar chart in Figure 2, the five countries can be ranked from more to less trust as China, Vietnam, Russia, the United States, and Mexico. The same ranking emerges with regard to government responsiveness in Figure 3. Can the differences between countries be attributed to people’s different standards as H1 predicts? Let us look at whether people in different countries have different ratings for the same vignettes.
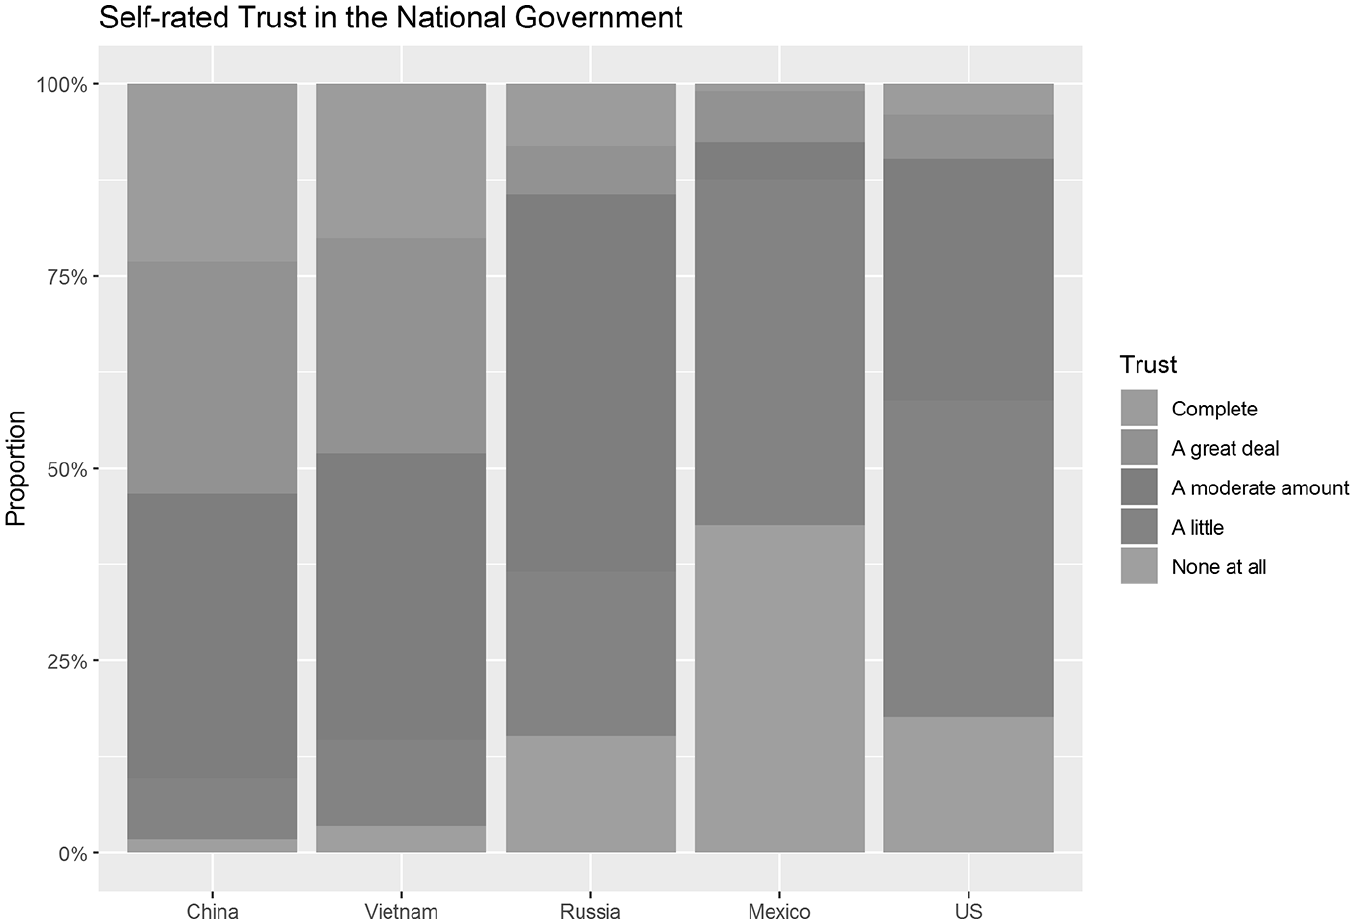
Self-rated trust in the national government.
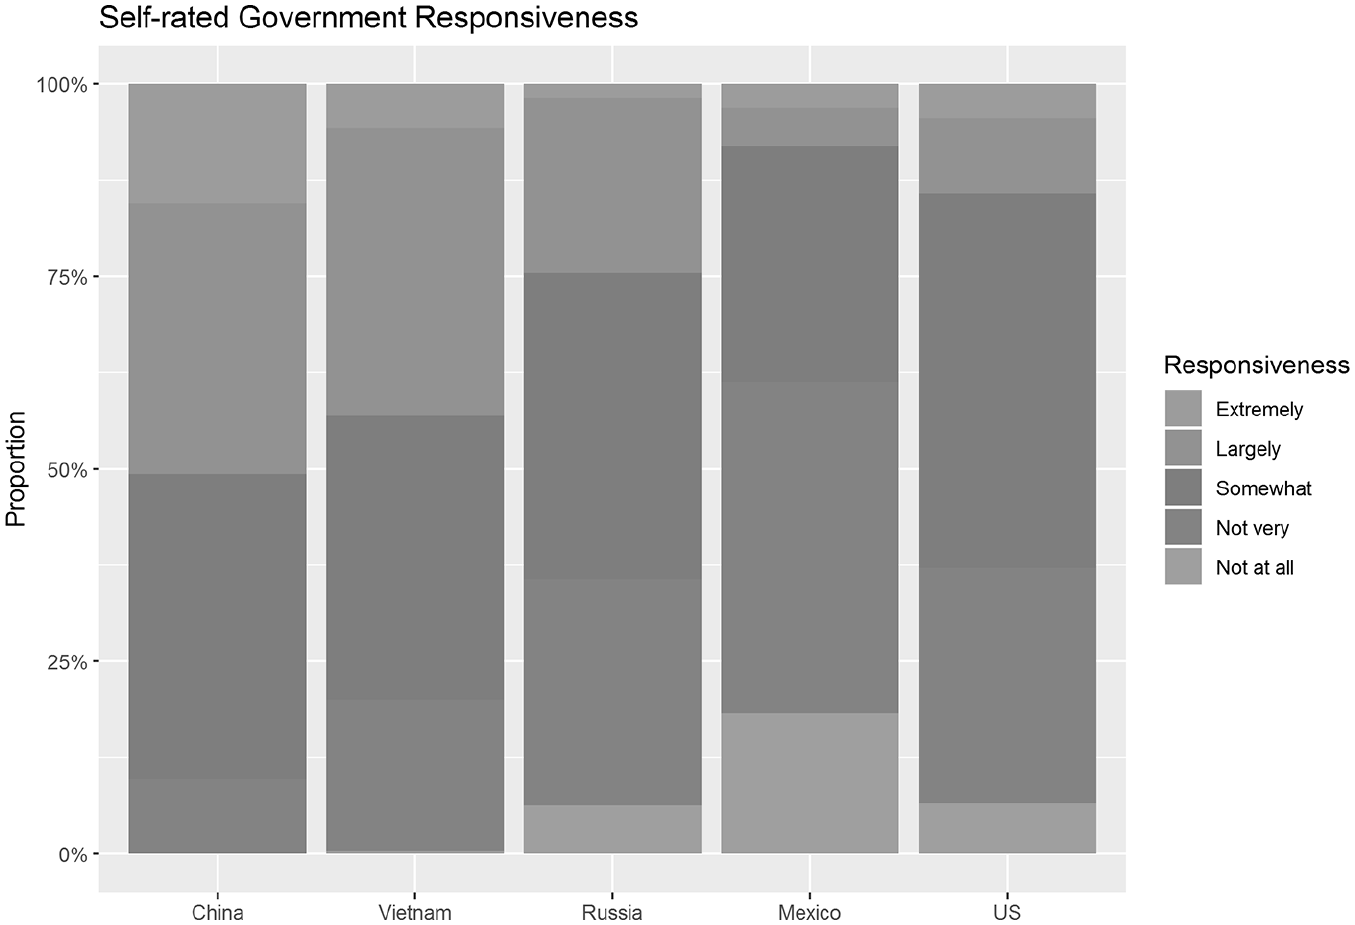
Self-rated government responsiveness.
Figures 4 and 5 display each country’s average rating for each of the four vignettes. Recall that by design, Vignette 1 describes the most positive scenario and Vignette 4 the most negative scenario. Giving lower average ratings to all of the four vignettes, the Mexicans stand out for their high standards for political trust in Figure 4. Each panel in Figure 4 shows similar ladle-shaped patterns, in which Mexico displays the lowest ratings for all four vignettes. The findings from Mexico and the United States deserve attention. Mexico is less democratic than the United States, but why do the Mexicans apply more strict standards when reporting political trust? One possible answer is that Mexico has a bigger effective number of parties and consequently louder vocal opposition voice (Lijphart, 2012). In this sense, the pair of Mexico and the United States are still compatible with the theory behind H1.
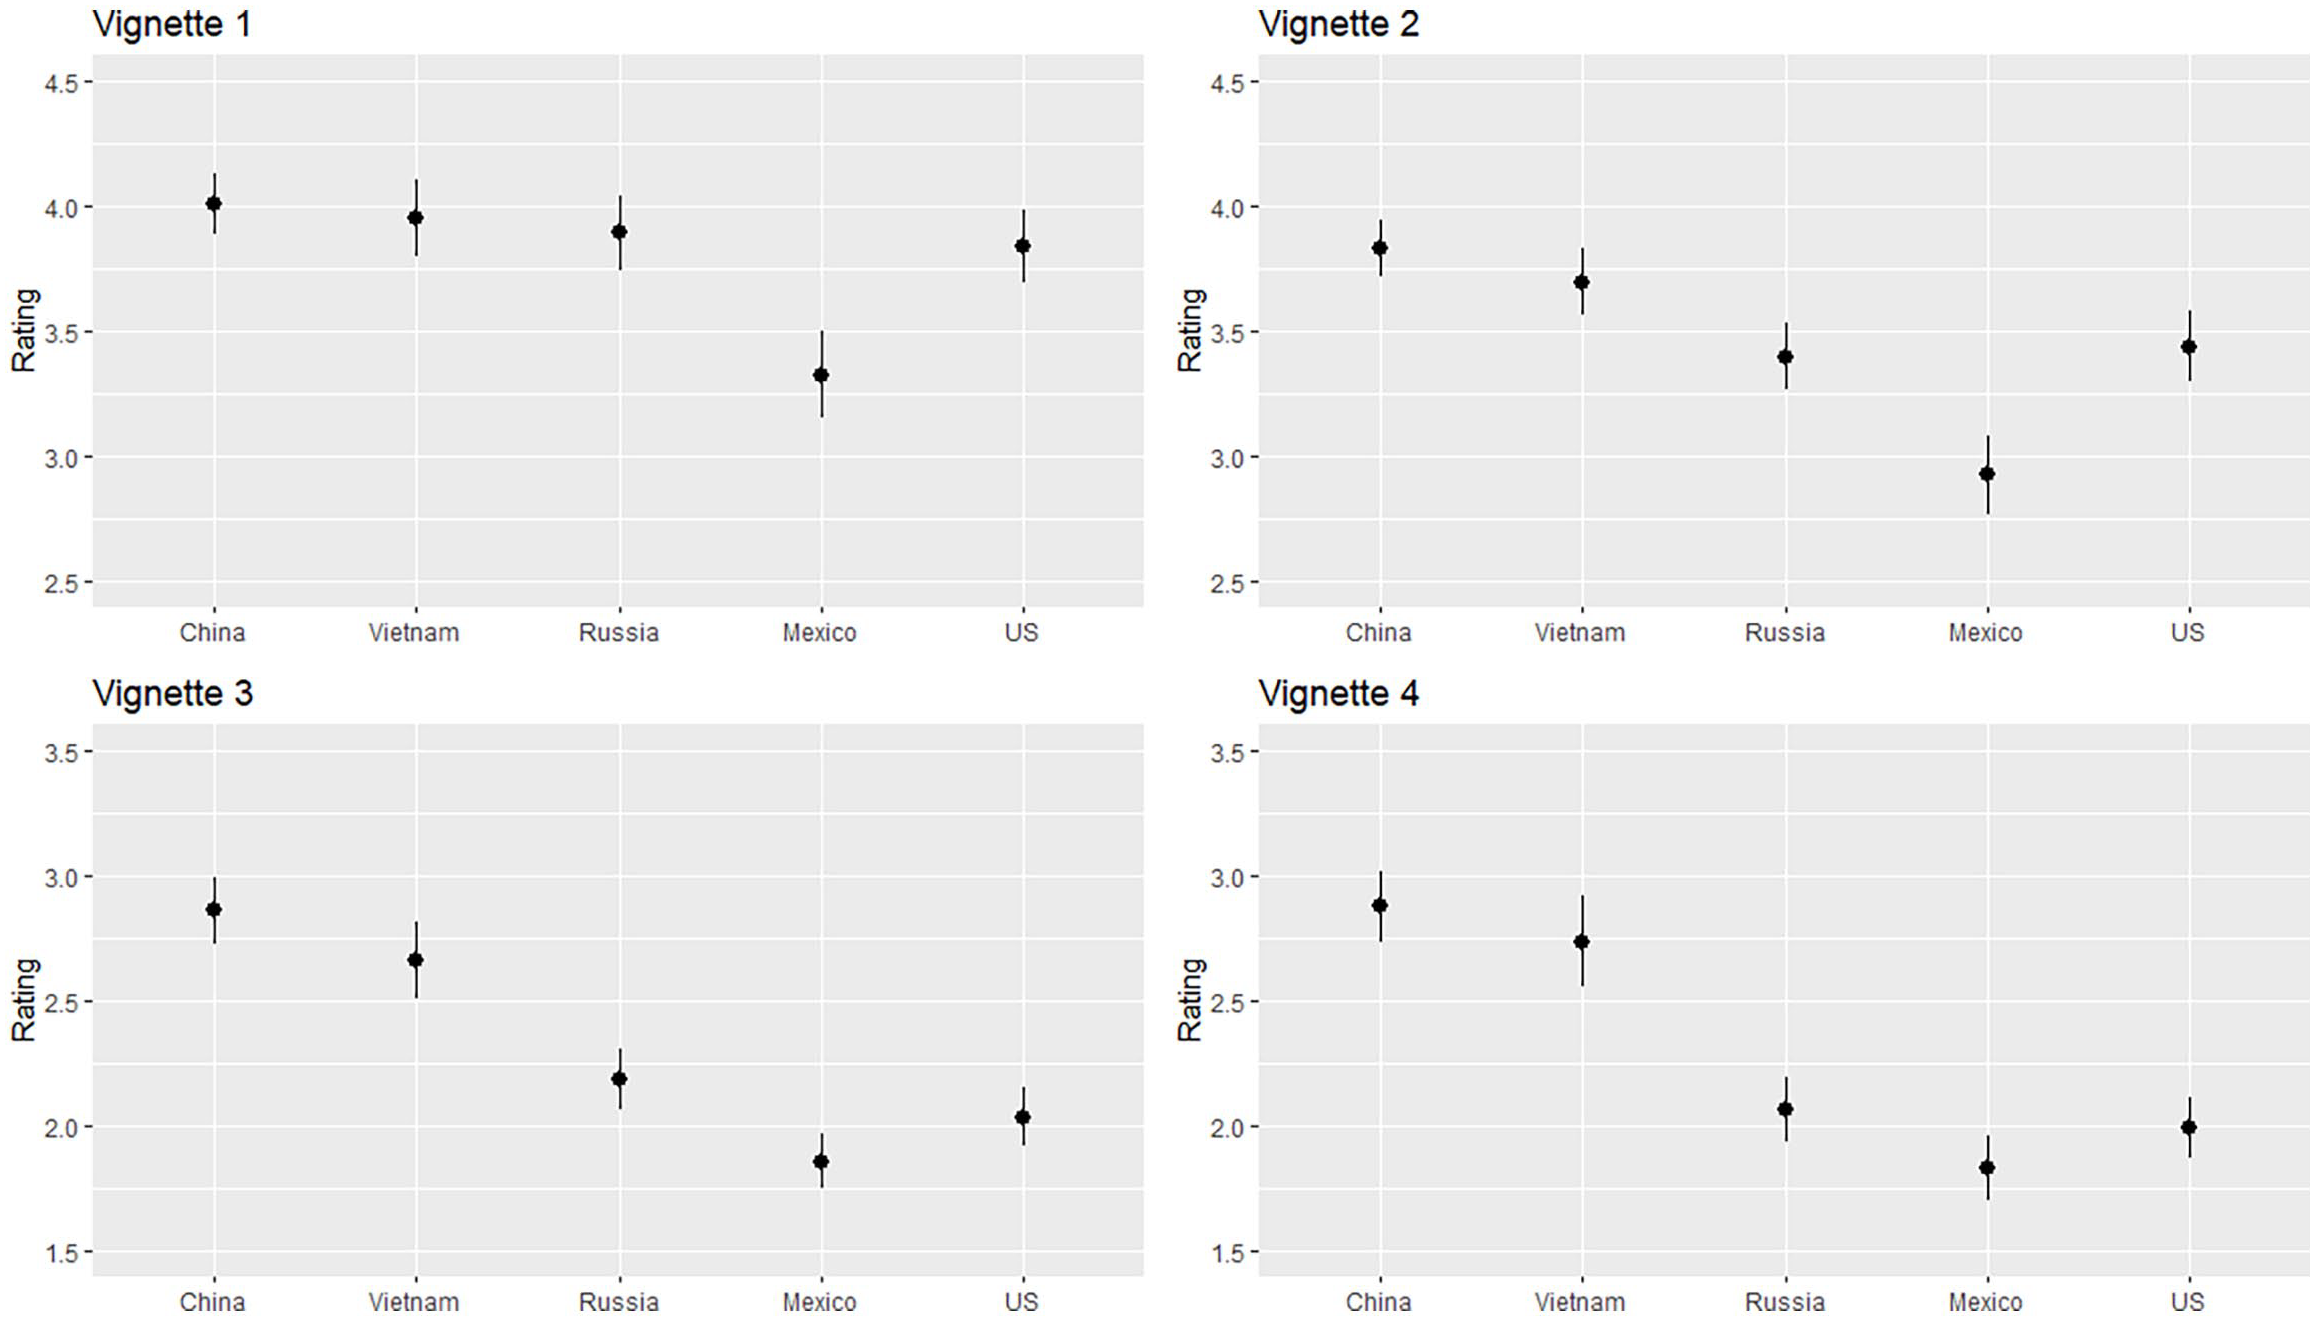
Vignette ratings for political trust.
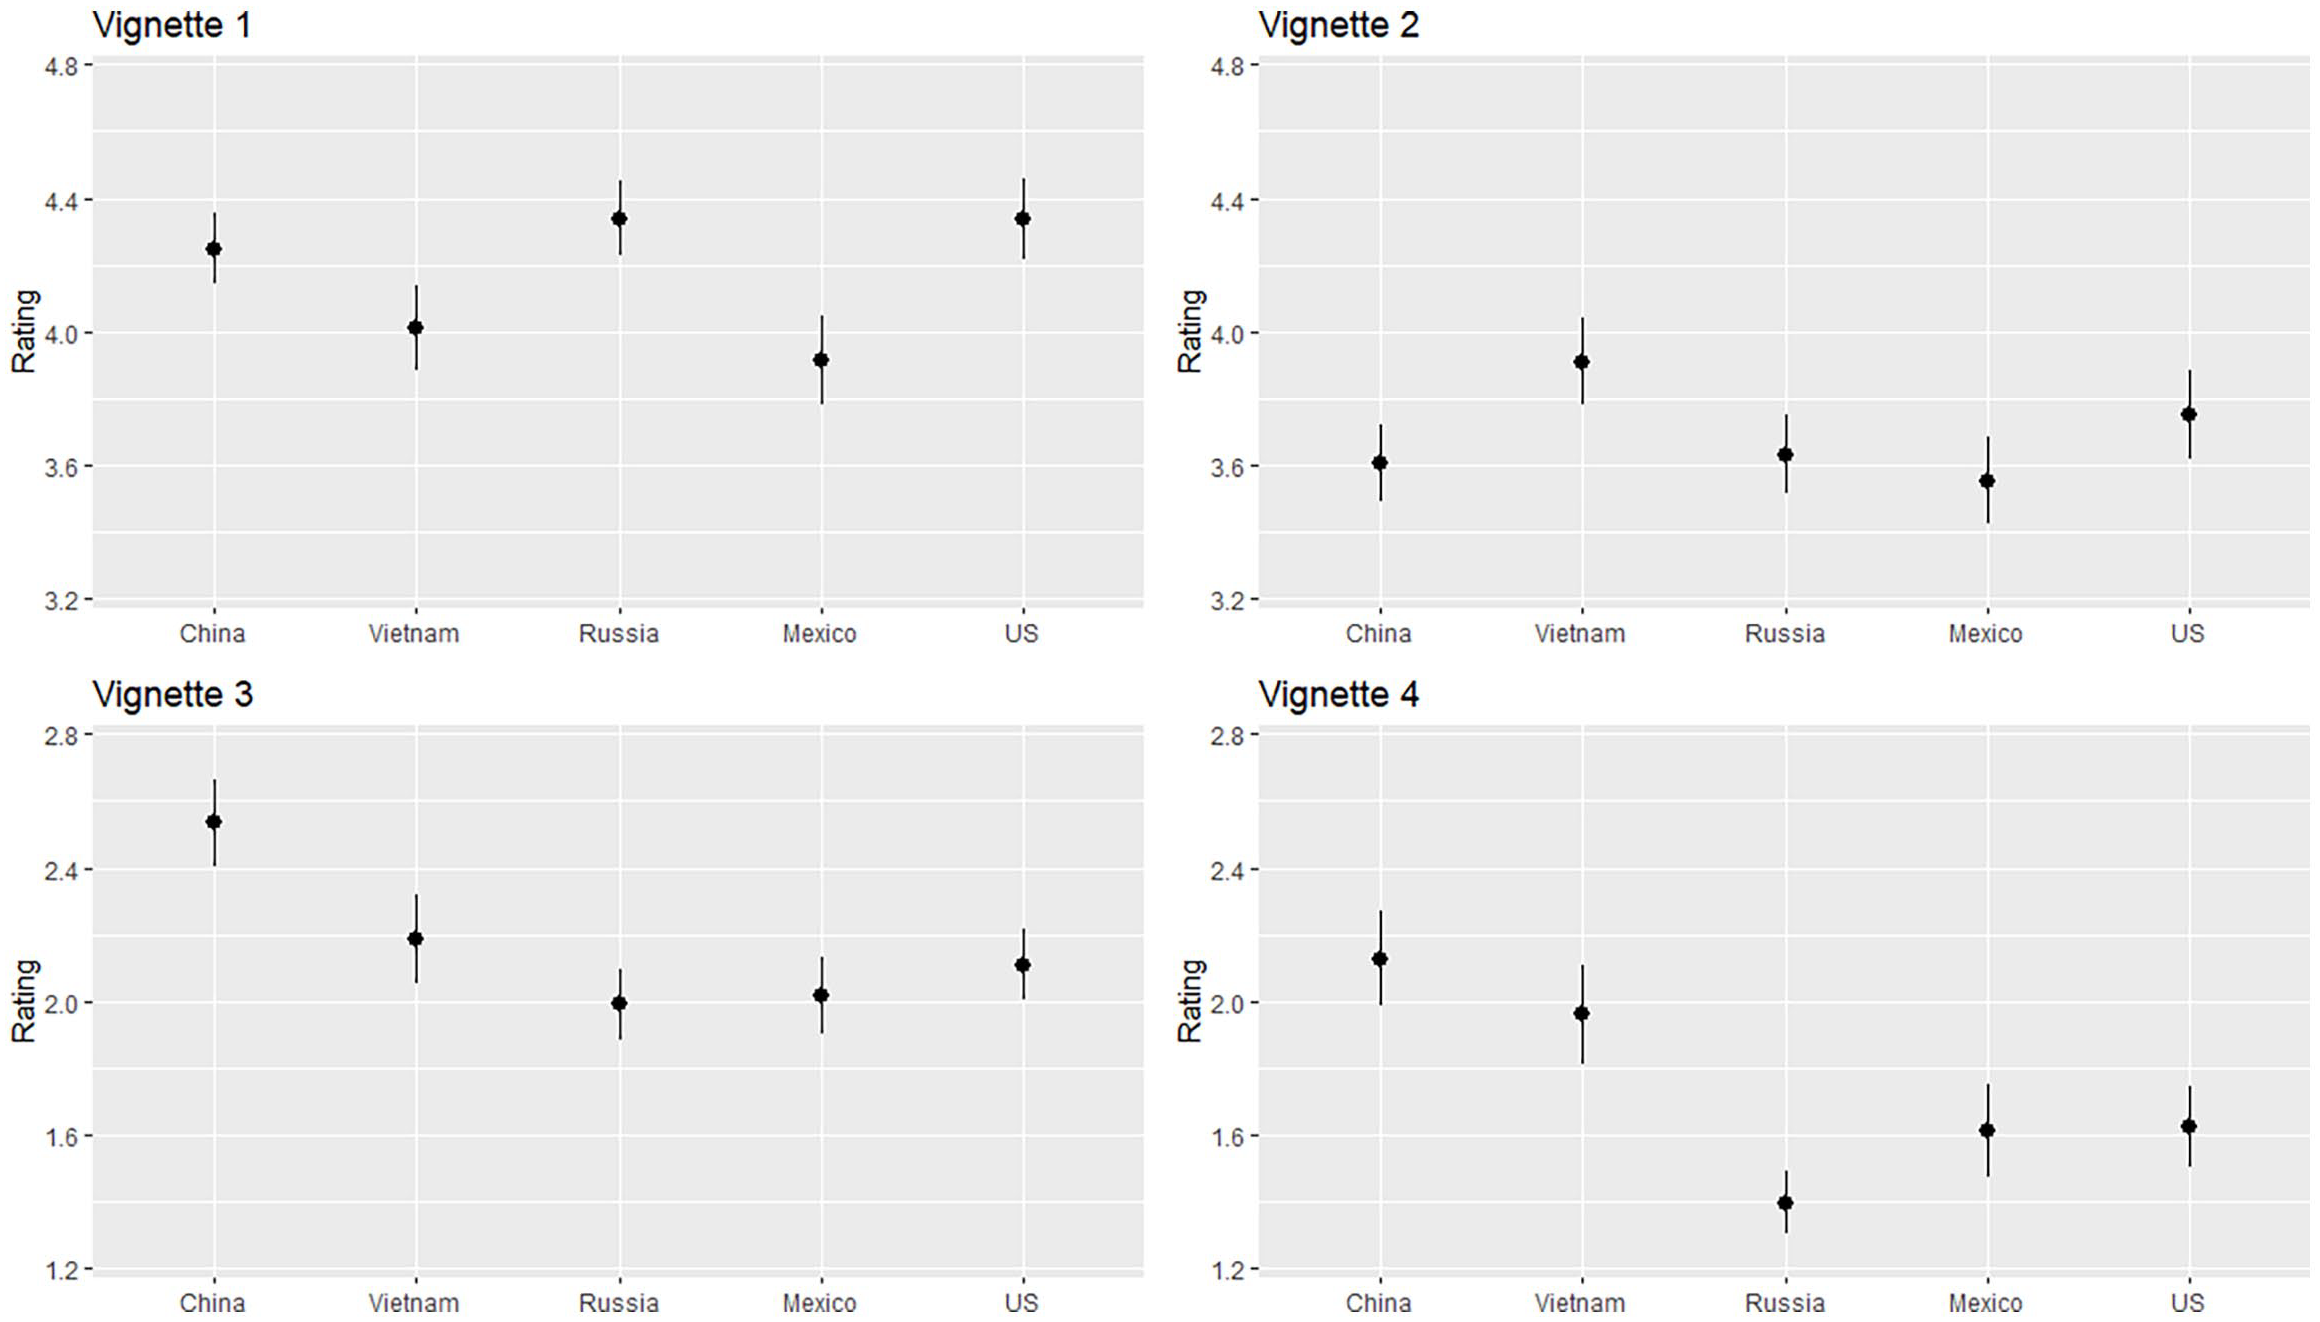
Vignette ratings for government responsiveness.
Other findings are worth discussing. When we compare the patterns of the four vignettes, we see little cross-national variation regarding Vignette 1. This suggests that respondents in the four countries are generally comfortable giving high ratings to the most trustful scenario. However, countries begin to diverge once we move to Vignettes 2, 3, and 4 – the ratings in China and Vietnam are consistently higher than those in Russia and the United States. Given that electoral competition is absent in China and Vietnam but exists in Russia, Mexico, and the United States to varying degrees, this finding supports H1. A more puzzling pair is Russia and the United States. The two countries are considerably different in their levels of democracy, yet they exhibit similar standards of judgement.
Turning to government responsiveness, the cross-national patterns are not palpable as those in political trust. There is no clear pattern in the panels of Vignettes 1, 2, and 3 in Figure 5. But a ladle-shaped pattern shows up in the panel of Vignette 4. People in China and Vietnam apply lower standards in evaluating the least responsive scenario than the people in the other three countries. This time, Russia, not Mexico, exhibits the highest standards.
Do the different standards contribute to the more favourable public opinion in authoritarian countries? Figure 6 presents the average self-ratings of the five countries side by side with the average self-ratings corrected for DIF. The right panels in the figures can be understood as public opinions adjusted for standards of judgements. The figures show that after accounting for standards of judgement, the rankings of the five countries do not change, but the gaps between countries shrink – Russia, Mexico, and the United States are brought closer to China and Vietnam. Notably, after the adjustment, the political trust and government responsiveness in Vietnam and Russia become indistinguishable in the sense that their error bars overlap. T-tests between self-ratings and DIF-adjusted ratings are presented in the Supplemental appendix.
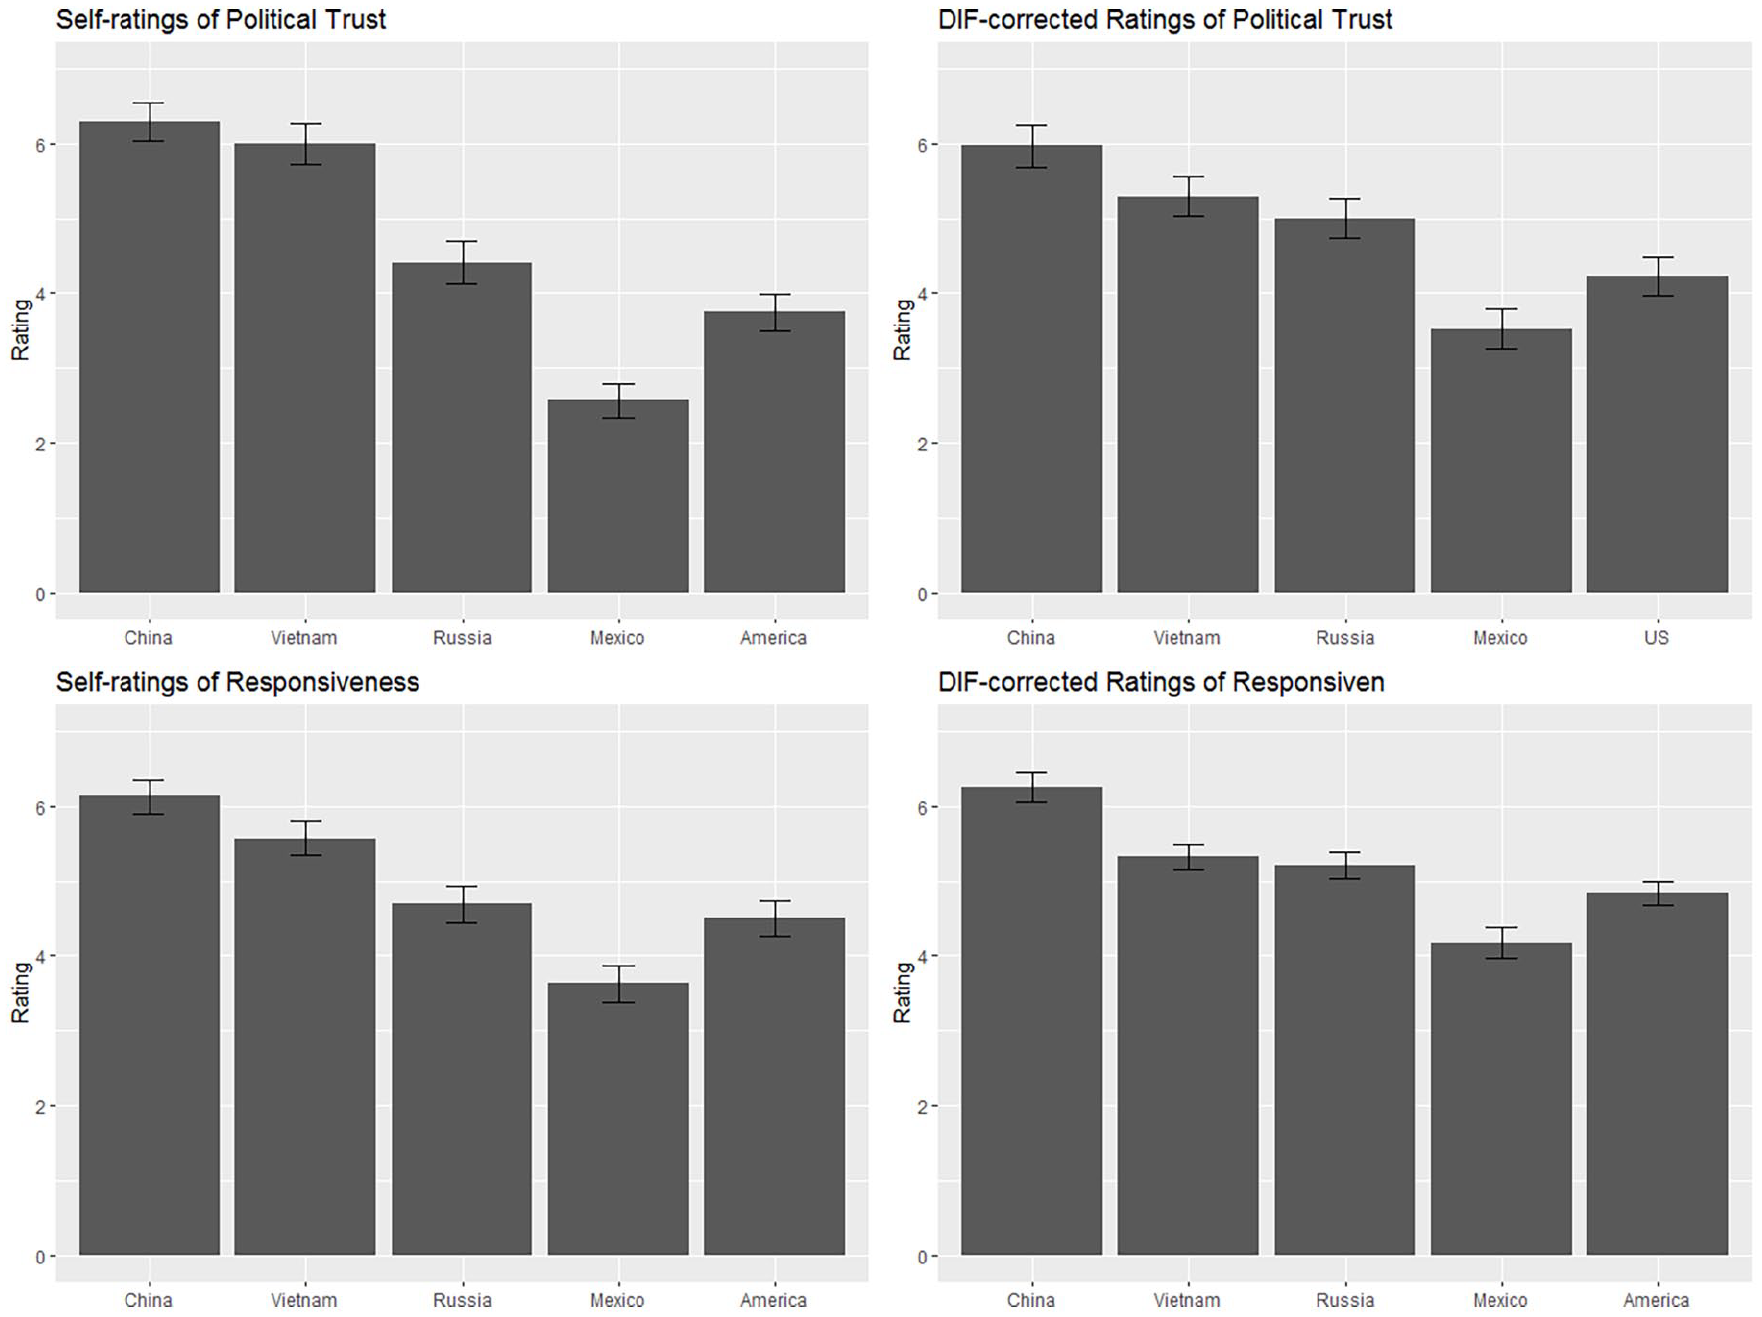
Comparing self-ratings with DIF-corrected ratings.
To summarise, my analysis lends some support to H1 once I contrast autocratic China and Vietnam on one hand, and Russia, Mexico, and the United States, on the other. It further shows that the low standards can at least partly explain why authoritarian governments enjoy more trust and better perceptions of responsiveness. In addition, the cross-national differences concentrate on vignettes describing negative scenarios, suggesting that people in all five countries tend to rate good performance as good but people in autocracies are reluctant to rate poor performance as poor. However, H1 receives mixed support between Russia, Mexico, and the United States, which allow different degrees of electoral competition and opposition voice. Mexico has a lower level of democracy than the United States, but the Mexicans apply the most strict standards in reporting political trust. Russia has a lower level of democracy than the United States, but the Russians do not differ from the Americans significantly in either trust or government responsiveness.
As for the fairly robust differences between China and Vietnam on one hand, and the other three countries on the other, one concern is that my five-country survey cannot definitively attribute the differences to regime types. It may not be political systems that caused the different standards of judgement (the political system theory hereafter). The findings are observationally equivalent with respect to two other theories: The lower standards in China and Vietnam are caused by their lower levels of economic development (the development theory); the lower standards in China and Vietnam are caused by their fast and sustained economic growth in recent decades (the growth theory).
Follow-up survey of Taipei and Beijing
To further investigate which of the three theories hold more truth, I conducted an online survey in Taipei and Beijing in 2018. Respondents for Taipei were sampled from the Greater Taipei Area, covering Taipei City, New Taipei City, and Keelung City. The three cities are officially independent administrative units, but in recent years are increasingly integrated into a single metropolitan area similar to Beijing. In the Greater Taipei Area, people commute daily, governments coordinate their governance, and a discussion has taken place about a possible merger of the three cities (Shen, 2020).
I selected Beijing and Taipei to control for culture, language, and, to a lesser extent, population. Both populations are deeply influenced by Confucianism and speak Mandarin Chinese as their official language. Both cities are capital cities covering populous metropolitan areas. Although Beijing’s population is three times Taipei’s, the population gap between the two is narrower than those between the five countries earlier studied. These similarities help compensate for the lack of representativeness stemming from the small number of cases in my earlier five-country studies.
The two cities have differences corresponding to the three rival theories (see Table 2). Beijing and Taipei are political centres of an authoritarian society and a democratic society. In terms of levels of economic development, Taipei’s gross domestic product (GDP) per capita in 2007 was 40% higher than that of Beijing. When it comes to rates of economic growth, from 2004 to 2014, Mainland China was clearly in the lead. As I will show, these three rival theories have different implications at the individual level, which can be tested by the individual-level data from my follow-up survey. Testing societal-level theories by their individual-level implications has a long tradition and is encouraged by King et al. (1994) when there are ‘too many variables but too few cases’ (Lijphart, 1971; Verba et al., 1997). The sampling process is detailed in the Supplemental appendix.
Statistics of Beijing and Taipei.
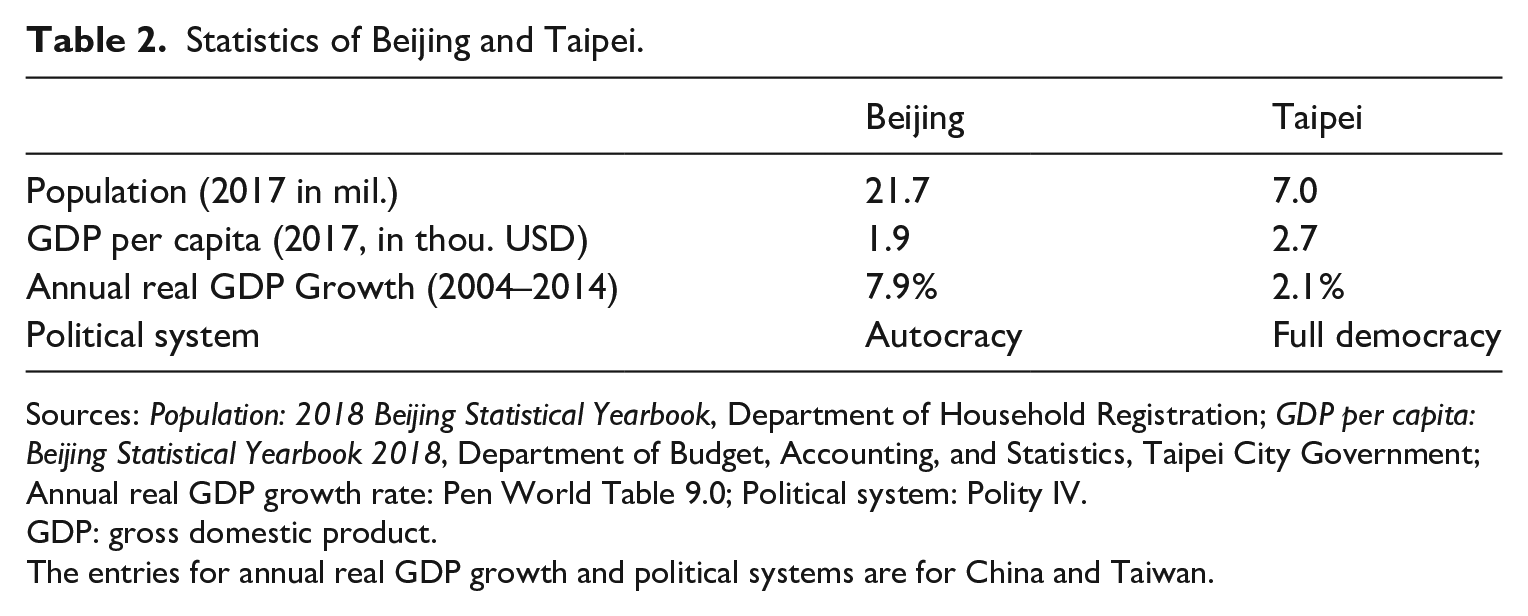
Sources: Population: 2018 Beijing Statistical Yearbook, Department of Household Registration; GDP per capita: Beijing Statistical Yearbook 2018, Department of Budget, Accounting, and Statistics, Taipei City Government; Annual real GDP growth rate: Pen World Table 9.0; Political system: Polity IV.
GDP: gross domestic product.
The entries for annual real GDP growth and political systems are for China and Taiwan.
Three rival theories
If the political system theory is true, the different standards should be explained by one’s exposure to democracy. Hence, we should expect lower standards in Beijing, and the differences in standards between the two cities should diminish after we control for respondents’ exposure to democracy (H2a).
The development theory focusses on a country’s level of economic development. Researchers have identified a strong causal relationship between economic development and changes of mass values (Inglehart, 2007; Inglehart and Welzel, 2005). When people feel secure in their basic needs, they pursue higher needs, such as democracy. Economic development raises people’s standards by expanding their list of criteria. This theory is consistent with my findings in the five-country survey because Russia (and the Soviet Union as well), Mexico, and the United States started industrialisation earlier than China and Vietnam, and now they are leading the fast-growing China and Vietnam in terms of GDP per capita. If the development theory is true, we should expect lower standards in Beijing, and the differences between the two cities should diminish after we control for respondents’ post-materialist values (H2b).
The growth theory stresses the speed of economic growth. People prefer fast and sustained economic growth and feel a sense of obligation and indebtedness to the government who delivers it, and find it cognitively dissonant to judge the high-performing government harshly even in non-economic issue areas (Festinger, 1957). This theory resonates with the research on clientelism and economic voting that shows that such a sense of obligation and indebtedness contribute to vote buying and retrospective voting (Nichter, 2008; Stokes, 2005). It is consistent with the findings of my five-country survey because China and Vietnam have experienced phenomenal economic growth in the past four decades while Russia, Mexico, and the United States have travelled slower and bumpier roads (see Figure S3 in the Supplemental appendix). If the growth theory is true, we should expect lower standards in Beijing, and the differences between the two cities should diminish after we control for respondents’ past, current, and future economic evaluations (H2c).
Results
Different standards
Is the public opinion in Taipei more favourable than that in Beijing? Figure 7 presents the self-rated trust in the national government and responsiveness of the national government in Beijing and Taipei. Consistent with my five-country survey, respondents in Beijing are much more trustful of their national government and think of it as much more responsive than the respondents in Taipei.
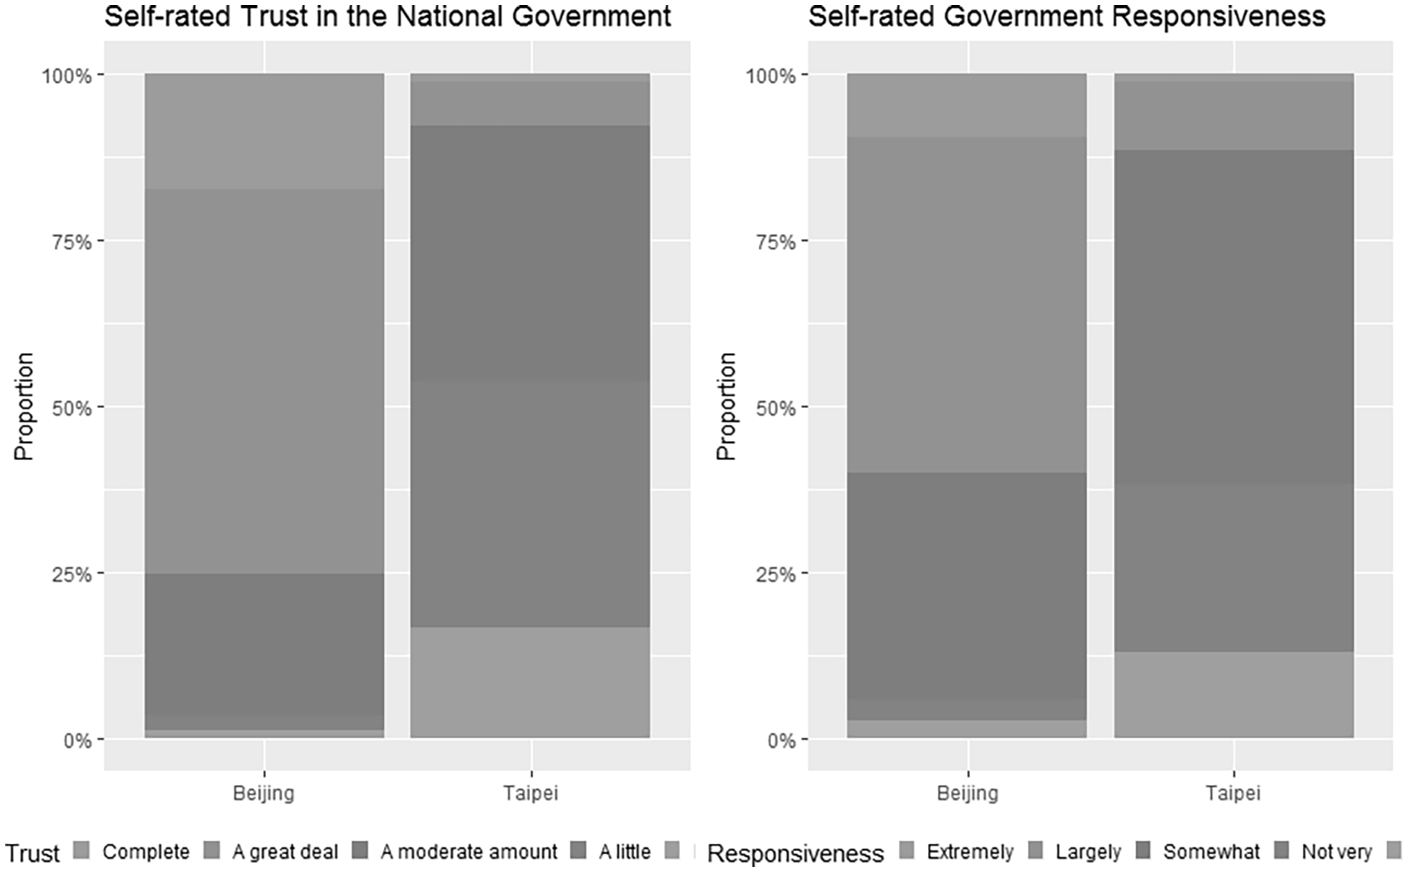
Self-rated trust in national government in Beijing and Taipei.
To know whether the respondents in Beijing and Taipei adopt different standards, we again look at how their vignette ratings differ. Corroborating the key findings in my five-country survey, Figures 8 and 9 demonstrate that for both political trust and government responsiveness, respondents in Beijing give more positive ratings across four vignettes, indicating their lower standards when reporting political trust and government responsiveness. Although the confidence intervals in some vignettes overlap, the differences between Beijing and Taipei are statistically significant in t-tests for all but Vignette 4 of government responsiveness.
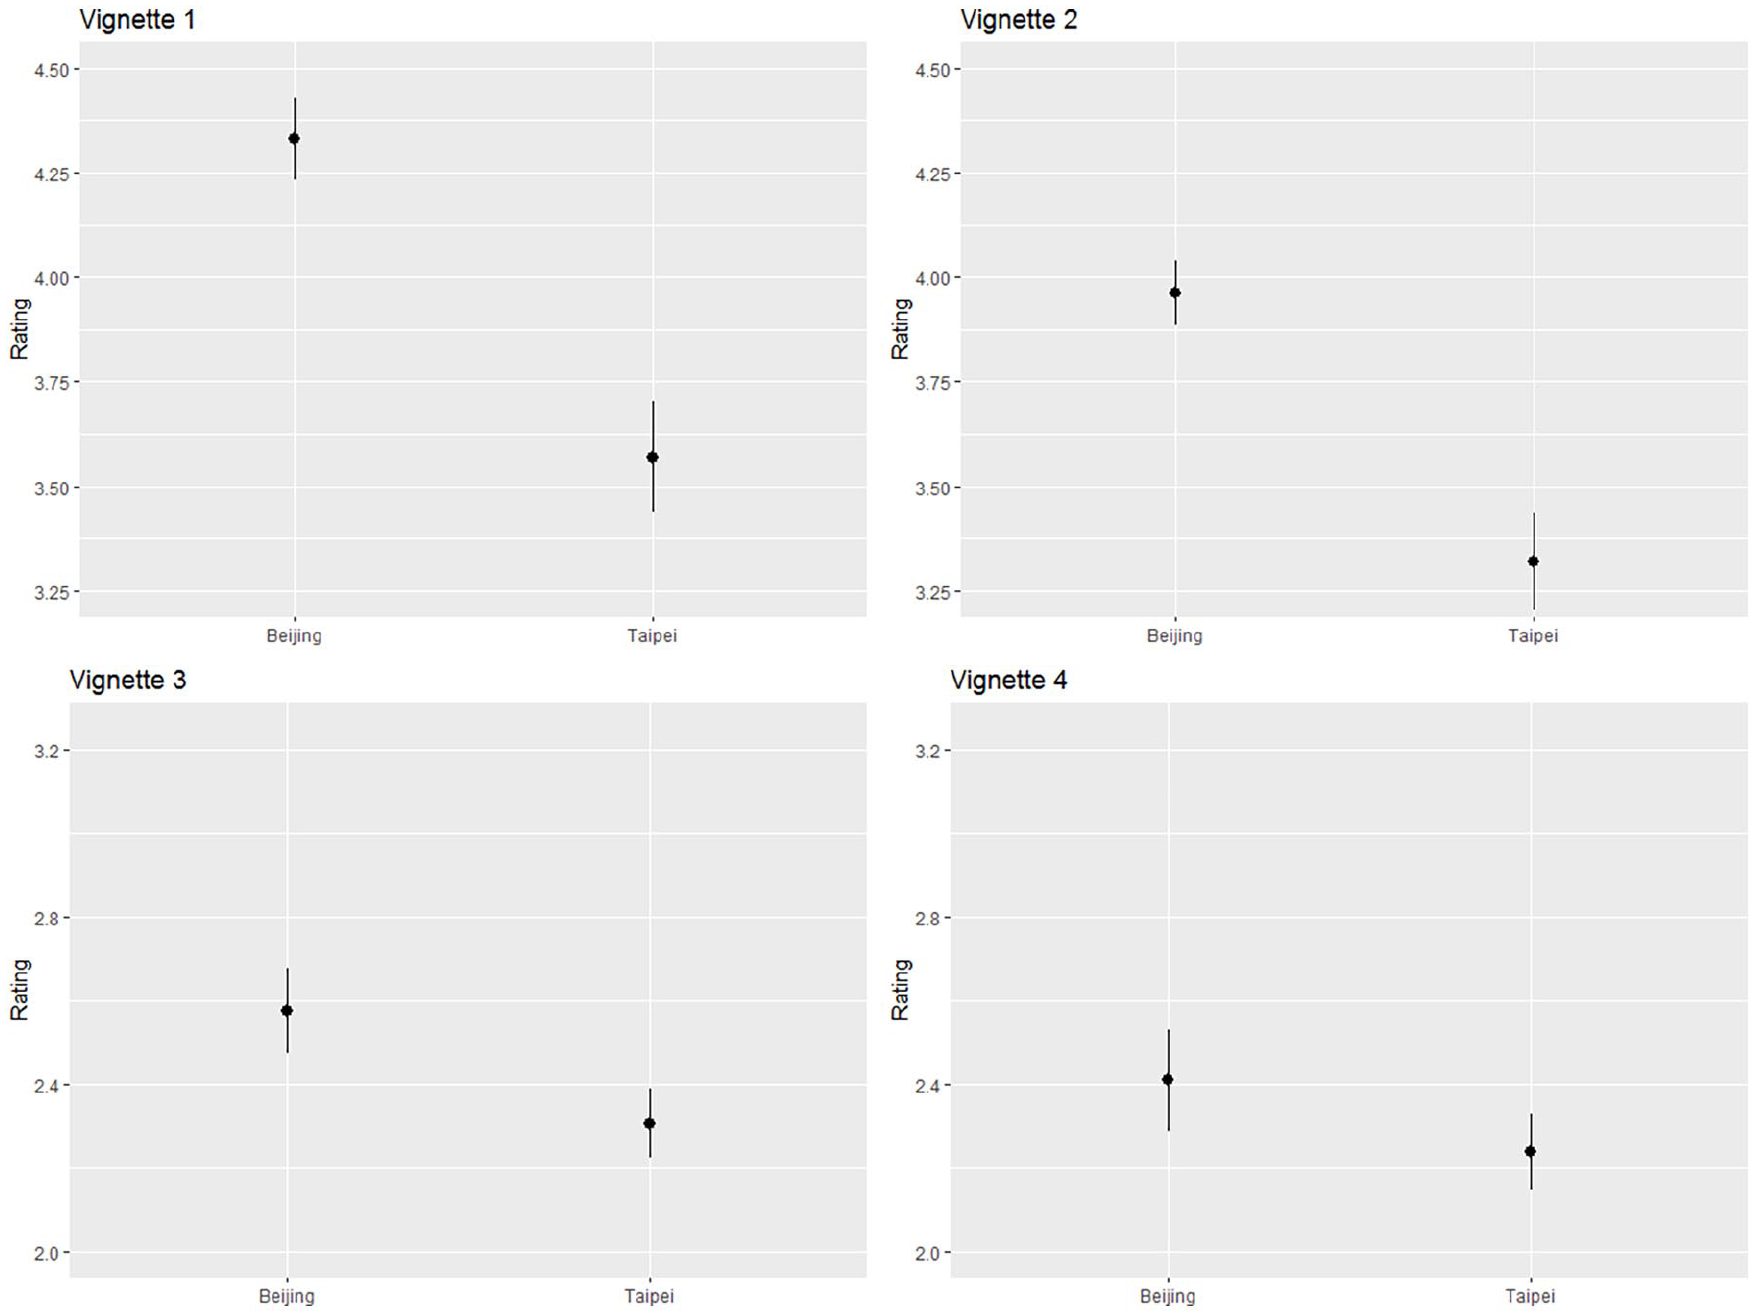
Vignette ratings for political trust in Beijing and Taipei.
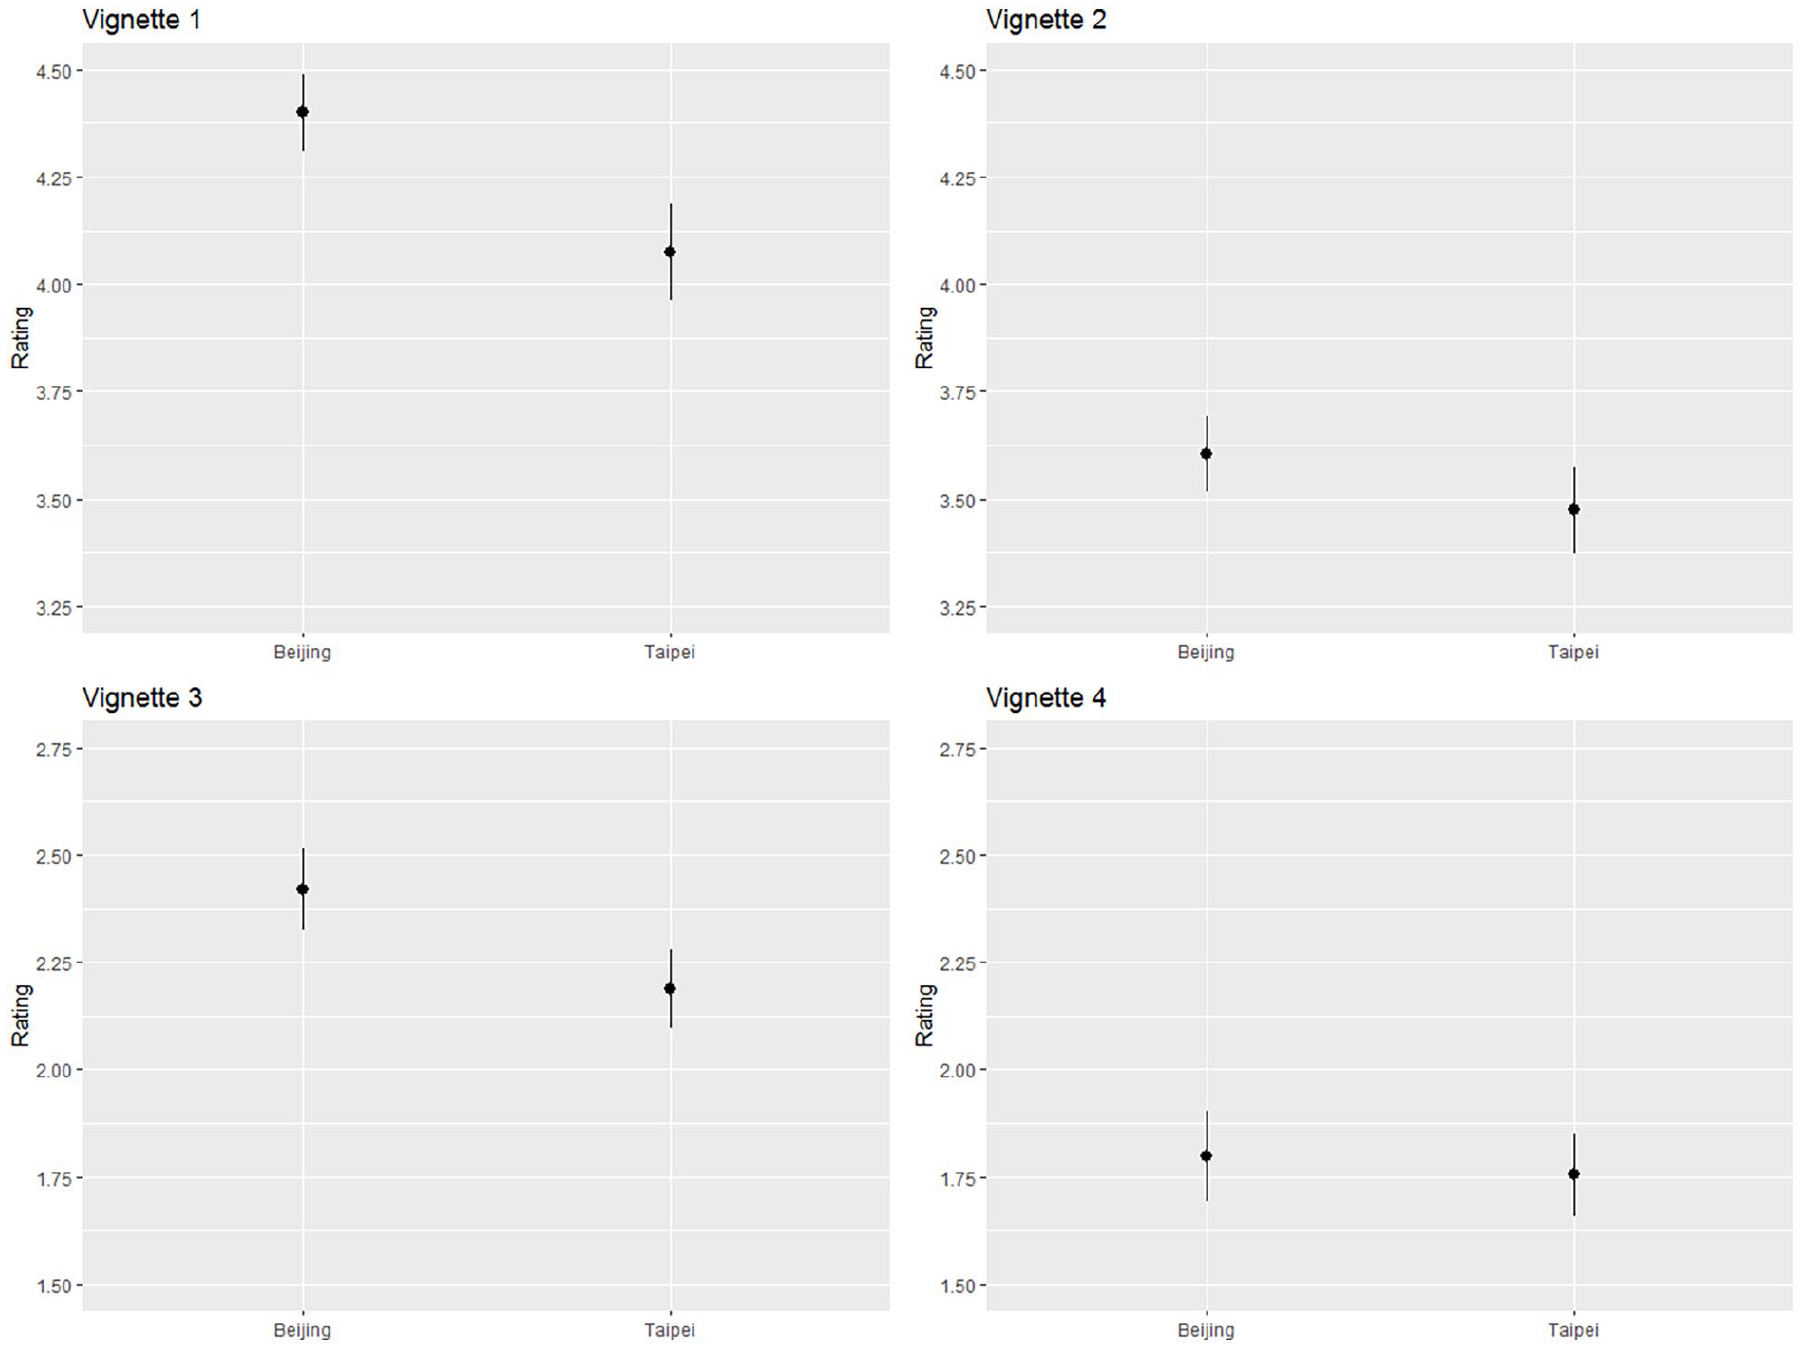
Vignette ratings for government responsiveness in Beijing and Taipei.
Testing three rival hypotheses
To compare the three rival hypotheses, I constructed four intermediary variables, two for democratic participation, one for each of the other two, and then I plugged them in a baseline ordinary least squares (OLS) regression model predicting vignette ratings with the city dummy. Which theory receives more empirical support can be judged on two criteria: (1) how much its corresponding intermediary variable dampens the coefficient of the city dummy and (2) how much it increases the R2. The more an intermediary variable does both, the more evident that it represents a causal mechanism. In the Supplemental appendix, I defended this method against concerns about multicollinearity and inaccuracy of estimation.
Table S3 in the Supplemental appendix details the survey questions I used to construct the intermediary variables. There are two intermediary variables for exposure to democracy: political participation and exposure to critical news about the government. Political participation is measured by an additive index of voting, petitioning, protesting, rallying, and contacting elected officials (yes = 1, no = 0). In creating the additive index, I added 1 to the sum of each respondent’s answers to the participation question, so as to make the minimum value 1 instead of 0. As Table S3 shows, respondents in the two cities were asked different sets of questions. For instance, only the Beijing respondents were asked about if they voted in People’s Congress elections and village/residential committee elections and only the Taipei respondents were asked about their turnouts in presidential/parliamentary and local elections. Because Beijing is less democratic than Taipei, it is necessary to discount participation in Beijing as less exposure to democracy. I therefore weighted the participation indices in the two cities by their relative levels of democracy. The 2018 Polity scores for China and Taiwan were –7 and 10 on a range of –10 to 10 (bigger numbers indicate more democracy). I rescaled the indices onto a range of 0–1. The resultant 0.15 and 1 became the weights for participation in Beijing and Taipei. With an average weighted participation index of 2.48, the respondents in Taipei were exposed to far more democracy than the respondents in Beijing, who had an average weighted index of 0.23.
The second intermediary variable for democratic participation is exposure to critical news about the government. The survey asked if the respondents were often (4), sometimes (3), seldom (2), or never (1) exposed to critical news about the government. Due to the democratic gulf between the two cities, what a Beijinger sees as critical may appear quite mild to a Taipeier. Therefore, I again applied the weights based on the Polity scores. Taipei residents, with an average of 1.33, were exposed to more critical news than Beijing residents, who had an average of 0.34.
The intermediary variable for post-materialist values is an additive index of the respondents’ attitudes to a series of statements endorsing traditional values, such as holding gender stereotypes, prioritising job security over meaning and fulfilment, and emphasising obedience in child rearing. Besides traditional values, the index is also based on one’s openness towards being neighbours with minority groups, such as people with AIDS and gays (see the full list of questions in Table S3 in the Supplemental appendix). If a respondent rejects a traditional value or does not mind being neighbours with a minority group, he or she is assigned 1. Otherwise, he or she gets a 0. The rescaled additive index ranges from 1 to 11. As expected, respondents in Taipei are more post-materialist than respondents in Beijing, as the averages of the index are 8.6 and 6.9 for Taipei and Beijing.
The intermediary variable for economic evaluations is an additive index of evaluations of the current national economy, of the current national economy compared with 5 years ago, and of the future national economy compared with now. As Table S3 in the Supplemental appendix shows, each evaluation is a 5-point scale, which results in an additive index ranging from 1 to 13 after rescaling. The table shows that the respondents in Beijing have much more positive economic evaluations than the respondents in Taipei, consistent with the objective economic indicators of China and Taiwan reported in Table 2.
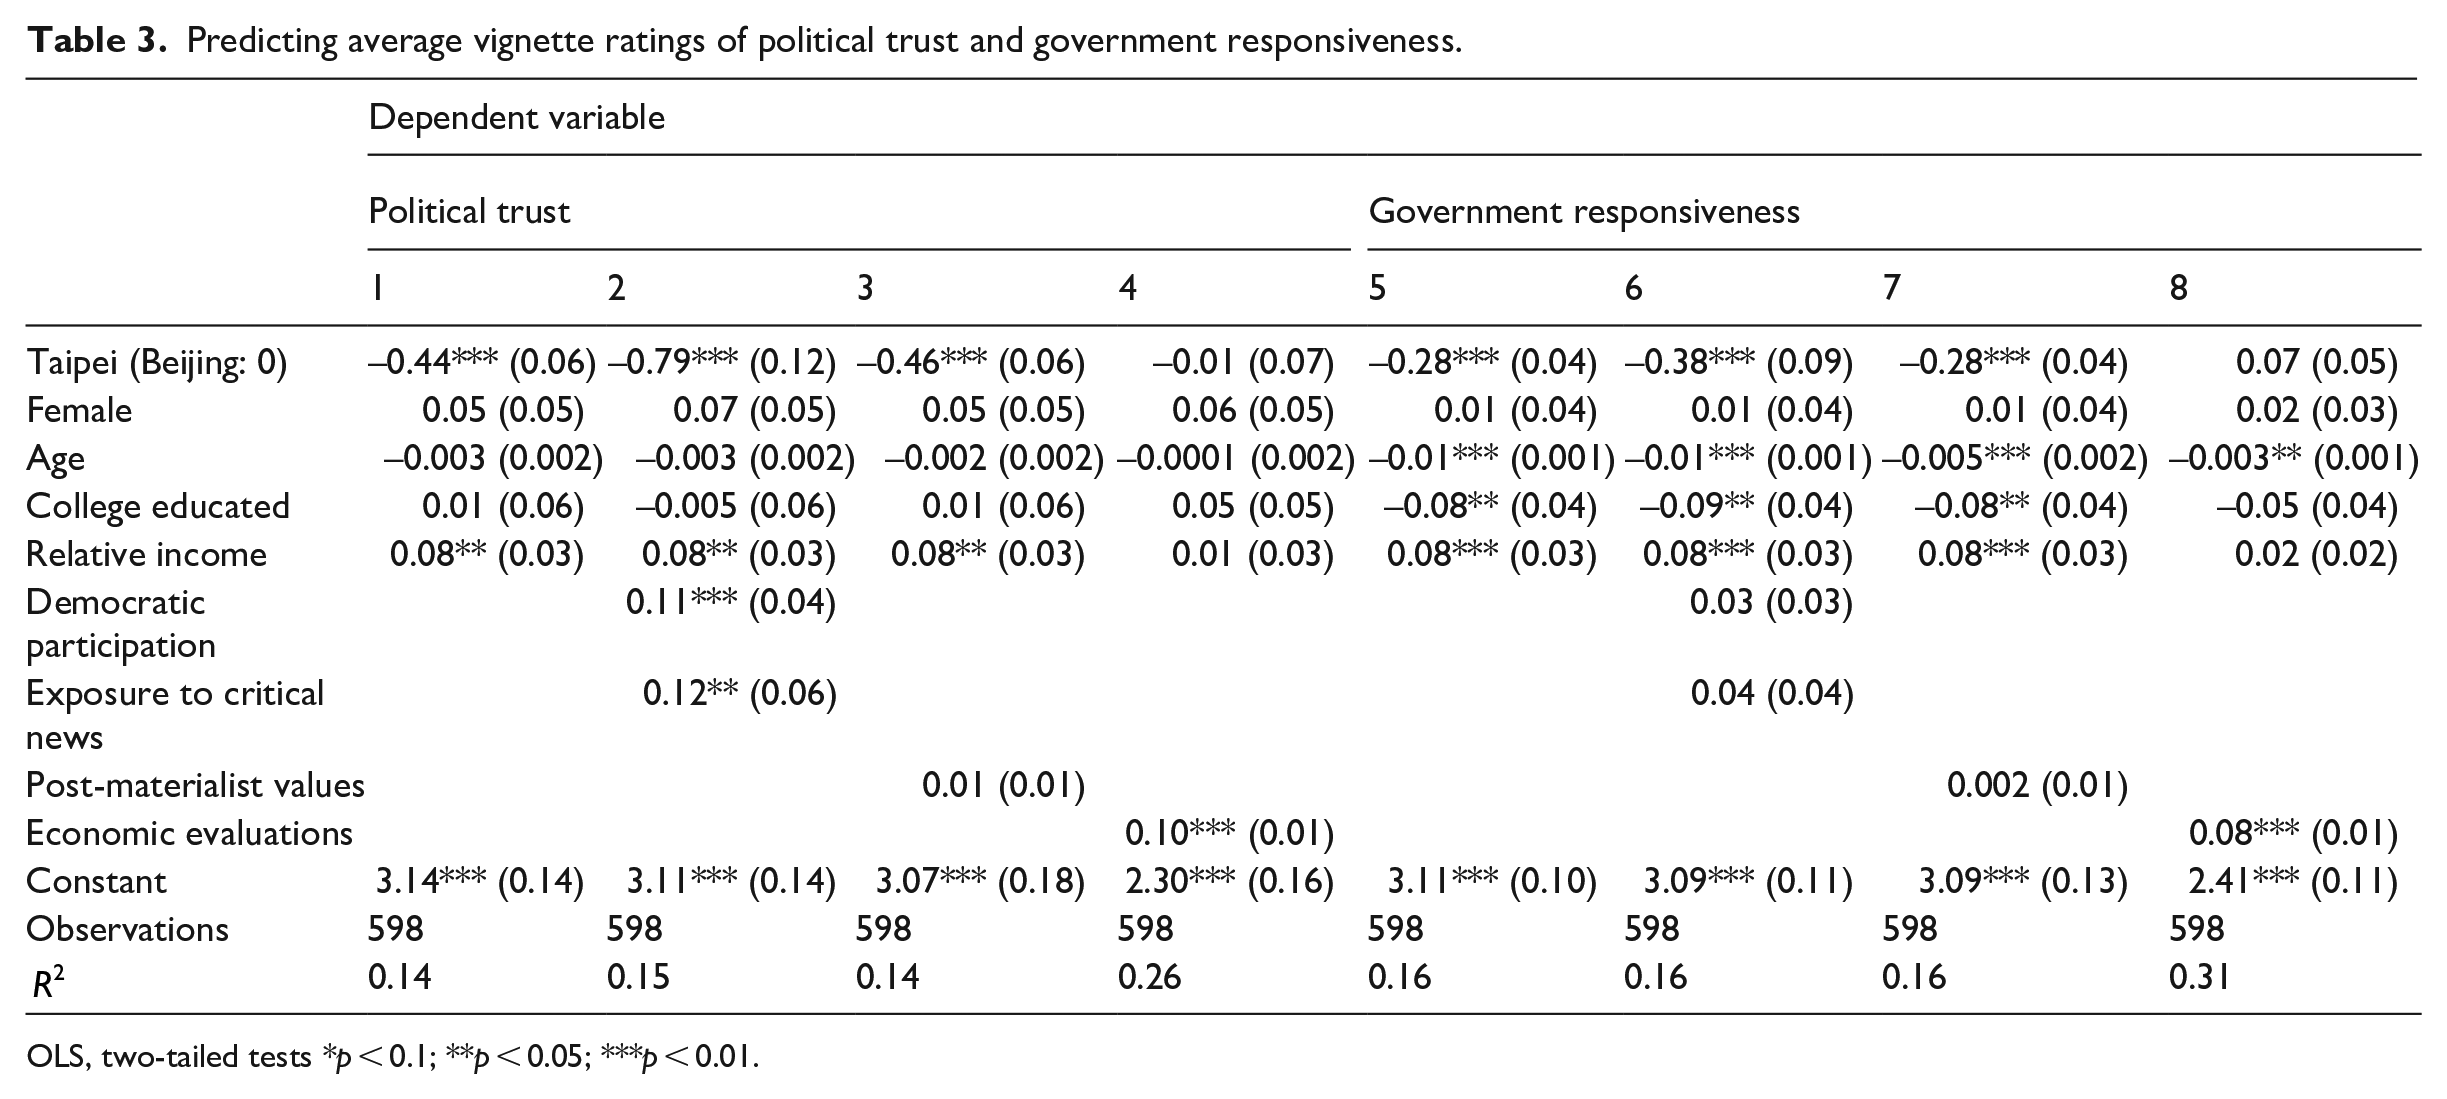
With the four intermediary variables in hand, I then plugged them into my baseline OLS regression models that used the Taipei city dummy to predict one’s average ratings across four vignettes. The regression results are reported in Table 3. The dependent variable of models 1–4 is the standard of judgement of political trust, measured by respondent’s average rating for the political trust vignettes, and the dependent variable of models 5–8 is standards of judgement for government responsiveness, measured by respondent’s average rating for the government responsiveness vignettes. Models 1 and 5 are baseline models, and each of the other models contains an intermediary variable. Echoing Figures 8 and 9, the coefficients of the Taipei dummy in models 1 and 5 are negative and significant at the 0.01 level, meaning that the respondents in Taipei gave lower average ratings to the vignettes and confirming the first parts of my three hypotheses that people in Beijing hold their government to lower standards than people in Taipei. When political participation, exposure to critical news, and post-materialist values are inserted into models 2 and 3, the negative effects of Taipei do not shrink as H2a and H2b predict but are instead strengthened, and the R2s hardly change. When economic evaluations enter into model 4, they completely take the causal steam away from the Taipei dummy. The coefficient of the city dummy variable becomes statistically insignificant, the coefficient of economic evaluations is positive and significant at the 0.01 level, and the
Predicting average vignette ratings of political trust and government responsiveness.
OLS, two-tailed tests *p < 0.1; **p < 0.05; ***p < 0.01.
Models 5–8 in Table 3 find support for H2c regarding government responsiveness. The negative and statistically significant coefficient of the Taipei dummy in model 5 suggests that the people in Beijing apply lower standards than the people in Taipei. Among the four intermediary variables, only economic evaluations completely dissipate the negative effect of Taipei and raises the
Case study of Taiwan
This section uses Taiwan as a case study to further probe if the growth theory holds more explanatory power than the other two. As one of the Four Asian Tigers, Taiwan’s economy took off in the mid-1960s. As Figure S3 in the Supplemental appendix shows, the economic boom ended in 2001, when Taiwan plunged into an economic recession and never quite regained its past glory. From 2001 to 2014, Taiwan’s political system remained democratic, and its level of development, measured by real wages, had been stagnant (Lu, 2018). The most dramatic change during this period is Taiwan’s economic growth rates. Conducted in the watershed year of 2001, Asian Barometer Surveys 1st wave (ABS1) provides a timely glimpse into Taiwan’s public opinion during its rapid economic growth, which can be contrasted to the opinion reflected in ABS 4, which was conducted in 2014 and 13 years into Taiwan’s economic doldrums.
If the growth theory holds, we should expect that the Taiwanese’s standards rose in 2014 as a result of the sluggish economy. Although ABS provides no direct measure of standards, we may infer indirectly. The World Bank’s World Governance Indicators (WGI) show considerable improvement in Taiwan’s governance from 2000 to 2014 on all six indicators: voice and accountability, political stability and absence of violence, government effectiveness, regulatory quality, rule of law, and control of corruption (https://info.worldbank.org/governance/wgi/Home/Reports) If, despite the improved governance, the Taiwanese became more critical of the government in 2014, it would be evidence that unsteady economic growth raises Taiwanese’s standards of evaluation.
This is exactly what happened. I compared Taiwanese’s institutional trust in the executive and legislative branches (an additive index from 1 to 7) and government satisfaction (1–4) in the 2 years. The t-test in Table 4 shows that people in Taiwan were less trustful of, and less satisfied with, their government in 2014 than in 2001.
Differences in means of Taiwan opinion 2001 versus 2014.
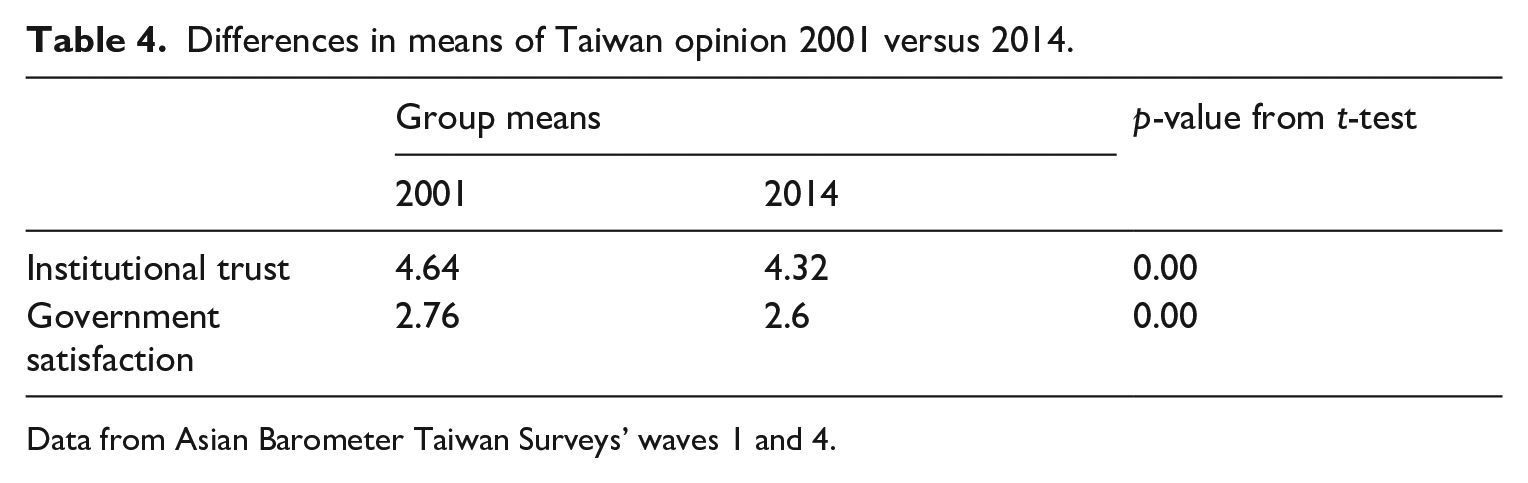
Data from Asian Barometer Taiwan Surveys’ waves 1 and 4.
Conclusion
This article has studied standards of judgement as a possible explanation of the favourable opinion towards authoritarian governments, and it has yielded two core findings. First, the more favourable opinion can be partly explained by people’s lower standards of judgement in authoritarian countries, especially when we compare countries without electoral competition and opposition voice with countries where both exist to some extent. Second, the correlation between authoritarianism and lower standards does not appear to be causation. When political systems are juxtaposed with levels of economic development and economic growth rates, economic growth rates prevail. Therefore, people in authoritarian countries apply lower standards likely because their countries happen to experience faster and steadier economic growth.
But could the more robust economic growth be a result of authoritarianism? If so, authoritarianism would still be the cause of lower standards of judgement. Research on how political systems affect economic growth abounds but remains elusively mixed. Some viewpoints in favour of democracy highlight its advantage at securing property rights, public borrowing, and producing more benevolent leaders and cleaner governments (Acemoglu and Robinson, 2012; North, 1990; Przeworski and Limongi, 1993; Schultz and Weingast, 2003). An opposing view questions democracy’s advantage at protecting property rights, pointing to the median voter’s tendency to redistribute wealth (Acemoglu and Robinson, 2000; Przeworski and Limongi, 1993). Another view favours authoritarian governments because they are insulated from the pressures of immediate consumption and particularistic interests (Przeworski and Limongi, 1993). Other views are less affirmative, recognising that authoritarian governments can indeed establish pro-growth institutions, but they do so only on certain conditions and the prosperity may be short-lived (Acemoglu and Robinson, 2012; Wang, 2014). Some believe that political systems do matter but just not the umbrella concept of regime types (Weede, 1996). Empirical evidence, which is equally split between the two types of regimes, inspires little clarity (Przeworski and Limongi, 1993; Weede, 1996).
My study carries important implications for regime theory and public opinion research. First and foremost, it shows that citizens’ lower standards of judgements are not an innate feature of authoritarianism. Authoritarian leaders are not endowed with the gift of a complacent citizenry and should not hope to use authoritarian control to produce one.
In addition, different standards of judgement alone do not fully explain the more favourable public opinion enjoyed by authoritarian governments. Even after I adjusted for DIF, the authoritarian governments in China and Vietnam were still evaluated more positively than their counterparts in Mexico and the United States, which leaves room for other explanations. Thus, my study should be viewed as a complement to, not a replacement of, the existing explanations.
Moreover, my study has uncovered a new mechanism by which economic performance can benefit a government. Traditionally, scholars have understood economic voting as voters trading electoral support for a good economy (Kramer, 1971). However, my study presents direct evidence that economic growth lowers citizens’ standards not only in economic evaluation, but in evaluations in other areas. Unlike economic voting, which by definition is only available to democratic leaders, this newly discovered function of economic performance can be utilised by both democratic and authoritarian leaders.
Finally, my study demonstrates that subjective government evaluations in different countries may correspond to quite different realities. The positive opinions in authoritarian countries become less shocking once standards of judgement are taken into account. Scholars should be wary of this nuance when they use self-reported opinions to infer a country’s objective attributes. Whenever possible, they should adjust for DIF, and I hope my study can serve as a useful template.
Supplemental Material
sj-pdf-1-pol-10.1177_02633957221144010 – Supplemental material for Do people in authoritarian countries have lower standards when evaluating their governments? An anchoring vignettes approach
Supplemental material, sj-pdf-1-pol-10.1177_02633957221144010 for Do people in authoritarian countries have lower standards when evaluating their governments? An anchoring vignettes approach by Yingnan Joseph Zhou in Politics
Footnotes
Acknowledgements
This project would not have been possible without the input and support from Wenfang Tang, Ray Ou-Yang, Yue Hu, Gaspare Genna, Taeko Hiroi, Todd Curry, Rebecca Reid, Yaoyao Dai, Daniel Bowen, and all the anonymous reviewers at different stages of its publication. To them, I give my greatest gratitude.
Funding
The author(s) received no financial support for the research, authorship, and/or publication of this article.
Supplemental Information
Additional supplementary information may be found with the online version of this article.
Notes
Author biography
References
Supplementary Material
Please find the following supplemental material available below.
For Open Access articles published under a Creative Commons License, all supplemental material carries the same license as the article it is associated with.
For non-Open Access articles published, all supplemental material carries a non-exclusive license, and permission requests for re-use of supplemental material or any part of supplemental material shall be sent directly to the copyright owner as specified in the copyright notice associated with the article.