
Abstract
For the complex structure of driver seat-cushion coupled system for metropolitan buses, there are still lack of convenient and reliable modelling methods for the system at present. To improve ride comfort, the coupled dynamic model is urgently needed to give insight into the dynamic properties of the coupled system. In this paper, for a standard commercially available seat fitted into metropolitan buses, the coupling between the seat and cushion, the nonlinear damping characteristics of the seat damper, and the elastic properties of the damper mounting bushings have been accounted for in a three degree-of-freedom driver seat-cushion coupled system model. Combing field measurements of the seat suspension excitation and cushion acceleration response, a specific flow of hybrid modelling of driver seat-cushion coupled system without the requirement of further bench tests was presented. The analogy between acceleration responses in the frequency domain and the time courses proves that the model can predict the dynamic characteristics of the coupled system with good accuracy for stationary random excitation. The model parameters were also validated by the corresponding bench test. The results show that the accuracy of the model parameters is sufficient and the hybrid modelling method is reliable, which provide a foundation for the optimal design of seat suspension and/or cushion to further improve ride comfort.
Keywords
Introduction
Buses are widely used public vehicles in metropolitan cities. In China, there are over 500 thousand metropolitan buses which correspond to over 1500 thousand drivers. Metropolitan bus drivers are often exposed to low-frequency vibrations transmitted from vehicle floor during their work. Low-frequency vibrations in the long run are very harmful.1,2 Prolonged exposure to occupational vibrations tends to cause lumbar disc protrusion and cervical spondylosis.3,4 The design of the seat suspension and cushion system is an enduring topic and it is very important to reduce low-frequency vibrations to protect drivers as much as possible. 5
In order to protect the driver from vibration, it is effective to optimize seat suspension and/or cushion by building dynamic model of the seat and/or cushion system.6–8 The establishment of an accurate dynamic model is a premise for optimizing seat suspension and cushion. In recent years, many research efforts on the modelling and design of the seat and/or cushion have been made. A hybrid model of a seated driver was analysed by Ksiazek and Ziemianski 9 Tufano and Griffin 10 studied the nonlinearity in the vertical transmissibility of seating. Transmission characteristics of suspension seats in multi-axis vibration environments were analysed by Smith et al. 11 Jamali et al. 12 made Pareto multi-objective optimum design of vehicle-suspensions system under random road excitations by building vehicle dynamic model. Modelling and multi-criteria optimization of passive seat suspension were done by Maciejewski et al. 13 Siefert et al. 14 made simulations of static and dynamic effects on drivers' seating comfort. Lee et al. 15 designed springs with “negative” stiffness to improve vehicle driver vibration isolation. Although the active seat suspension is a good method to improve the ride comfort; 16 however, because of the great cost, it is hard to popularize at present.,
Using the mechanism modelling method, the vibration equations of driver seat-cushion coupled system for metropolitan buses could be established, but they include too many unknown parameters. In this case, system identification is an effective tool to obtain unknown parameters. 17 A 3 DOF linear model of seat system without accounting for friction influence was presented, and the parameter values of the model were identified and validated by the field measurements. 18 A 4 degree-of-freedom (DOF) model of the driver-seat-suspension system without considering the elastic properties of the damper mounting bushings was presented, and the parameter values of the model were identified and validated by a bench test. 19 This validation method by bench test has some disadvantages. Mostly, the cost of bench test is very high; moreover, the test period is also relatively long. Thus, a convenient accompanying verification method of the parameters identification results, without the requirement of costly and time-consuming field measurements or further bench tests, should be developed.
According to the referred literature, there has not been much research about convenient methods of hybrid modelling to represent a driver seat-cushion coupled system for metropolitan buses by combining the mechanism modelling and the accompanying verification. The principal objective of this paper is to provide a convenient method of hybrid modelling of driver's seat-cushion coupled system, and present a 3 DOF driver seat-cushion coupled system model for ride comfort analysis with metropolitan buses under stationary random excitations.
Driver seat-cushion coupled system
In this study, the seat system analysed is a standard commercially available seat fitted into metropolitan buses, and its structure sketch is shown in Figure 1(a). The seat includes a passive spring-damper mechanism, which is configured as a typical dual shock pendulum scissor system. It employs a coil spring and a classical symmetrical hydraulic damper. They are mounted between the seat frame and the seat base.
The structure sketch of the seat system and 3 DOF driver seat-cushion coupled system model.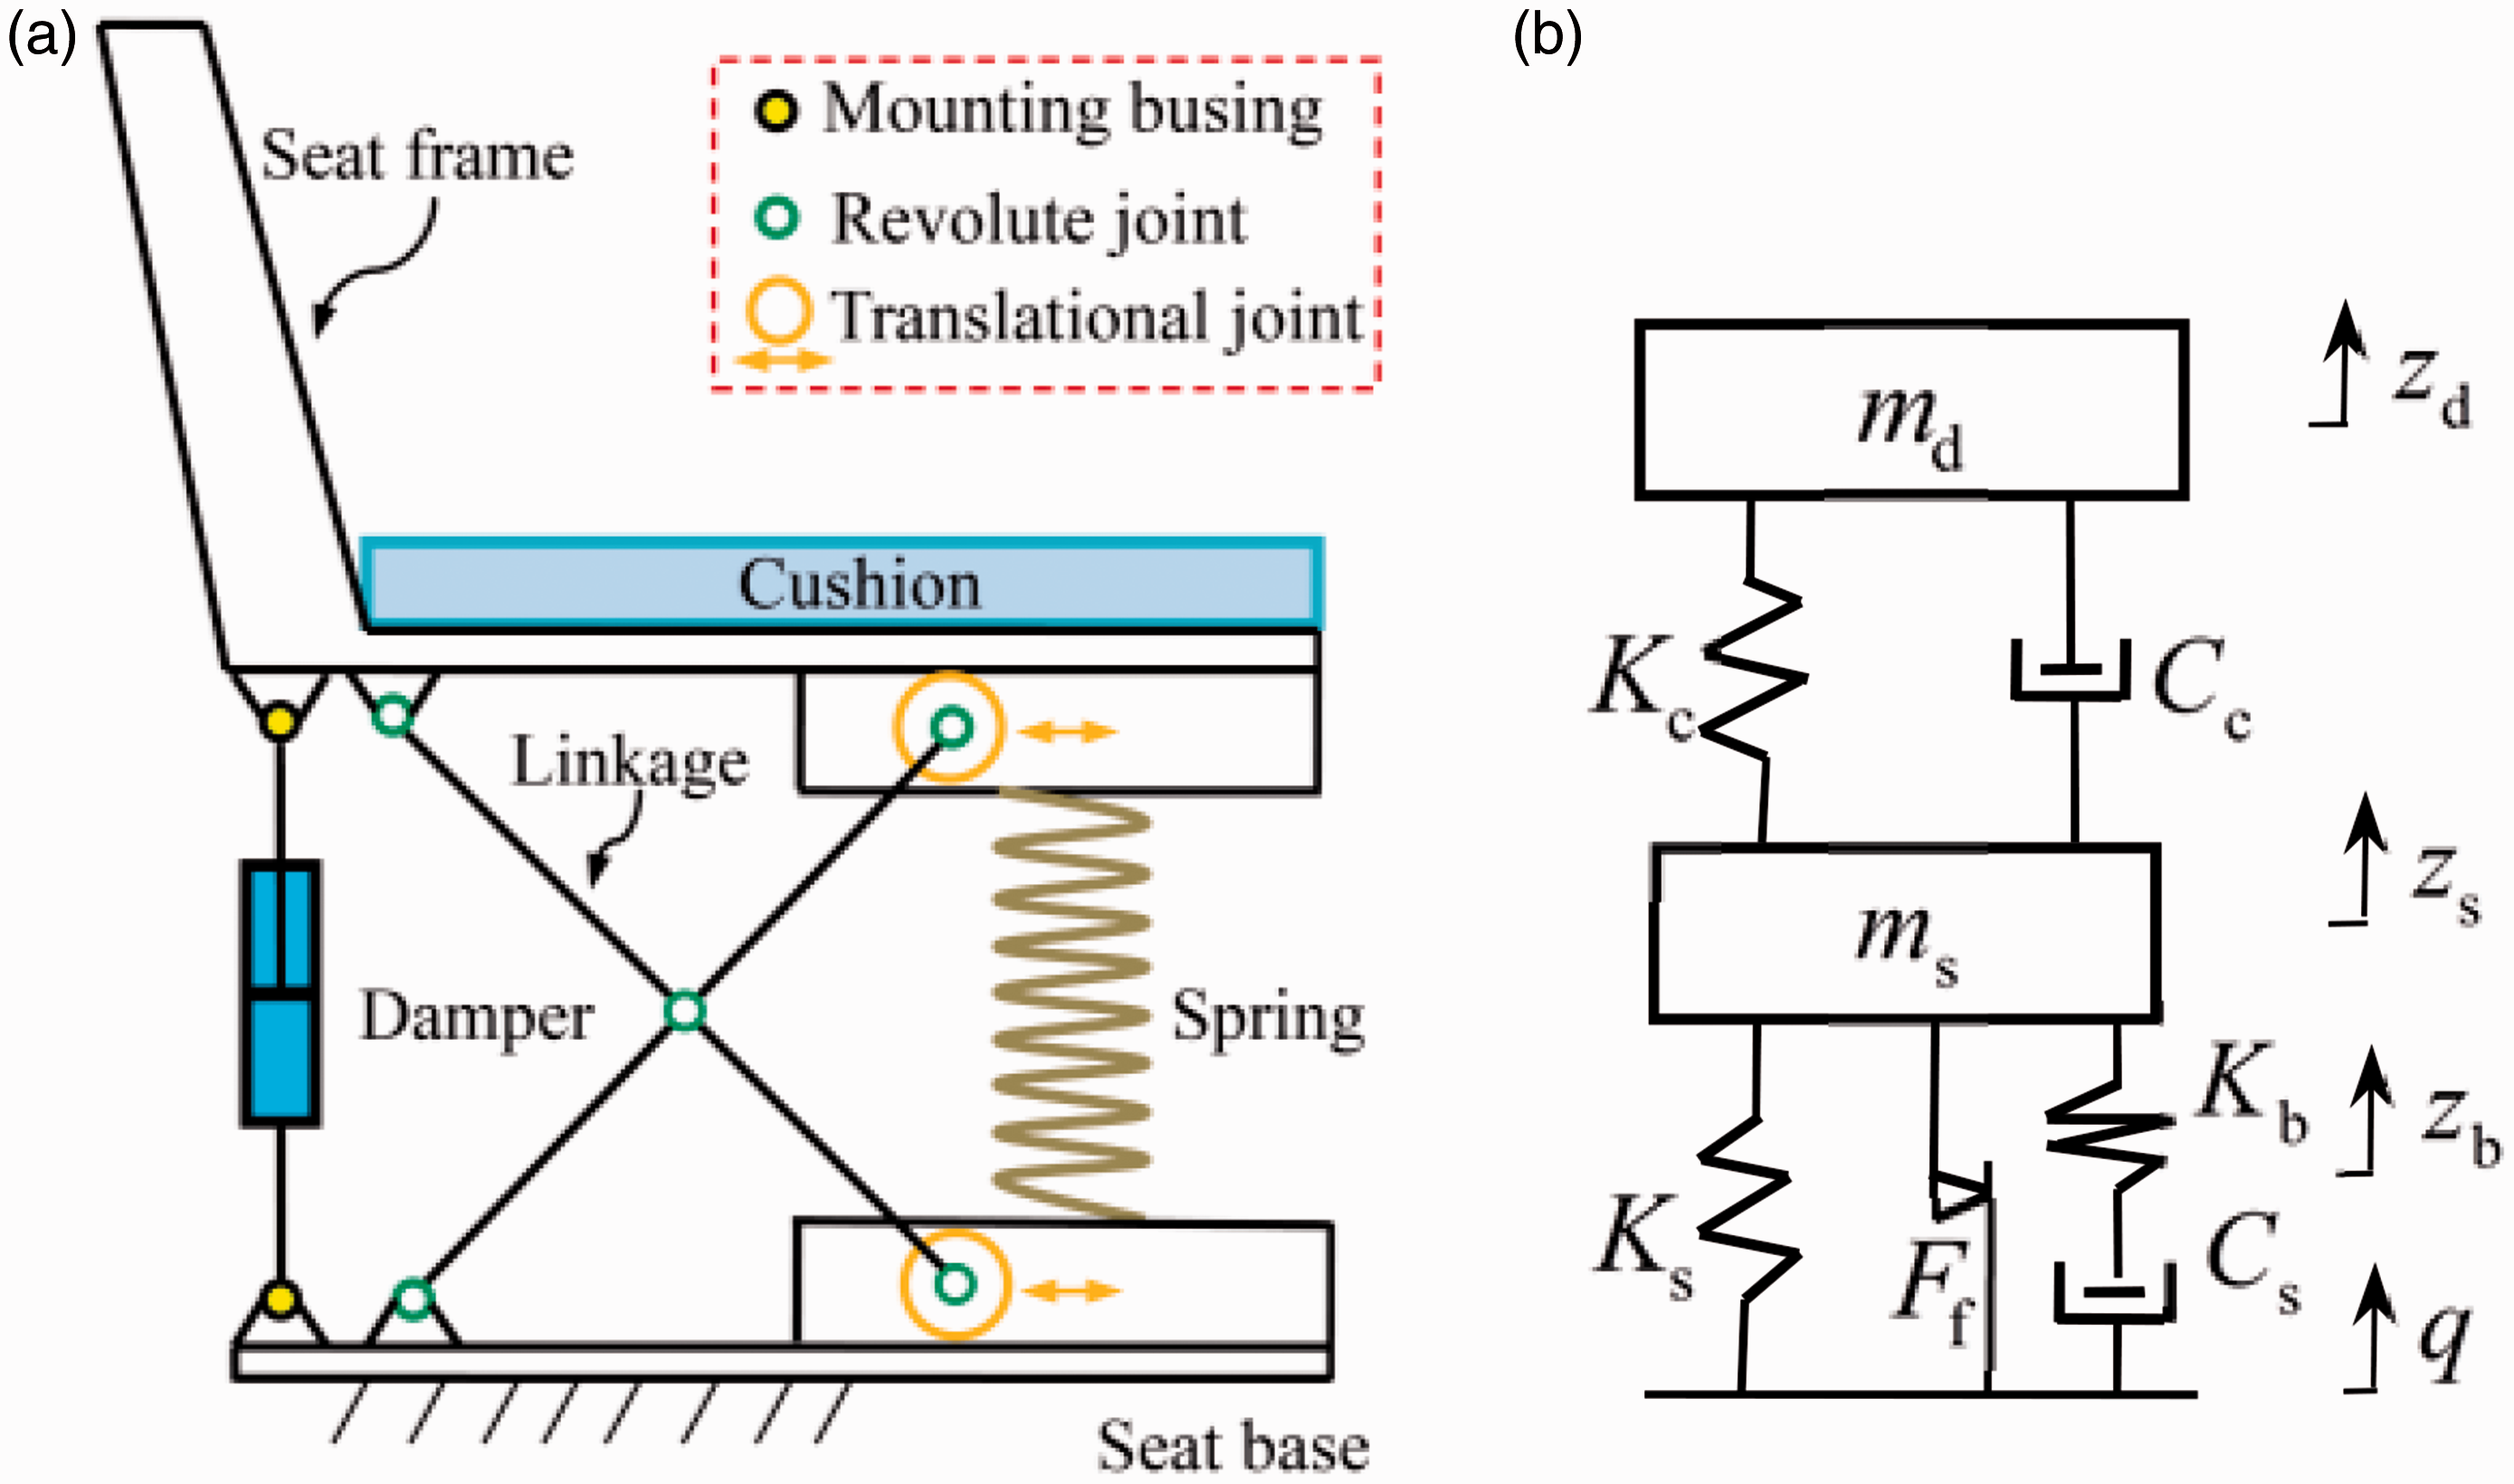
For the theoretical analysis of ride comfort, considering the coupling between the seat and cushion, the equivalent Coulomb friction within the seat linkage mechanism, and the elastic properties of the damper mounting bushings, a 3 DOF driver seat-cushion coupled system model, are presented, as shown in Figure 1(b). The DOFs of the model are zd, zs, and zb. Where zd and zs are the vertical displacement of the driver and seat frame, respectively; zb is the vertical displacement of the damper mounting bushing.
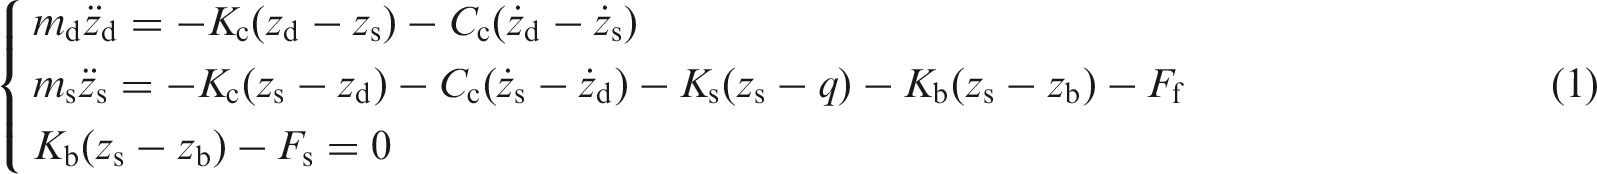
In the model above, Kc, Ks, and Kb are the equivalent stiffness coefficients of the cushion, the seat suspension, and the damper mounting bushings, respectively; Cc and Cs are the equivalent damping coefficients of the cushion and the damper; md is the effective mass of the driver supported by the cushion, ms is the seat mass supported by the seat suspension and q is the vertical displacement of the floor at the installation position of the seat; Ff is the equivalent Coulomb friction within the translational joints and the revolute joints of the seat linkage mechanism; Fs is the damping force of the damper. According to Newton's second law, the set of vibration equations from the static equilibrium positions for the model can be expressed as:
The model assumptions include the following:
Both the seat frame and the seat linkage mechanism are made of steel. Their elastic deformations are very complex with the seat under intensive impact conditions. For example, when the bus hits a pothole, a big impact will act on the seat, then the linkages and the seat frame may generate elastic deformations, and the seat may twist in a certain direction. However, for the analysis of ride comfort under stationary random excitations in this study, the seat linkages and the seat frame can be regarded as rigid bodies.
The simplest cushion model is a single DOF linear system. Actually, the foam cushion is nonlinear. And the research of Wei and Griffin
20
has showed that the strong nonlinear characteristics of the cushion rely on the preload and the excitation level. However, Stein et al.
18
have proved that, for ride comfort analysis of the seat under stationary random excitations in the actual project, it is feasible and acceptable to characterize the visco-elastic properties of the cushion as an equivalent linear damping coefficient and stiffness corresponding to a range of known driver weights.
Because this paper mainly focuses on ride comfort under stationary random excitations, the spring stiffness of the seat suspension is considered to be constant within the permissible suspension travel. The nonlinear damping of the hydraulic damper is characterized as a classical empirical index model.
21
According to the nonlinear index model, Fs in equation (1), can be expressed as
where F0 is the magnitude of the Coulomb friction force.


There are dozens of human body models presented in the modern literature. Usually, there are multi-degree of freedom lumped parameter models that consider seating position. For example, the ISO 5982 22 constitutes the human body model which consists of four interconnected masses by means of linear springs and dampers. Stein et al. have discussed in detail the selection of suitable human body model 23 and have also shown that a rigid mass located on the seat cushion can be used in simulation with sufficient accuracy and the more complex models need not be used. 18 The previous study 24 about driver-seat-cab coupled system has also supported the assumption used here.
Hybrid modeling method
System identification
The parameters identification from vibration signals is a complex inverse problem, but it is very effective to get model parameters. Most often, this method can be described as a misfit function between the calculated dynamic response from a dynamic simulation model and the measurement is defined and then minimized by a solving algorithm.24,25
To start the study of this section, according to the vibration equations of driver seat-cushion coupled system, using software MATLAB/Simulink, a simulation model was created, as shown in Figure 2.
The simulation model of driver seat-cushion coupled system.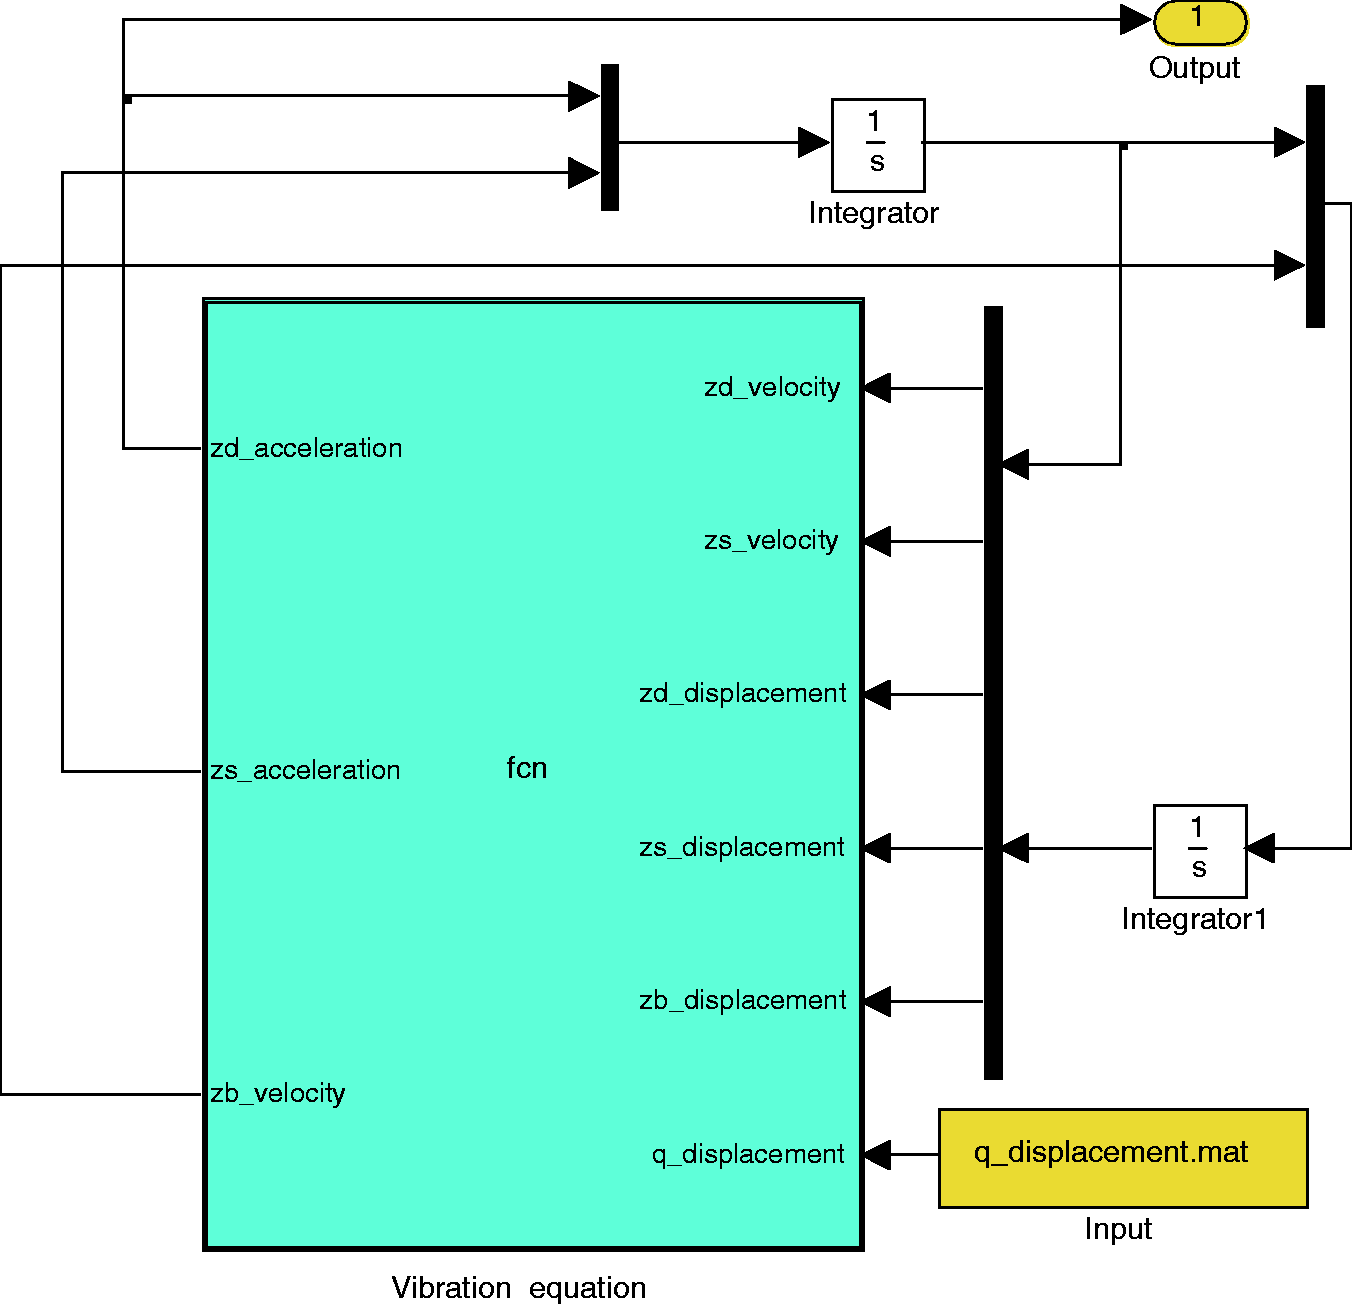
To get accurate parameter values, both the time course and the PSD (power spectral density) of the cushion vertical acceleration az are used in this study. Note that because the driver is assumed to act as a rigid mass, the cushion vertical acceleration az can be considered as the driver's vertical acceleration

The vector of the parameters to be identified can be written as

In order to obtain the reasonable results for parameter identification, the range of the vector x is determined as

According to equation (4) and the inequality constraint (6), by the simulation model of driver's seat-cushion coupled system, system identification can be done. To give insight into the accuracy of the identification results, the relative deviation δfi for each frequency value and the relative deviation δti for each time point can be used to quantify the quality of the simulation in relation to the measurement. And they can be defined as


Specific flow of hybrid modeling
In order to minimize the objective function J, this study adopts multi-island genetic algorithm and then the specific identification program was compiled. A convenient method of hybrid modelling was presented with its specific flow depicted in Figure 3, where the adopted algorithm is a classical global optimization method.
26
The main feature of the algorithm that distinguishes it from traditional genetic algorithms is the fact that each population of individuals is divided into several sub-populations called ‘islands’. The essential parameters of the algorithm are considered to be the following: sub-population size 10; number of islands 10; number of generations 10; rate of crossover 1.0; rate of mutation 0.01; interval of migration 5.
The flow chart of hybrid modelling of driver seat-cushion coupled system.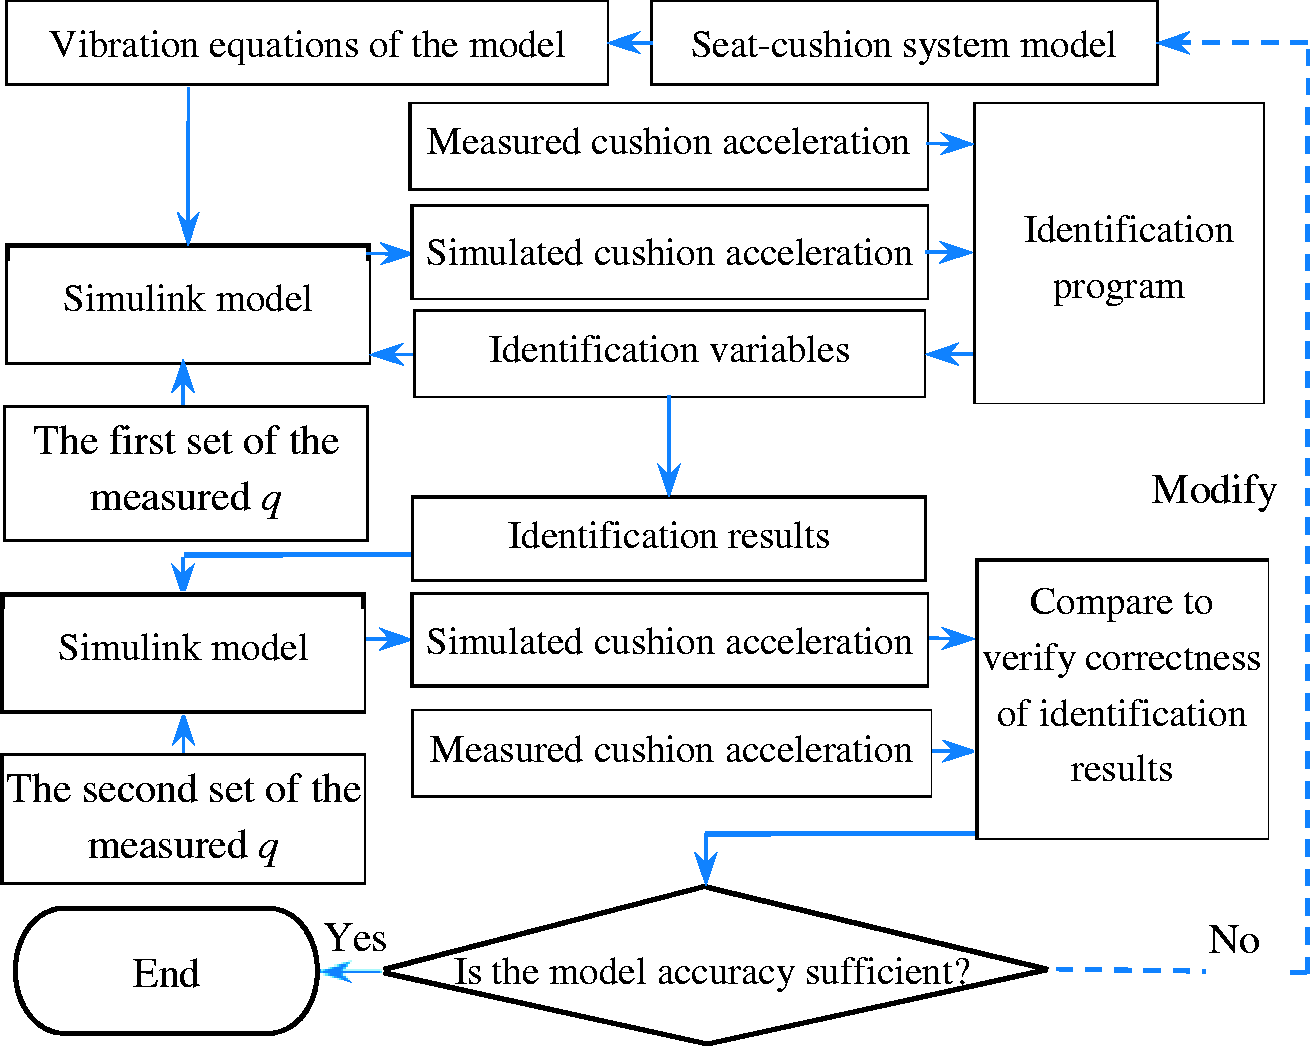
Figure 3 shows that the flow chart includes three steps at least. The first step is the establishment of the vibration equations of the seat-cushion coupled system. For the following two steps, the first set of the measured signal q is used to identify the model parameters, while the second set of the measured signal q is used to further validate the effectiveness and accuracy of the model. The hybrid modelling method is used as follows:
According to the 3 DOF driver seat-cushion coupled system model presented in ‘Driver seat-cushion coupled system’ section 2, and by Newton's second law, the vibration equations of the system can be obtained and a Simulink model can be created.
According to the first set of the measured q as input and the measured cushion vertical acceleration response as target output, by the Simulink model and parameters identification program, the parameters identification can be performed to obtain the values of the model parameters.
According to the second set of the measured q as input and the measured cushion vertical acceleration response as compared output, by the Simulink model, the model accuracy can be verified.
Note that if the model accuracy is not satisfied, the coupled system model is modified and Steps 2 and 3 are repeated. If the model is sufficiently accurate, then end; otherwise, repeat until the model accuracy is sufficient.
Hybrid modeling example
The ranges of the variables to be identified.
Field measurements
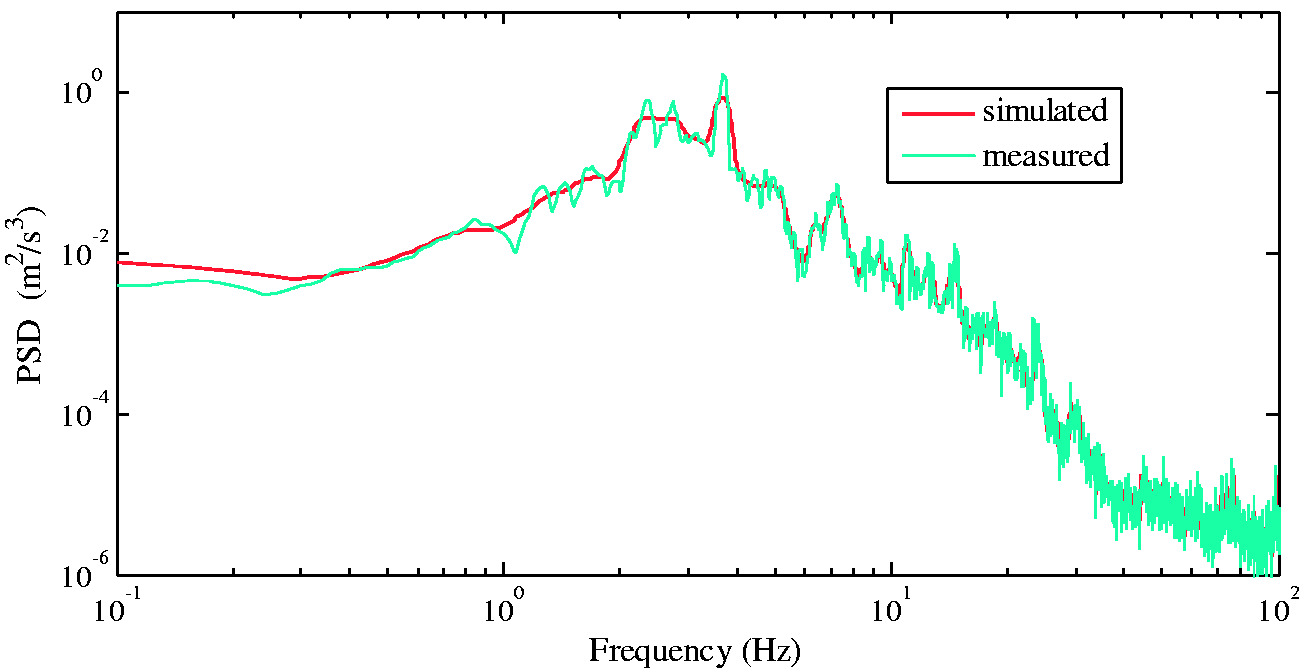
The field measurements were made on the metropolitan bus, on the urban road of Zibo city, China. Before the measurements, one Lance LC0173 accelerometer was installed on the floor at the installation position of the driver seat, and the other was installed on the cushion of the seat. The driver loosely restrained with a seat-belt and his back in touch with the seat back in upright position. During the field measurements, the driver's hands were loosely placed on the steering wheel. Acceleration signals were collected by the data acquisition and analysis system ‘M+P Smart Office’, with the bus at 60.0 km/h that it travels most, under the fully laden condition and the half laden condition, respectively. The sampling frequency is 400 Hz, and the frequency resolution is set as 0.1 Hz. The total duration of the collected signals is 400 s for each measurement.
The collected signals are acceleration signals. Because the Simulink model needs displacement signal as input, the measured vertical acceleration at the seat base should be translated into the displacement excitation. Because this study mainly focuses on ride comfort under stationary random excitations, the noise signals need to be eliminated. The measured floor vertical acceleration for each running condition was processed as the following method provided in the previous study.
24
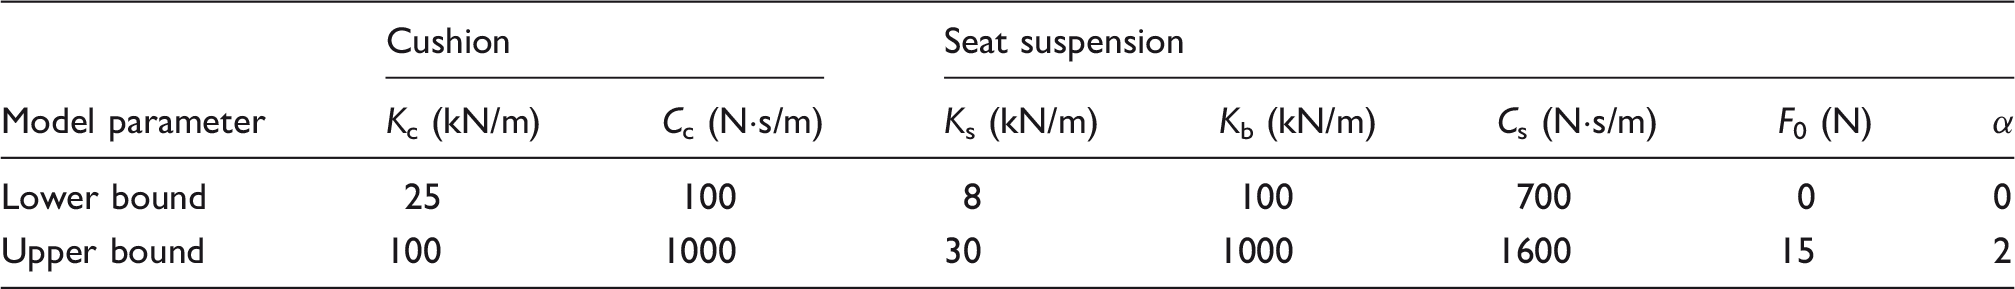
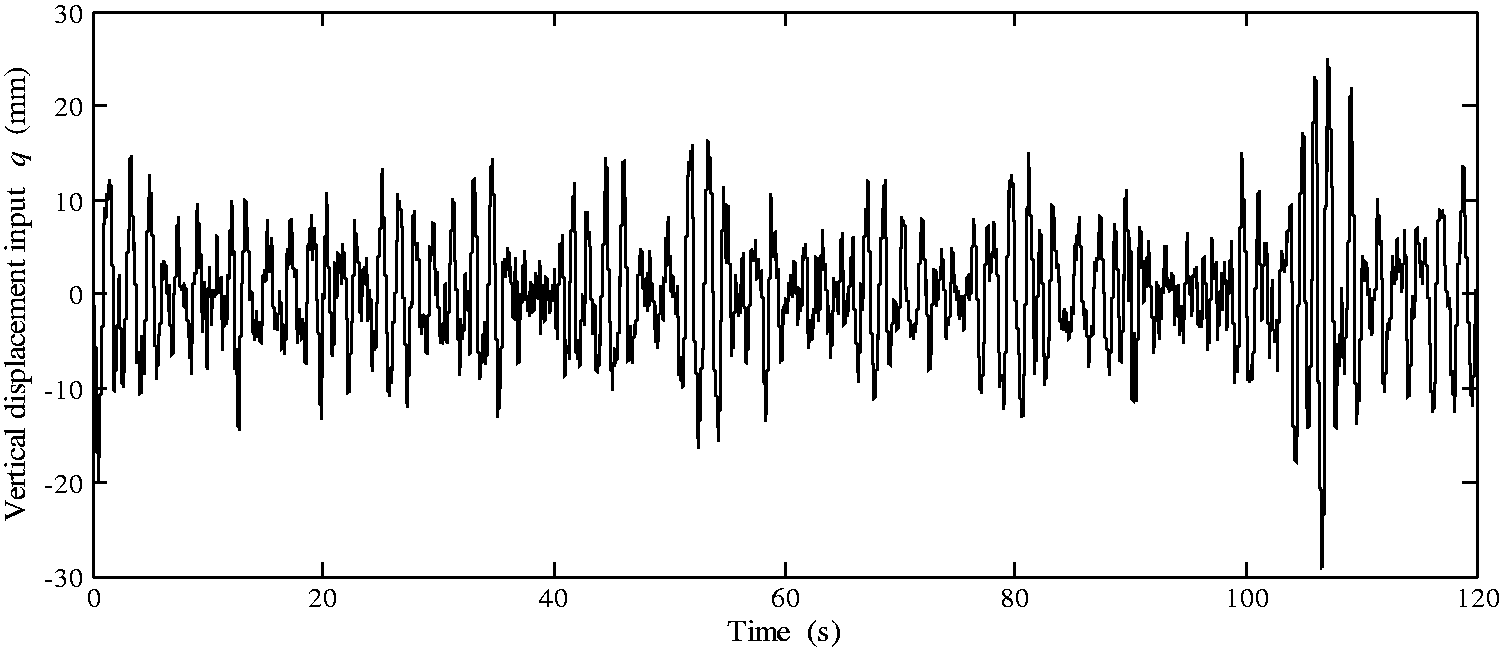
Firstly, through visual inspection of the time courses of the raw signal, the relatively stationary acceleration excitation signal of the seat was extracted. Then, using the band-pass filter with its pass-band 0.5–100 Hz in the special signal processing software ‘M+P Smart Office’, the acceleration excitation signal of the seat required by the Simulink model was obtained. By frequency-domain integral method with minimum cut-off 0.5 Hz and maximum cut-off 100 Hz, the displacement signal q required by the Simulink model was obtained through double integrating the excitation signal. Simultaneously, the corresponding measured cushion vertical acceleration was extracted. Owing to pace limitations, only the signals under the half laden condition are depicted in this section. The original vertical acceleration The original acceleration The calculated input signal q under the half laden condition. The measured cushion vertical acceleration az under the half laden condition. The characteristics of the acceleration 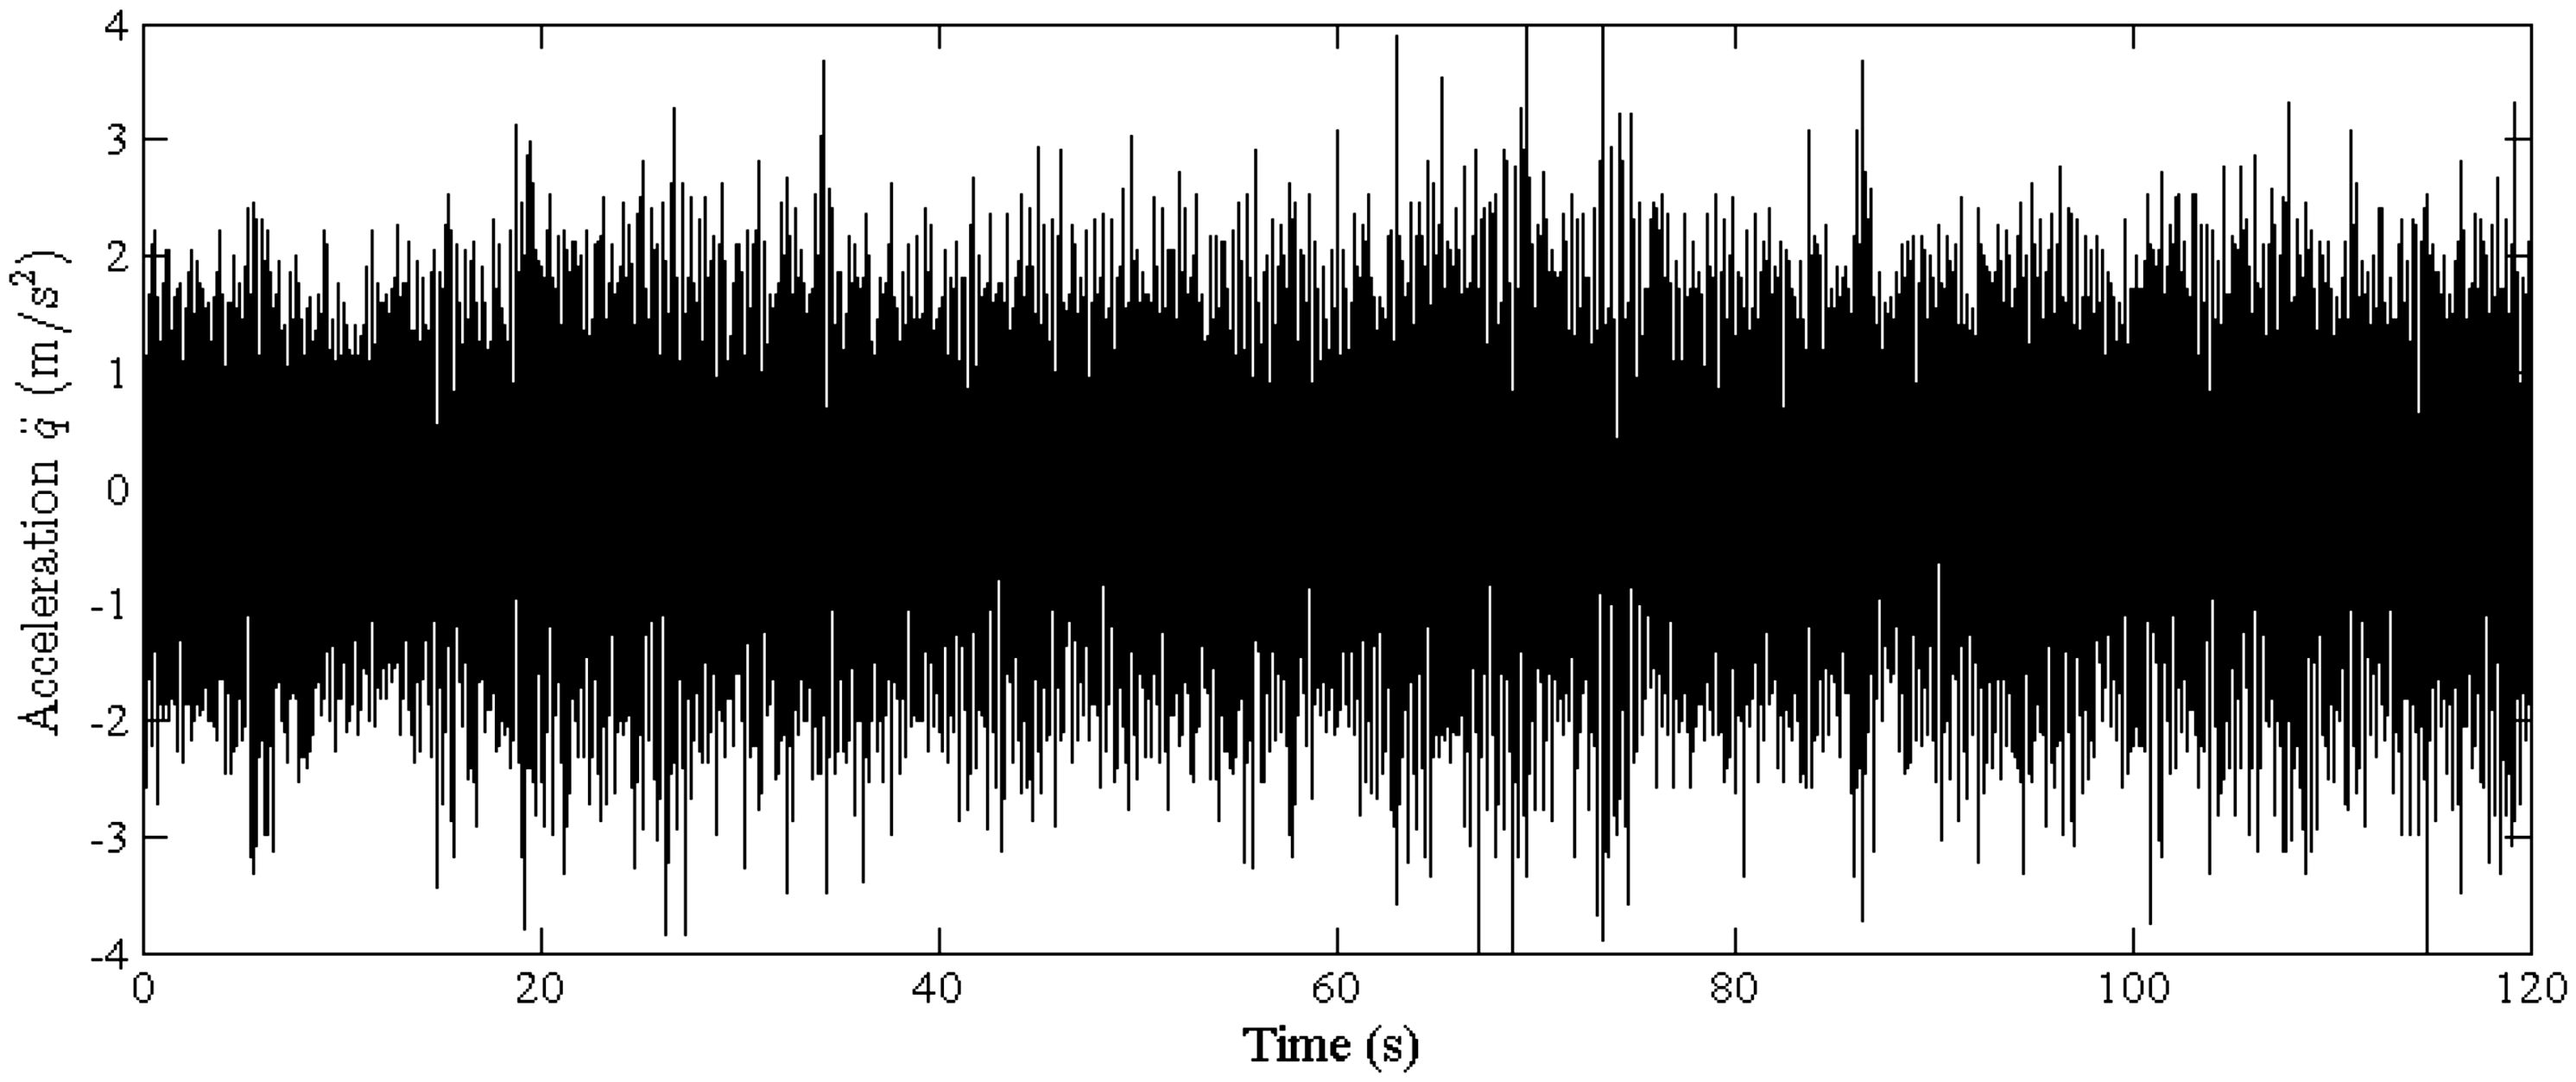
Parameters identification and results verification
The results of system identification.
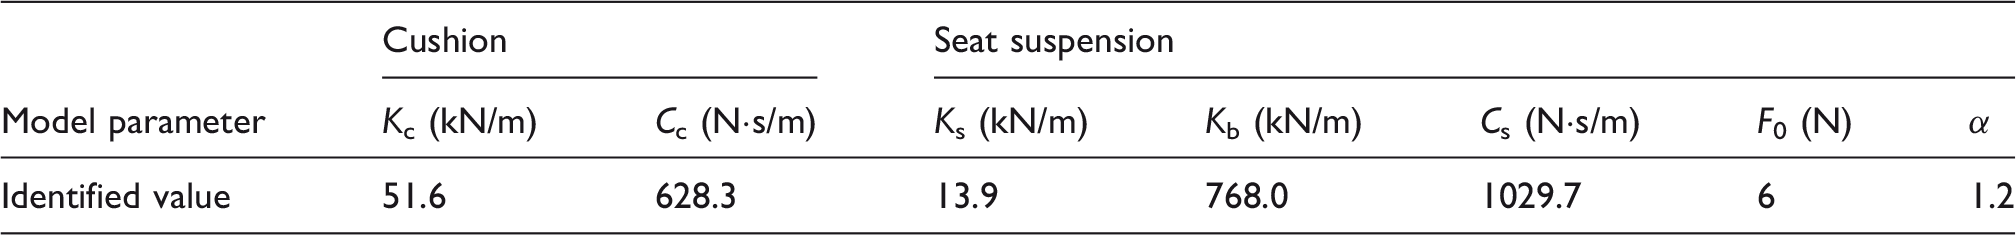
Figure 7 presents a comparison between the measured acceleration az and the simulated acceleration az. Figure 8 presents a comparison of the cushion vertical acceleration PSDs, calculated from the simulated acceleration az and from the measured az. The MATLAB standard routine ‘pwelch’ for PSD was applied, which uses Welch's method to estimate the power spectral density. And the used parameters were set to be following: sampling frequency 400 Hz; Hanning window with 75% overlap; and the length of the Fast Fourier Transformation (SST), Nfft=4096.
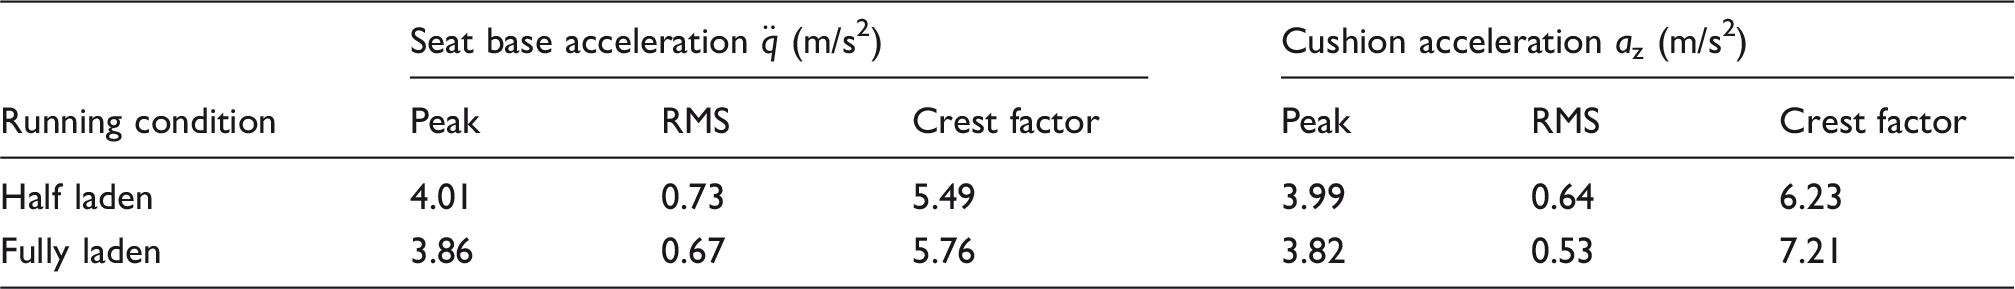
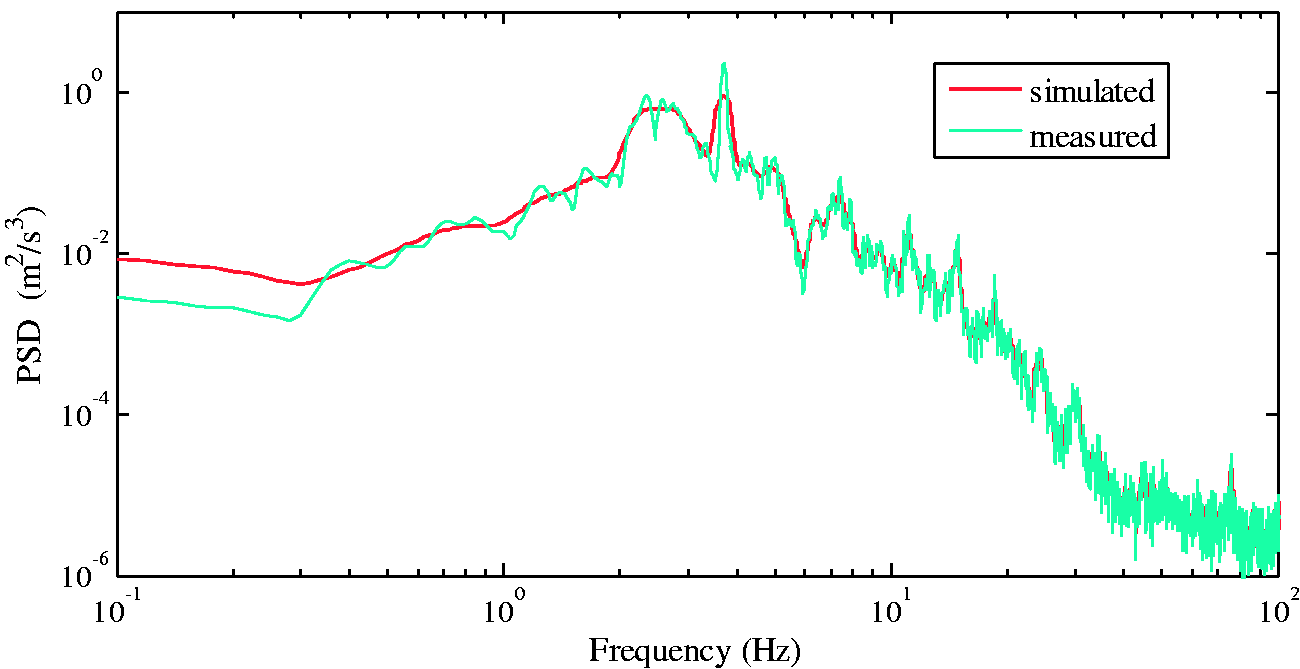
Comparison between the simulated cushion vertical acceleration az and the measured cushion vertical acceleration az under the half laden condition. Comparison of the cushion vertical acceleration PSDs, calculated from the simulated acceleration az and from the measured az under the half laden condition.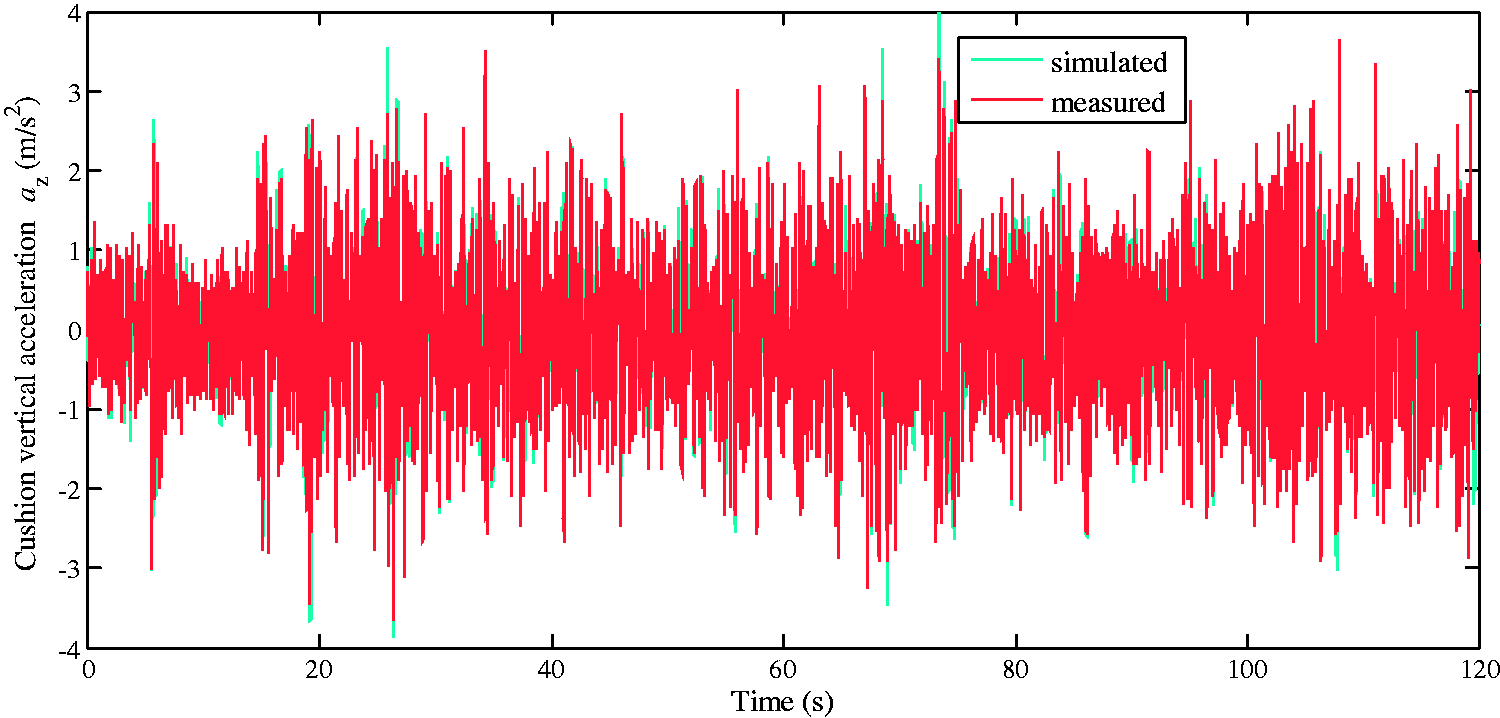
To verify the accuracy of the identification results, according to the measured signals under the fully laden condition, using the Simulink model with the identified model parameters, the cushion vertical acceleration az was simulated. And the simulated results and comparisons are depicted in Figures 9 and 10.
Comparison between the simulated cushion vertical acceleration az and the measured cushion vertical acceleration az under the fully laden condition. Comparison of the cushion vertical acceleration PSDs, calculated from the simulated acceleration az and from the measured az under the fully laden condition.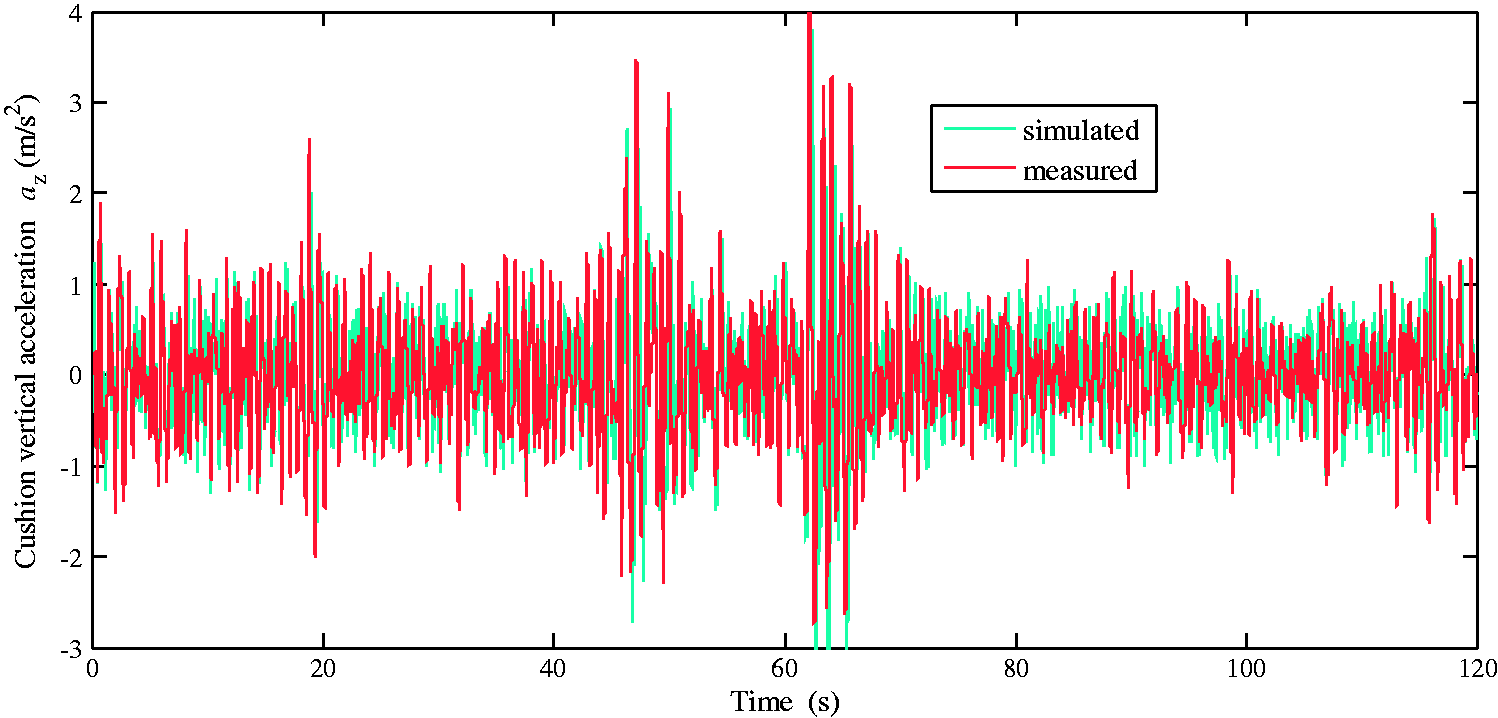
Discussion of the results
Comparison of the response characteristics calculated from the simulated data and from the measured data.
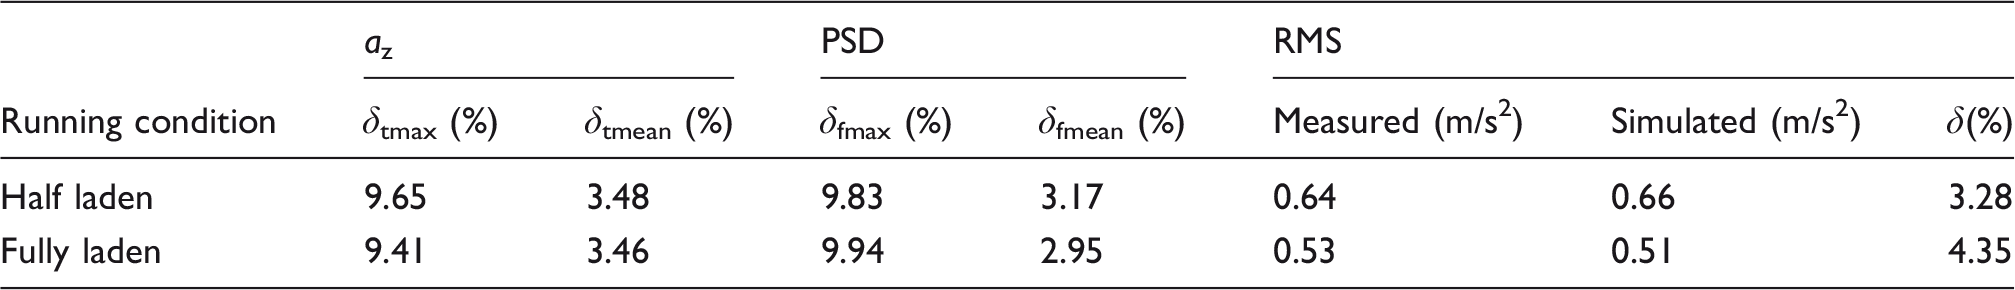
From Figures 7 and 9, the time course of the simulated cushion vertical acceleration az is close to the measured az for each running condition. From Figures 8 and 10, the PSD curve calculated from the simulated az coincides well with that calculated from the measured az for each running condition. From Table 4, on the whole, the differences of the response characteristics calculated from the simulated data and from the measured data are very small. Note that, although the larger differences really exist on certain point, i.e. δtmax = 9.83% when t = 26.3 s for the half laden condition, they are acceptable for the seat comfort analysis of the metropolitan bus.
In short, the comparison results show that the seat-cushion coupled system model and its parameter identification method can be considered suitable for reproducing the operational cushion acceleration az. It proves that, not only the parameter identification method and the identification results are correct, but also the accuracy of the seat-cushion coupled system model is sufficient. In addition, the comparison results also indicate that the made assumptions are reasonable and the used signals with the length of 120 s for the identification are long enough.
Test verification
In order to further verify the correctness of the hybrid modelling method and the seat-cushion coupled system model, comparing the identified parameters with the measured is required.
Parameters verification of the seat suspension
The hydraulic damper and the coil spring of the seat suspension were determined in this section. The damper characteristics testing was conducted by a multi-function test bench, which was made by Changchun Research Institute of Testing Machines. And the maximum force of the test bench is 30 kN, the force accuracy is 1.0%, and the maximum displacement of the loading actuator is ± 150 mm.
Comparison of the damping forces between the measured and the identified.
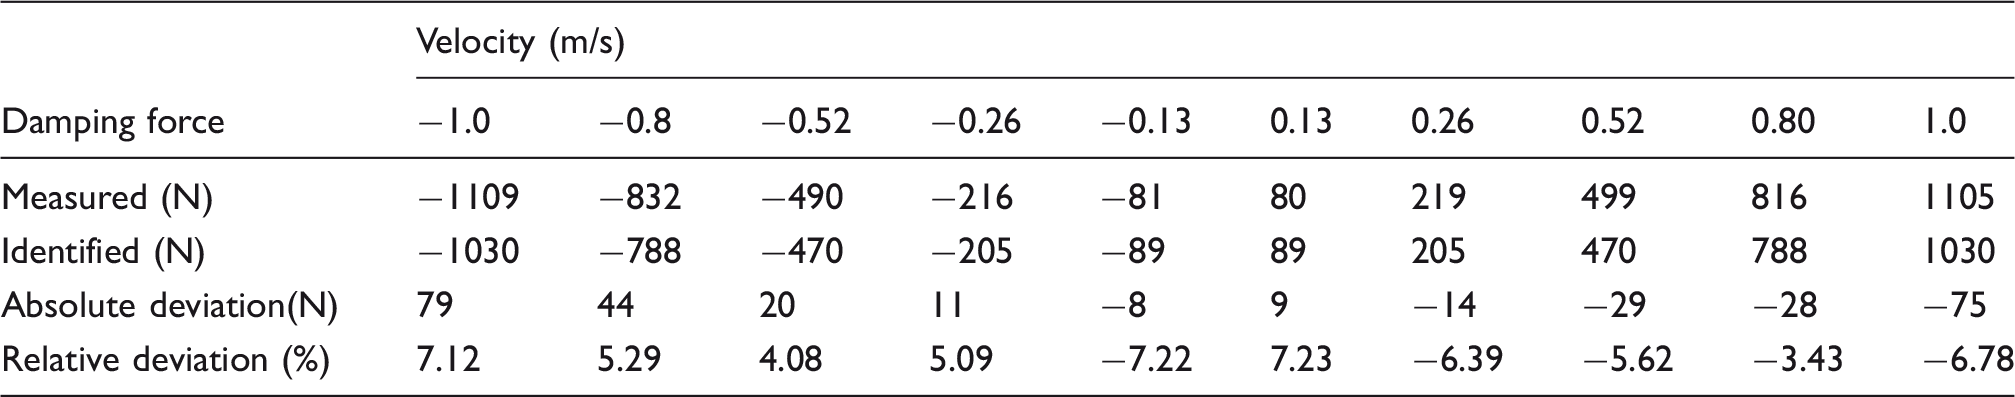
From Table 5, the measured damping forces are close to the identified values at the different working velocities within −1.0∼+1.0 m/s, and the maximal value of the relative deviation is 7.23%. According to the design requirements of the damper for the seat suspension, the design error of the damper itself is smaller than ± 15%, and thus the identified parameter values of the damper are accurate enough.
The spring characteristics testing was also conducted by the multi-function test bench. The bench exerted displacement ± 30.0 mm on the spring at speed of 5.0 mm/min. The equipment automatically printed the stiffness value 13.1 kN/m. The absolute deviation of the stiffness value between the measured and the identified is 0.8 kN/m; and the relative deviation is 5.76%. Based on the design requirements, the design error is smaller than ± 10.0%. Thus, the identified stiffness value is acceptable.
Parameters verification of the cushion
According to the single DOF cushion model and the measurement method of the model parameters presented by Rakheja et al., 19 the cushion of the seat was determined in this study. In the cushion model, the visco-elastic properties of the cushion were characterized as an equivalent linear damping coefficient and stiffness corresponding to a range of known driver weights.
Comparison of the model parameters between the measured and the identified.
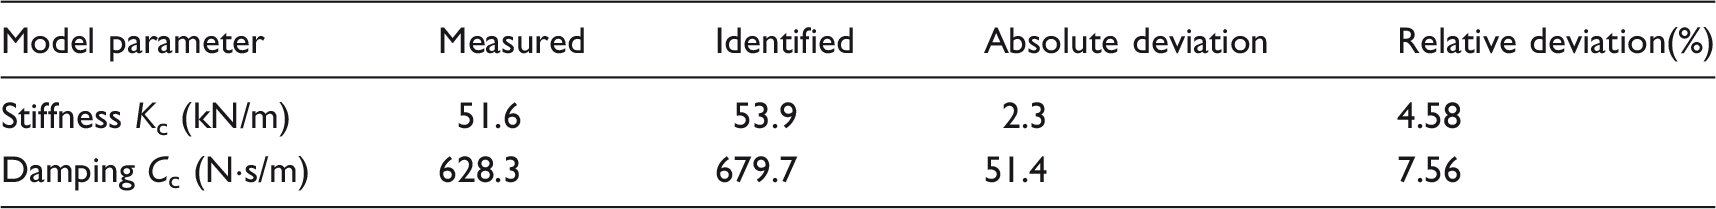
To sum up, by the verification of the model parameters, the results further prove that the hybrid modelling method presented and the seat-cushion coupled system model established are correct and workable. By the hybrid modelling method, the model parameters with good accuracy can be retrieved without dismantling the seat cushion and suspension system. For the verification of the parameters identification results in Step 3 of the flow chart of hybrid modelling, the accompanying verification method is more convenient than that of test verification. In the actual project, the accompanying verification method of the model parameters can substitute for costly and time-consuming mechanical tests.
Conclusions
A model of driver seat-cushion coupled system used in metropolitan buses of a large Asian operator is developed, including the nonlinear damping characteristics of the hydraulic damper. Through the hybrid modelling of the coupled system, the simulation and test verification, it was shown that:
From the time courses and PSDs, it can be inferred that, the simulation model of driver seat-cushion coupled system can be considered suitable for reproducing operational cushion acceleration responses with metropolitan buses under stationary random excitations. This model enables us to predict the dynamic characteristics of the coupled system from 0 to 100 Hz. The coupled system is actually far more complicated than the simplified model with assumptions. For example, the inherent friction within the seat linkage mechanism does not possess ideal characteristics. And the use of the model is subject to stationary random excitations. Using the hybrid modelling method, the model parameters with good accuracy can be retrieved without dismantling the seat cushion and suspension system. By the verification of the model parameters, the results further show that the hybrid modelling method and the seat-cab coupled system model are correct, the accompanying verification method is reliable, and the identified parameters are acceptable. Thus, in the actual project, the accompanying verification method of model parameters can substitute for costly and time-consuming mechanical tests. This verification method is more convenient than the mechanical tests. Therefore, the modelling and verification process have practical benefits. The hybrid modelling method also can be applied to other seat systems. The hybrid modelling method and the driver seat-cushion coupled system model provide a foundation for the optimal design of the seat suspension and/or the cushion to improve ride comfort with metropolitan buses under stationary random excitations.
As an extension of this work, to further broaden the application range and the reliability of the coupled model, a more complex nonlinear model with the seat under intensive impact conditions will be investigated.
Footnotes
Declaration of conflicting interests
The author(s) declared no potential conflicts of interest with respect to the research, authorship, and/or publication of this article.
Funding
The author(s) disclosed receipt of the following financial support for the research, authorship, and/or publication of this article: This work is supported by the National Natural Science Foundation of China (51575325), the Nature Science Foundation of Shandong (ZR2013EEM007), and Key R & D projects in Shandong Province (2015GGX105006).