
Abstract
Identification of correct working of gearbox is a very important function during end of line inspection in the assembly line while manufacturing the gearbox. Such inspection is performed by an operator by listening to the sound of gearbox while running it on a test bench. Based on the sound emitted by the gearbox combined with experience and judgment of the operator, the gearbox is passed or rejected for fitting inside the vehicle. This paper makes an attempt to use artificial intelligence techniques to identify gearbox condition in the above environment by using psychoacoustic features to replace human hearing. Experiments are carried out on a gearbox test rig and sound data are acquired for good and faulty gear conditions. Psychoacoustic features and statistical indices are extracted from the data and these are then used as input to an artificial neural network. The artificial neural network output is the condition of gearbox. Performances of psychoacoustic and statistical indices are then compared. It is found that psychoacoustic features are able to predict gearbox condition with an accuracy of 99% and 98% for good and faulty conditions, respectively, whereas the statistical features are able to do the same with 97% and 98% accuracy. Therefore, it is concluded that psychoacoustic features have the potential to be used for the end of line inspection of gearbox in manufacturing environment and the process of inspection can be made objective by eliminating operator’s ability and judgment.
Introduction
Gearbox is a vital element in any power transmission system. Therefore, condition monitoring of gearbox has been a topic of wide interest. Monitoring by using vibration and acoustic emission is very popular and well established. The monitoring is carried out for various purposes: (1) to characterize the emitted sound, (2) to diagnose faults in gearboxes of running machinery and (3) to check correctness of gearbox assembly after manufacturing for identifying problems if any, before clearing it for use in any vehicle or machine. Whatever is the purpose of monitoring, the process involves data acquisition and analysis. The analysis techniques can be classical or intelligent. The intelligent techniques are used for effective classification and fault diagnosis. The following paragraphs present a review of some relevant works in this area.
In applications like automobiles, manufacturers are very much concerned about the noise, vibration and harshness (NVH) and sound quality parameters of all the components and subassemblies which contribute to annoying noise of the vehicle. Sound quality has become an important criterion for the design and manufacturing of products to attract and retain customers. It is evaluated using psychoacoustics. Sound quality evaluation is of great importance not only to comply with pollution control regulations but also for sales as sale volumes are affected by it. Caryer Cook and Ali 1 have discussed the trends and perspectives of the end-of-line inspection for annoying noises in automobiles. There are some studies to characterize sound for various domestic products such as vacuum cleaner, refrigerator compressors, automobile seat adjuster and car door closer.2–6 Some of the researchers7–10 have studied the dynamic response of the gearbox, i.e. vibration and noise for the various errors like backlash, misalignment, profile error, etc. using techniques such as finite element method (FEM), boundary element method (BEM), Monte Carlo simulation, equation of motion and incremental harmonic balance method (IHBM). Zhou and Wenlei 7 established a dynamic model using FEM and BEM to show dynamic characteristics of gearbox where the time history of node dynamic response and noise spectrum of the gearbox were obtained. Shen et al. 8 studied nonlinear dynamics of a spur gear pair based on the IHBM, where the time-varying stiffness and backlash were included. The frequency–response of the system was investigated by IHBM, and the effects of damping ratio and amplitude of excitation on the response were analysed. Driot and Perret-Liaudet 9 studied the variability of modal behaviour in gear pair due to manufacturing error and shaft misalignment. Bonori and Pellicano 10 analysed non-linear vibrations of spur gear in the presence of manufacturing errors where backlash and profile error distributions were stochastically modelled to find their effect on gear vibration. Such studies help to analyse and control dynamics of gearbox to make changes at the design stage or to modify the existing product to enhance its performance. Significant work has been carried out to develop signal processing and artificial intelligence techniques for condition monitoring of rotating and reciprocating machines. Wang et al. 11 proposed an advanced technique for engine fault diagnosis based on Hilbert–Huang transform (HHT) on the noise based samples and support vector machine (SVM) method. Han et al. 12 used fast-ICA (independent component analysis) and wavelet packets along with the SVM for bearing fault diagnosis. Kankar et al. 13 used the complex Morlet wavelet based on minimum Shannon entropy criterion to extract the fault feature and presented a methodology for detection of bearing faults by classifying them using three artificial intelligence techniques where SVM is found to be superior to least vector quantization and self-organising maps. Advances in the field of condition monitoring indicators, signal processing and artificial intelligence techniques have been reported in the review papers by Nie et al., 14 Singh and Al Kazzaz, 15 Peng and Chu, 16 and Jardine et al. 17 In addition to the above, there are some studies18,19 on the cabin noise for tractor and car and it is found that the structure born sound due to gearbox is the most annoying noise and hence it is recommended that efforts should be made to control quality of gearbox on assembly line.
If the focus is on gear fault diagnosis in running machinery, then there is no dearth of literature on use of vibration and acoustic emission techniques for this purpose. These techniques generally use time and frequency domain methods for diagnosing faults. When in operation, the major causes of failure of the gearboxes are cracked gear tooth, pitting, wear, etc. Wang et al., 20 Saravanan et al., 21 El Badaoui et al., 22 Wang et al. 23 and Loutas et al. 24 have demonstrated use of intelligent techniques for effective classification and gear fault diagnosis.
During inspection of newly manufactured gearboxes, for deciding the acceptability of the gearbox, the operator listens to the sound of gearbox on a test bench by running it at a constant speed by an electric motor. Based on the judged sound quality, the operator accepts or rejects the gearbox. This becomes a challenging task as the decision is subjective and depends on the opinion of the individual. Hence, psychoacoustics, a new evolving technique would be one of the solutions to eliminate subjectivity by extracting psychoacoustic parameters which are based on science of human hearing and physics of sound waves. For newly manufactured gearboxes, faults like misalignment, centre distance variation, dents on teeth, bearing misfit, profile errors, etc. may occur. These faults would manifest in different ways such as increased vibration, annoying sounds, rattle and high pitch whistle type sound. However, very limited work can be been found for evaluating gearbox quality using psychoacoustics to identify correct working of gearbox during end of line inspection. Shang et al. 25 have also reported similar situation of dependence on human hearing ability and expertise in gearbox inspection after making the assembly. They have proposed vibration based technique which makes use of time and frequency domain methods. Time synchronous averaging was applied to acquire data as driving, driven and counter shafts are involved. During visit to few gearbox manufacturing industries by the authors and subsequent interaction with the people involved in manufacturing, it was realized that there is a need to develop a technique which would work as a tool to identify correctness of the assembly and classify the gearbox as ‘OK’ or ‘Not OK’, based on some objective indices and artificial intelligence technique rather than the subjective opinion and hearing ability of the operator which is currently used. Hence, this paper focuses on developing a method by which the existing end of the line inspection of gearbox assembly by human operator can be replaced by an algorithm where the subjectivity involved in the decision on acceptability of gearbox can be eliminated. As human hearing ability is to be replaced, use of psychoacoustics has been made for fault identification.
In view of the above, experiments are conducted on a standard experimental gear set up for fault simulation. The main objective is to find the relationship between possible defects and manifested outcomes using psychoacoustic indices to ascertain their ability to classify faults. The statistical features of acoustic signal and psychoacoustic parameters are extracted from the measured data and used as input to artificial neural network (ANN). Details are discussed in the next section.
Experimental set up and procedure
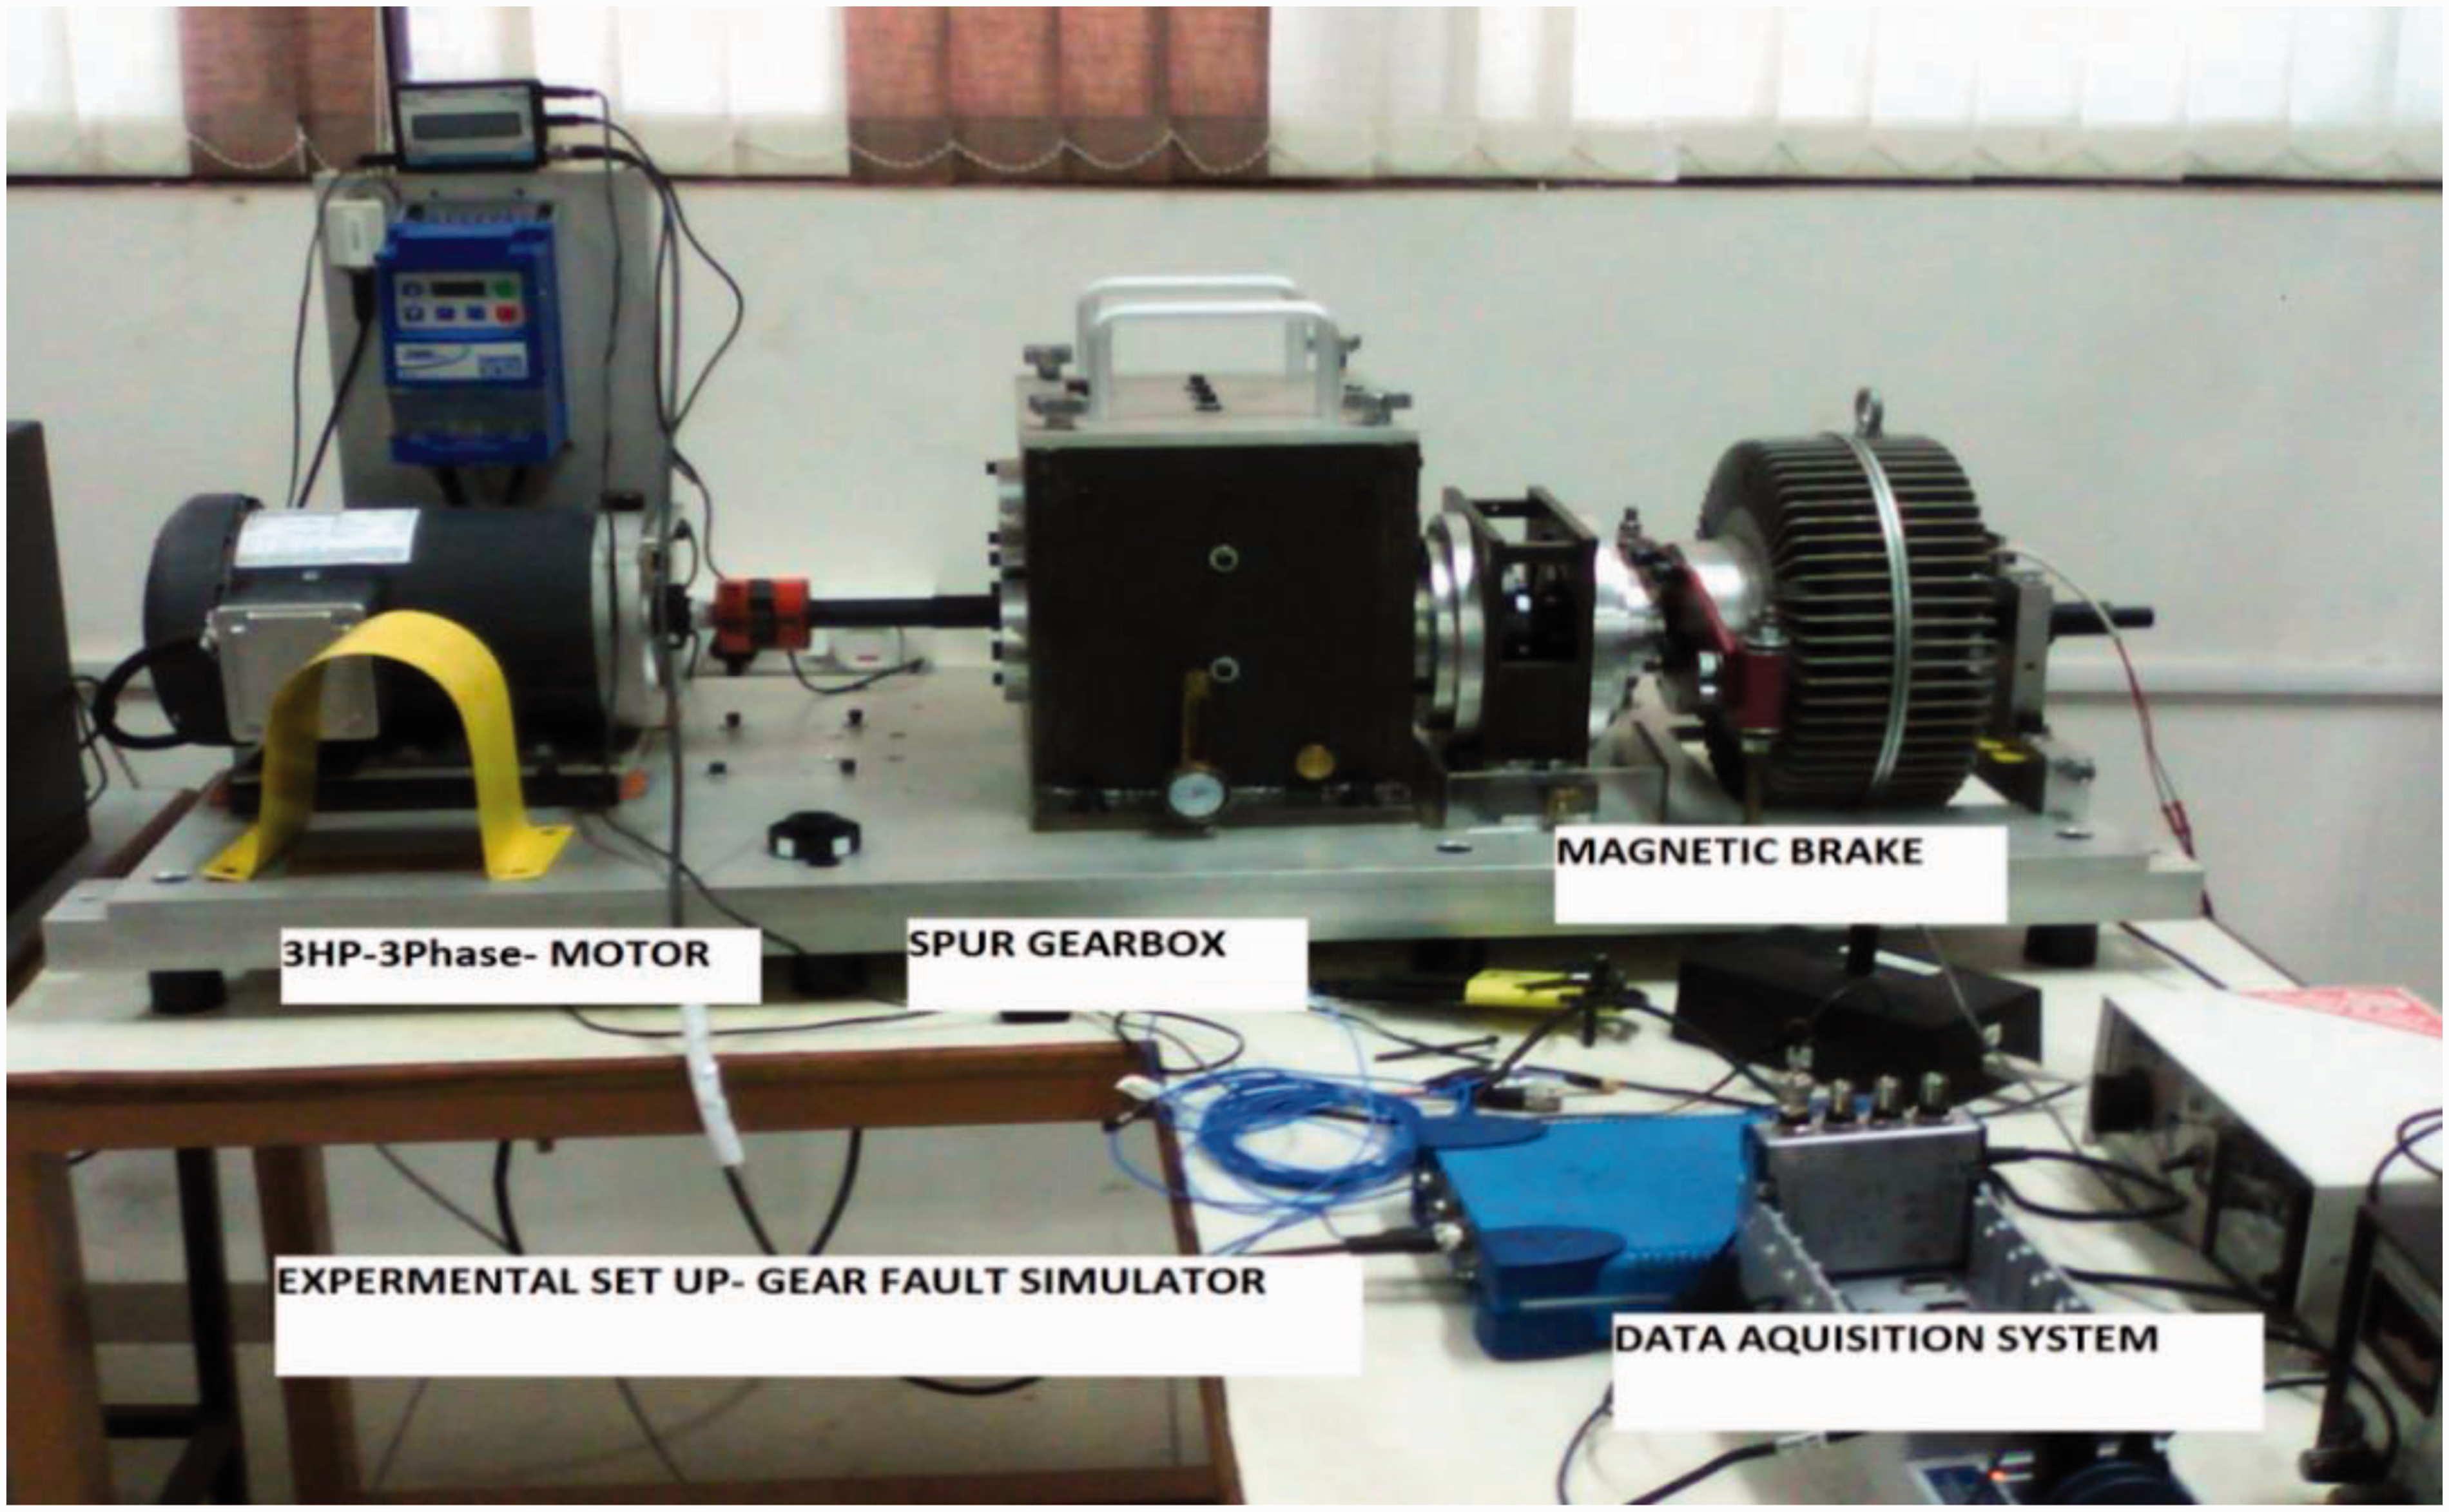
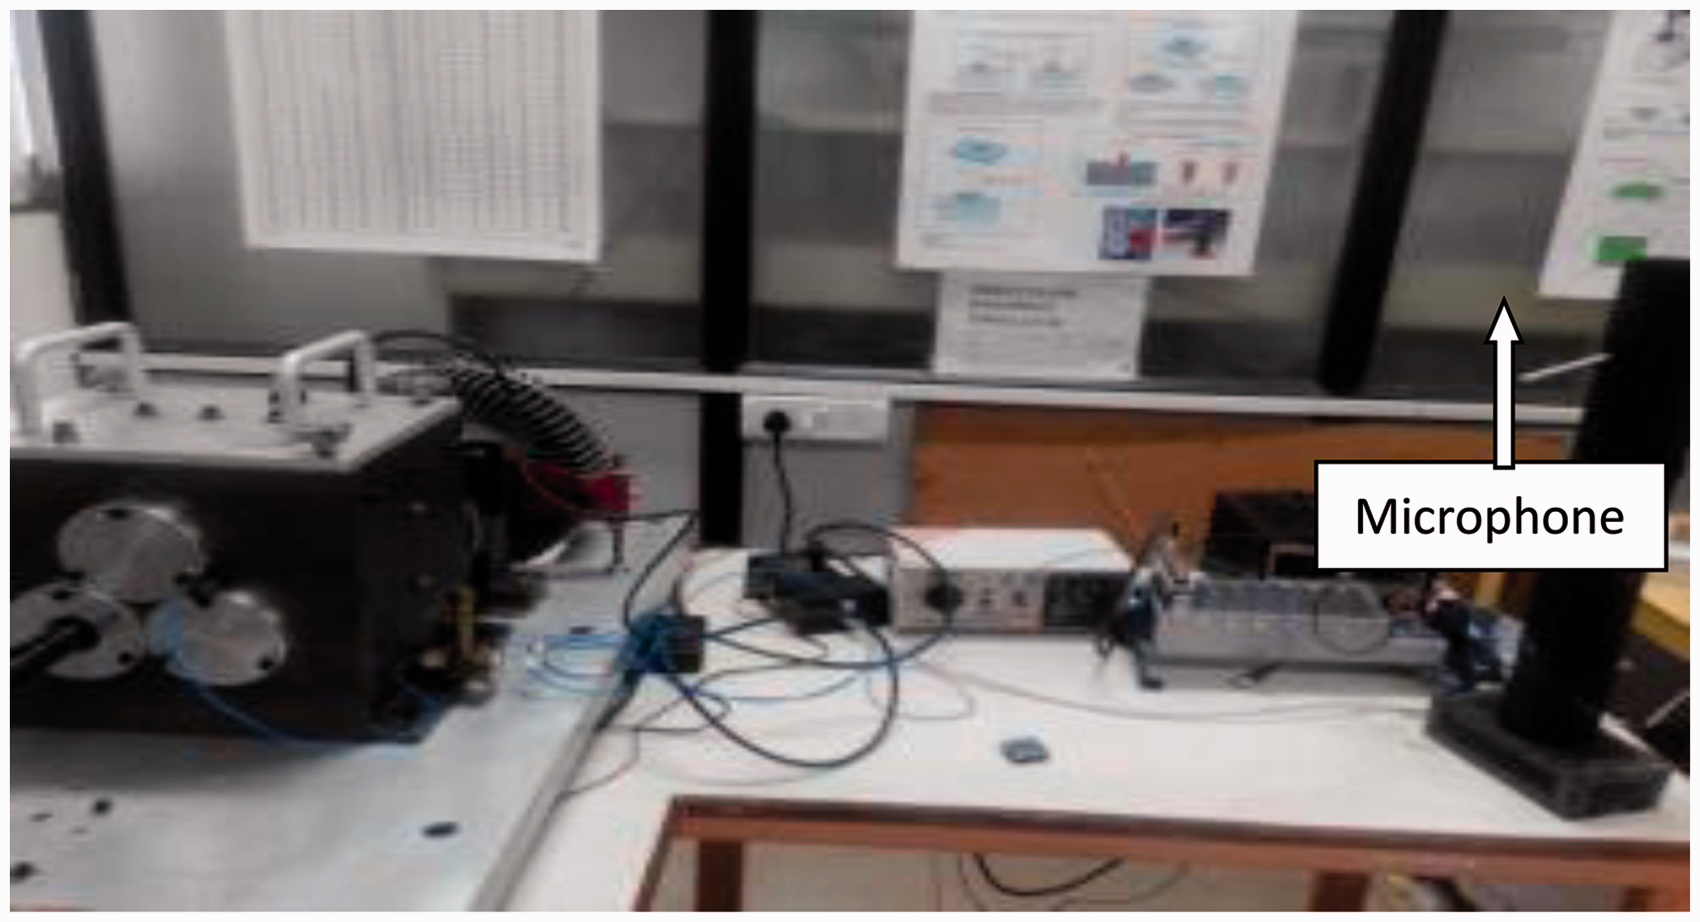
Experiments were carried out on a spur gearbox test rig with layout as shown in Figure 1. It consists of single stage spur pinion and gear. The shafts are supported by deep groove ball bearings. The gearing system is lubricated by splash lubrication provided at the bottom of gear housing. The pinion on input shaft has 32 teeth and driven gear on the output shaft has 80 teeth. A three phase, 3 HP, 0–5000 rpm variable speed motor operates the input shaft. The output shaft is connected to magnetic particle brake. More than one test gears can be mounted on the input shaft at a time so that good and faulty gears can be engaged by sliding. Output shaft is connected with magnetic particle brake for applying the required load/torque. Magnetic brake can vary the load as required with the help of programmable controllers. Data acquisition (DAQ) card by National Instruments (NI9234) was used to acquire the acoustic signal with array microphone of type 40 PH of make of G.R.A.S. with sensitivity of 52.14 mV/Pa. Figure 2 shows a photograph of the experimental setup and Figure 3 shows the setup with position of microphone. The microphone, was located in free field at 1 m distance from the gearbox. It was connected to DAQ card and data were acquired and stored on a computer. LabVIEW software was used to acquire data and extract various psychoacoustic and signal statistical features. The acoustic signals and their features were obtained by varying speed and load of the gearbox for good and faulty (crack at the root) gears in mesh. In the experiment, 50 samples of the signals of each condition of speed, load and gear were acquired and their features were extracted. Thus there were 600 sample signals. The sampling frequency selected for acquiring data was set at 44,000 Hz keeping in mind the requirement of Nyquist theorem. The various features extracted are described in section ‘Acoustic signal feature extraction’.
Experimental setup. Photograph of experimental setup. Photograph of experimental setup with microphone.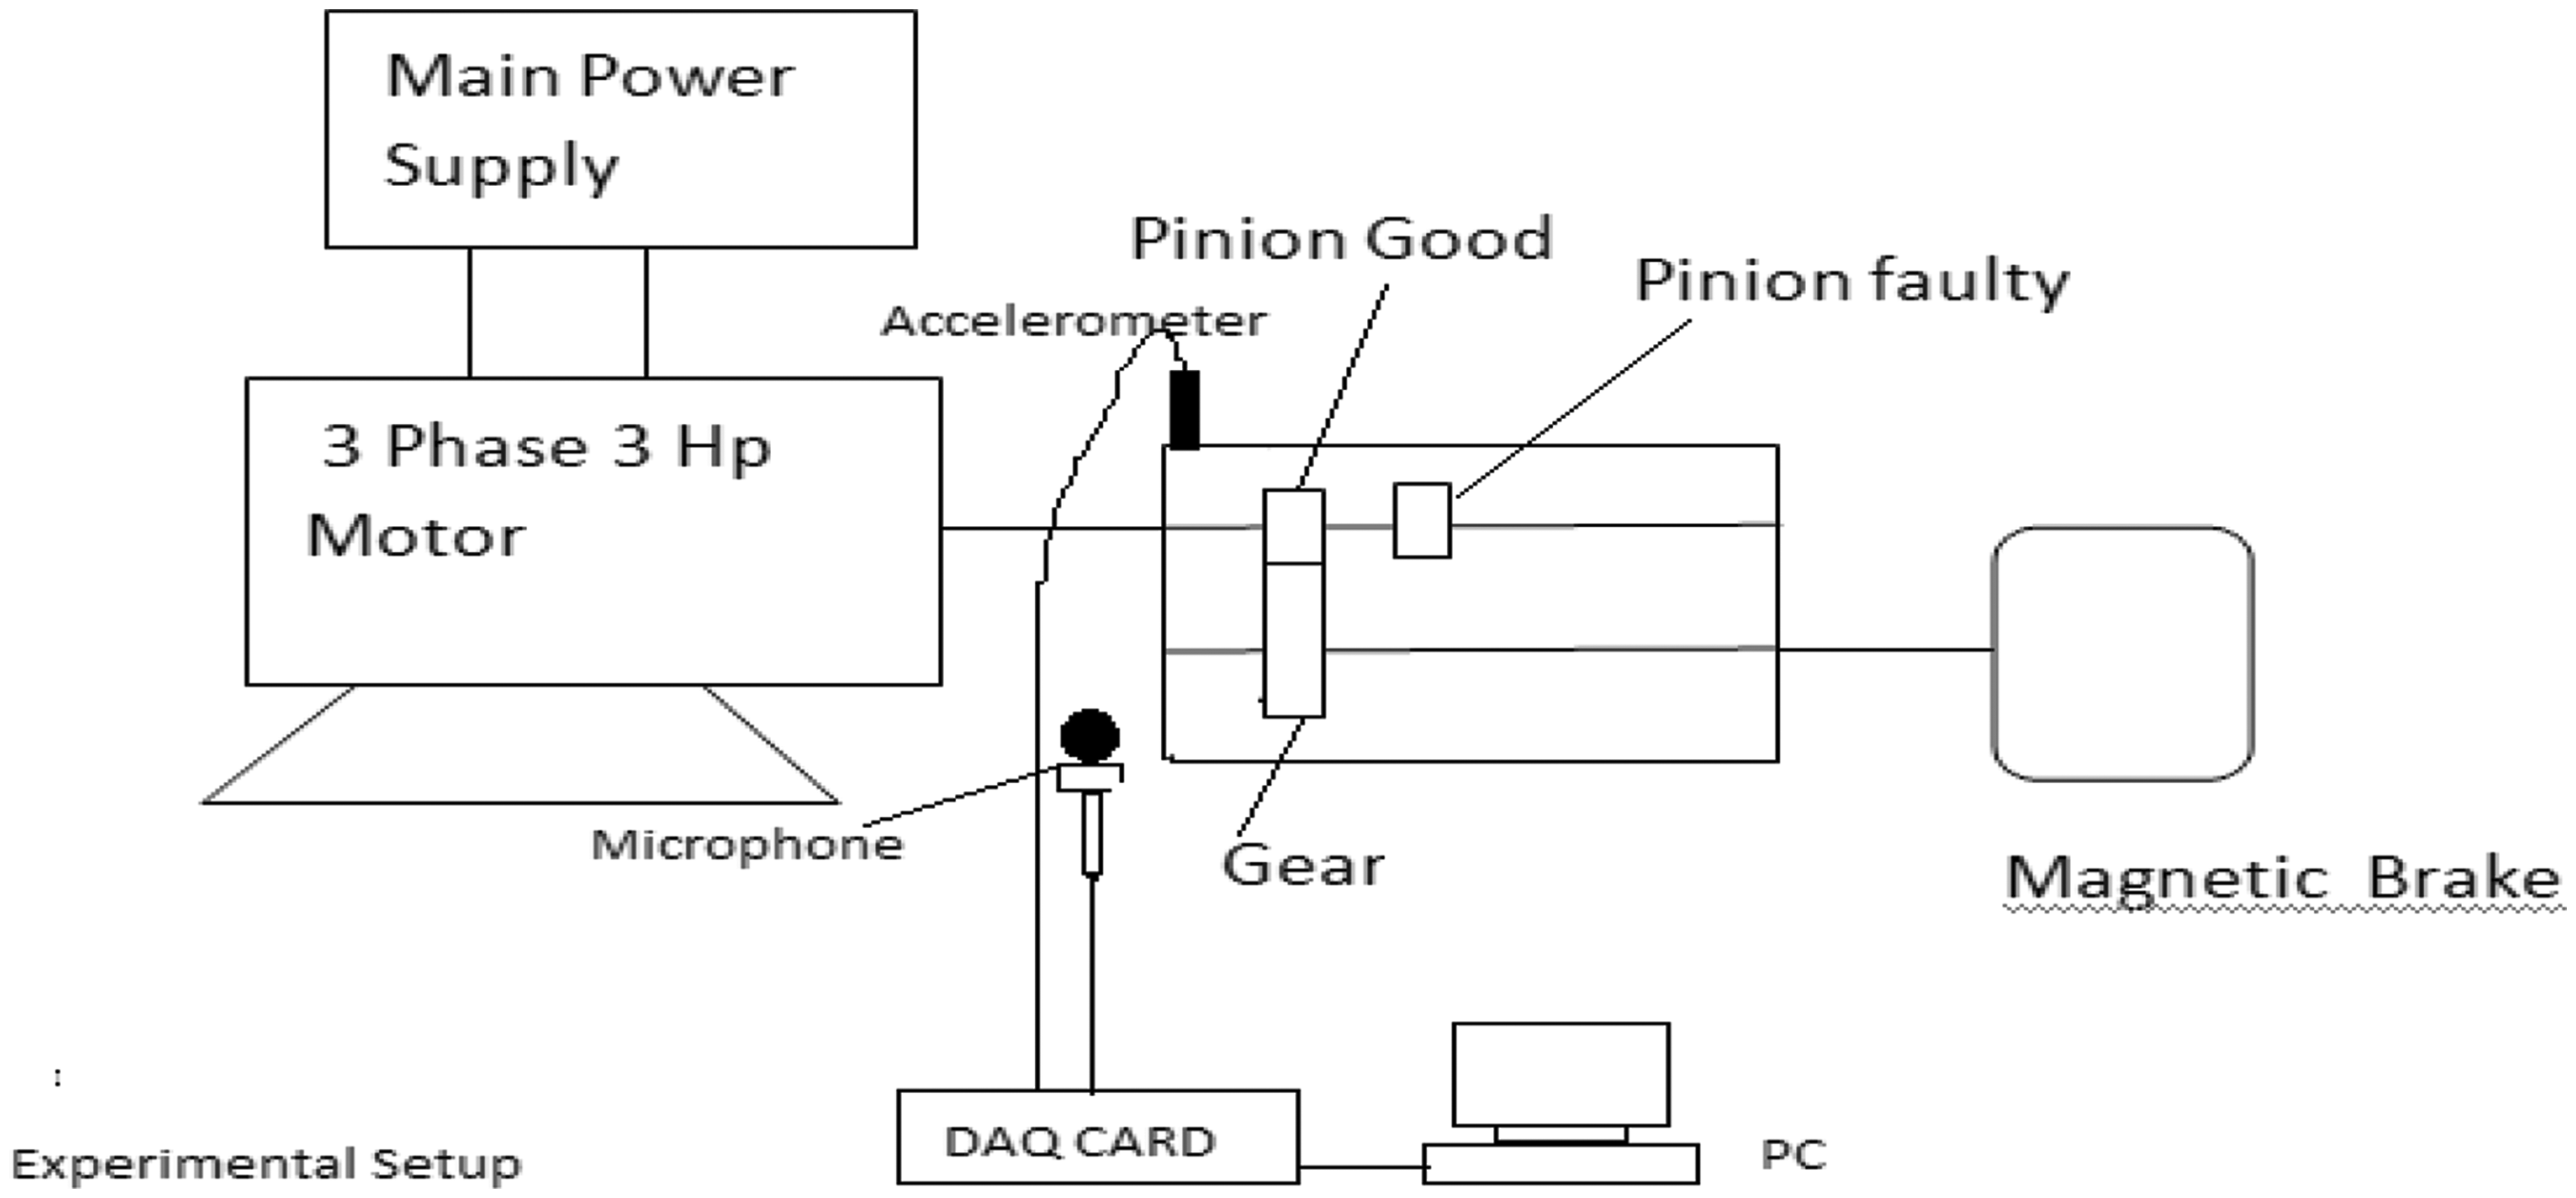
Acoustic signal feature extraction
Various features characterizing acoustic signal are discussed below.
Statistical features of acoustic signal
Expressions to compute statistical features of acoustic signal.
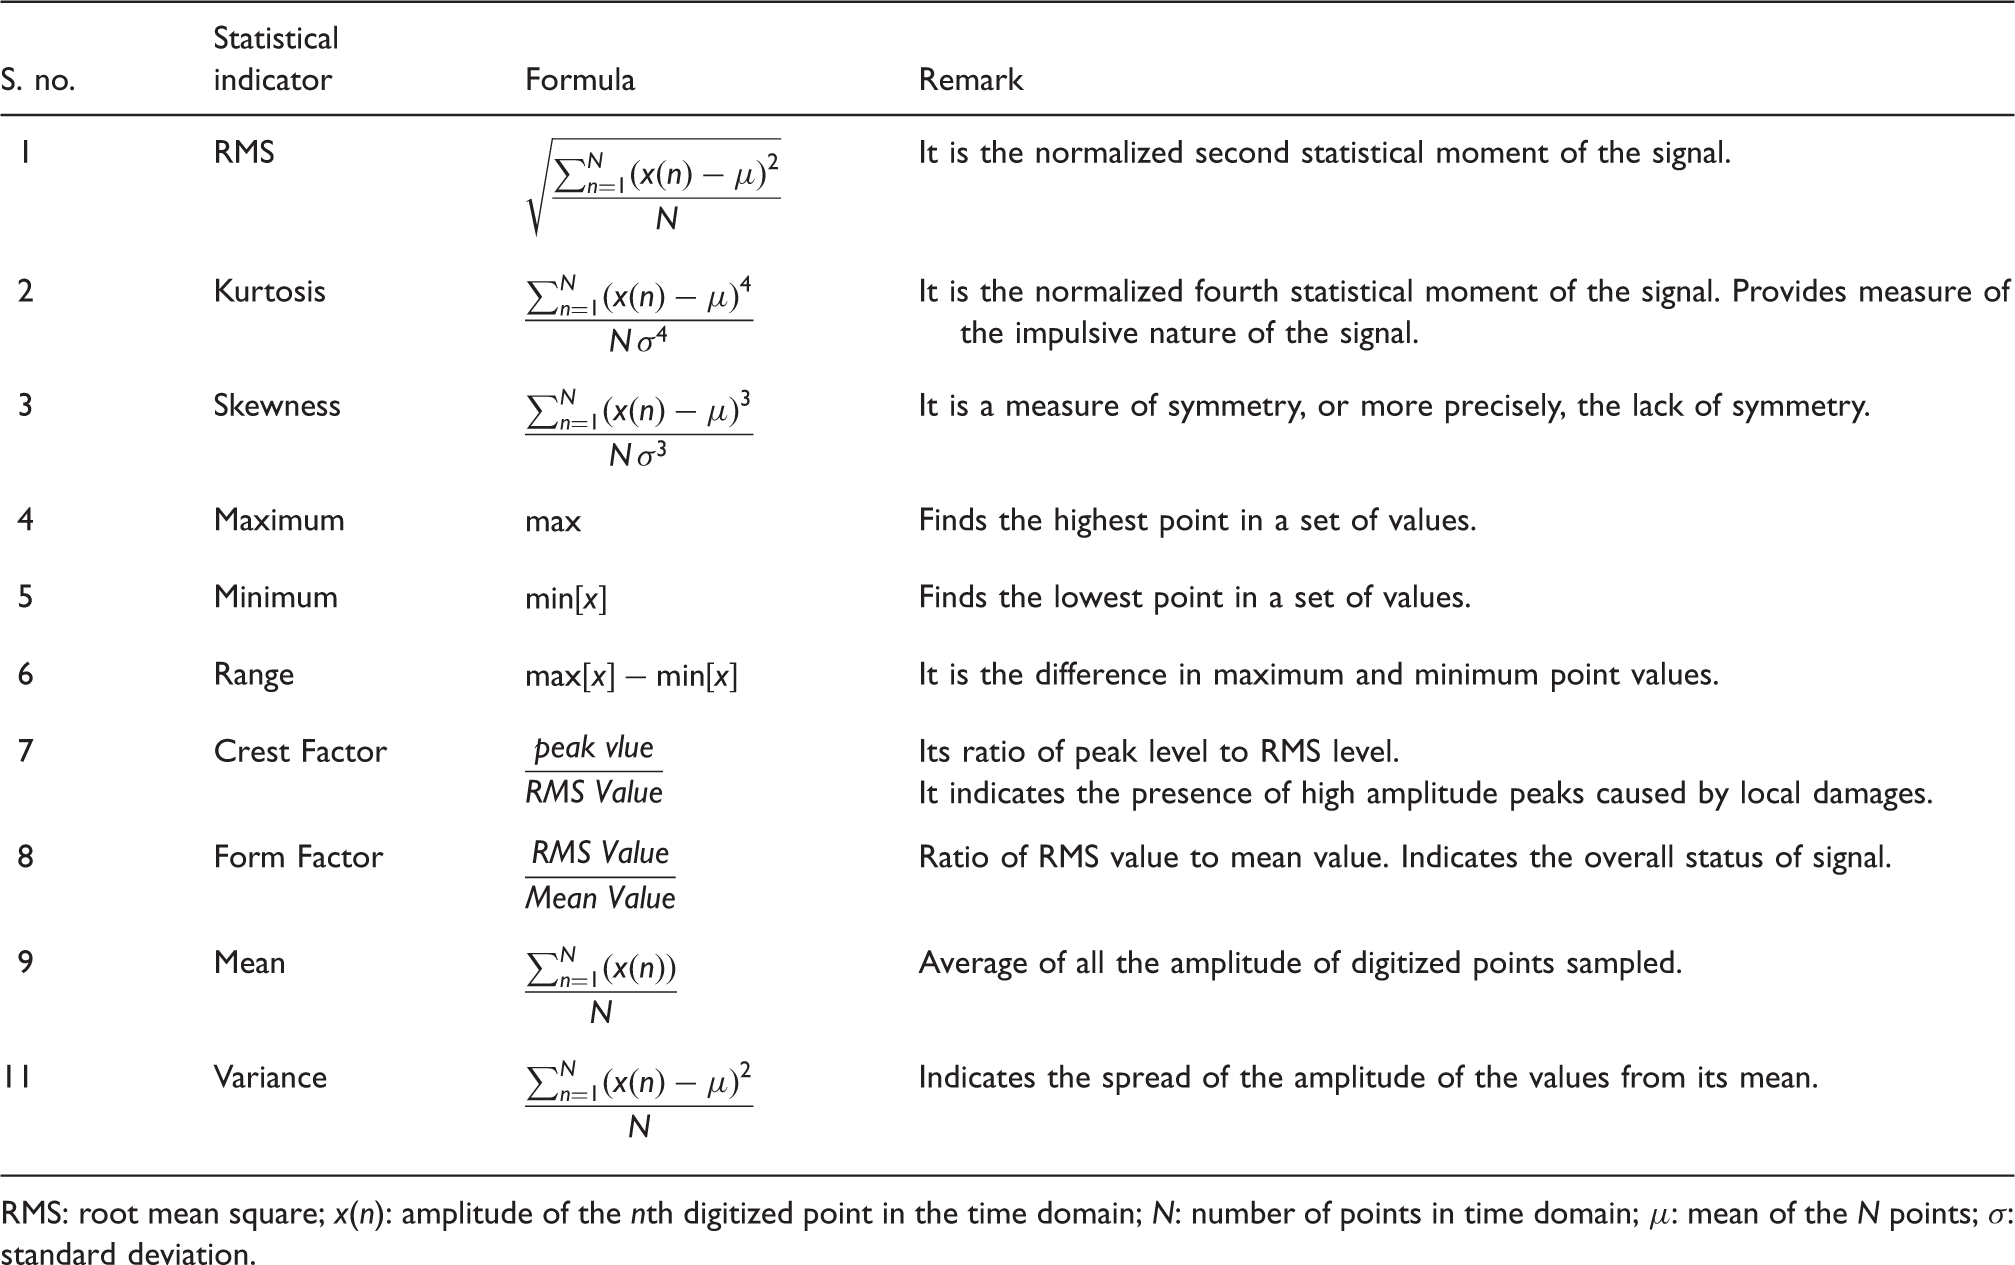
RMS: root mean square; x(n): amplitude of the nth digitized point in the time domain; N: number of points in time domain; μ: mean of the N points; σ: standard deviation.
Statistical signal features of acoustic signal.
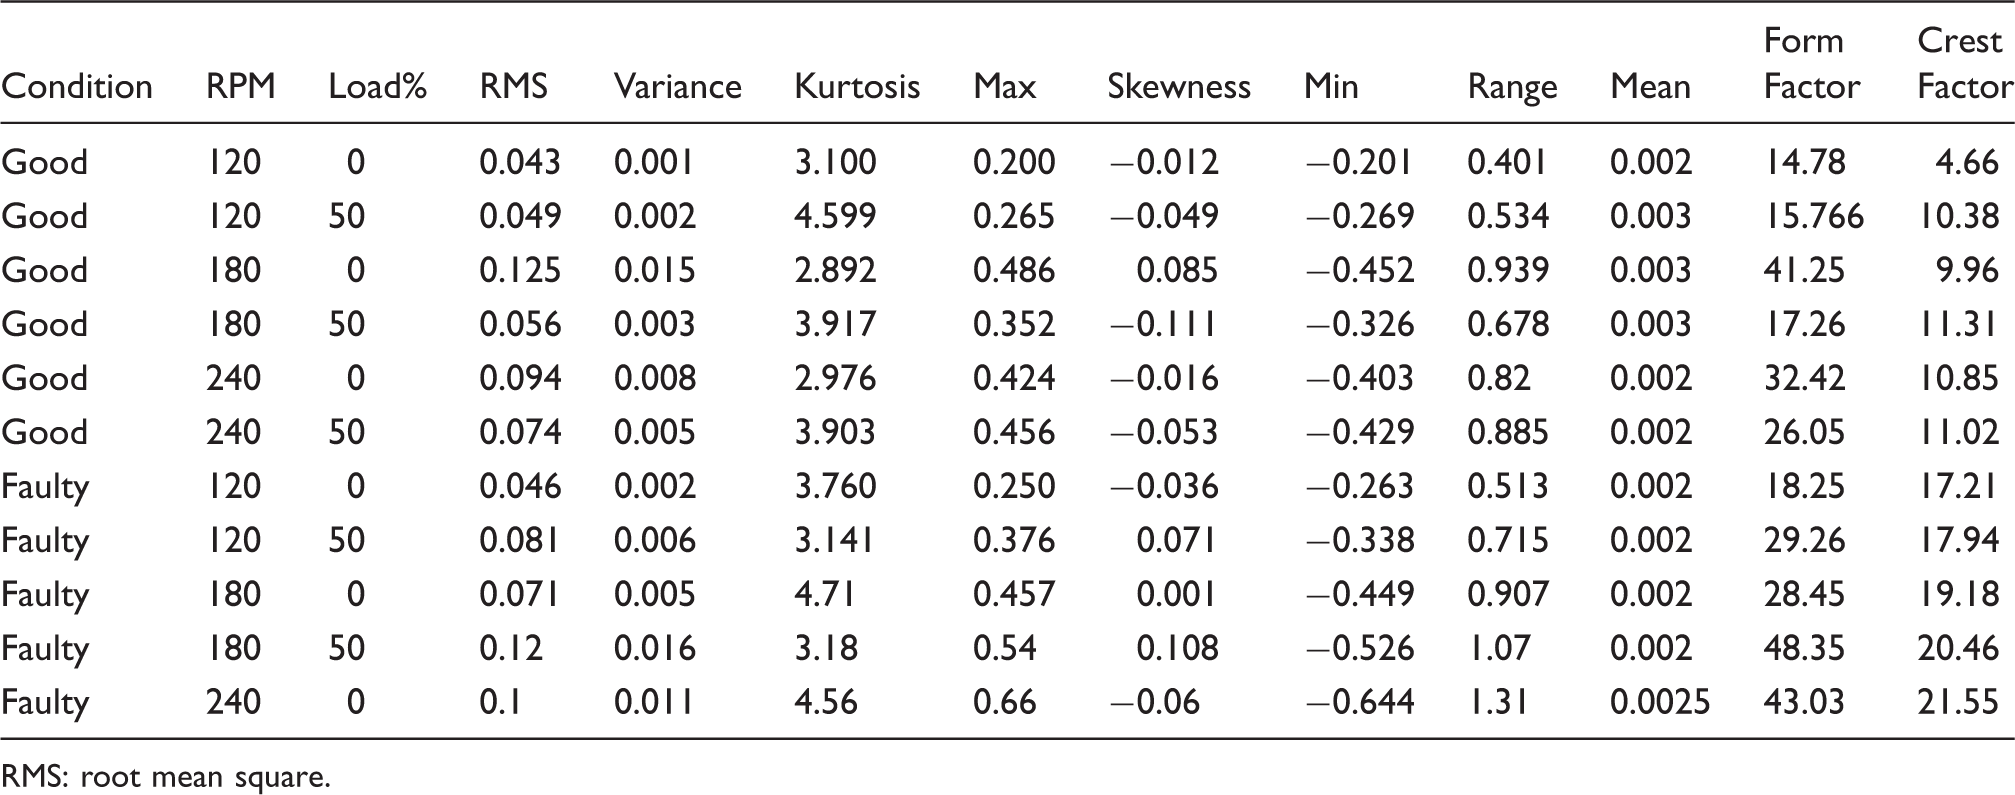
RMS: root mean square.
Psychoacoustic features of acoustic signal
Psychoacoustic features and related expressions.
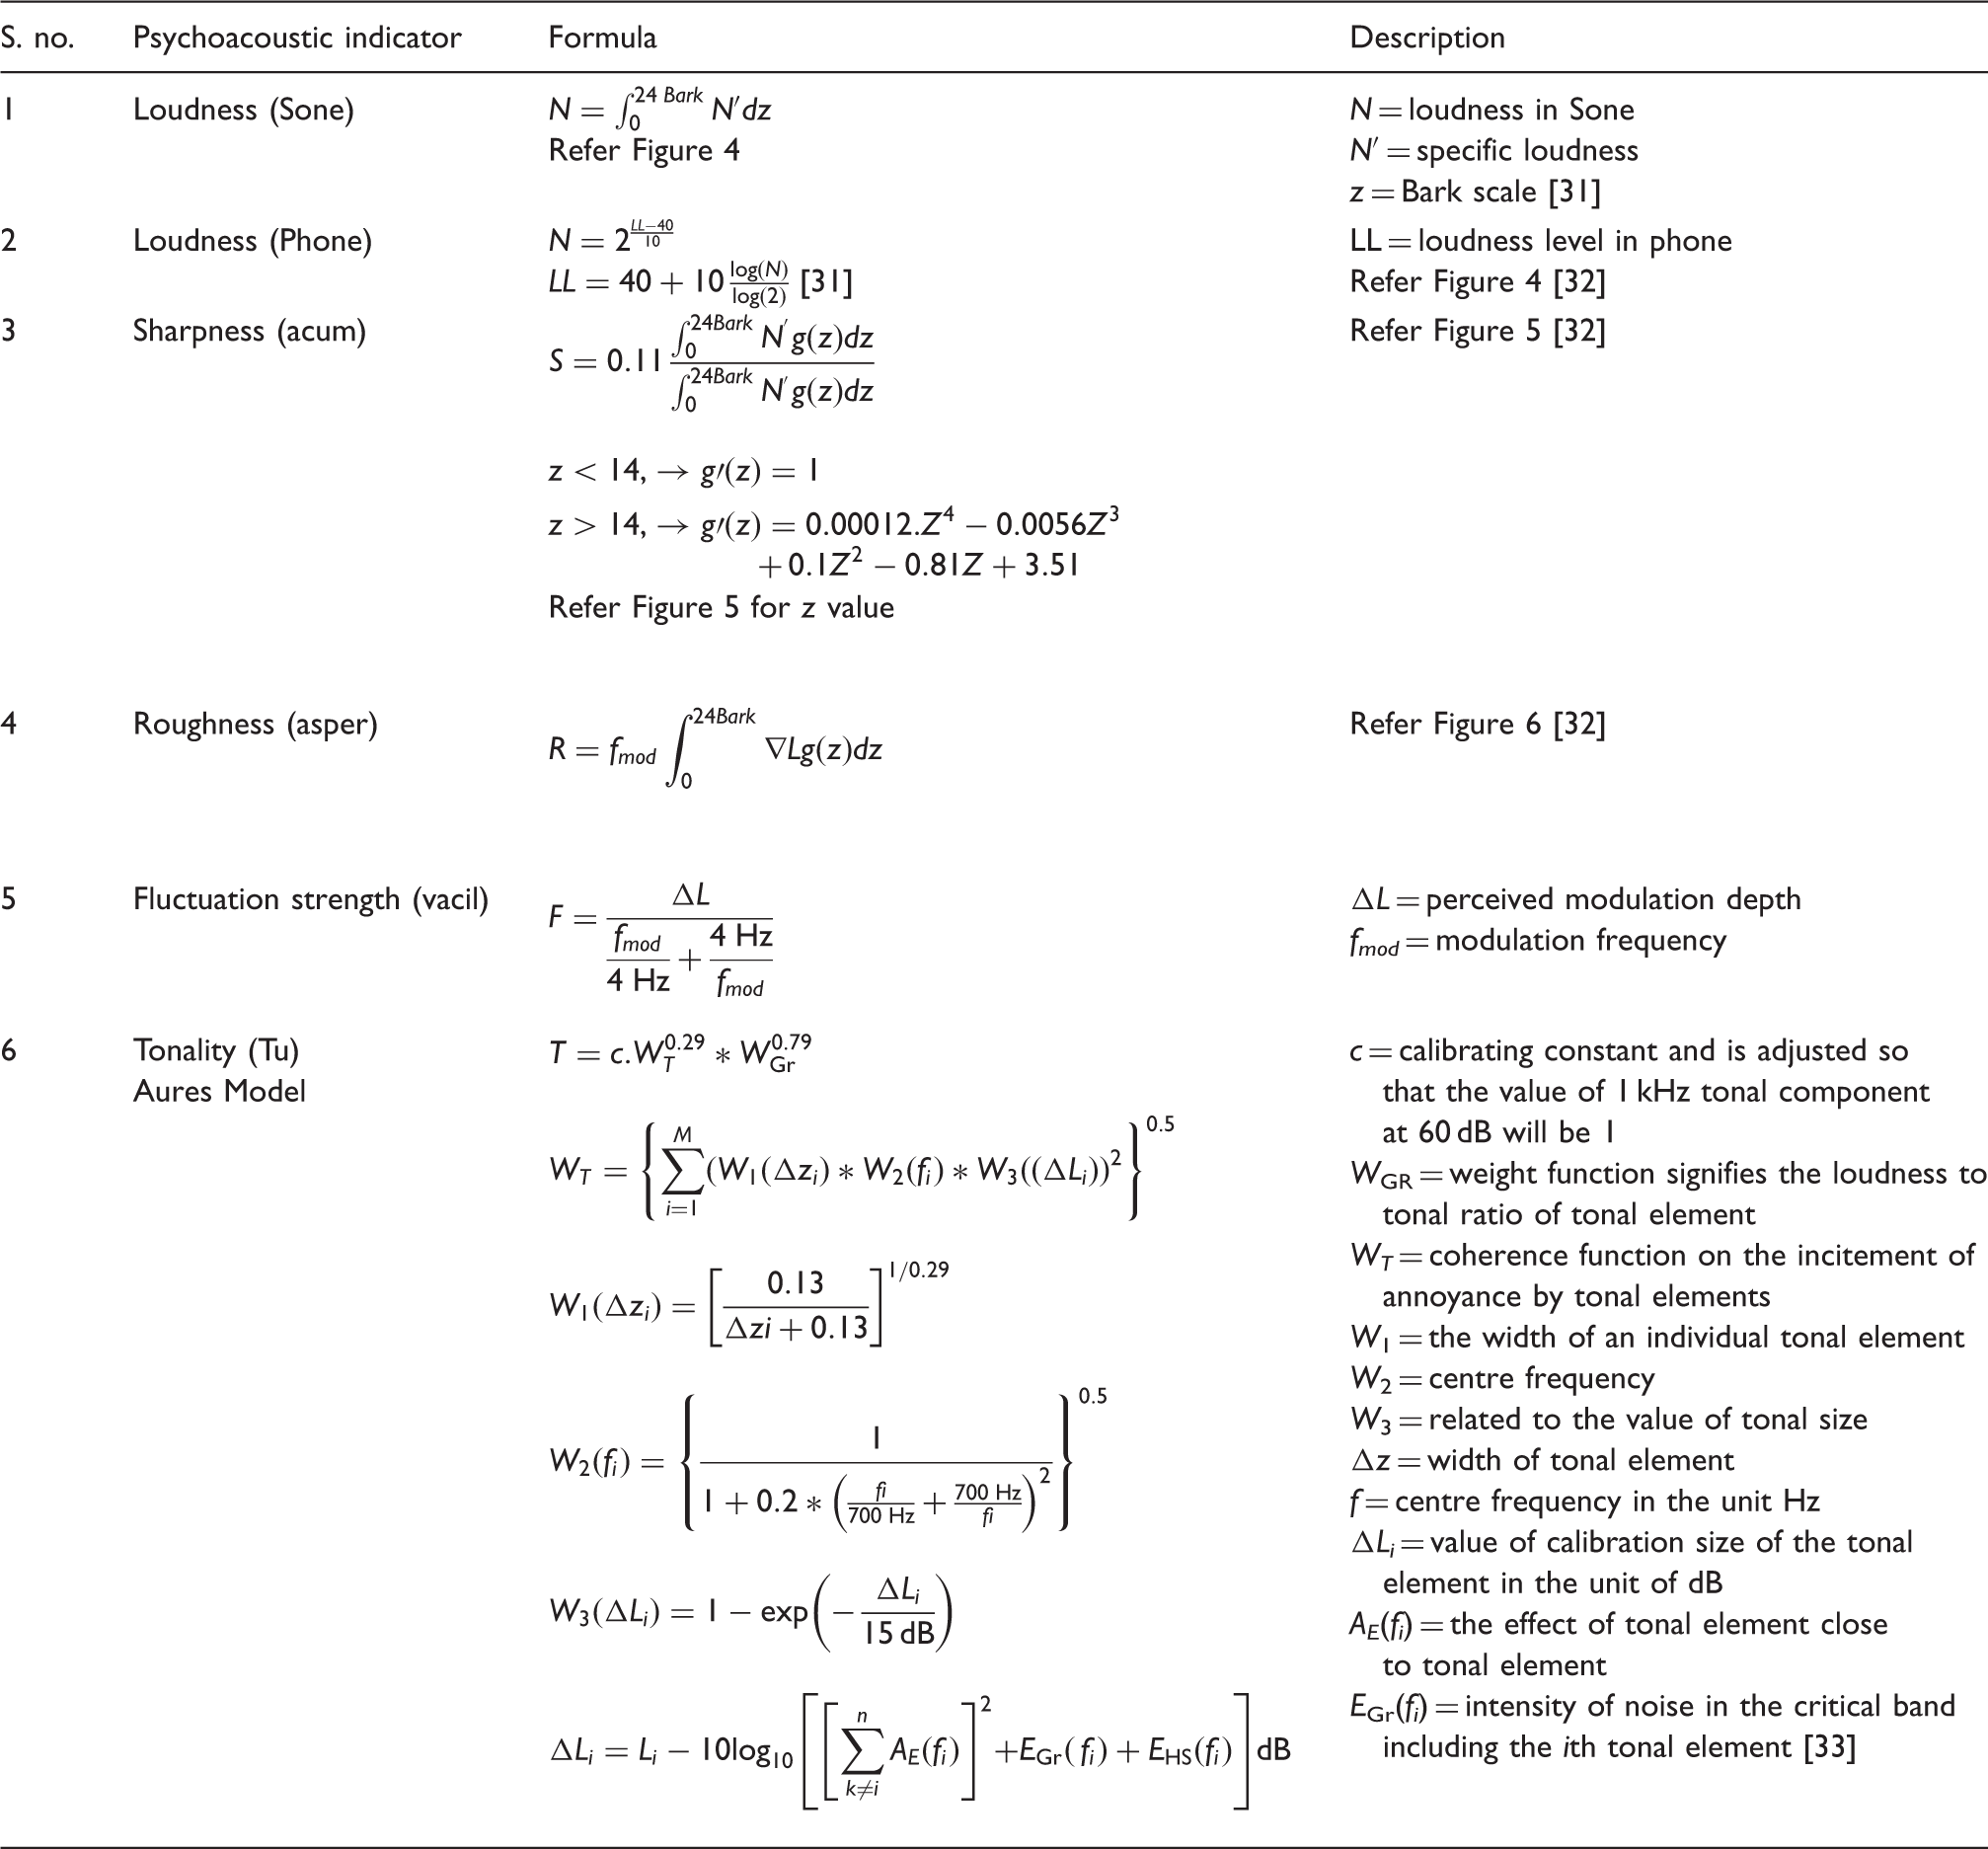
Loudness
Loudness is the effect of energy content of sound on the ear. It is related to decibel (dB) which is logarithmic scale used to quantify the power of sound. Doubling the sound power does not mean that the sound perceived is twice. The calculation of sound addition is more complex and is dependent on the critical bandwidth which is a measure of frequency resolution of ear. Loudness perception is a function of sound pressure level, frequency and the spectral shape of the sound. Hence the loudness is computed using the equation shown in Table 3. The calculations are based on the complex graphical method using 1/3rd octave band which is considered as equivalent to critical bandwidth as per ISO 532/R. It provides a graphical method in which specific loudness is integrated over 21 critical bands and specific loudness N’ is computed as a function of critical bandwidth in Bark (z).The loudness level is defined as sound pressure level of 1 kHz pure tone in a plane wave and frontal incident that is as loud as Phone. Loudness is a term referring to human perception of sound volume expressed in the units of Sone which corresponds to 40 dB sound at 1 kHz tone.30–32
Sharpness
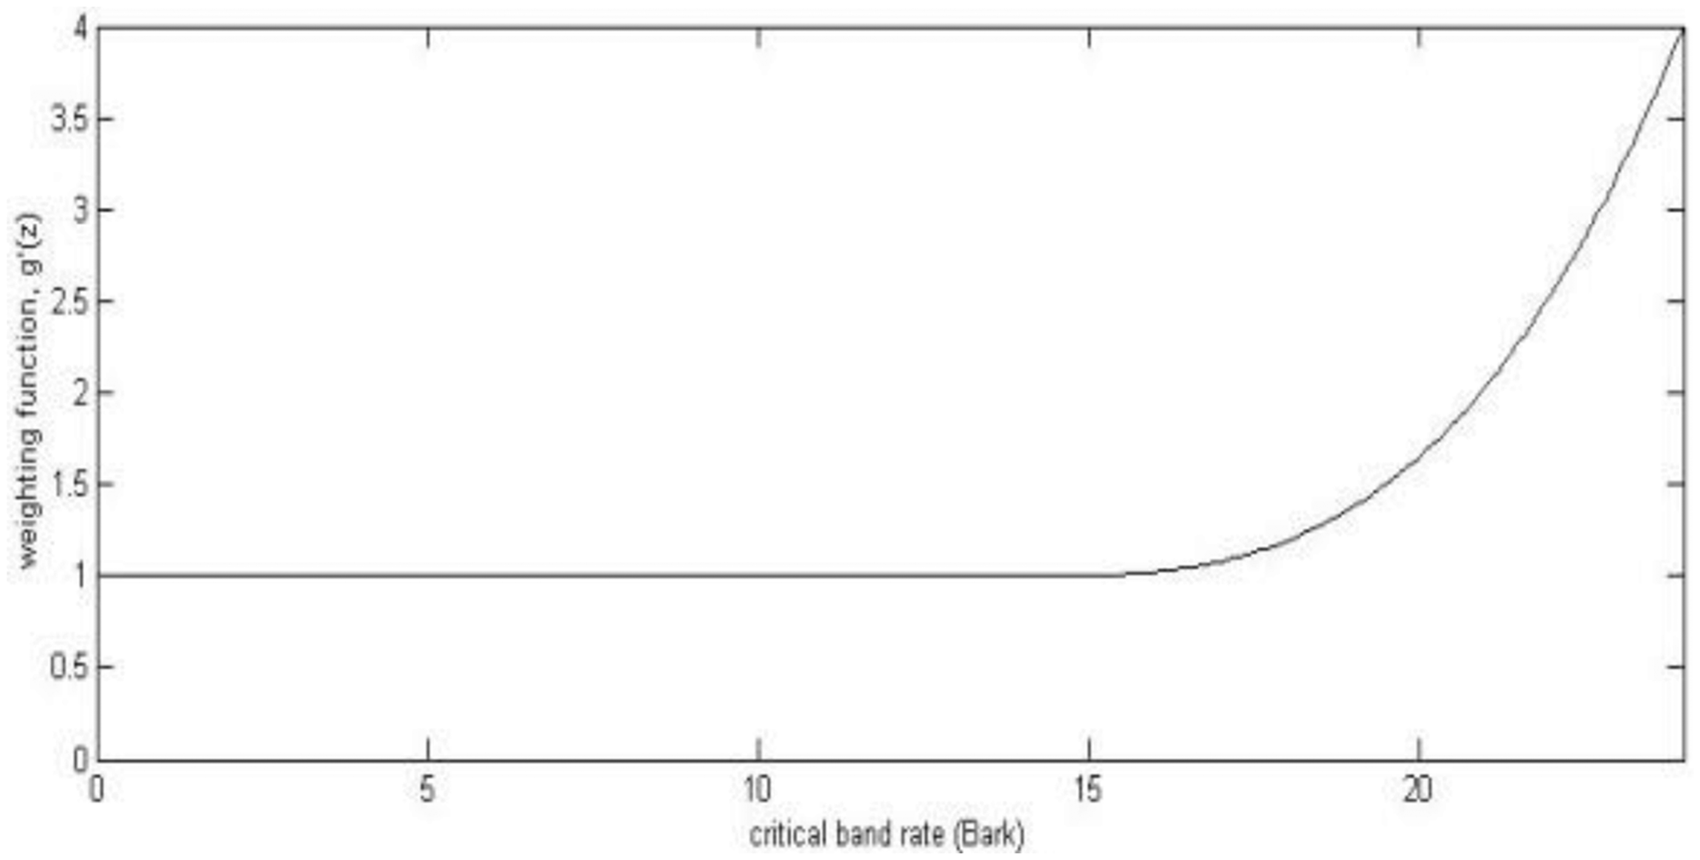
Sharpness is a measure of the relative loudness at high frequencies. Sharpness is used to characterise steady state noise and corresponds to the sharp, painful, high energy sound and is the comparison of amount of high frequency energy to the total energy. It is measured in acum. An acum is referenced to a narrow band noise centred at 1 kHz with the level of 60 dBspl. Expressions for sharpness used in LabVIEW program are based on Aures' model given in Table 3.30–32
Calculation of Loudness [32]. Weighting, g′(z), as a function of critical band rate [32]. The effect of subjective duration on rapid amplitude modulated noise [32].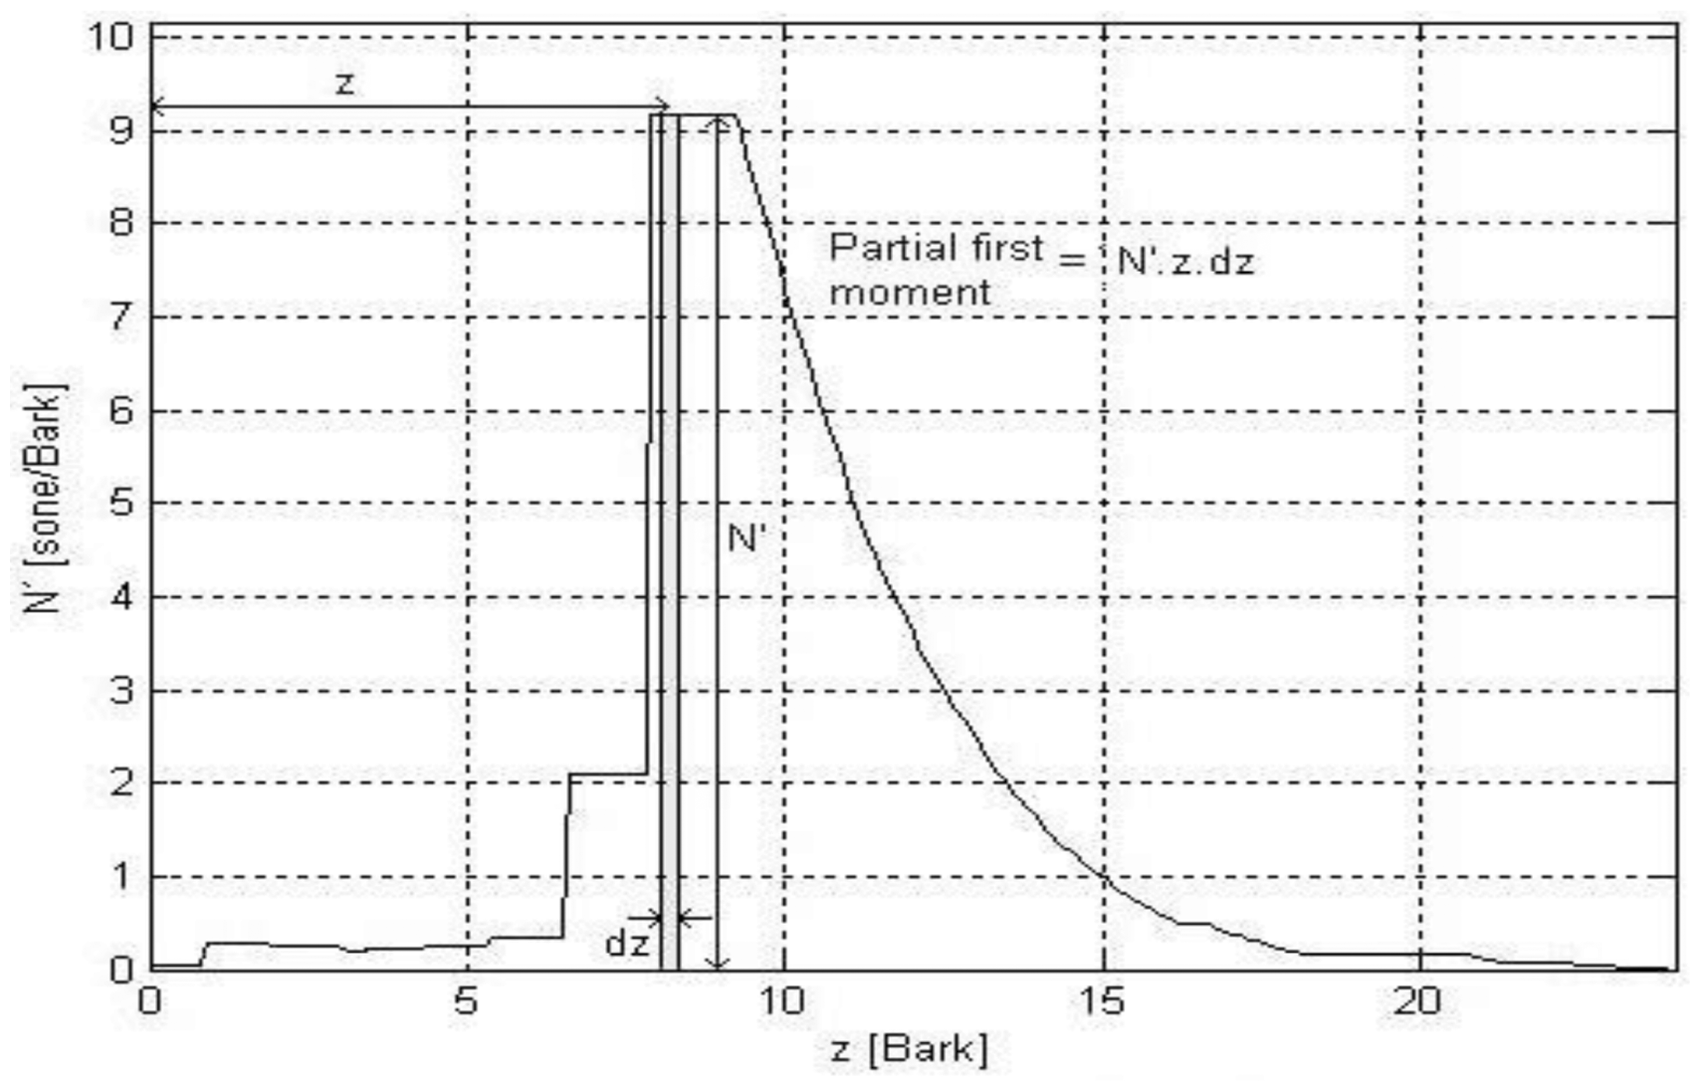
Roughness
Roughness is the subjective perception of fast amplitude modulation present in sound pressure signal. Roughness is used to characterise the dynamic noise by measuring the temporal deviation of the loudness spectrum due to frequency modulation between 20 Hz and 300 Hz. Roughness is measured in asper. An asper is referenced to a 1 kHz tone at 60 dBspl that is frequency modulated by 70 Hz sine wave with a modulation factor of 1. It is the algorithm developed to measure energy in 24 barks, computes and filters the envelope of signal in each band and measures the amplitude modulation of each envelope and then weights the level in each band with the frequency dependent weighting function. This algorithm returns the roughness spectrum versus critical band and then integrates the roughness spectrum to measure the roughness.30–32
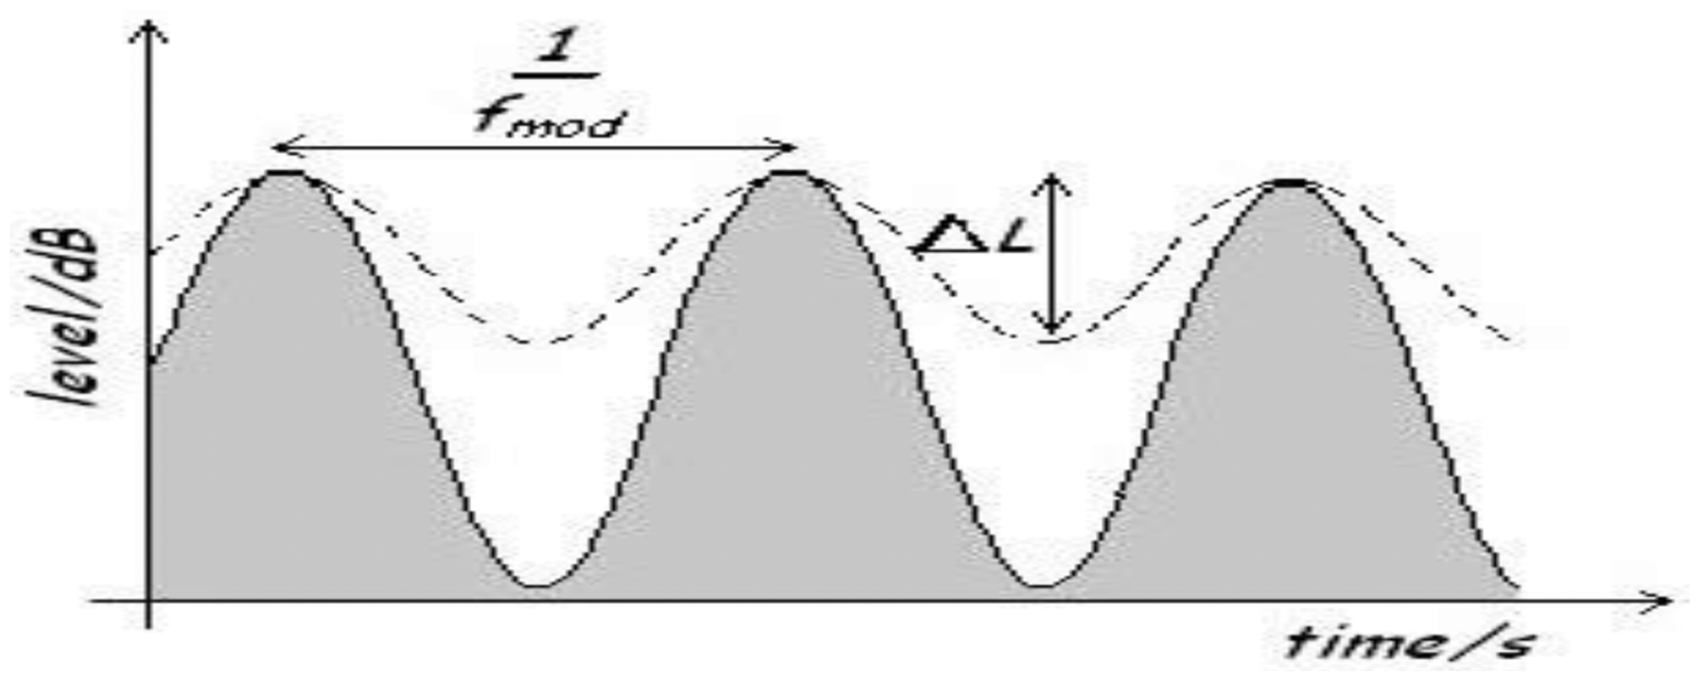
Fluctuation strength
Fluctuation strength is a hearing sensation related to loudness modulation at low frequencies that is perceptible individually. It uses similar method to roughness versus time analysis except that it focuses on the signal variation with very low modulation frequencies between 0.25 Hz and 20 Hz. It is measured in vacil. A vacil is referenced to a 1 kHz tone at 60 dBspl that is frequency modulated by 4 kHz sine wave with a modulation factor of one.30–32
Tonality
Tonality is used to determine whether a sound consists mainly of tonal component of broadband noise. The algorithm for tonality measures the relative strength of the signal compared to the overall signal. For each time block, this algorithm first varies the frequency resolution according to the human frequency selectivity, searches the frequencies of likely tones and then compares the loudness of the sound. The expressions based on Aures’ model 33 are mentioned in Table 3. LabVIEW programme computes tonality of the sound pressure signal according to Aures' model on successive 160 ms blocks. 31 Tonality measures the relative strength of the tones in a signal compared to the overall signal.
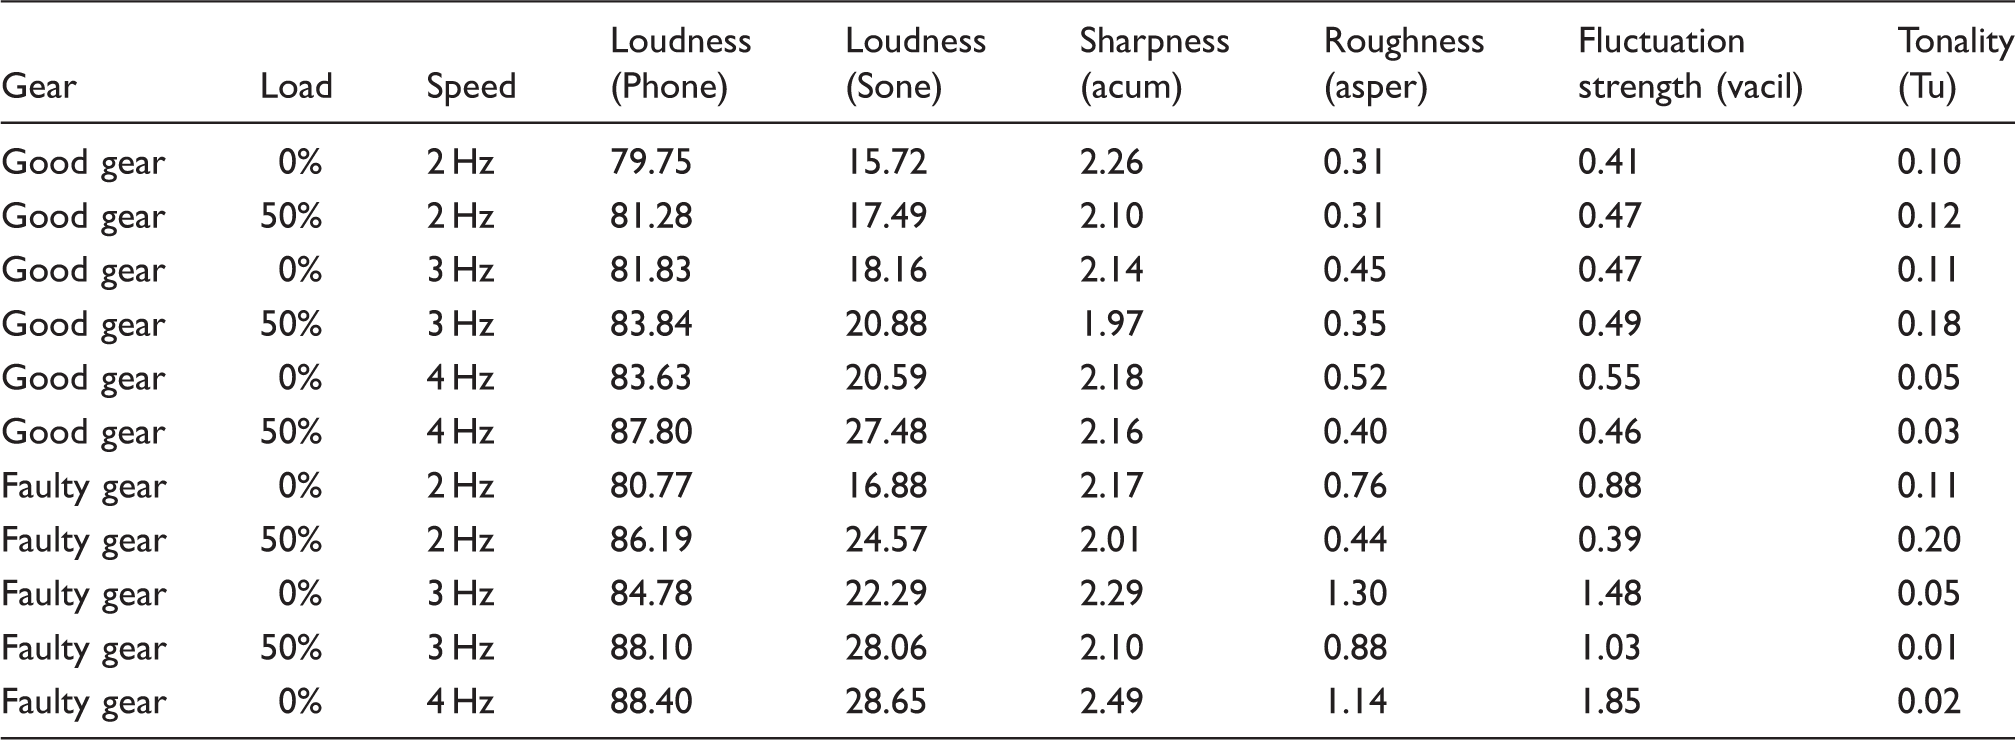
Sample values of psychoacoustics parameters.
Fault classification
The methodology adopted for experimentation and fault classification using acoustic signal’s statistical and psychoacoustic features is shown in Figure 7. After extracting the psychoacoustic and statistical indices from the acquired data, ANN was used for classification. First, ANN was trained with the psychoacoustic features and its ability to classify good and faulty condition was ascertained. Then, the ANN was trained using the various statistical features of acoustics signals like RMS, Kurtosis, Form Factor, Crest Factor, etc. and the ability to classify the fault was again tested. A graphical user interface was developed in MATLAB for using the ANN module. Trained ANN models were tested to compare the classification efficiency for psychoacoustic and statistical features. The details of the ANN architecture selected for classifying the faults are discussed in section ‘Artificial neural network’.
Methodology.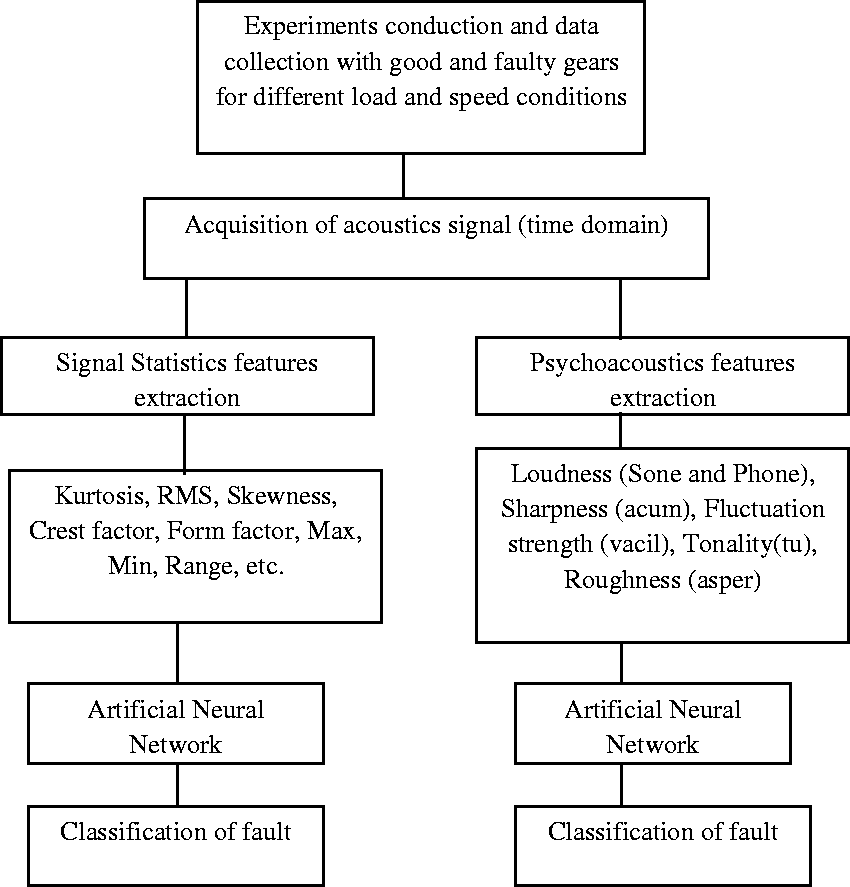
Artificial neural network
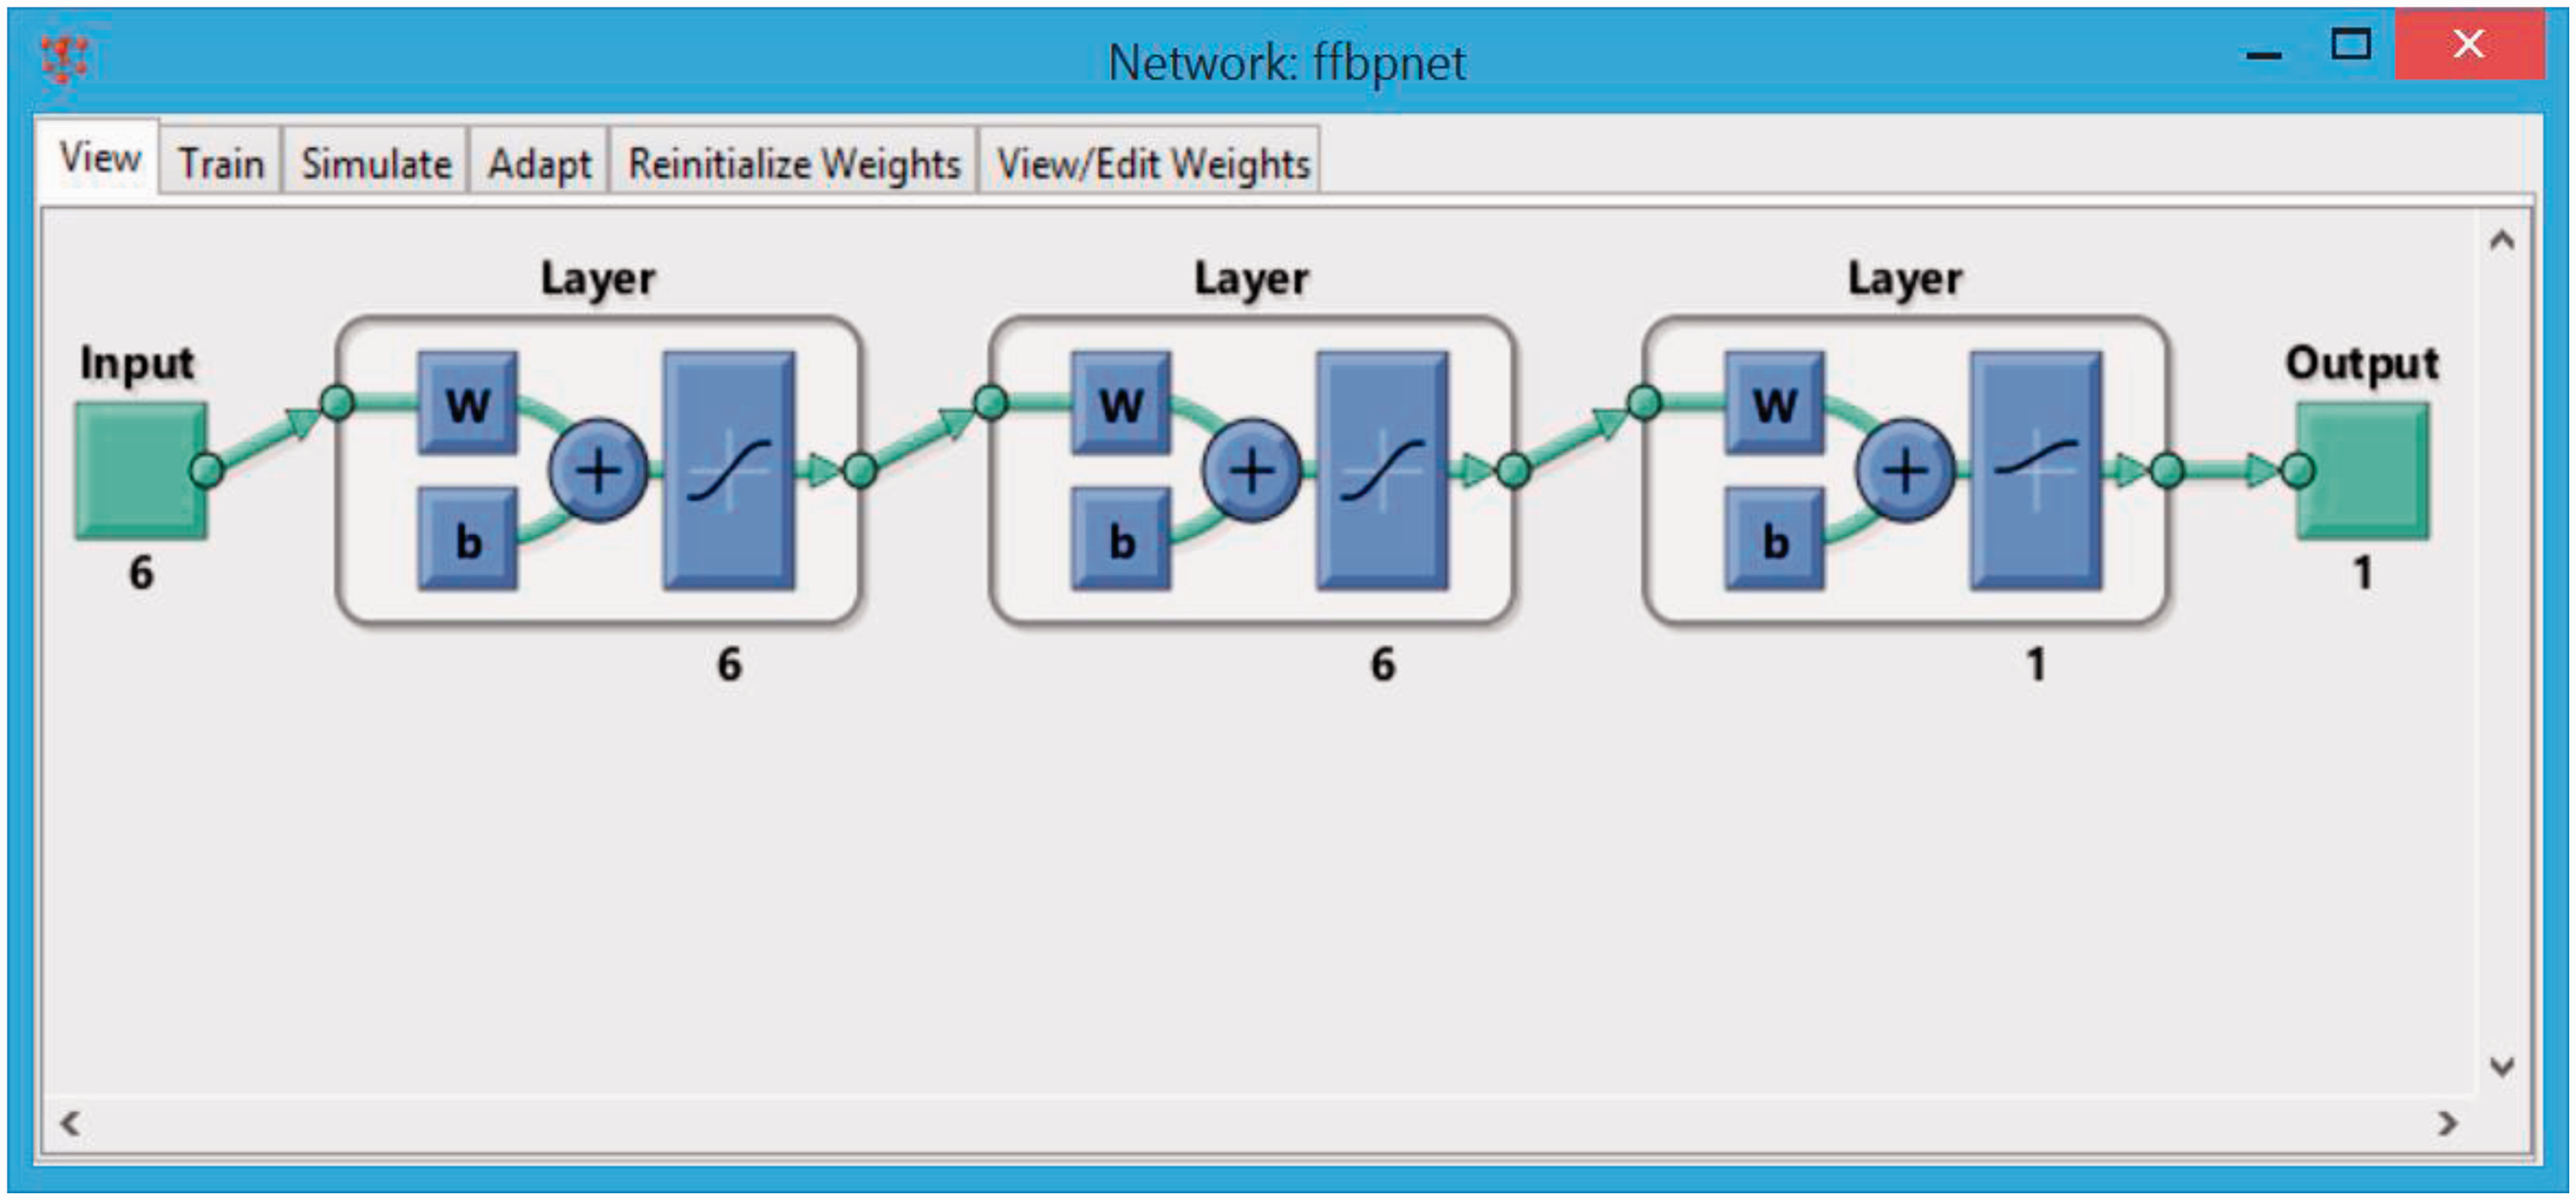
Neural networks are based on biological nervous system composed of neurons where information is processed to learn from the given data. It can be used in several areas of engineering applications and eliminates the limitations of the classical approaches by extracting the desired information using the input data. The advantage of the usage of neural networks for prediction is that it is able to learn from given set of data and after its learning is finished, it is able to catch the hidden and strong non-linear dependencies, even when there is significant noise in the training set.38–40 Among the different types of neural network, feedforward backpropagation multilayer perceptron neural network is used for the present work. It consists of an input layer of source node, two hidden layers of computation neurons and the output layer. The input layer nodes represent the normalized feature extracted from the measured acoustic signal. The number of input nodes is six, for the six psychoacoustic features used. Similarly 10 input nodes are used for the 10 statistical features of the acoustic signal. Output node is one in both cases. Numbers of nodes in two hidden layers are 6 and 10 respectively for both the networks. The target value of the output node can have binary value 1 and 0 representing good and faulty condition, respectively. In the ANN, activation function of tan-sigmoid (tanh) and logistic (log-sigmoid) was used in hidden and output layer, respectively. The ANN was created, trained and implemented using code written in MATLAB with training algorithm of Levenberg–Marquardt. Out of the 600-sample signals acquired, 40% were used for training, 30% for testing and 30% for validation. The ANN was trained iteratively to minimize the performance function of mean square error (MSE) between the network output and corresponding target values. 40 At each iteration, the gradient of performance function MSE was used to adjust the network weights and biases. In this work, an MSE of 10−5, a minimum gradient of 10−10 and maximum iteration number of 5000 were used. The training process was terminated when the error converged to specified condition within the specified iteration. The initial weights and biases of the network were generated automatically by the program.
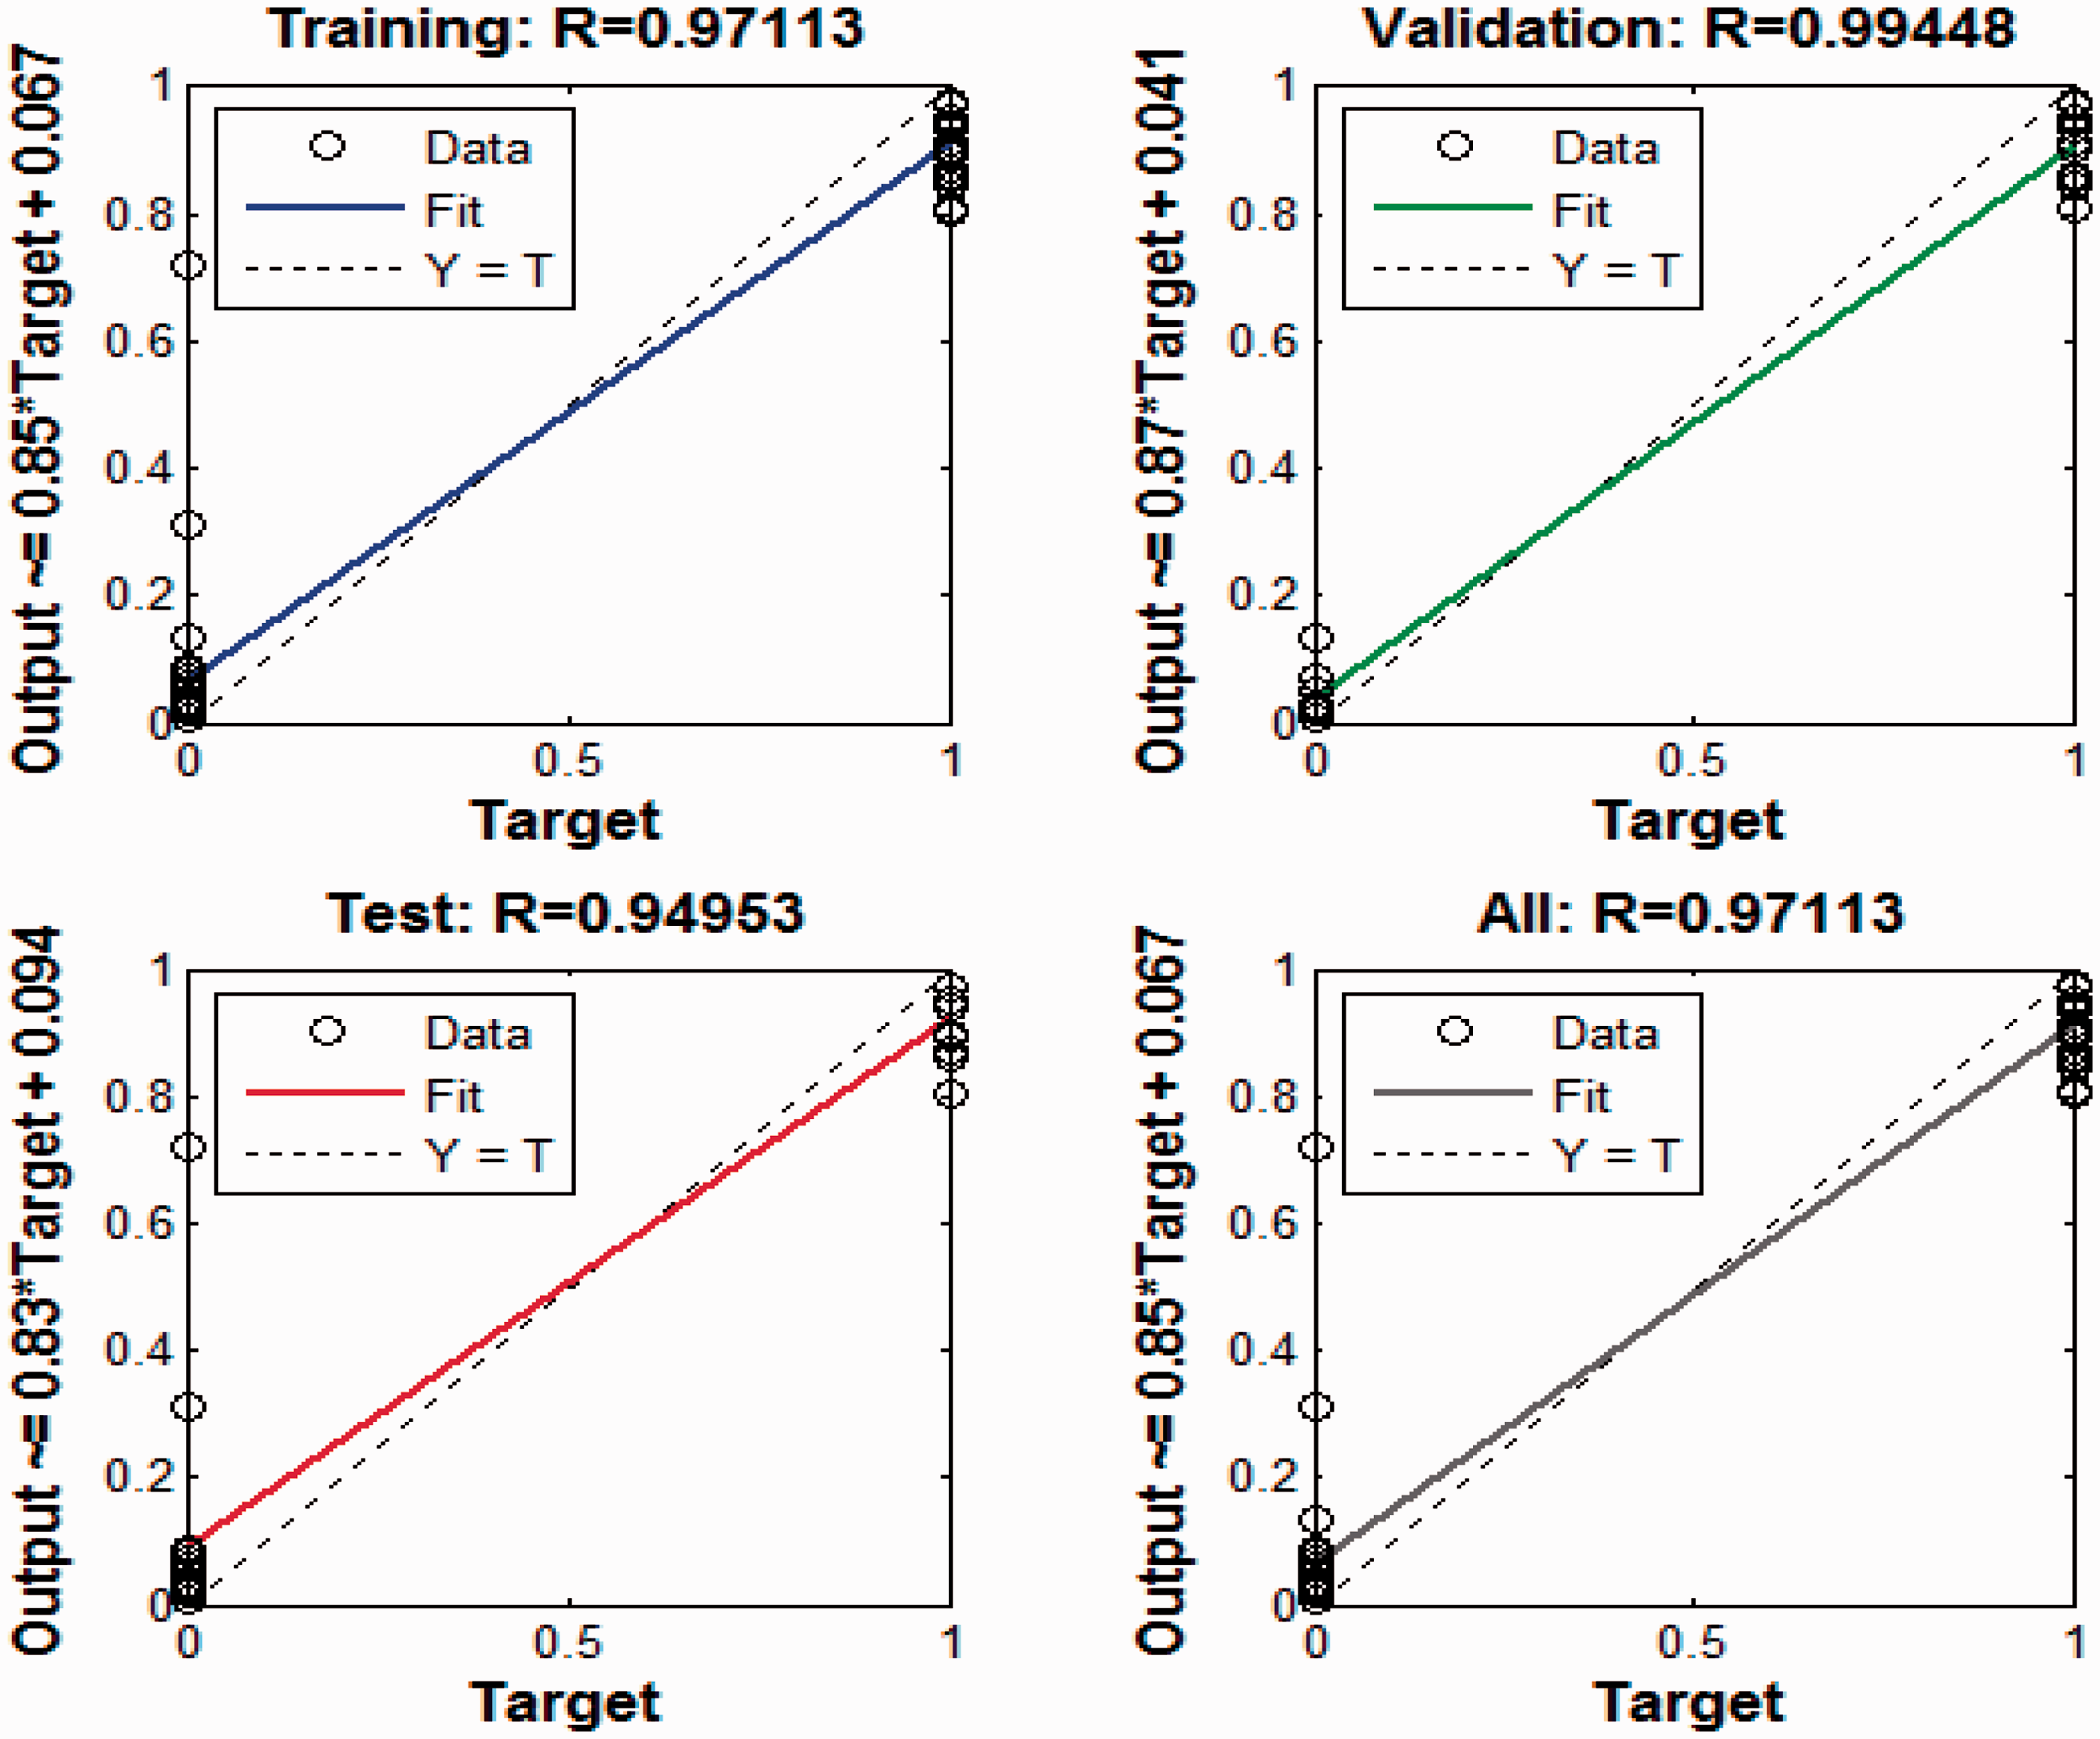
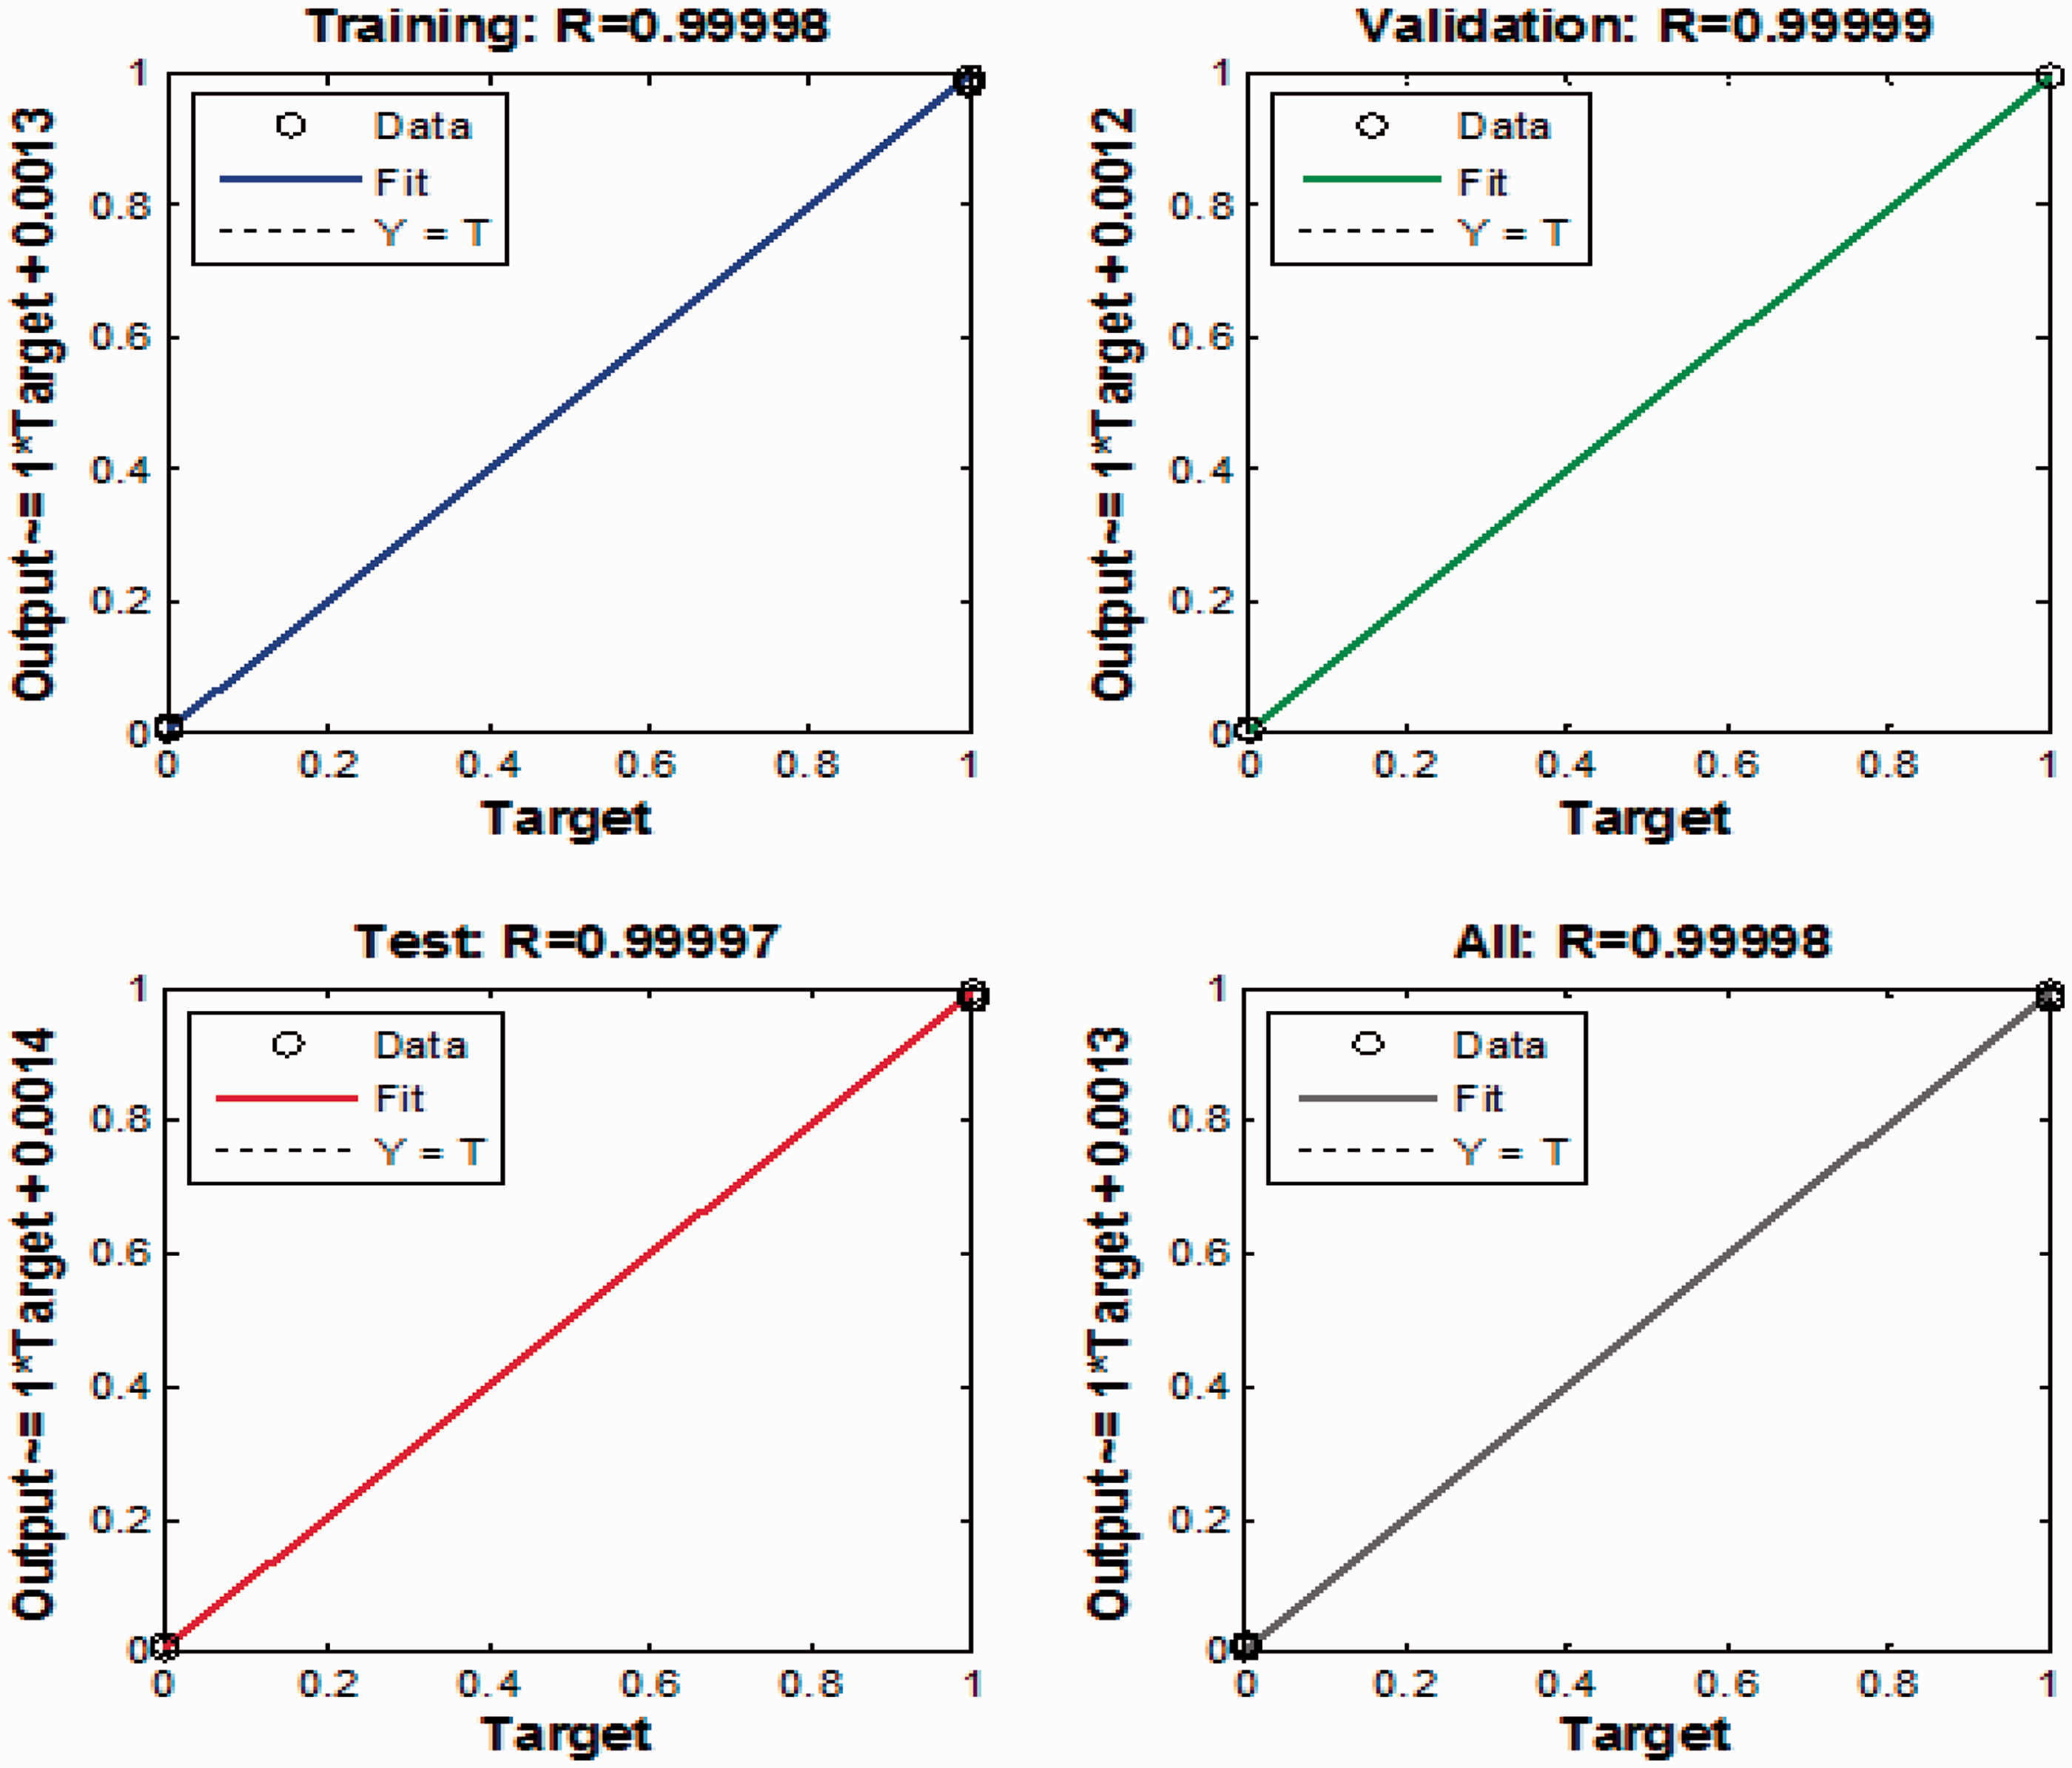
The sample values of input features for training network are given in the Tables 2 and 4. The network architecture selected is shown in Figures 8 and 9 for statistical and psychoacoustic features, respectively. Figures 10 and 11 show regression plots of the correlation between the network output and target values. The value of correlation coefficient R was 0.97 for statistical features and 0.99 for training with psychoacoustic features. The value of correlation coefficient greater than 0.9 indicates a good fit of the data and perfect training.
Architecture of ANN for statistical features of acoustic signal. Architecture of ANN for psychoacoustic features. Regression plot for statistical features of acoustic signal. Regression plot for psychoacoustic features.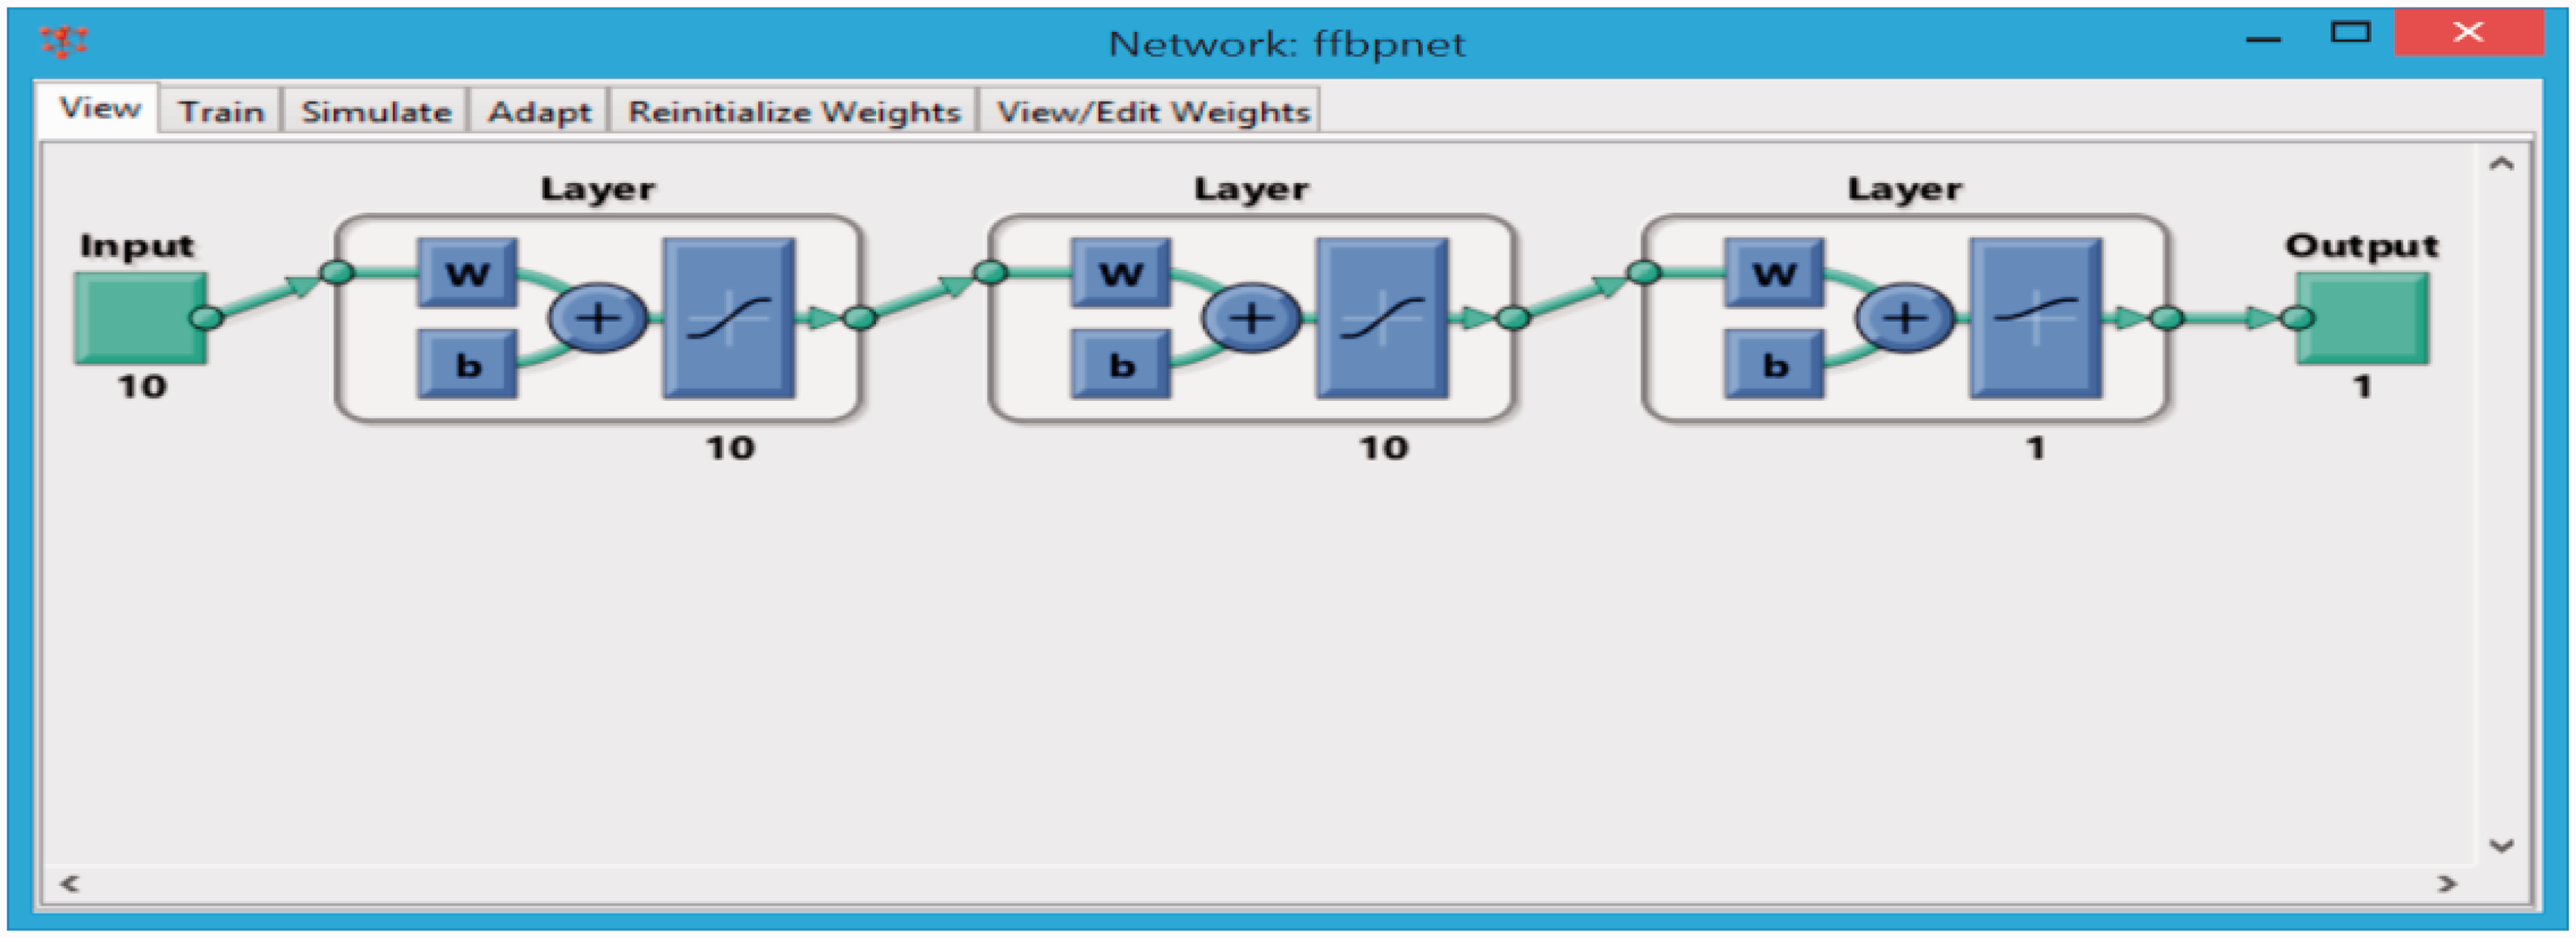
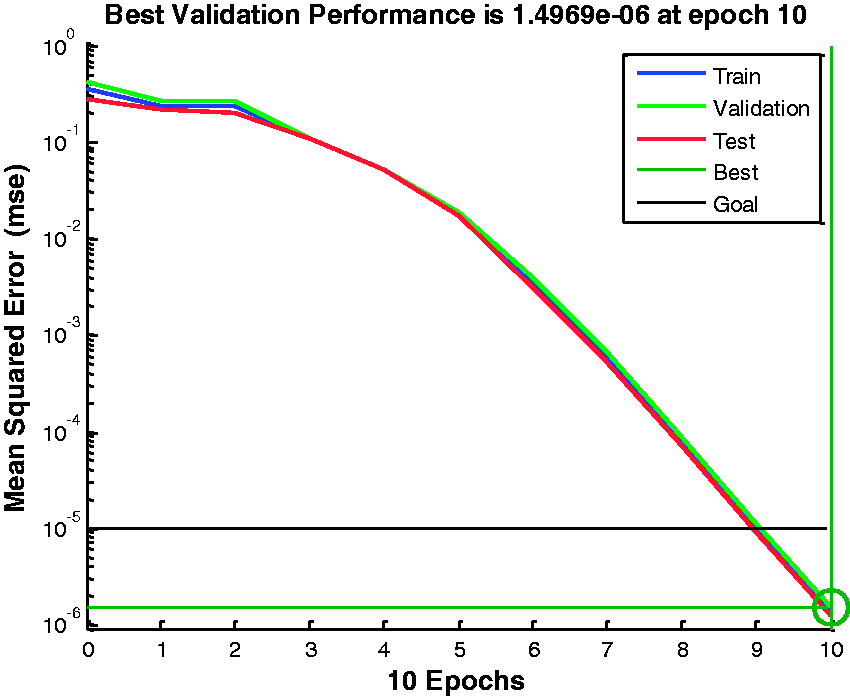
Figures 12 and 13 show the performance plot for the ANN. The validation and test curves are very similar. The curves do not indicate any problems with the training and there is no possibility of overfitting of data. Performance plots and values of correlation coefficients indicate satisfactory training performance for the architecture selected and give good generalization.
40
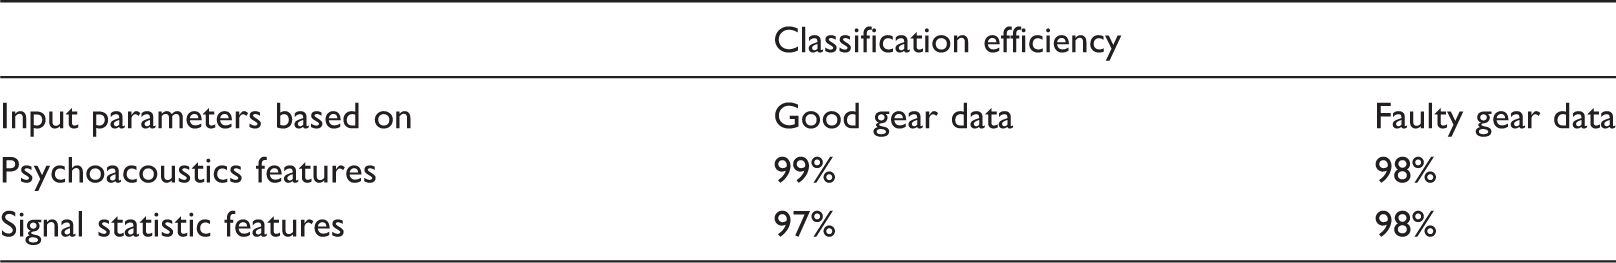
The trained ANN was tested for ascertaining the classification efficiency. It was found that sound pressure signal statistical and psychoacoustic features can classify data with high efficiency. The details of testing efficiency of the ANN used with good and faulty gears are shown in Table 5.
Performance plot for statistical features of acoustic signal. Performance plot for psychoacoustic features of acoustic signal. Classification accuracy of ANN.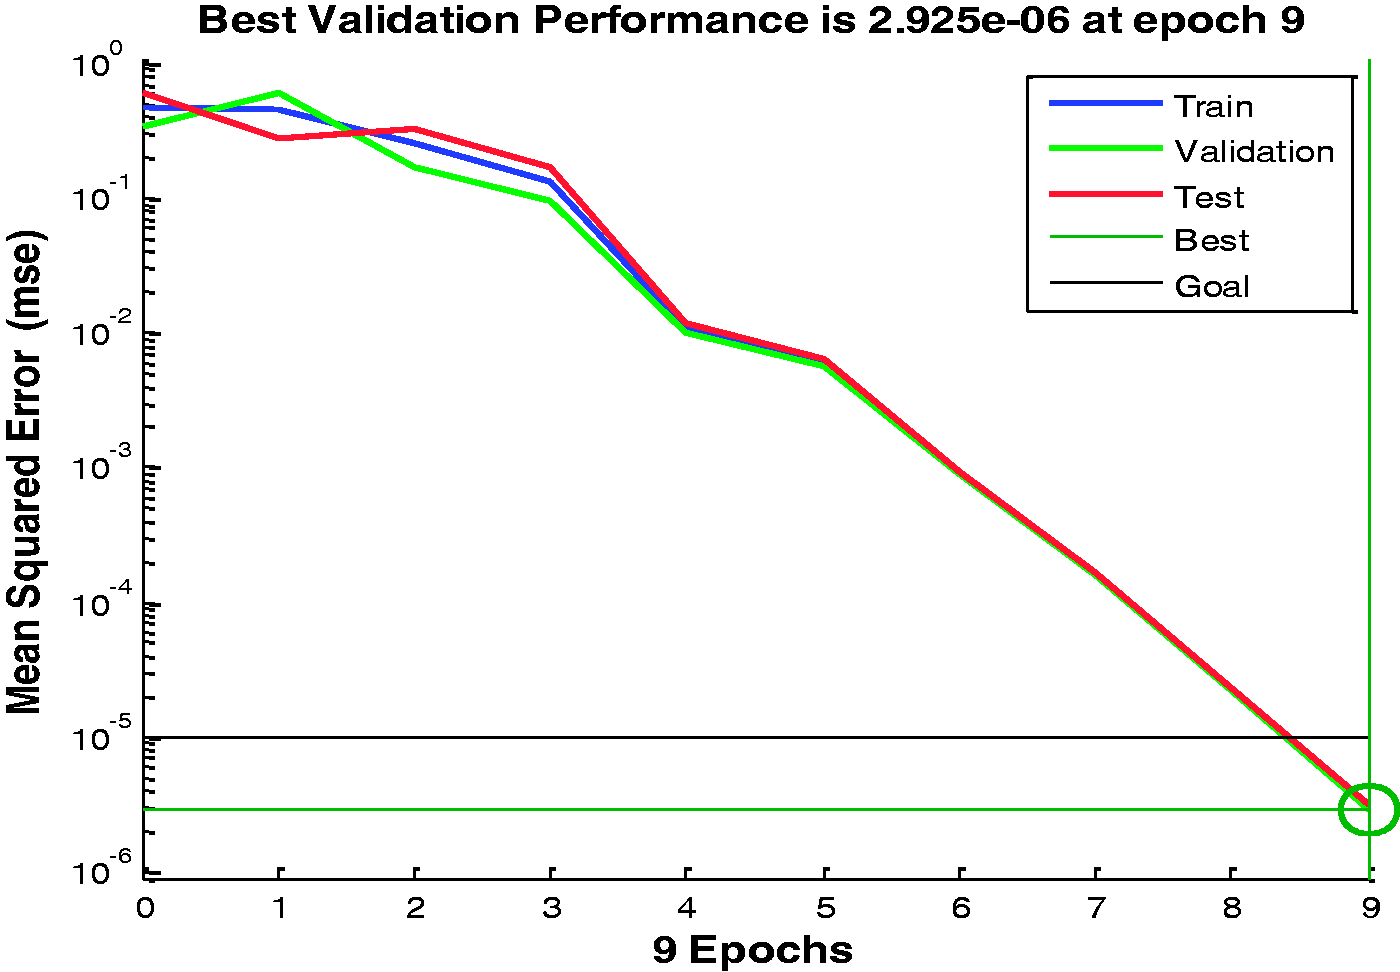
Comparison of results with the other condition monitoring techniques
While comparing the results of this paper with other published work and the conventional vibration based condition monitoring techniques, following observations are made. Shang et al. 25 had carried out similar work for fault identification during end of line inspection using vibration based technique. They have highlighted the limitations of the various vibration based condition monitoring techniques such as HHT, wavelet transform, and envelop spectrum for fault identification in newly manufactured gearbox. It was pointed out that the HHT is difficult to apply for real time application and would lead to inferior performance due to end effects propagated in signal, whereas wavelet basis function is not self-adaptive and envelope analysis is difficult to use at variable speed. To overcome these limitations they had proposed method of acquiring vibration signal using time synchronous averaging whose time domain and frequency domain features are input to ANN to diagnose fault for the case mentioned. Therefore, the method used by Shang et al. 25 may also be used in place of the psychoacoustic analysis method which is proposed in this paper. However, the maximum accuracy of fault identification reported by Shang et al. after using improved genetic algorithm was 94.61% and 91% with no algorithm for feature selection. Comparing these results with the work presented in this paper, it is seen that psychoacoustics analysis technique gives the fault classification with 99% accuracy and hence it could be a better option for identification of fault during end of line inspection of gearbox.
An attempt is also made to apply conventional spectrum analysis for the diagnosis of crack at gear tooth in the gearbox used in this work. Figure 14 compares the spectrum for healthy, i.e. good gear and faulty gear with crack at root. It is observed that the spectrum of faulty gear shows increase in amplitude at the gear mesh frequency and its harmonics indicating presence of fault. However, use of this type of conventional method needs expert to analyse the fault and dependence on skilled person still persists. The work presented in this paper was taken up to remove dependence on any expert and hence use of conventional methods of vibration monitoring for fault diagnosis was not focused upon in this work.
Vibration spectrum of good and faulty gear.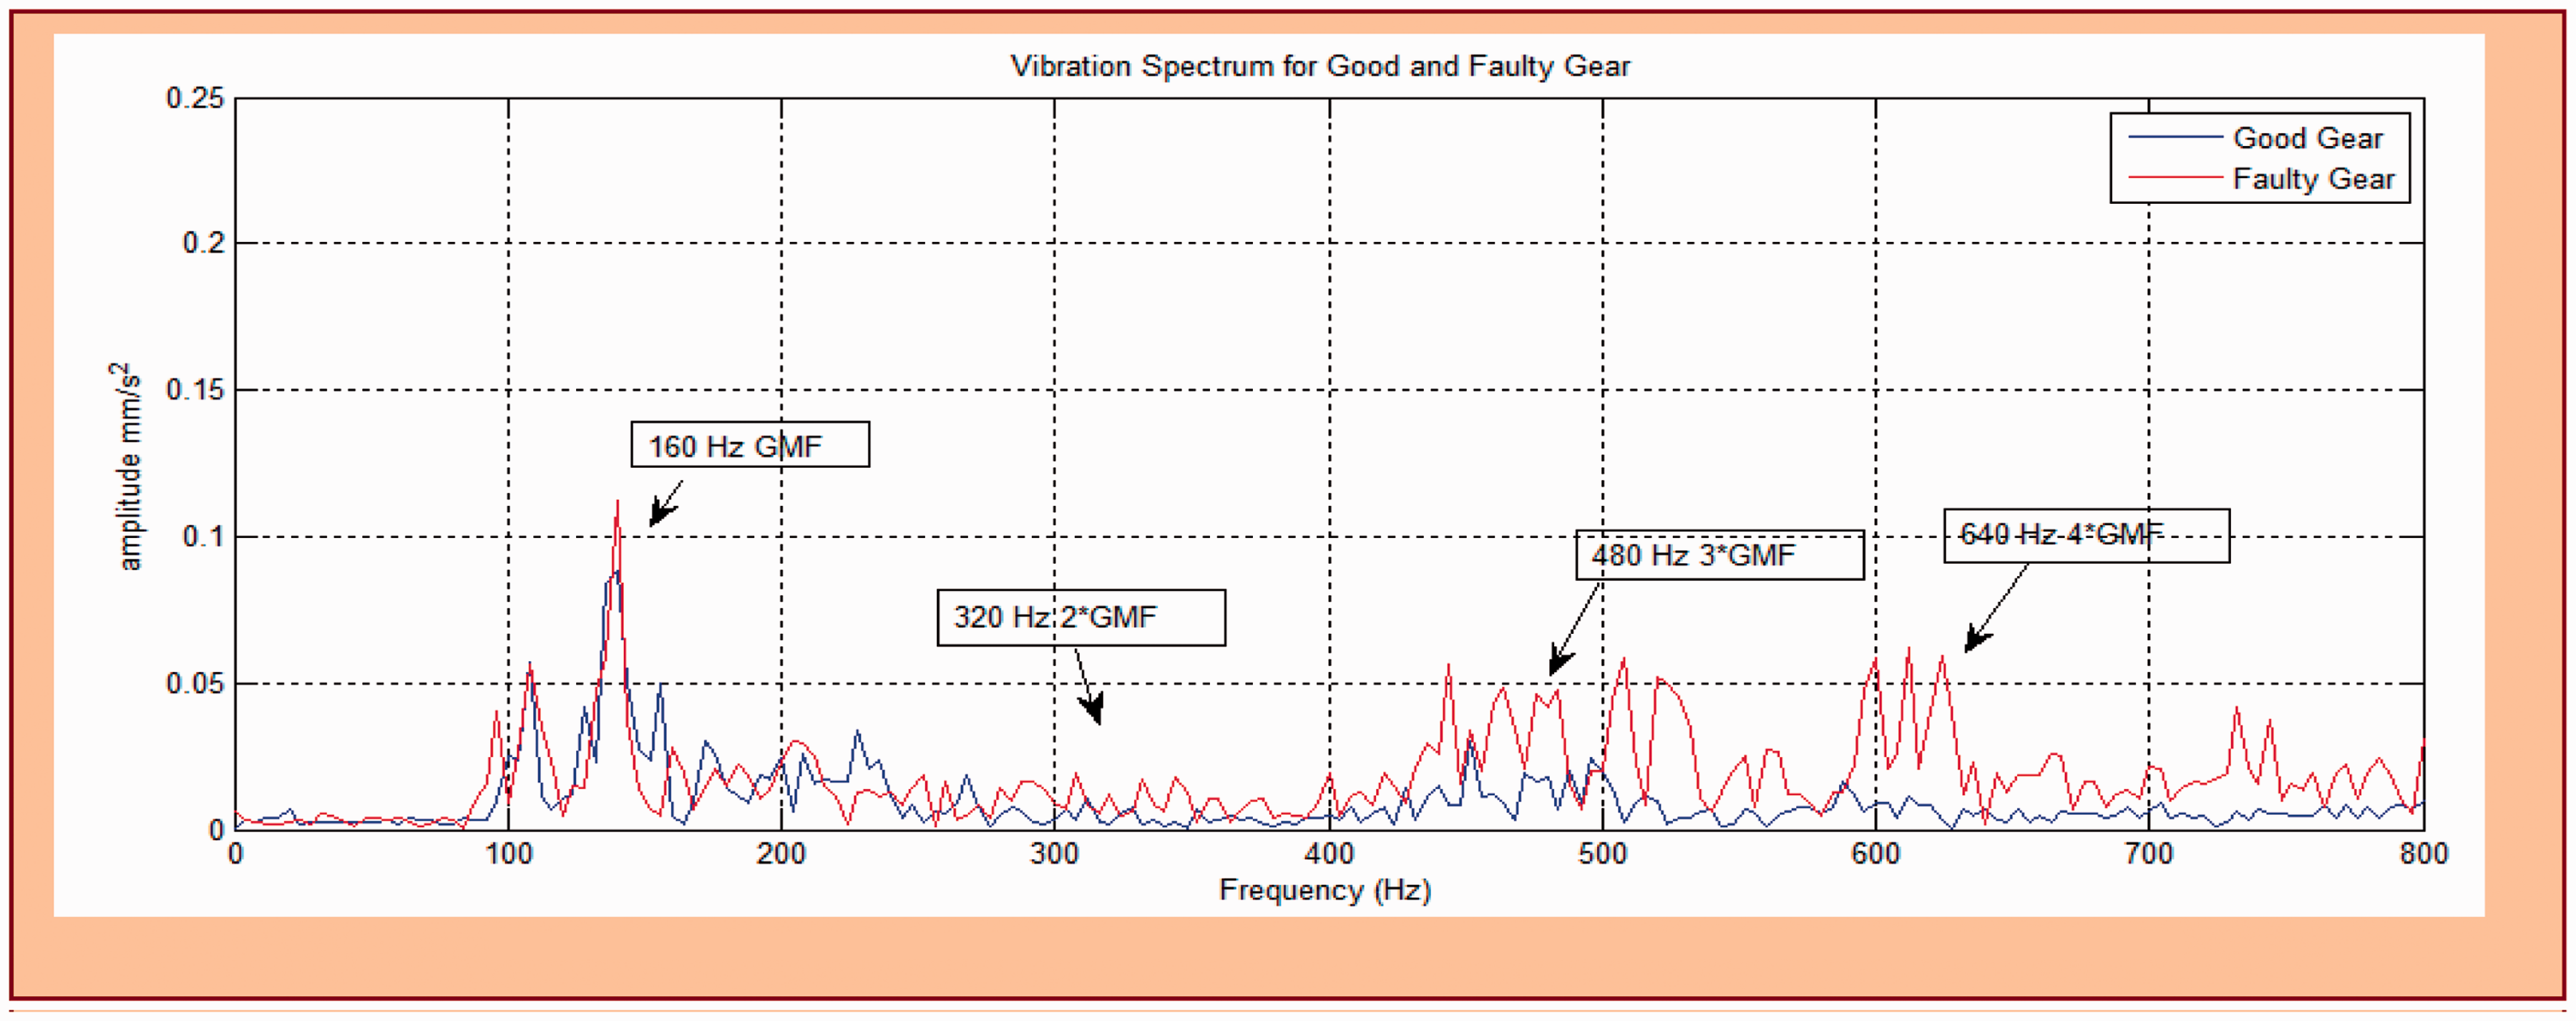
Conclusion
This paper has focused on specific situation of identifying assembly error in the gearbox at the end of assembly line during manufacturing. An objective method using ANN with psychoacoustic features as input has been proposed to substitute operator based inspection which is purely subjective. Ability of sound quality features based on psychoacoustics to classify fault has been ascertained using ANN as a classifier with efficiency of 98% in fault detection and 99% for healthy condition. These results have been compared with the classification using signal statistical features of acoustic signal and efficiency of 98% has been observed for fault detection and 97% for healthy gear condition. As the classification efficiency by psychoacoustic features has been found to be better than statistical features, it can be concluded that the proposed method can be used to accurately classify gear faults during end of line inspection.
Various gear faults manifest in different sounds, and this is judged by an operator at the end of line inspection. Statistical features operate on the acquired digitized signal without any concern of the spectral components involved in this complex signal, whereas psychoacoustic features can capture the deviations in sound emitted during operation of the gearbox. In these features sharpness characterizes steady state features, while roughness, fluctuation strength and tonality characterize dynamic and temporal features. Loudness characterizes both amplitude and frequency content of the acoustic signal. Therefore, they perform better than statistical features of acoustic signal in the specific situation considered.
Thus, it can be concluded that psychoacoustic indices can be used along with ANN as a substitute for human hearing ability and expertise for identifying the correctness of gearbox assembly during end of line inspection in the manufacturing environment.
Footnotes
Acknowledgement
Authors acknowledge Dr. Anand Parey, Associate Professor, Department of Mechanical Engineering, IIT, Indore, for providing Gear fault simulator to perform experiments.
Declaration of conflicting interests
The author(s) declared no potential conflicts of interest with respect to the research, authorship, and/or publication of this article.
Funding
The author(s) received no financial support for the research, authorship, and/or publication of this article.