
Abstract
India persistently faces issues of hunger and malnutrition. Government measures primarily focus on improving food availability within households. However, dietary patterns are not constant. They fluctuate not only by cultivation seasons but also by workdays and non-workdays. The influence of the day of the week on nutrition has received limited scholarly attention. This article addresses this gap by providing an in-depth analysis of individuals’ nutrient intake in rural settings in Tamil Nadu. The study is based on a unique household survey data, covering 981 households across 33 villages and taking account of socio-economic and demographic characteristics of the population, including gender, caste and household economic activities. In contrast to studies conducted in Western countries, the findings show that nutrient deficiencies are lower and dietary quality is higher in the study area during non-workdays compared to workdays. This effect is more pronounced for women, especially in MBC and SC households, while differences based on livelihood and age are less notable.
Introduction
Dietary patterns fluctuate over time due to various factors such as work schedules, recreational activities, habits and family commitments (McCarthy, 2014). Thus, intra-household allocations of time and labour play a significant role in nutrition (Johnston et al., 2015). Remarkably, the influence of the day of the week on nutrition has received scant scholarly attention (Dutch et al., 2021). Although some studies conducted in India have hinted at differences in dietary intake between weekdays and weekends (Ivaturi et al., 2024; Kuppuswamy et al., 2018; Sudha et al., 2006), they lack empirical evidence to support such claims. Understanding how the day of the week relates to nutrition is crucial for developing targeted policies in the fight against India’s complex issue of hunger and malnutrition. Therefore, there is a need for an investigation into the weekly dietary patterns in India.
This article, based on research conducted in Tamil Nadu, India, addresses this need by providing an in-depth analysis of individual nutritional intake on typical workdays and non-workdays. Our empirical data, collected among 981 households across 33 villages, reveal that nutrient deficiencies are lower, and dietary quality higher, during non-workdays compared to workdays. This effect is more pronounced for women, especially in Most Backward Classes (MBC) and Scheduled Caste (SC) households, while differences based on livelihood and age are less noticeable. Interestingly, these findings contradict similar studies conducted in Western countries, which suggest better and healthier diets on weekdays compared to weekends.
This article contributes to existing literature in several ways. First, to the best of our knowledge, it is the first empirical study focusing on nutritional differences between typical workdays and non-workdays in Indian households. This contribution is crucial for developing targeted policies to combat hunger and malnutrition in the country. Second, while previous food allocation studies have produced conflicting findings regarding the relationship between women’s labour and household nutrition, this article demonstrates that women’s time burden negatively impacts the nutritional status of all adult household members, but most of all their own. Last, our approach of examining workdays versus non-workdays, rather than weekdays versus weekends, is significant as not everyone is free from work or school on Saturdays and/or Sundays. Moreover, previous studies have used inconsistent definitions of weekends, emphasising the need for a clearer analysis of weekly patterns.
The following section discusses the existing literature on dietary patterns throughout the week. As none of this literature is based on studies conducted in India, we also explore general literature on nutrition and dietary patterns in India, identifying several factors that could influence weekly dietary patterns. Additionally, we review current literature on household resource allocations and social reproduction. The subsequent section elaborates on the methodology used in our research, followed by the presentation of results and the consequent policy implications, which is split into intra-household and inter-household nutritional differences. The final section of the article will present our conclusions.
Workday and Non-workday Dietary Variations: Implications for Food Security
Thoughts on food security have shifted over the last several decades from a focus on the global and national towards the household and individual (Maxwell, 1996) and from a focus on food availability to a focus that includes food accessibility issues (Sen, 1981, 1986) often linked to purchasing power (Pavan Kumar et al., 2024). Studies and reports on food security have considered various factors, including region (FAO, 2017), gender (Bhandari, 2017), income levels (Chand & Jumrani, 2013) and community (Chinnakali et al., 2014), but few studies have investigated how the day of the week affects food security.
Nonetheless, there are good reasons for food security variation by day of the week. First, work pressures can impact food consumption. For instance, an early start to work or pressure to finish house or farm work before a certain time can lead to skipping meals or eating quick, unhealthy meals. Second, the physical character of rural work means that differences in dietary needs between workday and non-workday are considerable. Third, weekly wage payments could mean limited availability of money to spend on food towards the end of the week. Fourth, meals and family gatherings are important in many societies, which may determine variation in the quality, quantity and diversity of food consumed when alone and when with family.
Dietary differences between weekdays and weekends have been studied in a small number of countries, mainly in Europe and North America (Dutch et al., 2021; Kant & Graubard, 2025; Nordman et al., 2020). These studies found that energy intake is higher on weekends with lower dietary quality compared to weekdays. This is largely attributed to weekends being typically associated with social events, less structured, increased access to food and more meals taken outside of the home (Dutch et al., 2021). Additionally, the increased energy intake during weekends is accompanied by a decrease in physical activity, thus worsening the effects of poor dietary quality and overconsumption (McCarthy, 2014).
India is notably missing from this list of existing studies on weekly dietary patterns. There are several reasons why the Indian case might be different to the countries above. First, access to processed foods in developing countries like India differs significantly from Western countries (Sujatha et al., 2000). In India, particularly in rural India, most meals are prepared from scratch at home rather than relying on eating out or opting for convenient pre-prepared foods. Second, according to Venkaiah et al. (2011), approximately 30% of India’s rural adult population suffers from chronic energy deficiency. For rural women, this figure rises to 36% and even up to 56% for tribal women (Rao et al., 2010). These findings sharply contrast with the overconsumption reported in the studies referred to above.
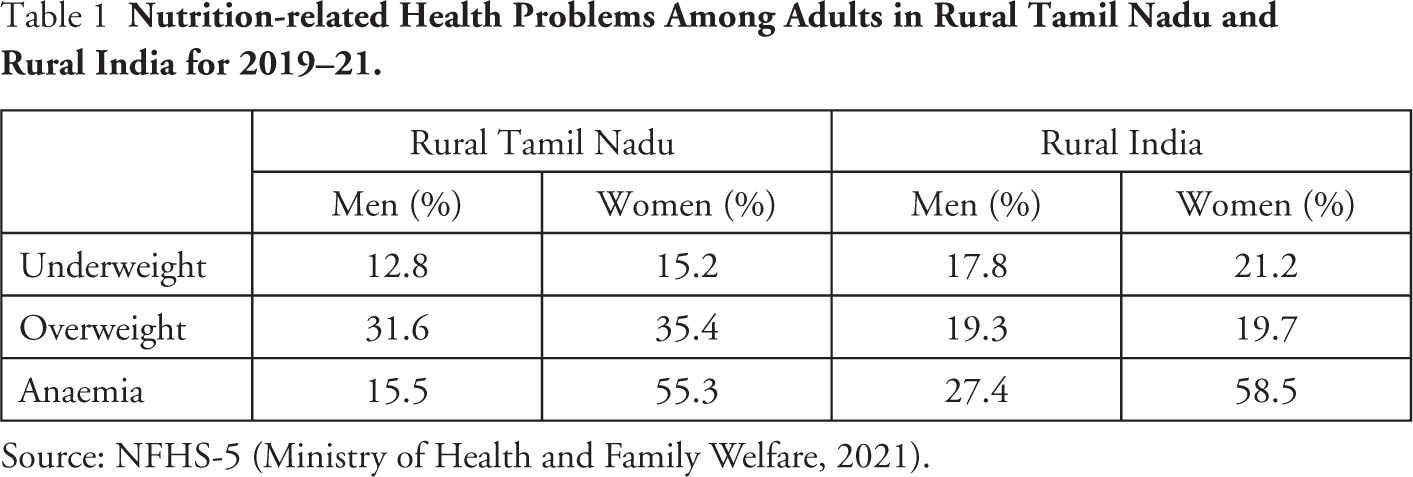
Research on nutrition in India reveals several factors that may influence dietary patterns over the course of a week. First, nutritional studies in India show important gender differences. For instance, several studies found that women are more likely to be malnourished compared to men (Pritchard et al., 2017; Vemireddy & Pingali, 2021) and that women tend to consume less nutrient-rich foods than other members of the household (Harris-Fry et al., 2017). However, not all studies suggest a lower nutritional status for women. For example, Rathi et al. (2017) found that urban adolescent girls in India had healthier diets compared to boys, and another study only found nutritional differences between men and women ‘at particular stages in the life cycle’ (Rao et al., 2017: 7). Furthermore, data from the Government of India’s National Family Health Survey-5 from 2019 to 2021, presented in Table 1, indicate that overweight is a more prevalent health problem in rural Tamil Nadu than underweight, while also surpassing the averages in rural India. Data from the same source also show the high prevalence of anaemia, particularly among women (also presented in Table 1).
Nutrition-related Health Problems Among Adults in Rural Tamil Nadu and Rural India for 2019–21.
Second, nutrition is closely linked to women’s labour time, particularly in relation to the seasonality of agriculture. For example, Vemireddy and Pingali (2021) observed that women’s increased involvement in agriculture during peak seasons resulted in time constraints for preparing healthy, nutrient-rich meals. This can be attributed to the fact that women spend substantial time on household labour, which men do not, on top of their agricultural labour (Rao & Raju, 2019; Vemireddy & Pingali, 2021). This so-called double burden often forces women to make a trade-off between agricultural labour and care work (Rao & Raju, 2019), resulting in reduced household dietary diversity (Chaturvedi et al., 2024). However, this relationship is complex, as Harris-Fry et al. (2017) refer to several studies with conflicting conclusions regarding the connection between seasonal labour and food allocations, and Raghunathan et al. (2021) point out that nutritious diets are unaffordable on rural wages, which could suggest that balanced diets are even more challenging to achieve during low seasons.
Third, nutrition relates to landownership and cropping patterns. Vemireddy and Pingali (2021) argue that larger landholdings and the cultivation of cash crops, rather than food crops, are associated with higher household incomes, leading to a reduced risk of nutrient deficiency. On the other hand, Babu et al. (1993) observed that subsistence farmers were more resilient to crop failures compared to commercial crop farmers. Additionally, agricultural wage labourers tend to have the lowest calorie and protein intakes (Babu et al., 1993; Pritchard et al., 2017) and the highest gender disparity in nutrition (Babu et al., 1993). Interestingly, Bhattacharya (2025) found that wealthier households are more likely to be malnourished, as women’s empowerment in these households was particularly low, which directly impacted the household’s nutritional status.
Finally, nutritional status is influenced by social indicators such as caste, ethnicity and religion. Rao et al. (2017) studied National Nutrition Monitoring Bureau data to reveal significant differences in nutritional status linked to these factors. Several studies identified Scheduled Tribe (ST) and Scheduled Caste (SC) households as particularly vulnerable to undernutrition (Gillespie et al., 2012; Mitra, 2014; Retheesh et al., 2024). Thus, gender, women’s labour time, landownership and cropping patterns, and social variables all play crucial roles in shaping nutrient intake, but these factors do not explain how resources such as food, time and labour are allocated within households.
Theories on intra-household resource allocation developed in reaction to the view that households act as a single entity (Haddad et al., 1997; Thomas, 1990). Collective intra-household allocation models recognise decision-making processes and individualistic behaviours, which depend on a wide variety of observable and non-observable factors (Strauss et al., 2000). The allocation of labour is a complex factor, as a decision to engage in various labour activities, whether paid, unpaid or household labour, can be a matter of choice or necessity (Doss, 2013). However, it is important to note that intra-household differences in nutrition are not necessarily the outcome of food allocation discrimination. In fact, Strauss et al. (2000) argue that gendered variations in nutrient intake primarily stem from differences in individual needs.
Intra-household allocations of food, labour and income closely link with the theory of social reproduction. Social reproduction refers to those activities, responsibilities, behaviours and social relations necessary to maintain and reproduce life, daily as well as intergenerationally and on an individual as well as social scale (Laslett & Brenner, 1989; Winders & Smith, 2019). It is influenced by time-use pattens and work pressures (Floro, 1995), which is why social reproduction theory often considers patriarchy and capitalism as interconnected systems that influence and maintain labour allocations (Mezzadri, 2019). Consequently, production and social reproduction are similarly overlapping spheres as the gendered division of labour not only places responsibility for reproductive labour with women so that men can take up productive labour (Katz, 2001) but also requires women to allocate their time between these two sets of activities (Floro, 1995). As a result, women’s time and labour allocations have a considerable influence on the well-being of all household members and of society as a whole (Floro, 1995). Social reproduction thus perpetuates gender relations, roles and responsibilities that impact labour allocations, time allocations and consequently food availability and allocations.
Methodology
The food intake data presented in this article were collected by trained interviewers using a food intake recollection method. Trained interviewers went door to door with a structured questionnaire and collected data about:
Demographic characteristics of each household member; Socio-economic data about the households, including economic activities; Food frequency data for the households; Food recall information for each household member.
Food frequency data are based on a list of food items, customised for the local cuisine. Food recall information provided a measure of food consumption by type and quantity of food—including drinks—consumed by each household member for breakfast, lunch and dinner on a typical workday and on a typical non-workday. Serving sizes were measured in cups, and the interviewers carried sample cups to provide visual references.
This study was part of a larger research project investigating links between access to land and food security; therefore, this study only focussed on rural households. The selection process for participants relied on a two-stage sampling method. First, purposive sampling was used for selecting the villages based on specific criteria: the area should be classified rural, represent multiple caste groups, be primarily agricultural with substantial presence of cultivators and of agricultural wage labourers, and include a variety of land types such as arable lands, forests and pastures. The initial selection was made using the 2011 population census, which was then further refined by consulting local experts—the village administration officer and the Panchayat secretary of the selected areas—to select the most suitable hamlets for this study. Second, convenience sampling was used for selecting the participating households, as interviewers went door to door in the selected villages and anyone at home and willing to participate was included in this study. Each village was visited two or three times with the goal of collecting data from each household. Food consumption data were collected across 33 villages in Salem district, Tamil Nadu, in two distinct time periods: July and August 2018 (rainy, growing season) and October and November 2018 (pre-harvest season). Names of villages and respondents as presented in the article are pseudonyms to protect identities.
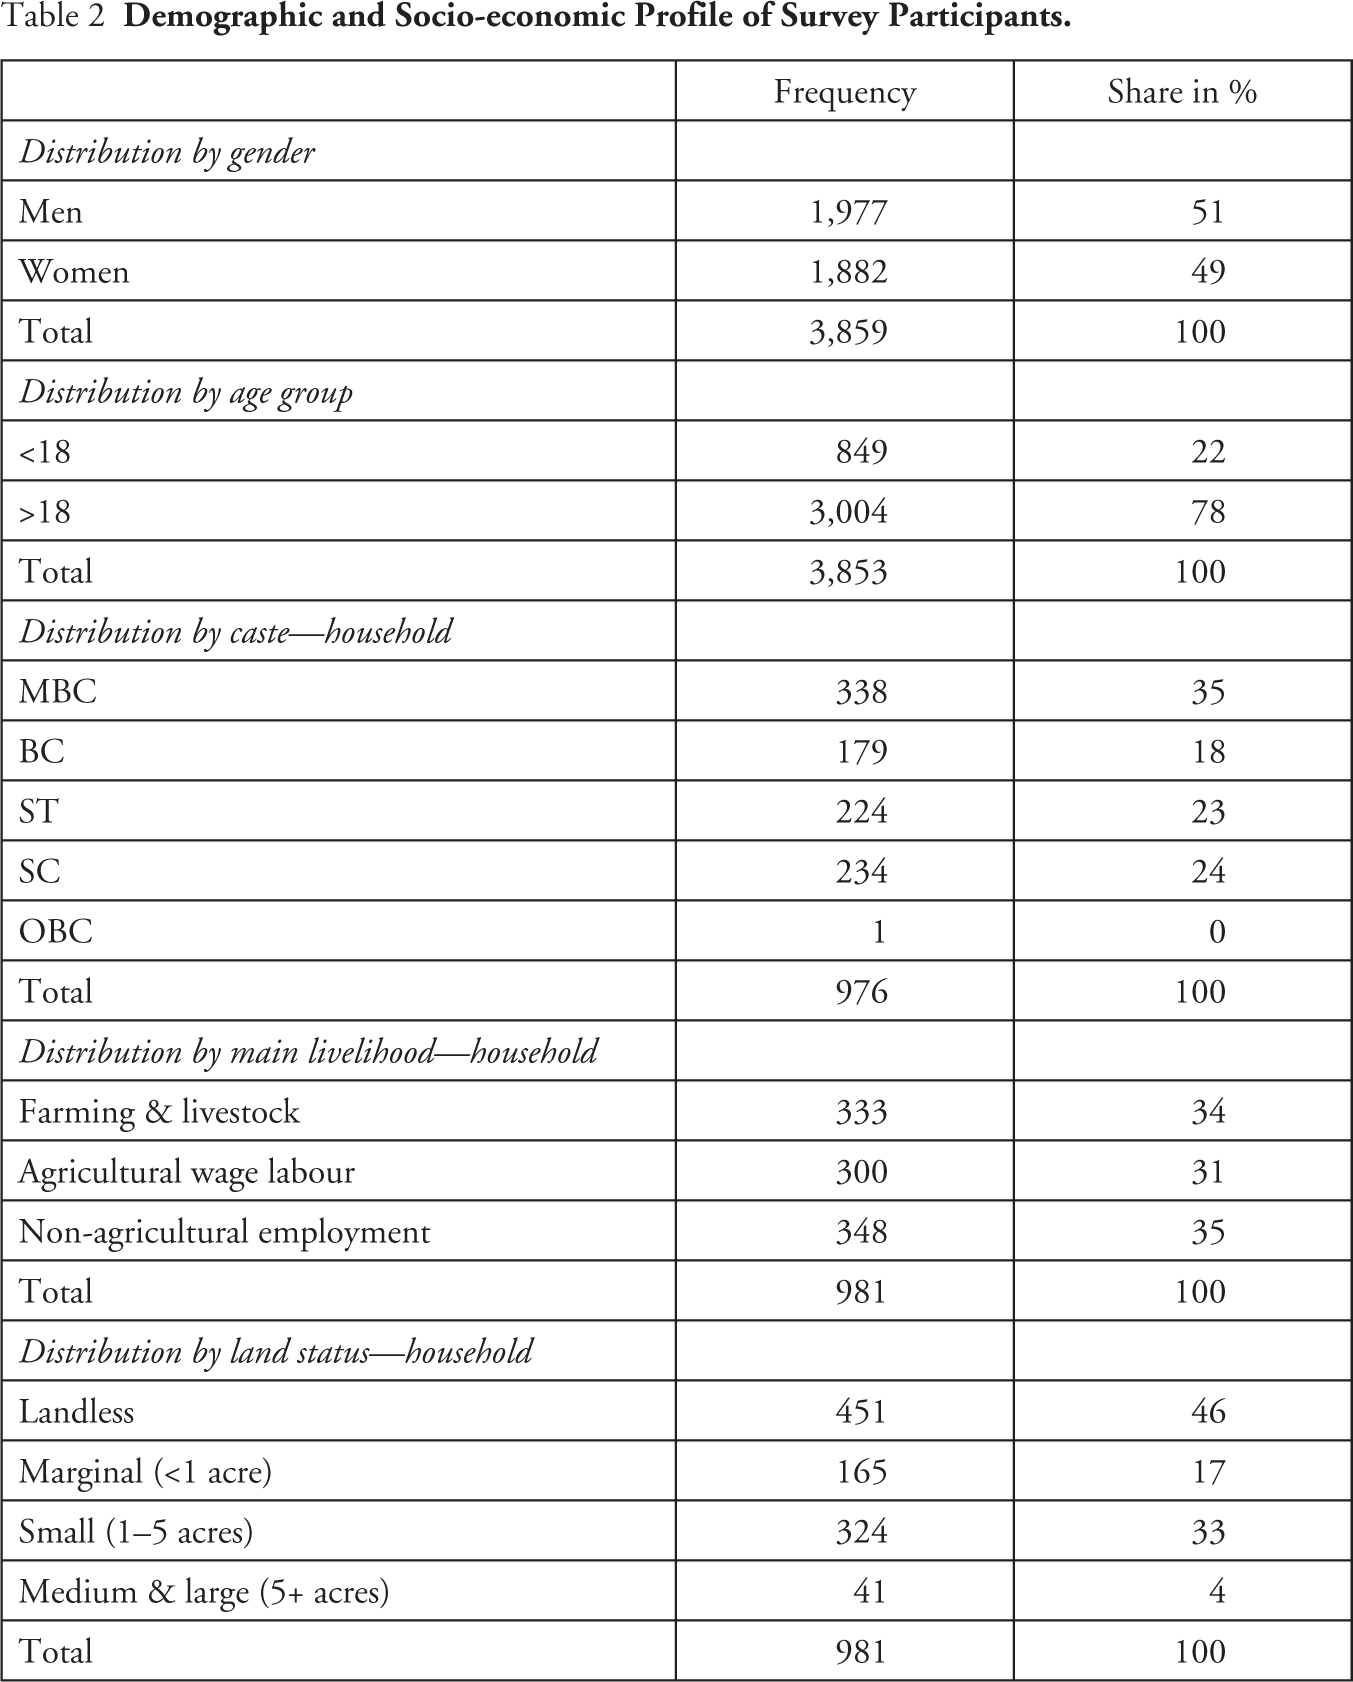
Table 2 shows the demographic and socio-economic attributes of all households and household members participating in this study. In total, consumption data were collected from 3,859 individuals across 981 households, including 3,004 adults and 849 children and adolescents, with six unknown/missing data. Of the individuals surveyed, 1,977 were men and 1,882 were women. Most households (35%) belonged to an MBC caste, followed by SC and ST castes (24% and 23%, respectively), and 18% of the households belonged to BC castes. Only one household in the entire study was OBC. The distribution of households amongst the different castes, and particularly the high percentage of ST households in this study compared to the average in Salem (3.4%), is the result of the convenience sampling method as households of the same community often live concentrated within villages.
Demographic and Socio-economic Profile of Survey Participants.
These consumption data were complemented by ethnographic data collected over a period of 25 weeks of fieldwork. The first visit took place between November 2018, just before harvest, with fields full of high rising sugarcane, tapioca and banana trees, and December 2018, when these crops were harvested. The second visit took place in the period between harvesting and planting, between July 2019 and September 2019, during which most fields were empty or only just sowed, depending on the crop, with limited work opportunities for agricultural wage labourers. Therefore, the data presented here show nutrition patterns during a period of limited agricultural work (July–September), a period of abundant agricultural work to maintain growing crops and prepare for harvest (October–November) and a period of abundant and heavy agricultural work during harvest (December).
Once all the data was collected, the nutritional information was calculated based on the dietary standards established by the National Institute of Nutrition, a division of the Indian Council of Medical Research (ICMR). The calculated nutrient data included energy intake, protein, calcium and iron. Subsequently, nutrient deficiencies were calculated based on the type of work, with non-workdays being considered as sedentary work, farming/agricultural wage labour as moderate work and non-agricultural labour as sedentary work. Non-agricultural labour mostly comprised occupations such as drivers, power loom operators, government employees and shop owners. Each work type category is associated with specific daily energy and nutrient requirements. For instance, on a non-workday (sedentary work), adult men require 2,320 kcal and adult women 1,900 kcal, and on a workday with moderate work, adult men require 2,730 kcal and adult women 2,230 kcal (ICMR, 2010). Daily energy requirements for children varied based on age and gender.
Ethical approval for this study was sought and obtained from the University of Hertfordshire Ethics Committee well before data collection started. The research assistants’ training included half a day on research ethics. The first week of survey data collection was under the careful guidance of the research team. All data were collected anonymously, and a member of the research team secured all collected data at the end of each day of data collection in a locked cabinet in a locked office. While in the field, particular attention was given to obtaining written informed consent from all interviewed households.
This method of dietary data collection has some limitations. Most importantly, the dietary information was self-reported and provided by one household member for all other household members. Studies have shown that energy intake is generally underreported in self-reported dietary intake (Subar et al., 2015). However, in our study we use the nutritional information to compare categories, such as workday or non-workday, gender, main source of livelihood and community, where all the categories would equally contain possible bias from self-reported dietary information. Therefore, the self-reported information and our findings regarding differences between workdays and non-workdays give valuable insight into eating patterns and types of food consumed on different days.
Another limitation is that all calculations are approximations, as the nutritional density of a specific food item can vary depending on factors such as the quality of a product, the amount of oil used in cooking, if households consume cow milk or buffalo milk, etc. Nevertheless, the data presented identify patterns in nutrition that show important priorities for food policy. However, some caution in interpreting the results is required as a non-workday for men looks very different to a non-workday for women. For example, we considered a non-workday as sedentary work, but women’s labour often continues on non-workdays, such as doing laundry, cleaning the house and collecting firewood. Men, on the other hand, more typically spend the day in a leisurely manner.
This data collection method also has several strengths. First, the workday and non-workday dietary data were taken from the same population sample. Second, the dietary intake calculation was based on nutrient information appropriate to the local cuisine by using the dietary standards established by the National Institute of Nutrition. Due to regional variety in cuisine patterns (Vecchio et al., 2014), particularly the centrality of animal-based products, the results of this study are not representative for the entire Indian population—but may be considered so for the rural Tamil population. Lastly, we collected data for typical workdays and non-workdays rather than weekdays and non-weekdays. While most studies on weekly food consumption patterns compare weekends with weekdays, this raises an important methodological issue, as not everyone has the same school or work schedules, meaning weekends may not always correspond to being off from work or school. This methodological issue is further exacerbated by inconsistencies in the definitions used for weekdays and weekends, making it difficult to compare similar studies (Dutch et al., 2021; McCarthy, 2014). Furthermore, in our research location, a six-day workweek is common, and many schools and colleges also have regular classes on Saturdays. Therefore, we compare consumption differences between workdays and non-workdays.
The analysis is based on a qualitative assessment of the relationship between nutrition and socio-economic variables such as activity, land, gender and caste. This study does not provide a causal assessment of these relationships. While causal inference is desired, there are significant methodological difficulties in its implementation in nutrition studies. These include difficulties associated with the need for large randomised controlled trials, viewed as the gold standard, complex confounding and measurement errors (Feng, 2023). Although the qualitative analysis used in this article does not provide a causal inference, it provides a more in-depth understanding of the lived experiences regarding nutritional inequalities in the study area as well as greater descriptive evaluation (e.g., characteristics and behaviour) of the key variables.
Nutritional Variation by Non-workday/Workday
In contrast to studies conducted in Western countries, overconsumption was not an issue in our study location. As Figure 1 shows, energy deficiency was substantially lower during non-workdays. While this is similar to the patterns in Western countries, higher protein intake during non-workdays is in contrast to the evidence in high-income economies (Haines et al., 2003). The estimates in Figure 1 also indicate high incidence of iron deficiency during workdays, linking the high occurrence of anaemia in rural Tamil Nadu to inadequate nutrition. Consumption is thus more calorie dense on non-workdays, but also more nutritious, although there remains a significant deficiency in calories and nutrients.
Nutrition Deficiency.
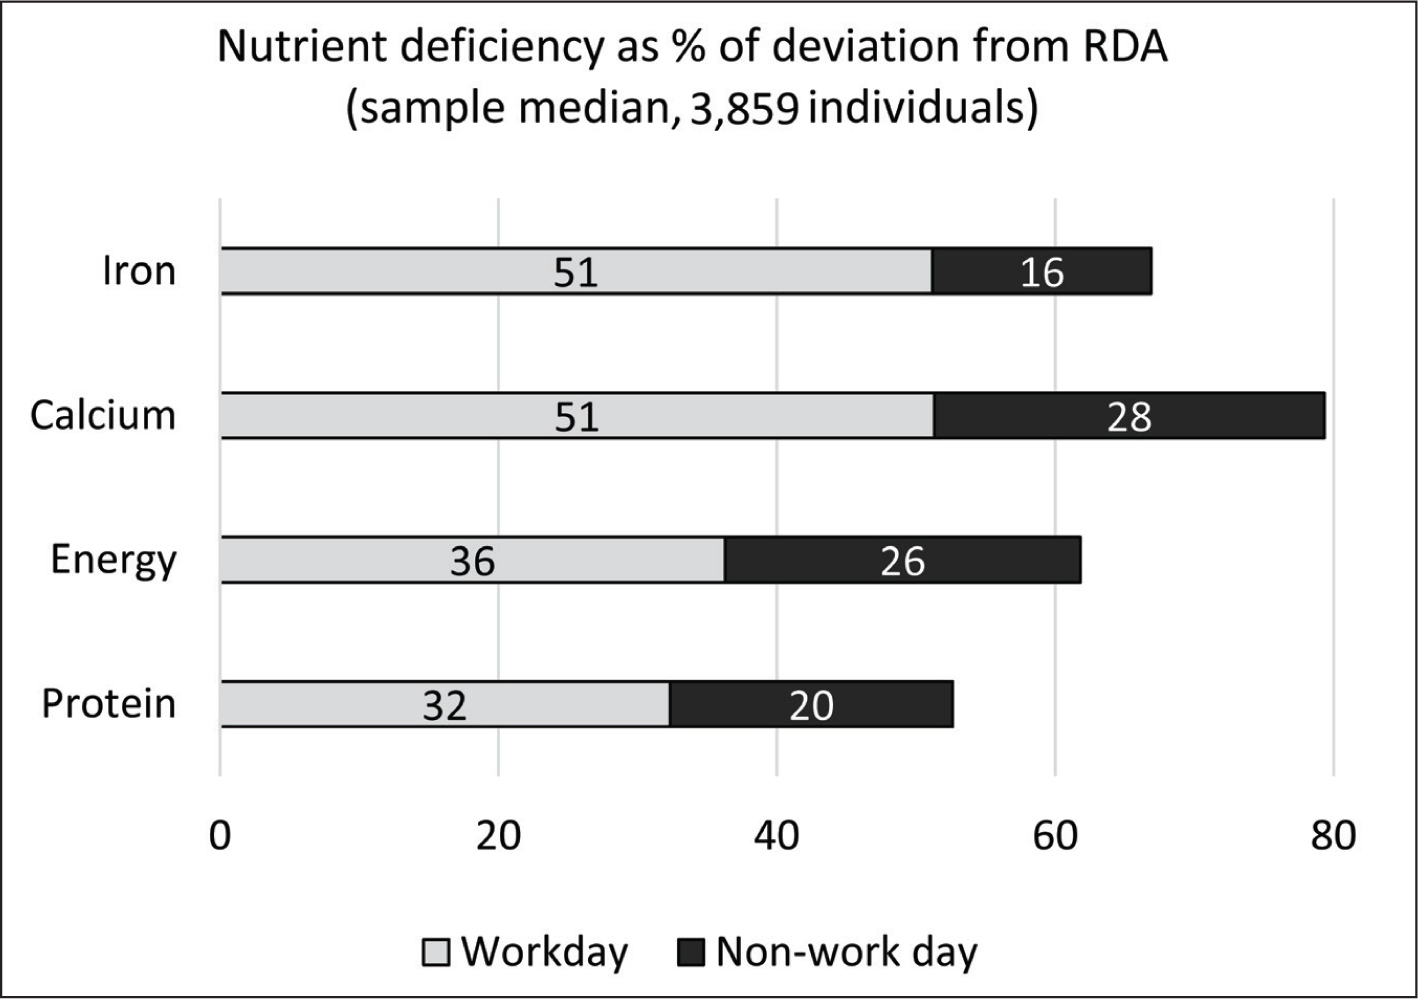
Workday and Non-workday Nutrition Deficiency as % Deviation from RDA (18+, W: 1,477; M: 1,532).
Intra-household Deficiencies: Gender
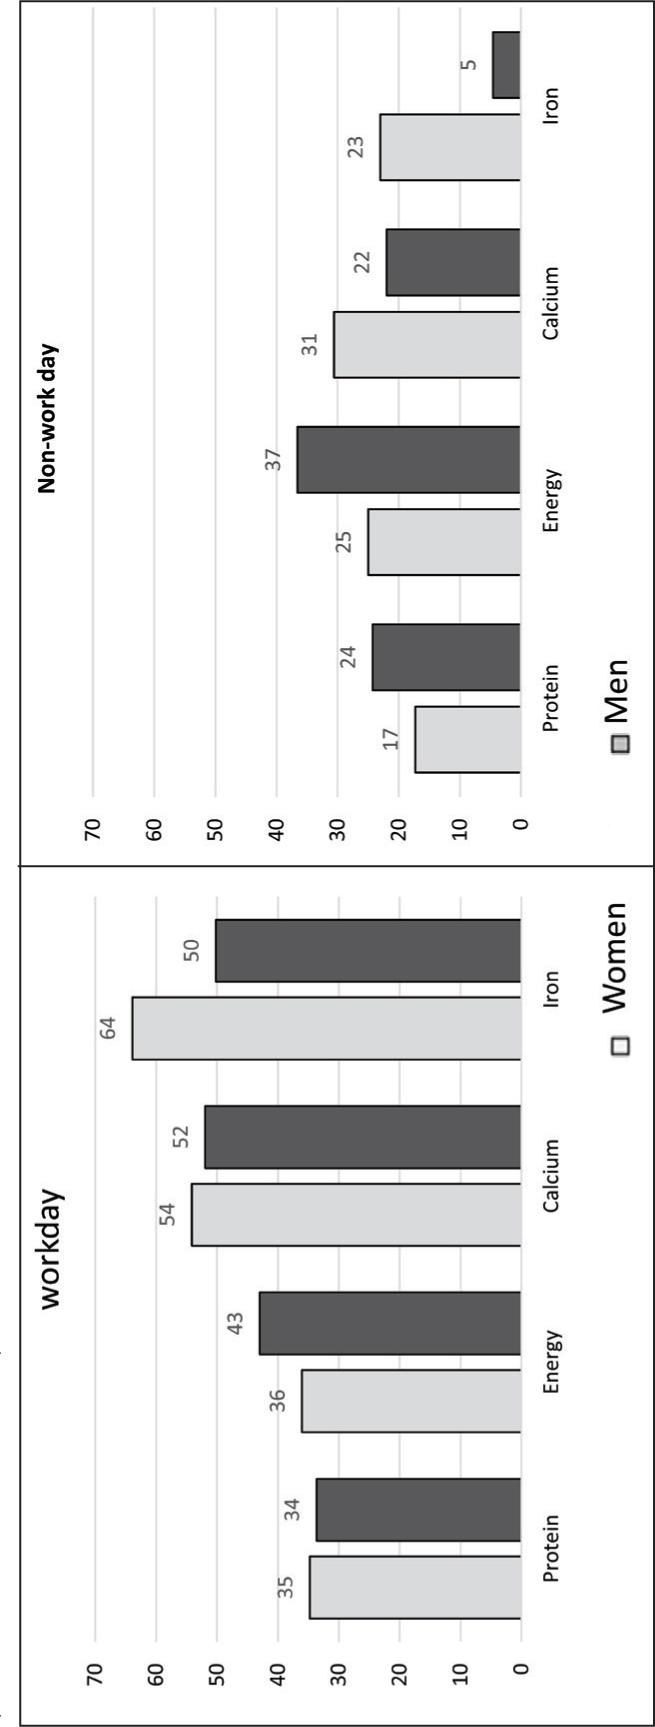
Previous studies found significant gender differences in nutrition (Pritchard et al., 2017; Vemireddy & Pingali, 2021). In this study, we did not find any gendered differences in children’s nutritional intake. Therefore, this section only presents findings for women and men above the age of 18. Figure 2 shows the deficiency in energy and nutrients for women and men during typical workdays. The most notable differences arise in their energy and iron intake, with men exhibiting a greater energy deficiency compared to women, whereas women have a significantly larger iron deficiency. When focussing on protein and calcium deficiencies, on the other hand, women have a slightly greater deficiency than men, but the difference is not very large.
Examining non-workdays, the results are quite different. On a typical non-workday, men have greater protein and energy deficiencies compared to women, but women still experience greater iron and calcium deficiencies. In fact, across all four categories, the disparities in deficiencies between women and men are larger on typical non-workdays compared to work days. Harris-Fry et al. (2017) write that evidence from South Asia suggests women receive lesser food allocation, especially of nutrient-rich food. Although our findings show a similar trend, it is noteworthy that women’s protein and energy deficiencies are similar to or less than those of men, on both work and non-workdays. Thus, while deficiencies overall are less prevalent on non-workdays compared to workdays, for men this effect is particularly seen in calcium and iron deficiencies and for women in protein, iron and energy deficiencies.
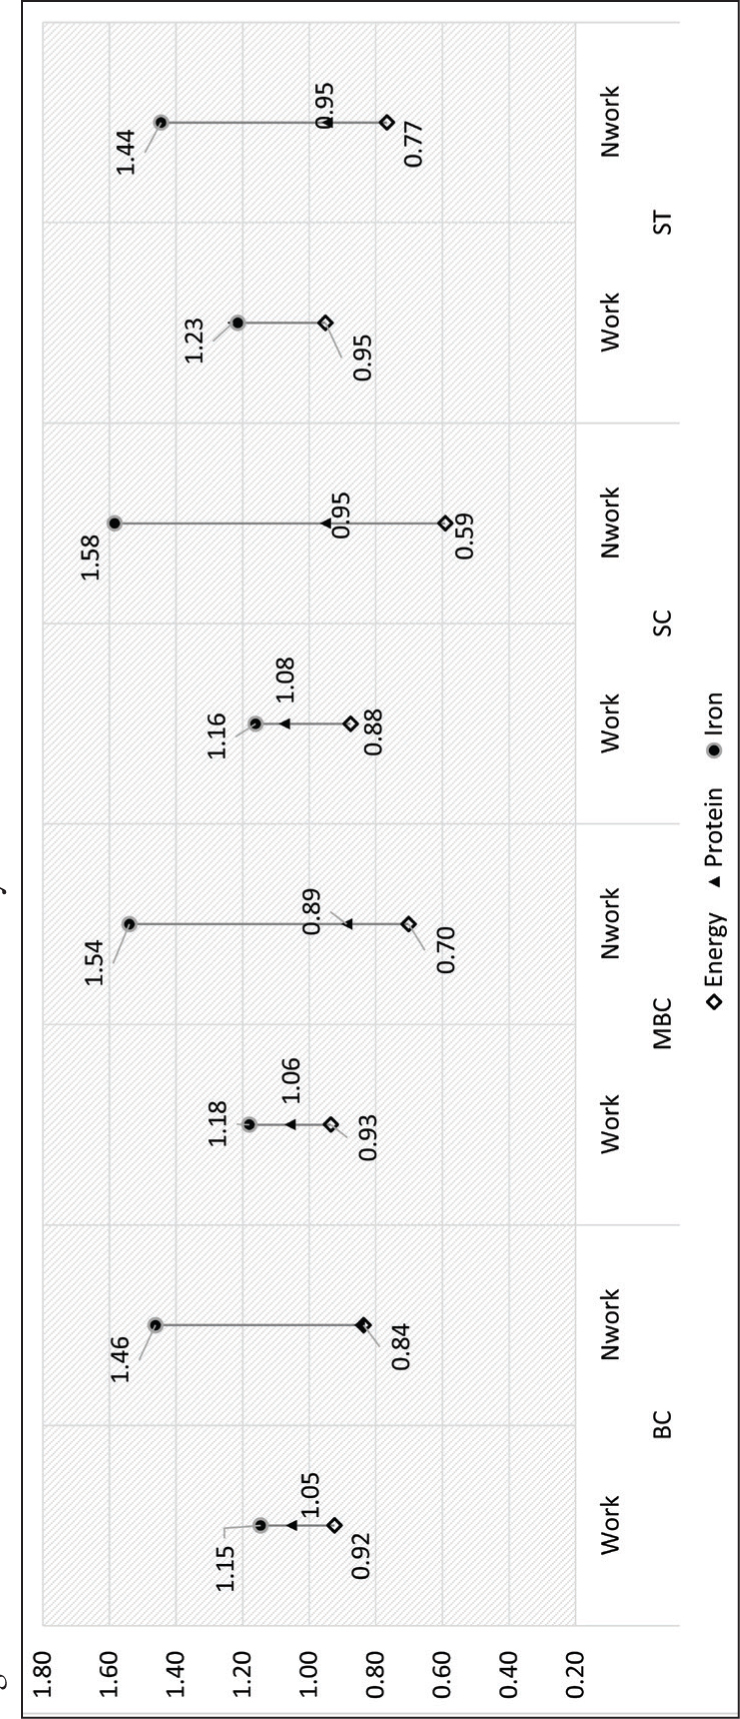
While gender differences in nutrition deficieny are considerable, especially on typical non-workdays, when we compare the ratio of women to men with nutrition deficiency among four different caste groups (Figure 3), the patterns look very similar. First, when it comes to energy deficiency, men among all castes experience greater deficiency than women, especially during non-workdays. The greatest deficiency is experienced by SC men. Second, regarding protein deficiency, women from all castes have greater deficiencies during workdays, but on non-workdays, this is the case for men from all castes. Finally, in terms of iron deficiency, women experience the greatest deficiency on any day of the week, but particularly during non-workdays. While the ratio of women to men with iron deficiency during workdays is least favourable for ST women, the discrepancy between workday and non-workday is least pronounced for ST individuals and greatest for SC women. Thus, while gender disparities across castes display similarities, SC households face the greatest disparities in energy (favouring women) and iron (favouring men).
Ratio of Women to Men in Nutrition Deficiency.
Given the evident gender differences in nutrition and nutritional variation across the week, understanding the intra-household allocations of food is crucial. Therefore, respondents were asked about the availability of food within their households. They stated that there is always enough food for every household member and that no one routinely eats insufficient amounts of food. According to our respondents, food allocation within households is based on individual needs, determined by each member themselves. This allocation based on individual needs influences the quantity of food, but not the type. Women cook one dish for the entire household, which means that every household member eats the same food. Only in a few cases do health reasons, particularly diabetes or high blood pressure, result in adjusted cooking for a particular household member. Women generally decide what meals they prepare. Vedika, a woman with young children, explained she decides what to cook, not her husband. In some households, male members’ preferences matter more. Rani’s husband and two sons prefer rice; thus, she cooks rice three times a day. Occasionally, she prepares dishes like idli, dosa or chapatti, which her two daughters enjoy but she always boils rice alongside for the men of the house. Thus, the food preferences of the men in Rani’s household take precedence over those of the women.
In rare instances when there is not enough food for everyone in the household, children never have to eat less than they need or want. The adult household members may each eat a little less or, more likely, women cook additional rice. Respondents stated they feed children first and divide the remaining food among the adult household members, even if there is only a little food left. Children appear to be the only household members with priority in intra-household food allocations, and we did not find any nutritional differences between boys and girls. Saravanan, one of our respondents, explained that his household rarely buys expensive food items, but he finds it hard to refuse his grandchildren if they ask for something special. Women said they generally eat less than the adult men in their households simply because they require less. The data presented above suggested that men have greater energy deficiencies. However, when focussing on nutrient intake, women do face higher deficiencies compared to men. Thus, since the intra-household allocation of food is equal in type, the gendered nutritional differences result from a mismatch between the specific nutrient needs accociated with gender and the type of food being prepared and/or the allocation of quantity of nutrient-rich foods.
Inter-household Deficiencies: Livelihood, Caste and Land Size
In addition to gender, previous studies indicate that livelihood plays an important role in nutrition patterns. Based on previous studies described above, we expected farmers to have better nutrient intake than agricultural wage labourers and non-agricultural households to exhibit the smallest nutrient deficiencies and the least variation between workdays and non-workdays. Surprisingly, our data challenges these expectations, as we find minimal differences among farming, agricultural wage labouring and non-agricultural households (Table 3).
Household Nutrition Deficiency (% Deviation from RDA, Median).
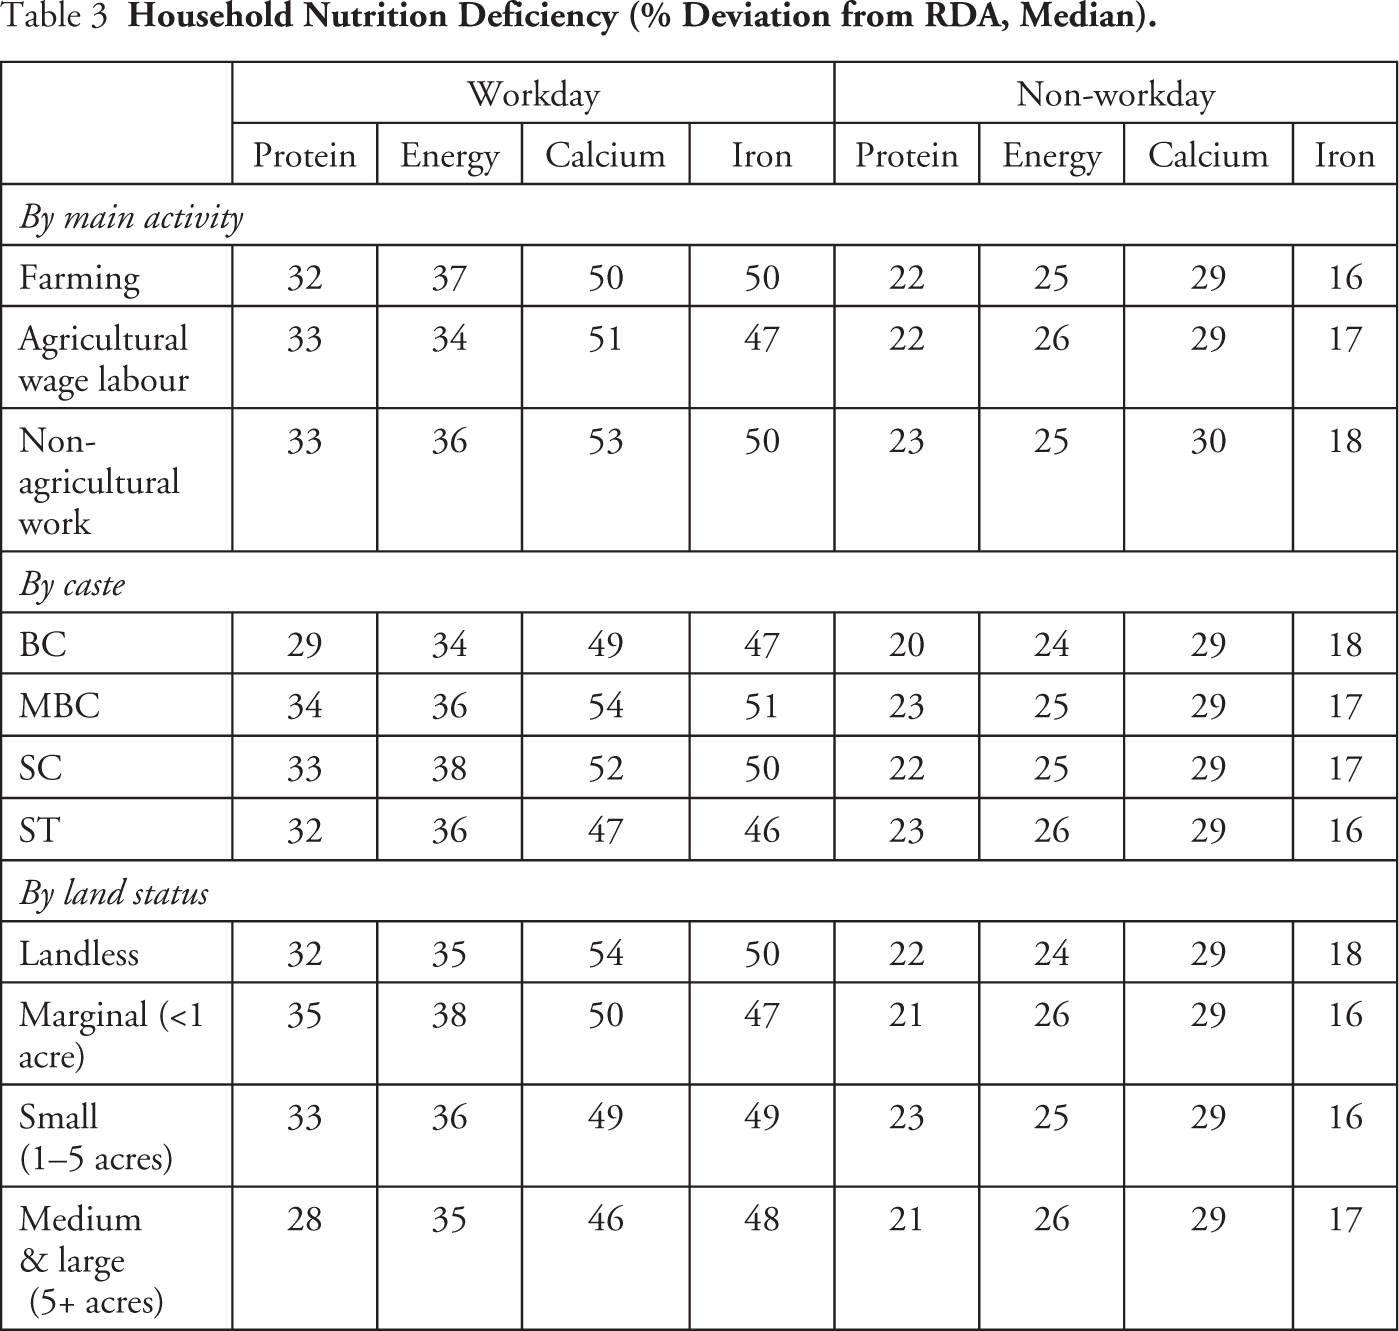
Livelihood and caste often intersect, with SC and ST households more likely to engage in agricultural wage labour, while BC and MBC households tend to be farmers. When analysing nutrient deficiency by caste, we find significant differences. Table 3 shows that the most significant nutritional differences by caste appear on workdays, with disparities almost disappearing on non-workdays. Surprisingly, both SC and MBC households show the greatest differences in nutrient deficiencies between workdays and non-workdays. On the other hand, BC households consistently show the smallest protein and energy deficiencies, while ST households exhibit the lowest levels of calcium and iron deficiencies. This finding is particularly surprising, as previous studies have shown that ST households are particularly vulnerable to malnutrition.
One possible explanation for our finding is that men in ST households, who are often landless, have transitioned to non-agricultural jobs with higher incomes compared to agricultural wage labour. The unexpected similarities in nutrition between livelihoods is likely to be related to similarities in land sizes across communities, as few farmers included in our study were large landowners. Indeed, comparing nutrient deficiencies by land status in Table 3 shows that medium and large landowners have substantially smaller nutrient deficiencies on workdays.
While the nutritional difference between farmers and agricultural wage labourers is minimal, our respondents believe that the ability to farm significantly impacts food consumption. Specifically, landless households believe that landownership would secure their food consumption. Sarada, for example, stated:
We would eat the same as now, but we will have land. If there is no work for 10 days or two months, we can work at our house and eat. … If we have land, we can cultivate food. If we go for work for 10 days and receive 200 rupees per day, we can save this money.
Thus, landownership could alleviate the burden of food expenses, particularly during periods of unemployment. Farming households perceive the benefits of cultivation in various ways. Ambika argues that if her household’s income relied solely on her husband’s daily wages, they would only have enough money to buy food. However, she explained that since they also cultivate one acre of land, they invest her husband’s wages in farming to increase their total income.
Affordability, Time and Responsibilities
The findings indicate that protein and calorie deficiency is less pronounced during non-workdays compared to workdays. Analysis of consumption patterns in the surveyed households reveals a significant difference in types of food consumed on workdays compared to non-workdays, particularly in meat intake, impacting calorie, protein and fat intake. Rice is a staple food for most households, forming the basis of every meal throughout the week. The side dish, often a type of curry, plays a crucial role in the nutritional value of every meal and differs between workdays and non-workdays. On workdays, vegetable consumption is significantly higher since most households (52%) have sambar, a curry of pulses with vegetables, as side dish. However, iron deficiencies are significantly larger on workdays, despite the greater vegetable consumption on these days. On non-workdays, on the other hand, the most consumed curry is mutton curry (42% of households): in fact, all non-vegetarian side dishes are consumed nearly exclusively on non-workdays.
Although traditional Indian dishes are typically lacto-vegetarian (Green et al., 2016; Jayanthi, 2001), in our sample of households, only 1.7% of all individuals were vegetarian. When asked about their preferred but unaffordable food items, respondents most frequently mentioned meat. Sarada, an agricultural wage labourer, explained that buying meat is a conscious decision:
For two months there is no work. We are staying at home. What can we do? If we want to eat meat, we cannot. We cannot eat what we like. We have nothing, no money today. If we get 500 rupees loan, but there is no work, then how can we repay the 500 rupees? If we have work, we eat meat once a month. If we do not have work, then once in two months.
This highlights the affordability factor that inhibits meat consumption, making it a rarity saved for special occasions. Although not all households eat meat every week, if they do, it is most likely on a non-workday, resulting in the greater nutritional value of non-workday meals.
Another notable deficiency is energy deficiency, particularly on workdays. This could indicate that meals are too small or too few. Previous studies indicate the significance of women’s time availability for cooking on the nutritional quality of meals (McCarthy, 2014; Vemireddy & Pingali, 2021). Our findings align with this. During workdays, 87% of the surveyed households indicated to have the same meal for breakfast and lunch. However, during non-workdays, 92% had the same side dish for breakfast and lunch, but not the same main dish. This suggests that women cook twice a day on workdays and three times a day on non-workdays. Because cooking is mostly done from scratch, less time spent on cooking is likely to result in simpler, less healthy, and less diverse meals.
In the village where we collected ethnographic data for this article, a group of seven ST women, all agricultural wage labourers, took up work in an incense factory in Salem due to the scarcity of agricultural wage labour opportunities. These seven women arranged transportation to and from the factory as a group to make the commute easier. However, their time at the factory only lasted a month as they found it too challenging to combine the factory work and hours with their household responsibilities. Bhandari (2017) refers to several studies conducted worldwide which highlight women’s continued responsibility for household work in addition to their paid labour. The gendered division of labour, with women solely responsible for household work, thus creates an almost unmanageable workload if they take up additional labour. Ambika, for example, is solely responsible for all housework, care of cows and cultivation of their land while her husband works at the railways. Ambika shares her difficulties in managing everything:
I cannot say that the children always eat lunch. They do not always eat at school. They do not like the food there … The situation is that they go to school at 7 a.m., when I am milking the cows and my husband is getting ready for work, so I do not have time to make them food. I send them off to school without breakfast.
Workload, thus, is an important factor in food consumption patterns. Although only few households in this study reported to regularly skip meals, this does not mean that everyone else always eats three meals a day. On days when respondents only consume two meals, they typically have a late breakfast between 11 a.m. and 1 p.m., skip lunch or have a cup of tea instead and then have dinner around 8 p.m. Interestingly, respondents rarely attributed skipping a meal to lack of food. Instead, they blamed it on their workload. For instance, Kumar, a farmer, explained that ‘If there is work in the field, we [my wife and I] do not come home for lunch. We eat at night. If there is no work, we eat [lunch]’. This demonstrates that work on the farm interferes with taking time to eat.
It is not just farmers whose food consumption is impacted by workload. Agricultural wage labourers must also frequently choose between work and eating. They usually have a late breakfast and sometimes skip lunch if there is additional work to be done at home. Santhi and her neighbour, both middle-aged agricultural wage labourers, explained that they leave for work at 7.30 a.m. without having eaten anything, and at 10 a.m., the farmer they work for usually provides tea. At 11 a.m. they return home for a one-hour breakfast break. They finish work around 3.30 p.m., but then there is work at home, such as laundry or milking cows. They may have another tea in the evening but will not eat another meal until dinner. Even on days without paid work, they have plenty to do at home and their consumption routine remains the same. Prioritising work over having a meal is evident among cultivators and landless households, and among men and women. However, only women prioritise work over meals on days when they do not engage in paid labour. Insufficient food consumption is thus more often due to heavy workload rather than a result of food scarcity.
Conclusion
This article has demonstrated the concerning issue of nutrition deficiencies in rural Tamil Nadu. While studies conducted in Western countries show that the nutritional quality of food consumed during weekdays is better compared to weekends, this article contradicts this notion. In fact, our findings provide evidence that energy and nutritional deficiencies are smaller on non-workdays and that meals consumed during non-workdays are of higher nutritional quality than those consumed during workdays.
The discrepancy in consumption patterns between workdays and non-workdays is most evident in the consumption of protein-rich and calorie-dense non-vegetarian items. It is important to note that this does not necessarily imply that fish or meat consumption should increase in rural areas but underscores instead the significance of food choices and women’s time availability for food preparation. Therefore, it is crucial to promote the consumption of nutrient-rich foods during the week, possibly by including such items in the Public Distribution System. These findings also caution against increasing energy intake among rural households through low-nutrient foods.
The impact of women’s labour on nutrition is demonstrated by the trade-off between time spent on various types of labour and time dedicated to cooking during workdays. As a result, more time is available for cooking healthy, nutrient-rich and diverse meals on non-workdays. We argue, therefore, that time constraints on workdays result in greater nutritional deficiencies compared to non-workdays, particularly affecting women. The allocation of women’s time is crucial in understanding why we did not find significant differences between households with different livelihoods, as women across these households engage in paid work, except for those in medium and large size farming households. However, in the latter case, we did observe that these households experience the smallest nutrient deficiencies and the least disparities between workday and non-workday meals.
Simultaneously, while allocation decisions may not be consciously discriminating against women, it is crucial to recognise the inequality in nutrition. Since the type of food prepared at home is identical for all household members, nutrient differences likely stem from inadequate addressing of individual nutrient needs or inequality in allocation of quantities of nutrient-rich food. This inequality decreases on non-workdays and even reverses for energy intake. Therefore, instead of solely focussing on equality, it is important to consider differences in nutritional needs—in other words, equity.
Footnotes
Acknowledgements
We are grateful to Palanisamy Kalpana and Manikandan Muthusamy, who gathered and cleaned a large proportion of survey data, and to Professor Elangovan, who oversaw their work. Needless to point out that the responsibility for any errors in this article lies with us, the authors.
Declaration of Conflicting Interests
The authors declared no potential conflicts of interest with respect to the research, authorship and/or publication of this article.
Funding
The authors disclose receipt of the following financial support for the research, authorship and/or publication of this article: the research underpinning the discussion in this article has benefitted from a research grant provided by the UK-India Education and Research Initiative (UKIERI) and the Universities Grants Commission of India for three years (Reference: UGC-UKIERI 2016-17-080).