
Abstract
Lattice structures nowadays have gained a peak in research. Inspired by the honeycomb structure and fishbone, this study investigated lattice structures that can provide auxetic behavior and store maximum energy absorption during deformation mode. From that, the study involved designing and producing different modified lattices based on the honeycomb’s structure and the fishbone’s perspective. The specimens were 3D printed within fused filament fabrication techniques within the additive manufacturing platform of Euromed University of Fes. The conception, production, mechanical testing, and simulation have been employed to get optimum data analysis of the mechanical properties of the designed structures. The results observed under quasi-dynamic compression did not show significant densification behavior; but, the auxetic behavior was seen in all structures, while some suddenly collapsed. The experimental and numerical analysis demonstrated similar deformation behavior and strong agreement in their respective results. Nevertheless, some discrepancies in mechanical values were observed, with a relative percentage error of approximately 1% for both methods. Consequently, owing to the enhanced energy absorption observed in the V2 and V3 structures, it is evident that these modifications hold promise for optimizing the performance of these metamaterials in various practical applications.
Introduction
In recent years, a huge surge of interest in “design materials,” coupled with significant advancements in additive manufacturing has been investigated, particularly in 3D printing techniques. 1 These innovations now allow for the creation of materials with highly intricate nano/micro-architectures.2,3 Consequently, the concept of mechanical metamaterials has garnered growing attention. Thanks to their purposefully engineered nano/micro-structures, mechanical metamaterials demonstrate remarkable properties on a larger scale. These distinctive mechanical characteristics hold great potential for the creation of materials with cutting-edge functionalities. 4 Metamaterials development and their design features 3 are increasingly growing in research. Efficient and innovative materials with enhanced mechanical properties are a significant challenge for industrial sectors.5–7 It is the time when weight saving for lightweight structures is recommended. Topology optimization of different structures has elevated demand for mechanical properties at a very high coveted price from manufacturers. 8 The study of lattice structures takes part in this race, whereby their definitions act as the translated structure, with a sophisticated architecture of material that might be the synthetic or natural origin. 9 Lattice structures can be defined again as a combination of a pattern and empty areas, assembled in a way that creates physical characteristics of unattainable struts (beams) by a single material.5,10 An example of a structure that has gained numerous studies is the honeycomb structure 11 composed of a repetitive pattern of unit cells. These structures have mechanical characteristics of their own. In addition, these beehives are known to offer high stiffness in a specific direction, for such isotropic or anisotropic behaviors.
Such honeycomb structures were considered as hexagonal or re-entrant honeycombs. The concept of re-entrant honeycomb geometry was first introduced by Gibson and later developed by Almgren, who initiated the creation of auxetic structures using struts based on re-entrant geometry. However, the term “auxetic” was not new, because it was invented by Evans in 1991, 12 expressing them as materials with negative Poisson’s ratio. Significantly, these materials were previously observed by Love in 1892, 13 when a single crystal pyrite material exhibited a negative Poisson’s ratio of −0.14. By then, after Gibson et al,11,14 and Almgren 15 ; the Wojciechowski 16 brought in a computer model of hard and soft cyclic hexamers that displayed a negative Poisson’s ratio. In continuing studies, the researchers discovered various structures that exhibited negative Poisson’s ratio in hard cyclic tetramers. These structures displayed both strong anisotropy and a chiral phase. Another intriguing example of unique material properties was found in auxetic foam, which featured a re-entrant structure formed by volumetric compression and caused the foam’s ribs to protrude inwards, giving it an unmistakable appearance, which was similar to the re-entrant honeycombs found to offer distinct properties, as they deform through a combination of flexure, stretching of the struts, and hinging mechanism of the strut joints. 17
Background
In continuing exploration, the lattice structures were used in several fields including medical for cell adhesion and proliferation for implants. 18 They were also utilized in aerospace applications for their lightweight properties and are suitable in the continuous winding of epoxy composites made from graphite and aramid fibers, 19 as well as in the armament, and transport. 20 The true cellular structures were found to be those with a relative density of less than 0.3 and foam-based or lattice-based. 18 The literature described different structures studied and investigated for optimum mechanical properties. In their reviewed article, Zhang et al. explained lattice structure usage’s current status and outstanding perspectives. 21 In their article, different studied lattice structure for orthopedic application has been investigated. This includes triply periodic minimal surface and beam structure lattices. Most of all, the investigation was manufactured by powder bed fusion for metal alloys 22 of the Selective Electron Beam Melting process (SEBM). An example of the completed structures implanted to replace part of the defective ankle. Another study, carried out by Johann Jaworski, 23 highlights the advantage of lattice structures’ role in the human factor and ergonomics. Indeed, during the research, Jaworski showed that using them for wheelchairs improved usage conditions and avoided the risk of pathology such as bedsores. Later, Vasiliev et al., 24 in their research various pieces were fabricated within anisogrid unit cells, 25 while the parts were dedicated to the aerospace applications. These lattice structures allowed a significant weight reduction and, in many cases, improved mechanical properties, hence their usage.
Many studies have focused on obtaining new structures with specific properties.26–30 Among them, studied the properties of the auxetic materials, which result in a negative Poisson ratio. In the research of Yao et al. 31 studied several structures leading to auxetic properties. Thus, it has been divided into several families: 3 re-entrant,32,33 chiral,30,34 and rotating structures. 6 The conclusion drawn demonstrated a variation in maximum allowable stress depending on the choice of structures. In addition, it has been observed that the behavior of the lattice structure, when subjected to loading stress, can be anticipated by the numerical simulation. A similar method has been used in the research of Nanfang Ma et al. 33 on a re-entrant structure. The identification of a structure, manufactured with 3D printing and mechanically tested, then compared the experimental and numerical analysis. The structure’s orientation was found to be influenced by the peculiarity in their research, while the mechanical properties of the created composites of several layers with a different orientation. The study results illustrate the effect of orientation on the structure considerably impacts mechanical properties. Furthermore, the properties improved or altered based on the structure’s orientation. However, the consideration of unit cell behavior and the modification during orientation has not been emphasized. Although, based on the design optimization as stated in the study of Yang et al., 35 the full freedom design for the lightweight structures has become necessary for the topology optimization paradigm as one of their features and often involves multiscale analysis to obtain pure finite elements in the computational demands.
Finally, the honeycomb mechanics as it was illustrated by the compressive stress-strain diagrams, illustrated two different elastic regions: one corresponding to bending cells and the other to stretch them. Different types were classified based on the mechanism of collapse and scaling laws. Gibson and Ashby defined these laws by applying the standard beam theory, also known as the Euler-Bernoulli beam theory,
18
to analyze the mechanical behavior of lattice materials. By these laws, the below equations (equations (1)–(3)) were used to define the bending dominant structure when exponent b = 3 and c = 2 or 3/2 and stretching dominant structure, when exponent b = c = 1, as shown in the reviewed study of Ongaro.
36
The relative density relation with relative stiffness


Thus, this study is inspired by the existing research on beam lattices37–39 based on fishbone topology. The study introduced a design approach of a fishbone-like structure, that relies on computer modeling of a unit cell. The proposed structures were 3D printed, while a potential material candidate of polyethylene terephthalate glycol-modified (PETG) polymer was selected. PETG is expressed to be a durable material that can withstand high mechanical impact and moderate heat loads.40,41 It is more resistant to wear and impact than other polymer materials used in the FDM process, such as Acrylonitrile Butadiene Styrene (ABS).40,41 However, still being very cost-effective for production in AM applications. 42 Further, to better understand how the modification and alteration of struts within unit cells affect mechanical properties behavior under compression analysis of quasi-dynamic load inflow, we collected data from both experimental and numerical analyses, then carefully compared and fine-tuned the results using statistical analysis to determine the optimal approach, that exhibit maximum energy absorption while balancing specific mass in the designed structure.
Modeling and methods
Parametric study
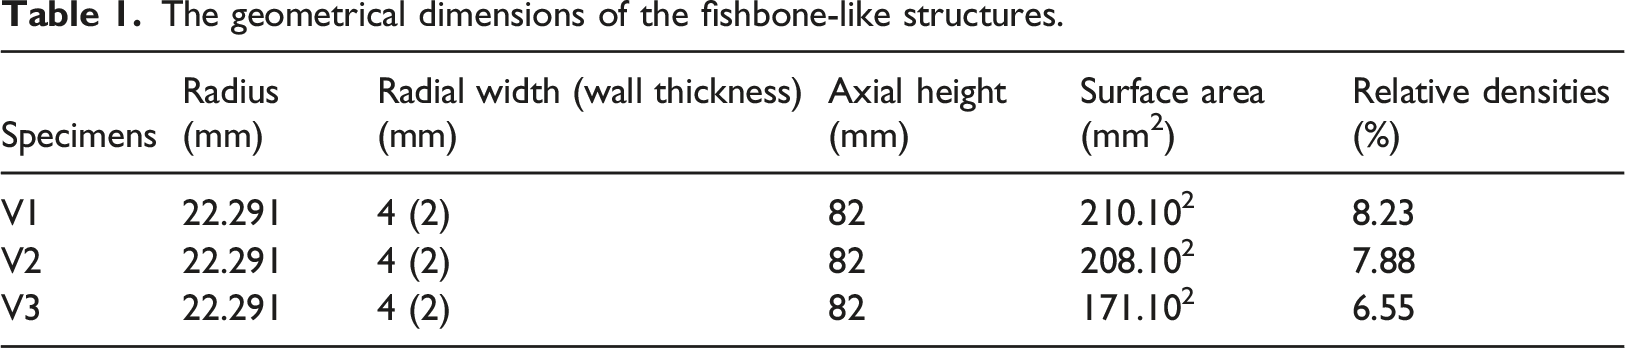
A schematic of the model’s geometry (Figure 1) consists of three independent fishbone-like structures designed by SolidWorks, a CAD software from the Dassault system. Table 1 shows the geometrical dimensions of the 3 structures modified based on the interlocking beam of a unit cell, while the strut size and pore size remain unchanged, except where the beam has been removed (see Figure 1(b) and (c)). The two structures, V2 and V3, describe variants of V1 and the changes made called on “fishbone” and beam junction of V1 between the two fishbones (Figure 1(a)). As-designed lattice structures: (a) version V1, (b) version V2, (c) version V3. The geometrical dimensions of the fishbone-like structures.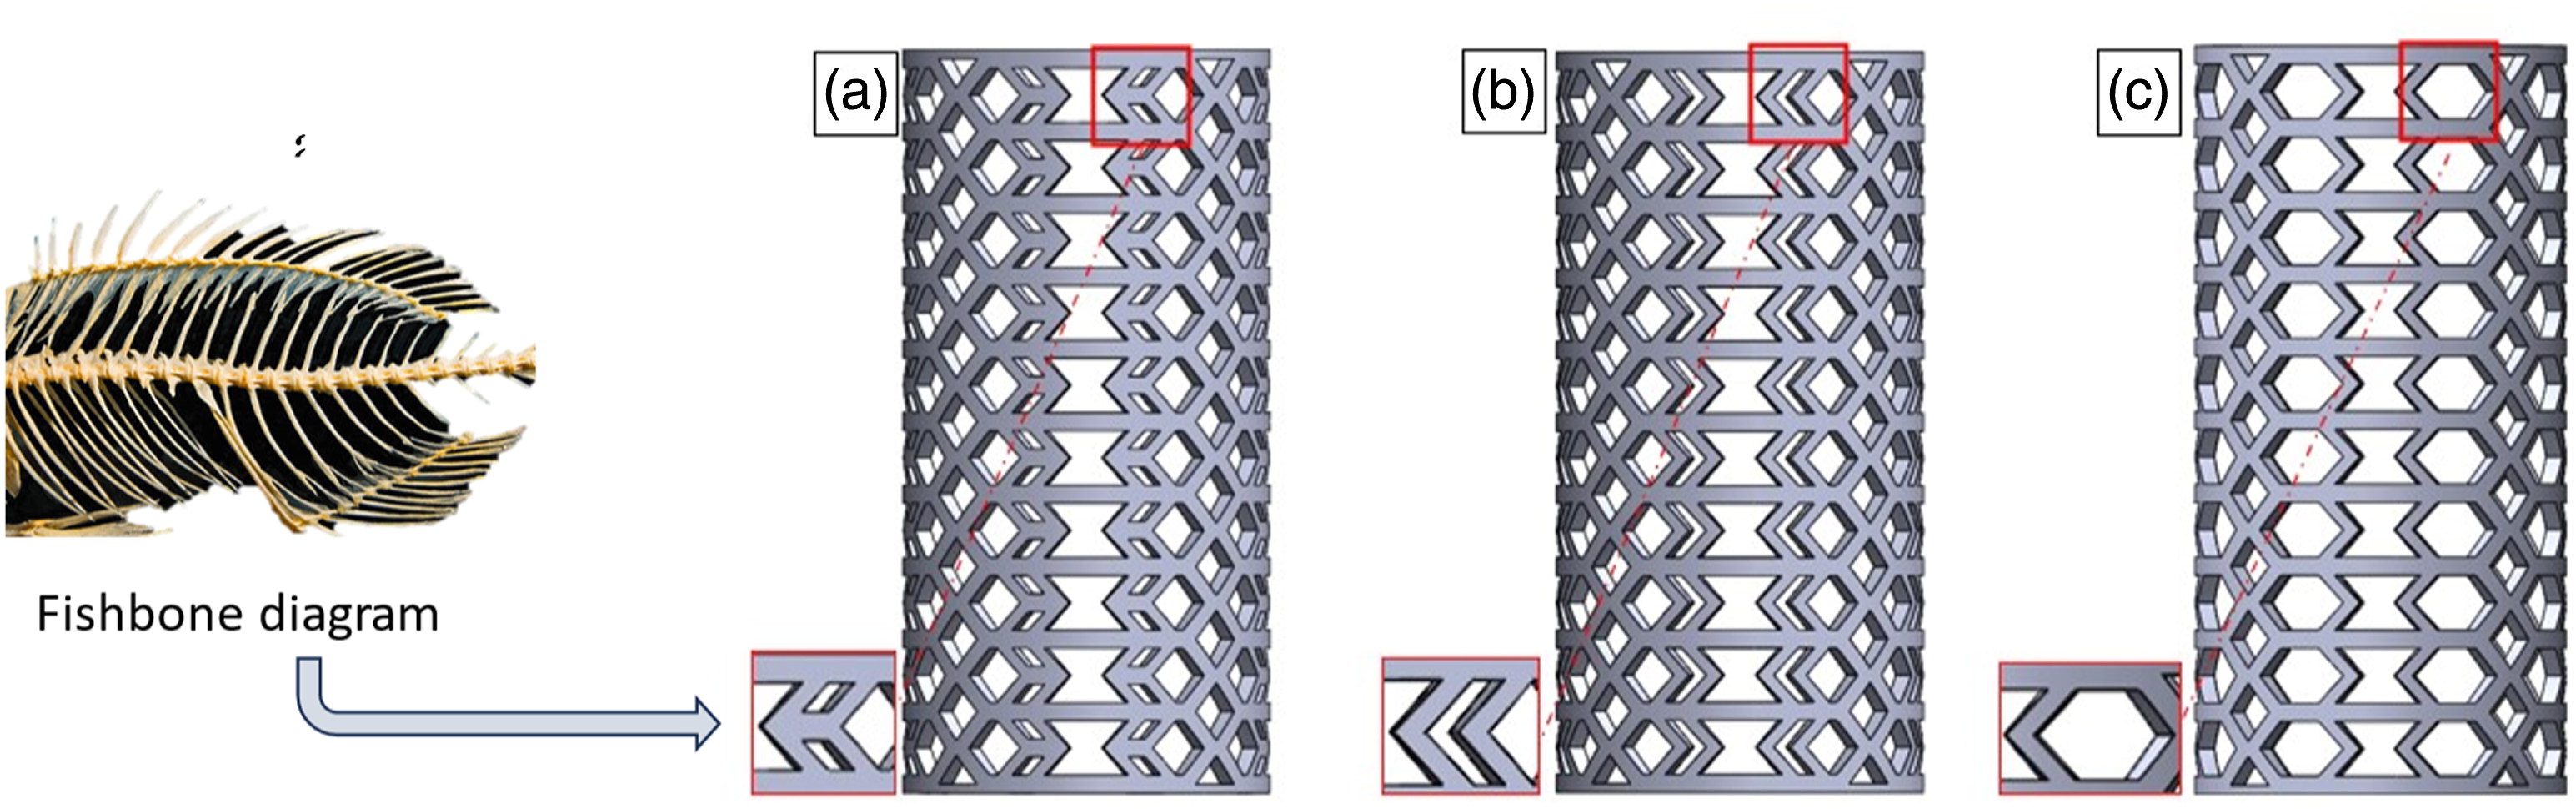
The V2 does not have a junction (Figure 1(b)); as for V3, one fishbone and the beam’s junction were removed. It has been observed that V3 becomes a diamond-like structure after a transformation composed of re-entering strut, which makes half fishbone-like of V1 (Figure 1(c)). The addition of fish bone edge was not only modifying the structure of V1 and V2; it was later illustrated to influence the variation of mechanical properties of the models.
Additively manufacturing and specimens’ production
PETG materials specification for FDM.
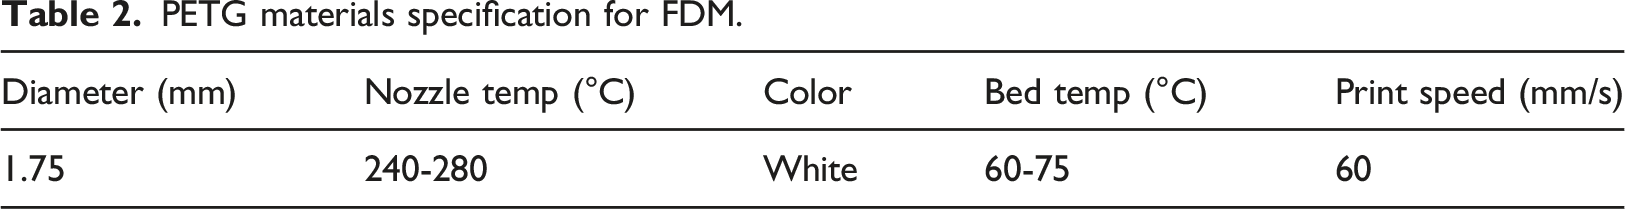
The 3D printer used its default parameters, except the infill rate at 80% and layer thickness set to 0.09 mm. Manufacturing time spanned between 6 and 20 h for the 3D-printed structures. In addition, two printing approaches of supported and self-supported structures during printing were used. Initially, the supported approach was employed, however, we encountered challenges with support removal during post-processing, which risked damaging the specimen’s beam/struts. Consequently, the decision was to opt for printing without support, aiming to enhance the quality and integrity of the final printed specimens. This adjustment in approach was essential in achieving the desired outcome of final prints.
Material characterization and numerical analysis
A tensile test was used to collect data parameters of PETG, which was used as bulk material in elemental numerical analysis. A dogbone specimen (Figure 2) was designed and 3D printed in FDM with similar parameters for specimens V1, V2, and V3. The geometry of the dogbone specimens shown in Figure 2(a) with their nominal dimensions considered for ASTM D638’s standard: overall length (OL) 165 mm, gauge overall length (Lg) 115 mm, gauge section length (Ls) 57 mm, grip section length, (GLf) 50 mm; grip width (Gw) 13 mm; thickness, (t) 3.2 mm and grip overall width 19 mm. The stress uniformity within the gauge length for this dogbone geometry was not verified through finite element analysis, however, their results from experiments were used instead. The tensile test of the dogbone specimen was performed with the MTS QTest machine following ASTM D638’s standard. Thus, the sample was placed between the two jaws (grips of MTS), parallelepipeds with the square cross-section based on their opportune lengths, to opt out of any buckling phenomena. (a) Schematic illustration of dimensions and (b) tensile stress-strain curve of DogBone test specimen following the ASTM D638 type I.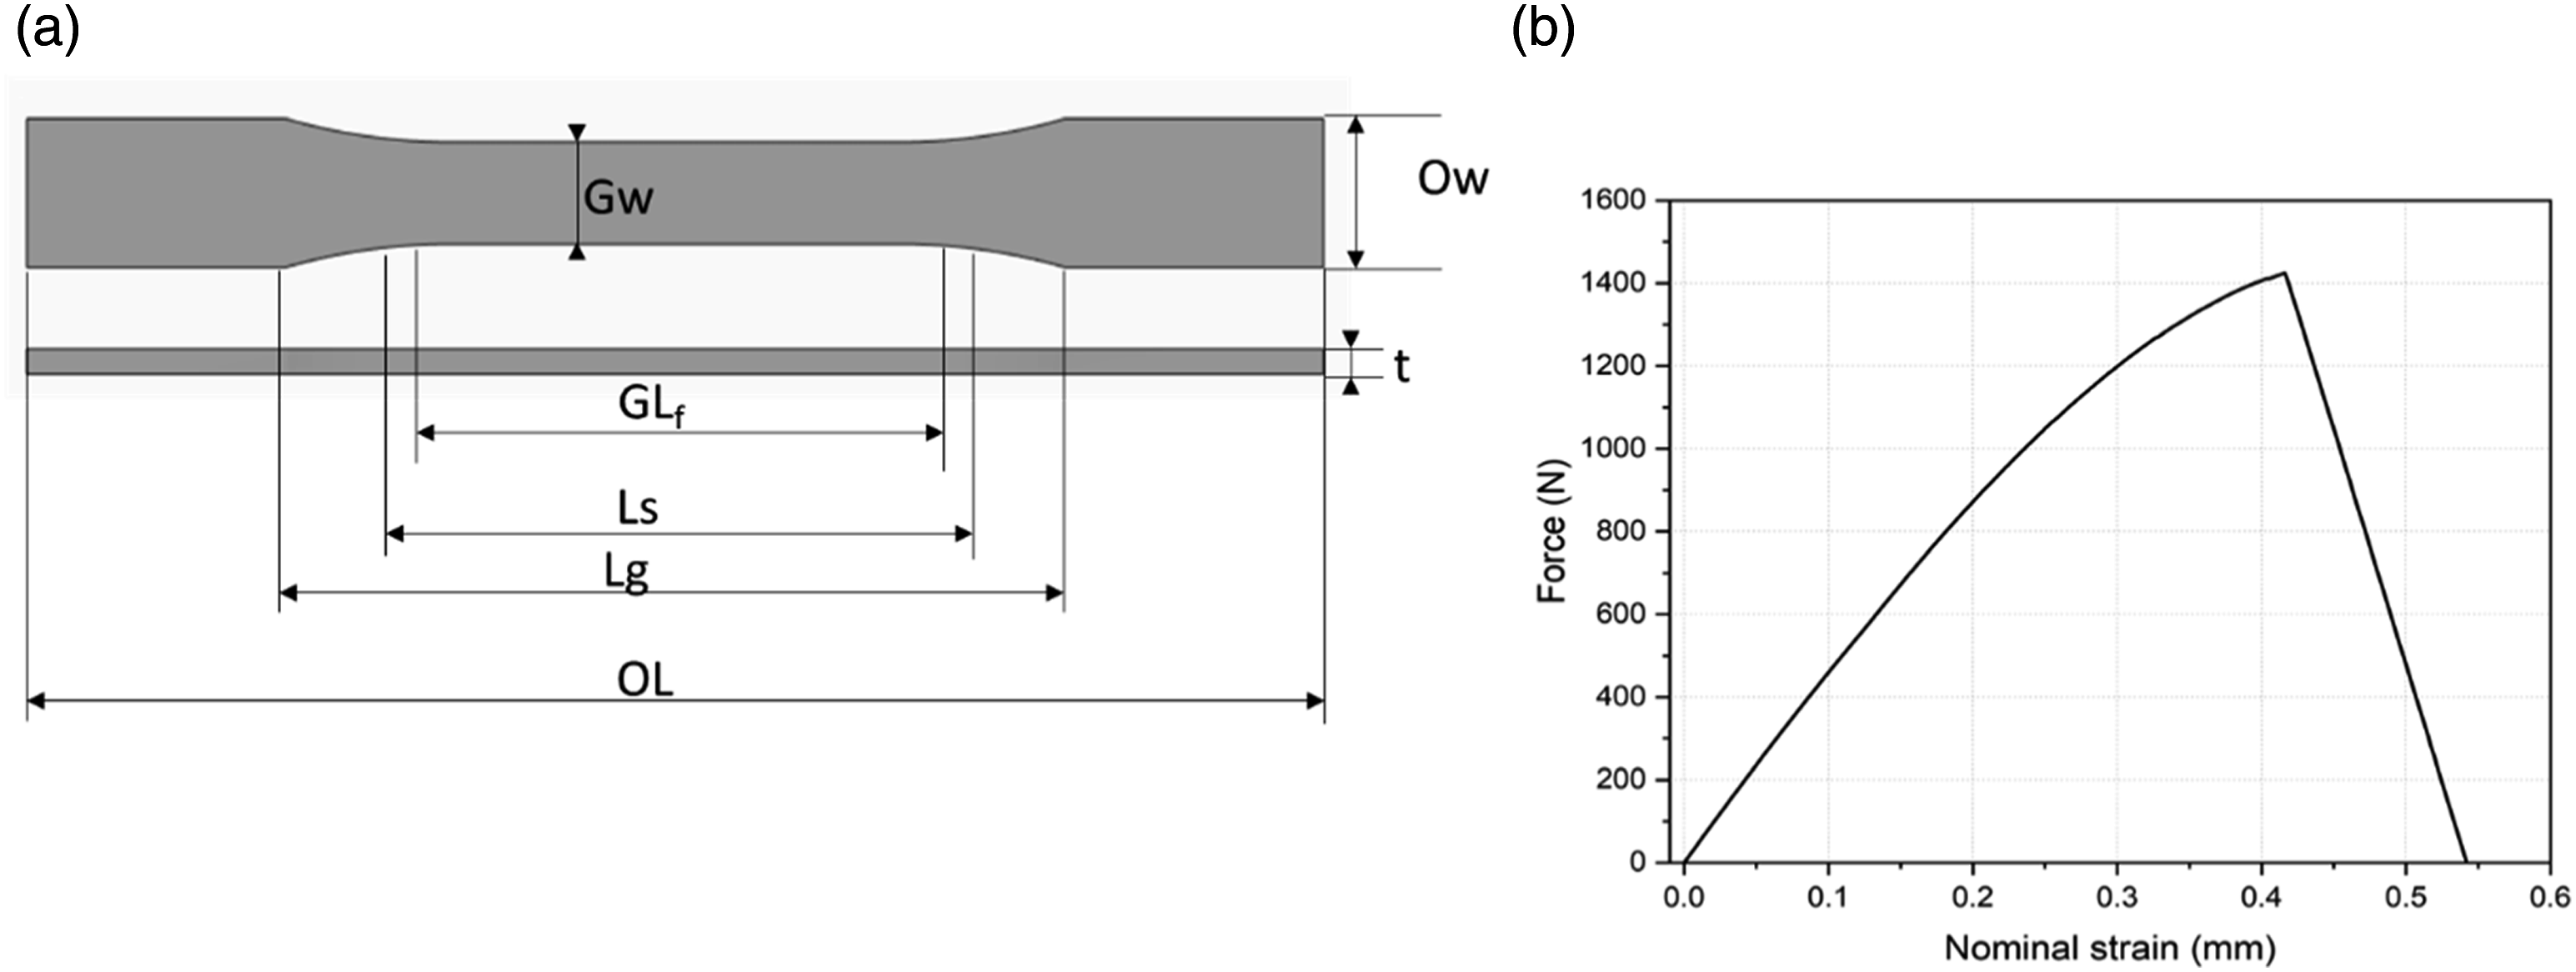
This understanding of the bulk materials analyzed and considered is represented in Figure 2(b). The ABAQUS (2020), a Dassault systems’ software for Finite element analysis (FEA), was used to simulate the quasi-dynamic compression of the V1, V2, and V3 specimens. The experimental data obtained from the tensile test fitted well in ABAQUS as the PETG’s property of bulk material. To save calculation time, the shell structure was considered from the mid-surface of parts V1, V2, and V3. For this, the imported part as a surface was used to identify all boundary conditions presented in the shell functions (Figure 3). These are the global coordinate systems in the plane of U1 (Global X), U2 (Global Y), U3 (Global Z), UR1 (Rotating Global in X), UR2 (Rotating Global in Y), and UR3 (Rotating Global in Z). They are defined by the constraints of all active structural degrees of freedom (DOF) within their specified regions. Boundary conditions used, (a) at the bottom and loading on the reference point at the top, (b) coupling the reference point with the upper surface.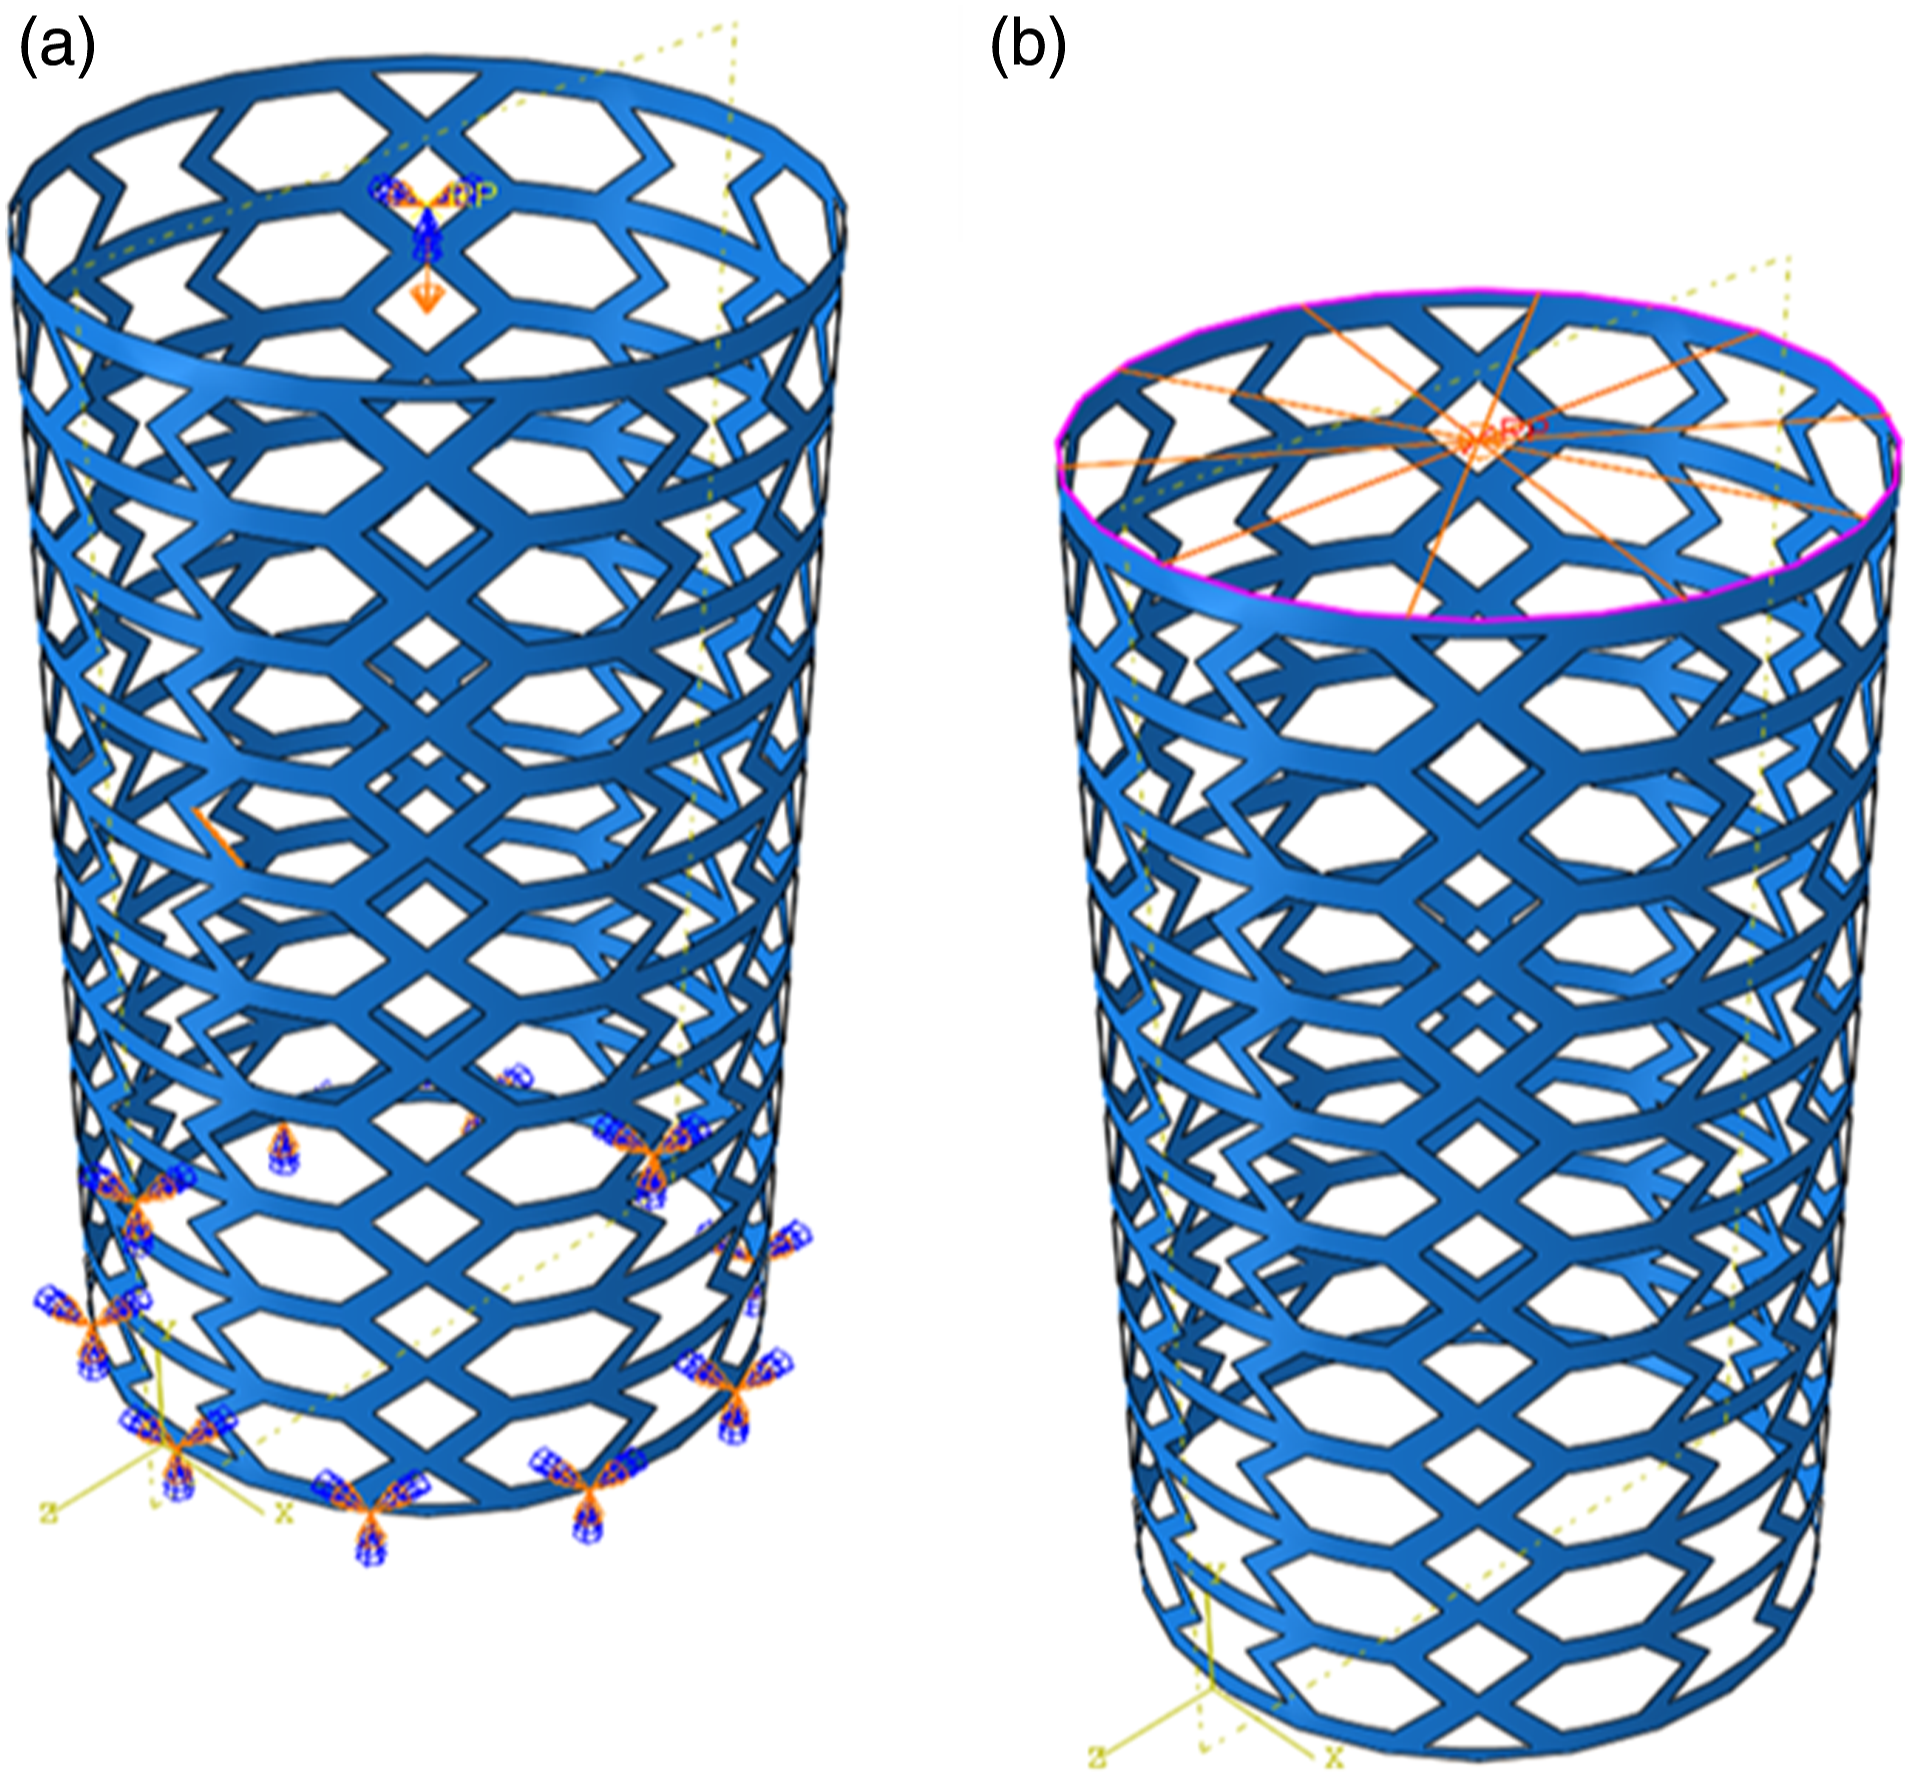
Therefore, these boundary conditions described the bottom part of the cylinder encastered at the displacement of U1 = U2 = U3 = UR1 = UR2 = UR3 = 0, while the top part imposed a loading displacement of 30 mm. To simplify the calculation process, the upper part of the cylinder was coupled to a reference point, and the displacement was conditioned to this reference point. Throughout the simulations, the tests were carried out with and without mass scaling (∆t), however, the trial-and-error analysis was adopted based on the results comparison. The appropriate mass scaling factor was determined under equation (4) and recalculated whenever the mesh size changed. It is worth noting that triangular fine mesh elements of type S3R were used. For this reason, mass scaling enhances the computational efficiency of our analysis and with stable time increments has revealed a substantial influence for attaining the optimum simulation results.
43
This allowed us to increase the material density within an element without impacting the accuracy of our results calculations.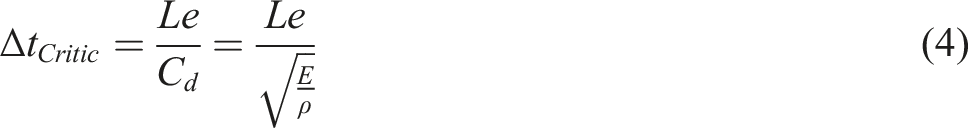
This study used different meshing sizes of 0.5, 1, 1.5, and 2 mm, to collect optimum numerical modifications of the results.
Experimental analysis
Further, the 3D printing of structures was subjected to experimental study with an MTS machine. The test was conducted in an MTS QTest machine following ASTM695 standard.
44
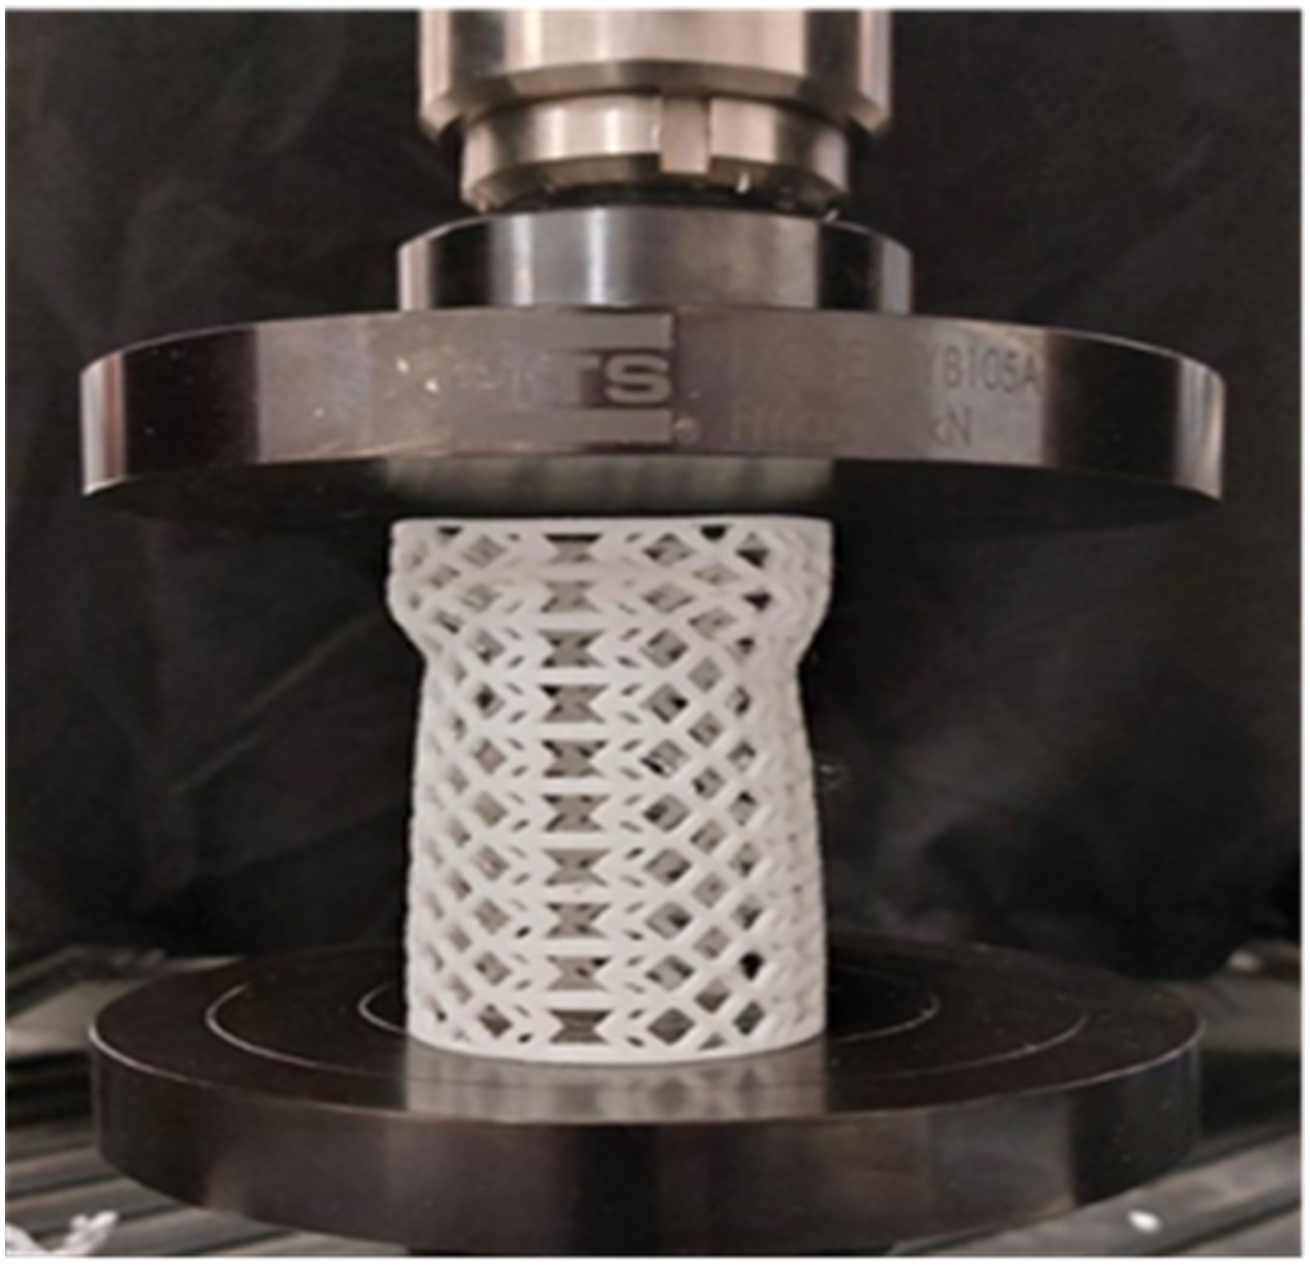
To avoid buckling, the specimen was placed between the two cylindrical plates of MTS within the cross-section base of their opportune centers. A 2 kN load cell was used for the compression test. The compression test was carried out for all as-designed specimens (Figure 4) due to the complexity of the structures difficult to handle under tension analysis. Also, the compression analysis provided valuable results for characterization when considered with the previous studies. Three tests were carried out per family of V1, V2, and V3. The loading speed of 1.8 mm/min was used, and the data was acquired at a frequency of 10 Hz. The load cell of 10 kN, which was used during a tensile test, was replaced by a load cell of 2 kN for the compression test and the machine’s safety. The compressive load F[N], displacement DL [mm], as well as nominal strain Dl/L [mm/mm] were saved during the test. From these data, it was possible to obtain all the distributed necessary stresses at the base, as for compressive stresses Illustration of the structure subjected to compression test and their observation section view.
Results and validation
Typical compression stress-strain curve and deformation mode
The stress-strain curve data of all the specimens tested are illustrated in Figure 5. It was observed that the strength varies according to the model studied. The more struts in the unit cell of the model, the higher the maximum effort. Indeed, the maximum peak crushing force (PCF) (Figure 5) was half compared and V3. Although the fall in effort appears at similar displacements for V2 and V3, unlike V2, the fall in the effort was a little more delayed. The load-displacement curves illustrating peak crushing force (PCF) of all as-tested specimens (a) V1, (b) V2, and (c) V3.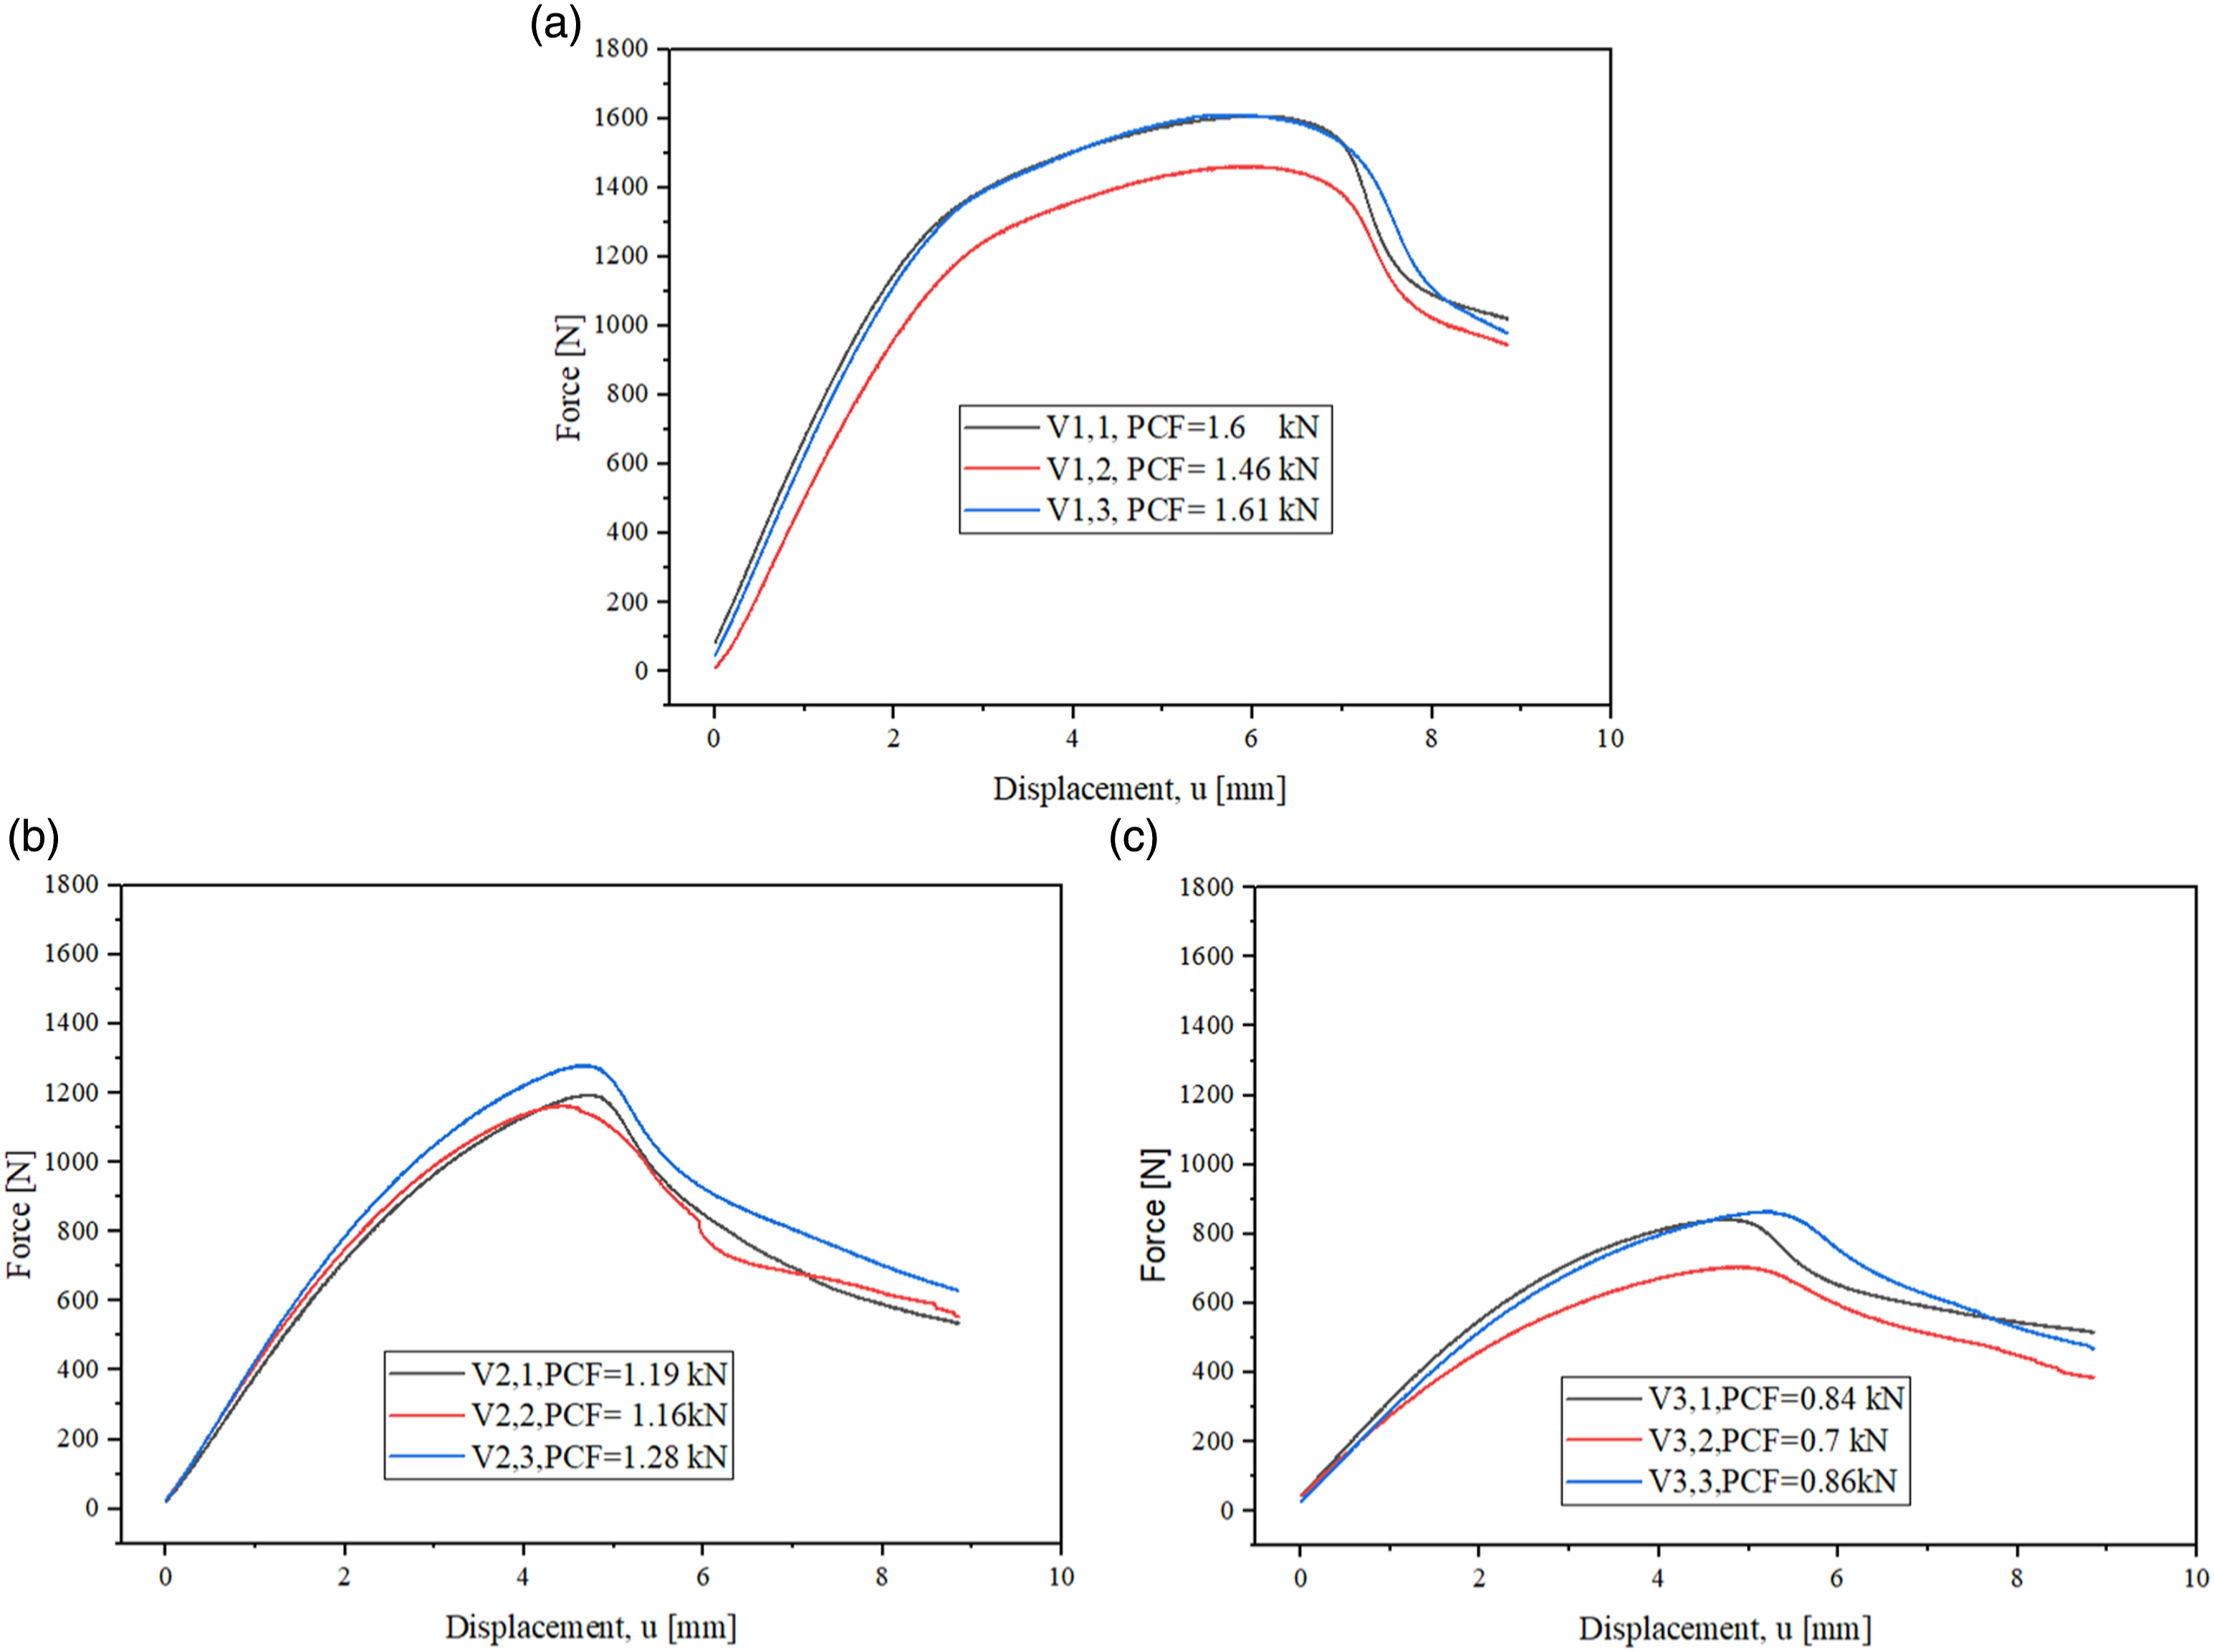
Furthermore, the observation depicted in V2 (Figure 8(b)), almost all the structures tested collapsed, describing the brittleness behavior of the structure that fails and collapses under compression load exceeds their critical/buckling load while experiencing a large deformation. However, it shows a significant start of progressing strain in plastic resistance compared to others (Figure 5(b)). Further, the stored energy values during deformation were explained by the internal energy developed during the crushing and characterized the crashworthiness of the structure.45,46 The energy absorbed was collected from two phases of pre-crushing and progressive crushing. The deformations of all tested specimens did not experience significant densification behaviors because they suddenly collapsed. However, considerable progressing crushing was much higher in V2, which might be due to the removal of the beam connecting two fishbone-like struts and giving the model more energy absorption in that zone.
This effect was not the same when considering the total amount of energy absorbed, where the higher was observed in the V1. It shows a maximum in the pre-crushing region and drops in the progressive crushing zone, similar to other structures. The behavior was associated with their peak crushing force, which depicts the crashworthiness of V1 delayed more than others. This study did not consider the next indicator of material energy absorbed based on a mass of absorbent in structures, specific energy absorption SEA, where m stands for the mass of the structure (equation (6)).
Therefore, Figure 6 illustrates the internal absorbed energy. Using Matlab R2022a script, the integral for each curve obtained via compression tests was calculated to get the EA, equation (3). The variation in energy related to the topology of V1, V2, and V3 gives an average of 10.5 J, 7.1 J, and 4.9 J, respectively, see the Figure 6. The V1 model showed maximum energy storage more than others. Unlikely the other two specimens were found to store two or even three times less energy than the V1 (see Figure 6(a)). Internal energy absorbed (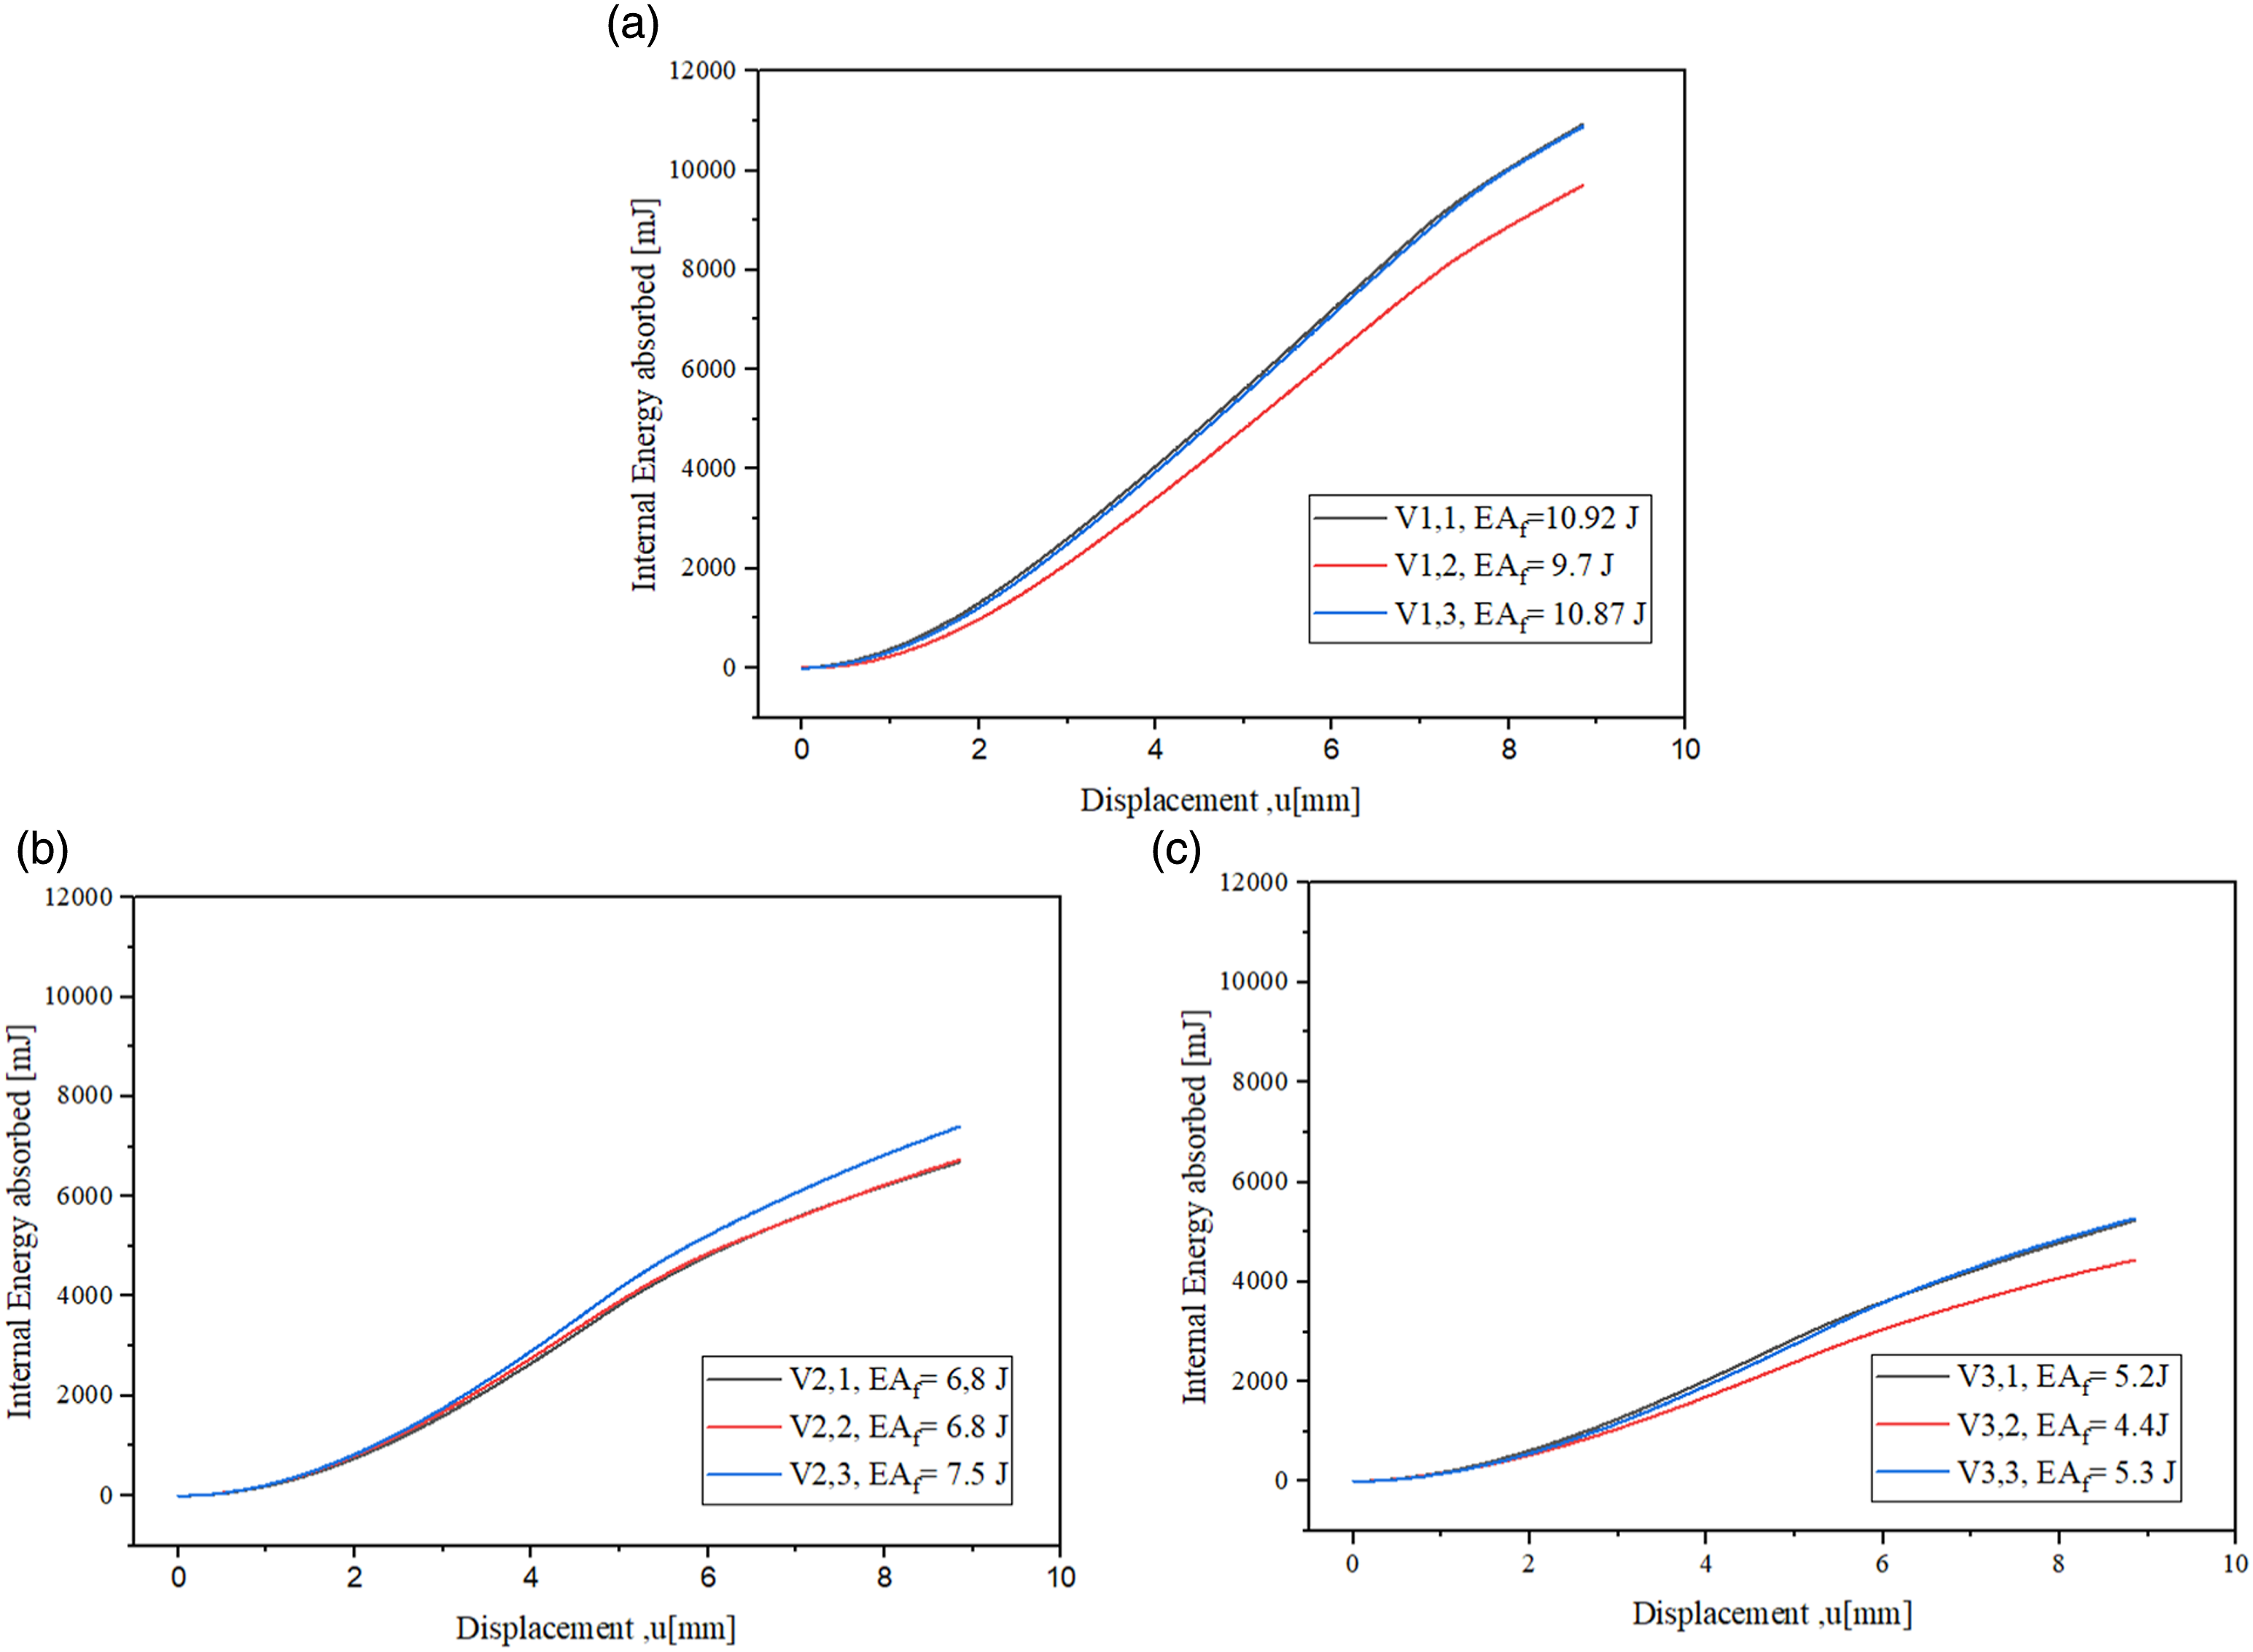
Comparison analysis of both numerical and experimental study
Figures 5–7 present a comparative analysis of experimental and numerical data. The schematic deformation process initially demonstrates a remarkable level of similarity, as evidenced by the load-displacement curve and absorbed energy. However, it is essential to note the influence of mesh size on the simulation results. Generally, a finer mesh yields results that deviate more substantially from the experimental data. When comparing results based on mesh sizes smaller than 2 mm, a considerable error range spanning from 10% to 46%. However, the model V1 at a 2 mm mesh size exhibited a somewhat different outcome, with a 12% error. Further, this falls within the range of what might be considered unacceptable. Deformation obtained via experimental compression in A, in B deformation obtained via numerical simulation of (a) Model V1, (b) Model V2, and (c) Model V3.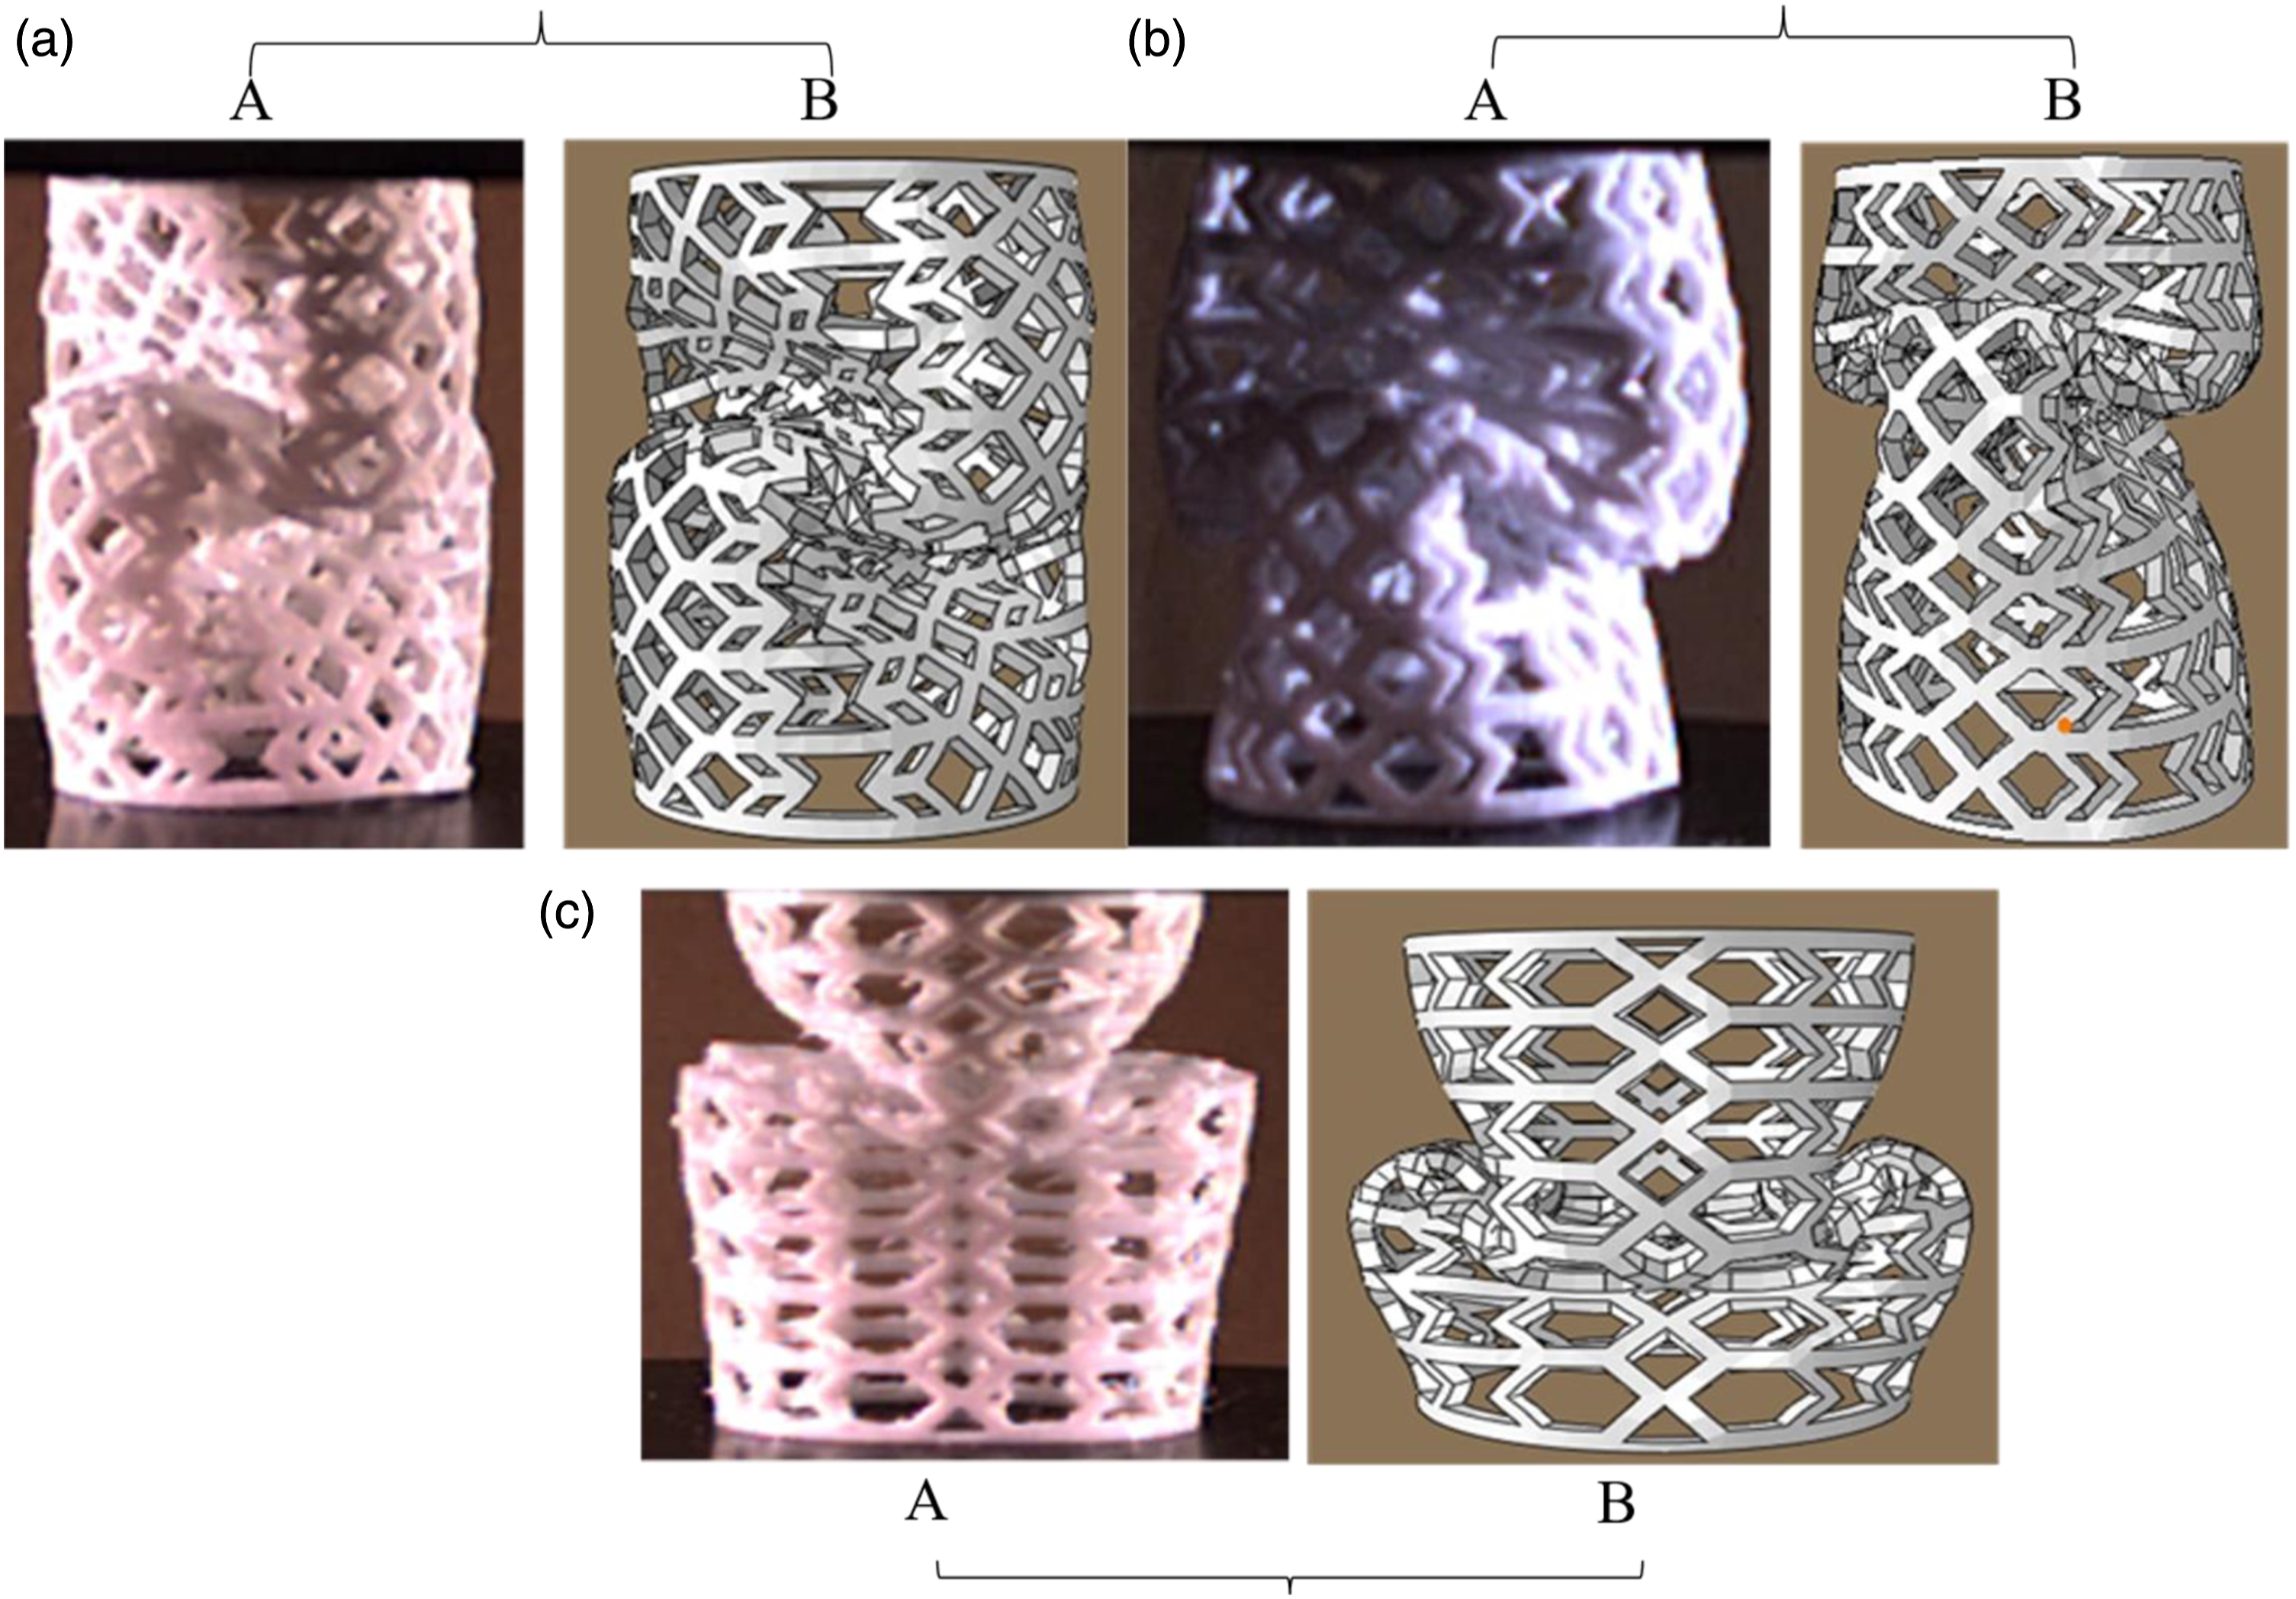
This discrepancy primarily arises from the plastic collapse behaviors unique to this particular structure, which lead to unwanted or undesirable data for other model structures when the mesh size is less than 2 mm. As acceptable evidence for this mesh size, the numerical findings revealed a more precise approach for V2 resulting in highly accurate results, with just a 1% margin of error when compared to the actual experimental measurements. This strongly suggests that opting for a 2 mm mesh size can be considered the most optimal result, guaranteeing the highest level of accuracy and reliability in the numerical simulations.
A closer observation of Figure 7 revealed a noteworthy collapsing mode similarity of the specimens V1, V2, and V3 as they approach their interfacial cross-sections during the experimental (Figure 7(a)) and numerical simulations (Figure 7(b)). This aligned appearance provided a thorough and valid basis for the analysis. However, in the case of V2, there is minimal change observed. As previously mentioned, when comparing the resultant from a meshing size of 2 mm, the same discrepancy was observed and may stem from either geometric imperfection arising from the forming behavior during testing or potentially from the influence of wall thickness behavior,
47
which corresponds to the mesh size of the elements when repartitioned within the struts of the UNC. It is worth noting that the wall thickness has been observed to exert a significant impact on the deformation mode of the structure, as well as on the specific magnitude of internal energy absorption.
48
The observation also shows the plastic deformations initiated at the point at half height of each specimen. This means that the actual application of loading acted on the structure transversally reaches the peak crushing zone at half the height of the member, where the material stiffness properties meet the maximum allowable level of actions. However, the structures experienced similar behavior,
49
where such a small softening transition mode was depicted after post-peak descending. This gives the structure an axial shortening behavior at a relative strength drop between 60%–70% of nominal strain (see Figure 8). The higher drop asserted the brittle failure of the suddenly collapsed specimens. Indeed, it was noticed that structures did not experience any densification behaviors, confirmed by the load-displacement curve (Figure 8) of the experimental and numerical simulation. Schematic illustration of graph comparison of the force-displacement curve obtained as a result of tests at the bottom end of part crushing for experimental and numerical simulation.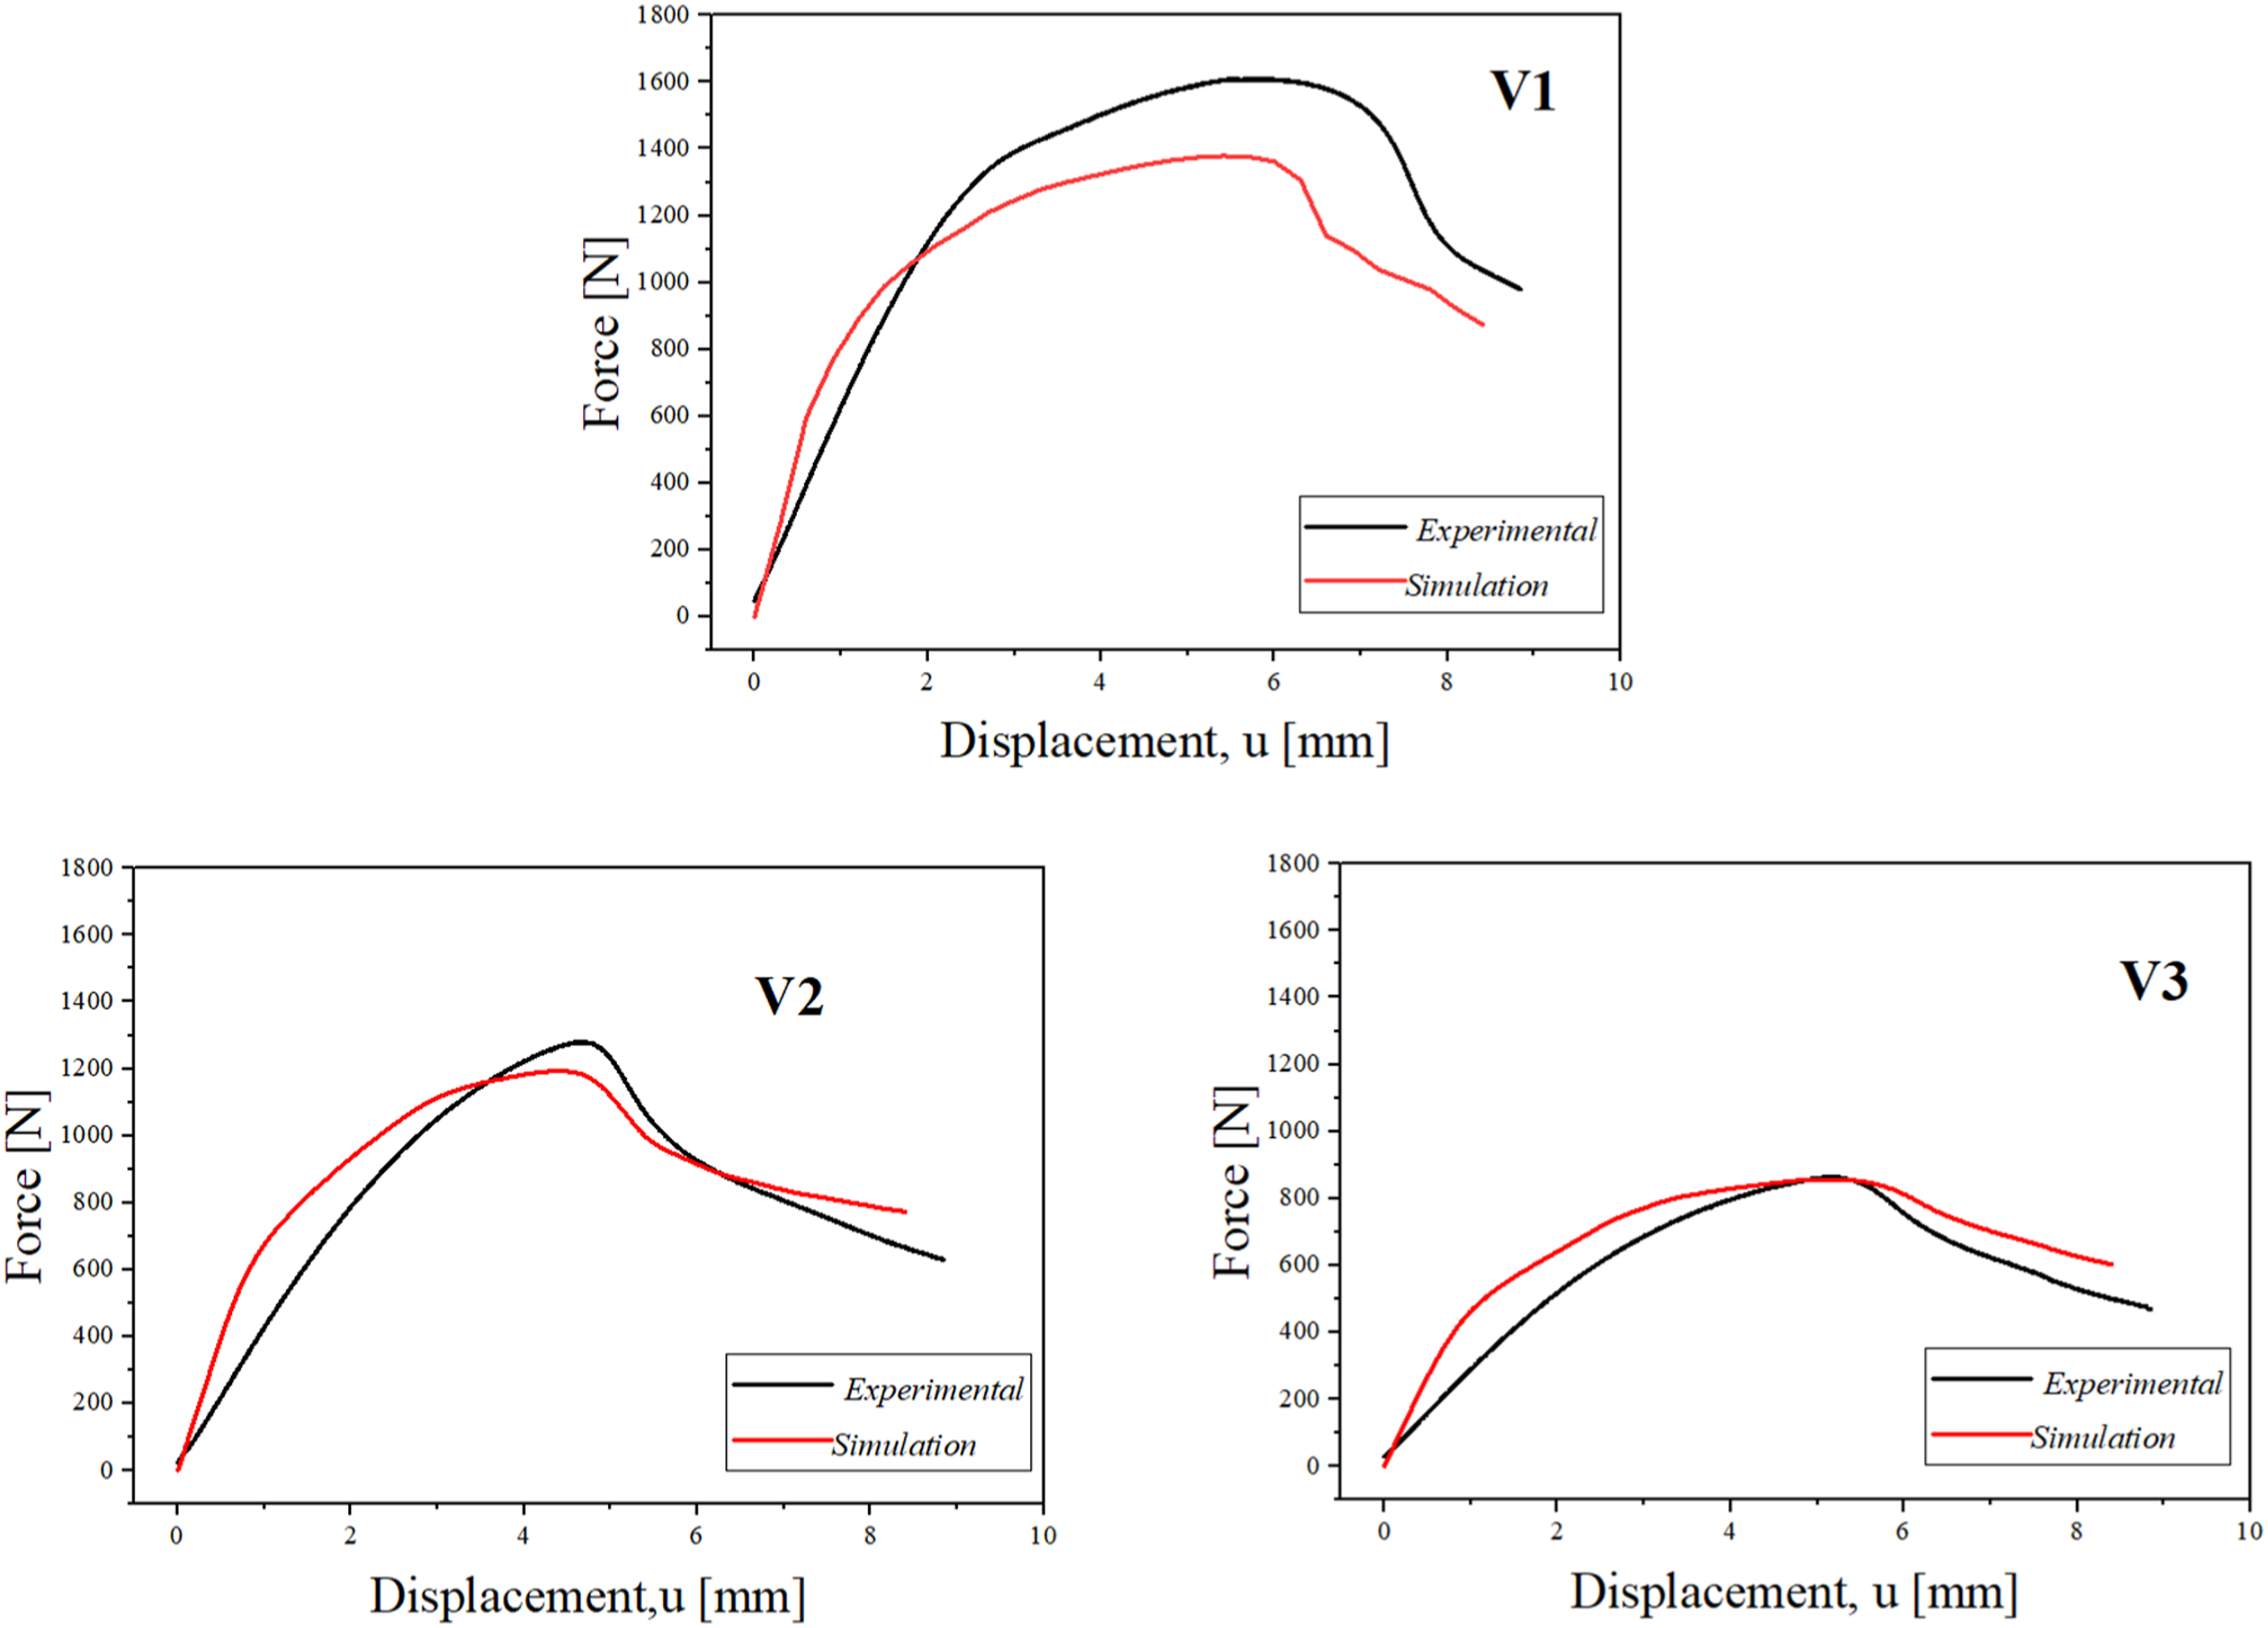
In addition, according to Figure 7, these observation shows sections narrowing which marks the auxetic behavior generated by inwardly deformation mode, a positive observation since this is a desired characteristic. 7 The study of Zhang et al., 47 proved the asymmetric geometry to provide a stiffer in-plane mechanical response and wide tunable auxetic behavior compared to a conventional anti-tetrachiral model. In this work, it was found conveniently similar to the modified fishbone-like structures, attributed to the anisotropic behavior.
Figure 8 illustrates the comparison agreement between simulation and experimental results. The force-displacement curves exhibit similar trends of strain loading, and a similar observation can also be made from the stored energy values in Figure 9, depicting their values inside the range and very close to the mean value. However, the values obtained in the numerical simulation also depended on the mesh size (M.S). For V1, the mesh of 2 mm selected gave good agreement of internal energy compared to the obtained in experimental analysis (Figure 9). However, for V2, the suitable mesh size was 1.5 mm, the same for V3, where the mesh size of 2 mm exhibited a higher EA value above the mean of both experimental and numerical simulation results. Indeed, both V2 and V3 exhibited an error percentage of>10% when considering a mesh size of 2 mm. Consequently, choosing the appropriate mesh size for each structure will be necessary due to these indifferences found for V2 and V3. However, it is important to note that the results were not solely dependent on mesh size. The study of Huy Bich et al. revealed that the imperfections in the geometry can also lead to the aforementioned behaviors affecting the indifferences in the specific energy absorbed.
50
Evolution schematic illustrating energy absorption (EA) according to the model experimented with and simulated with the mesh size of 2 mm. The average curve illustrated the mean value plotted from the three experimental runs. Thus, revealed best-fitting convergence when the structures subjected to a quasi-static compression test.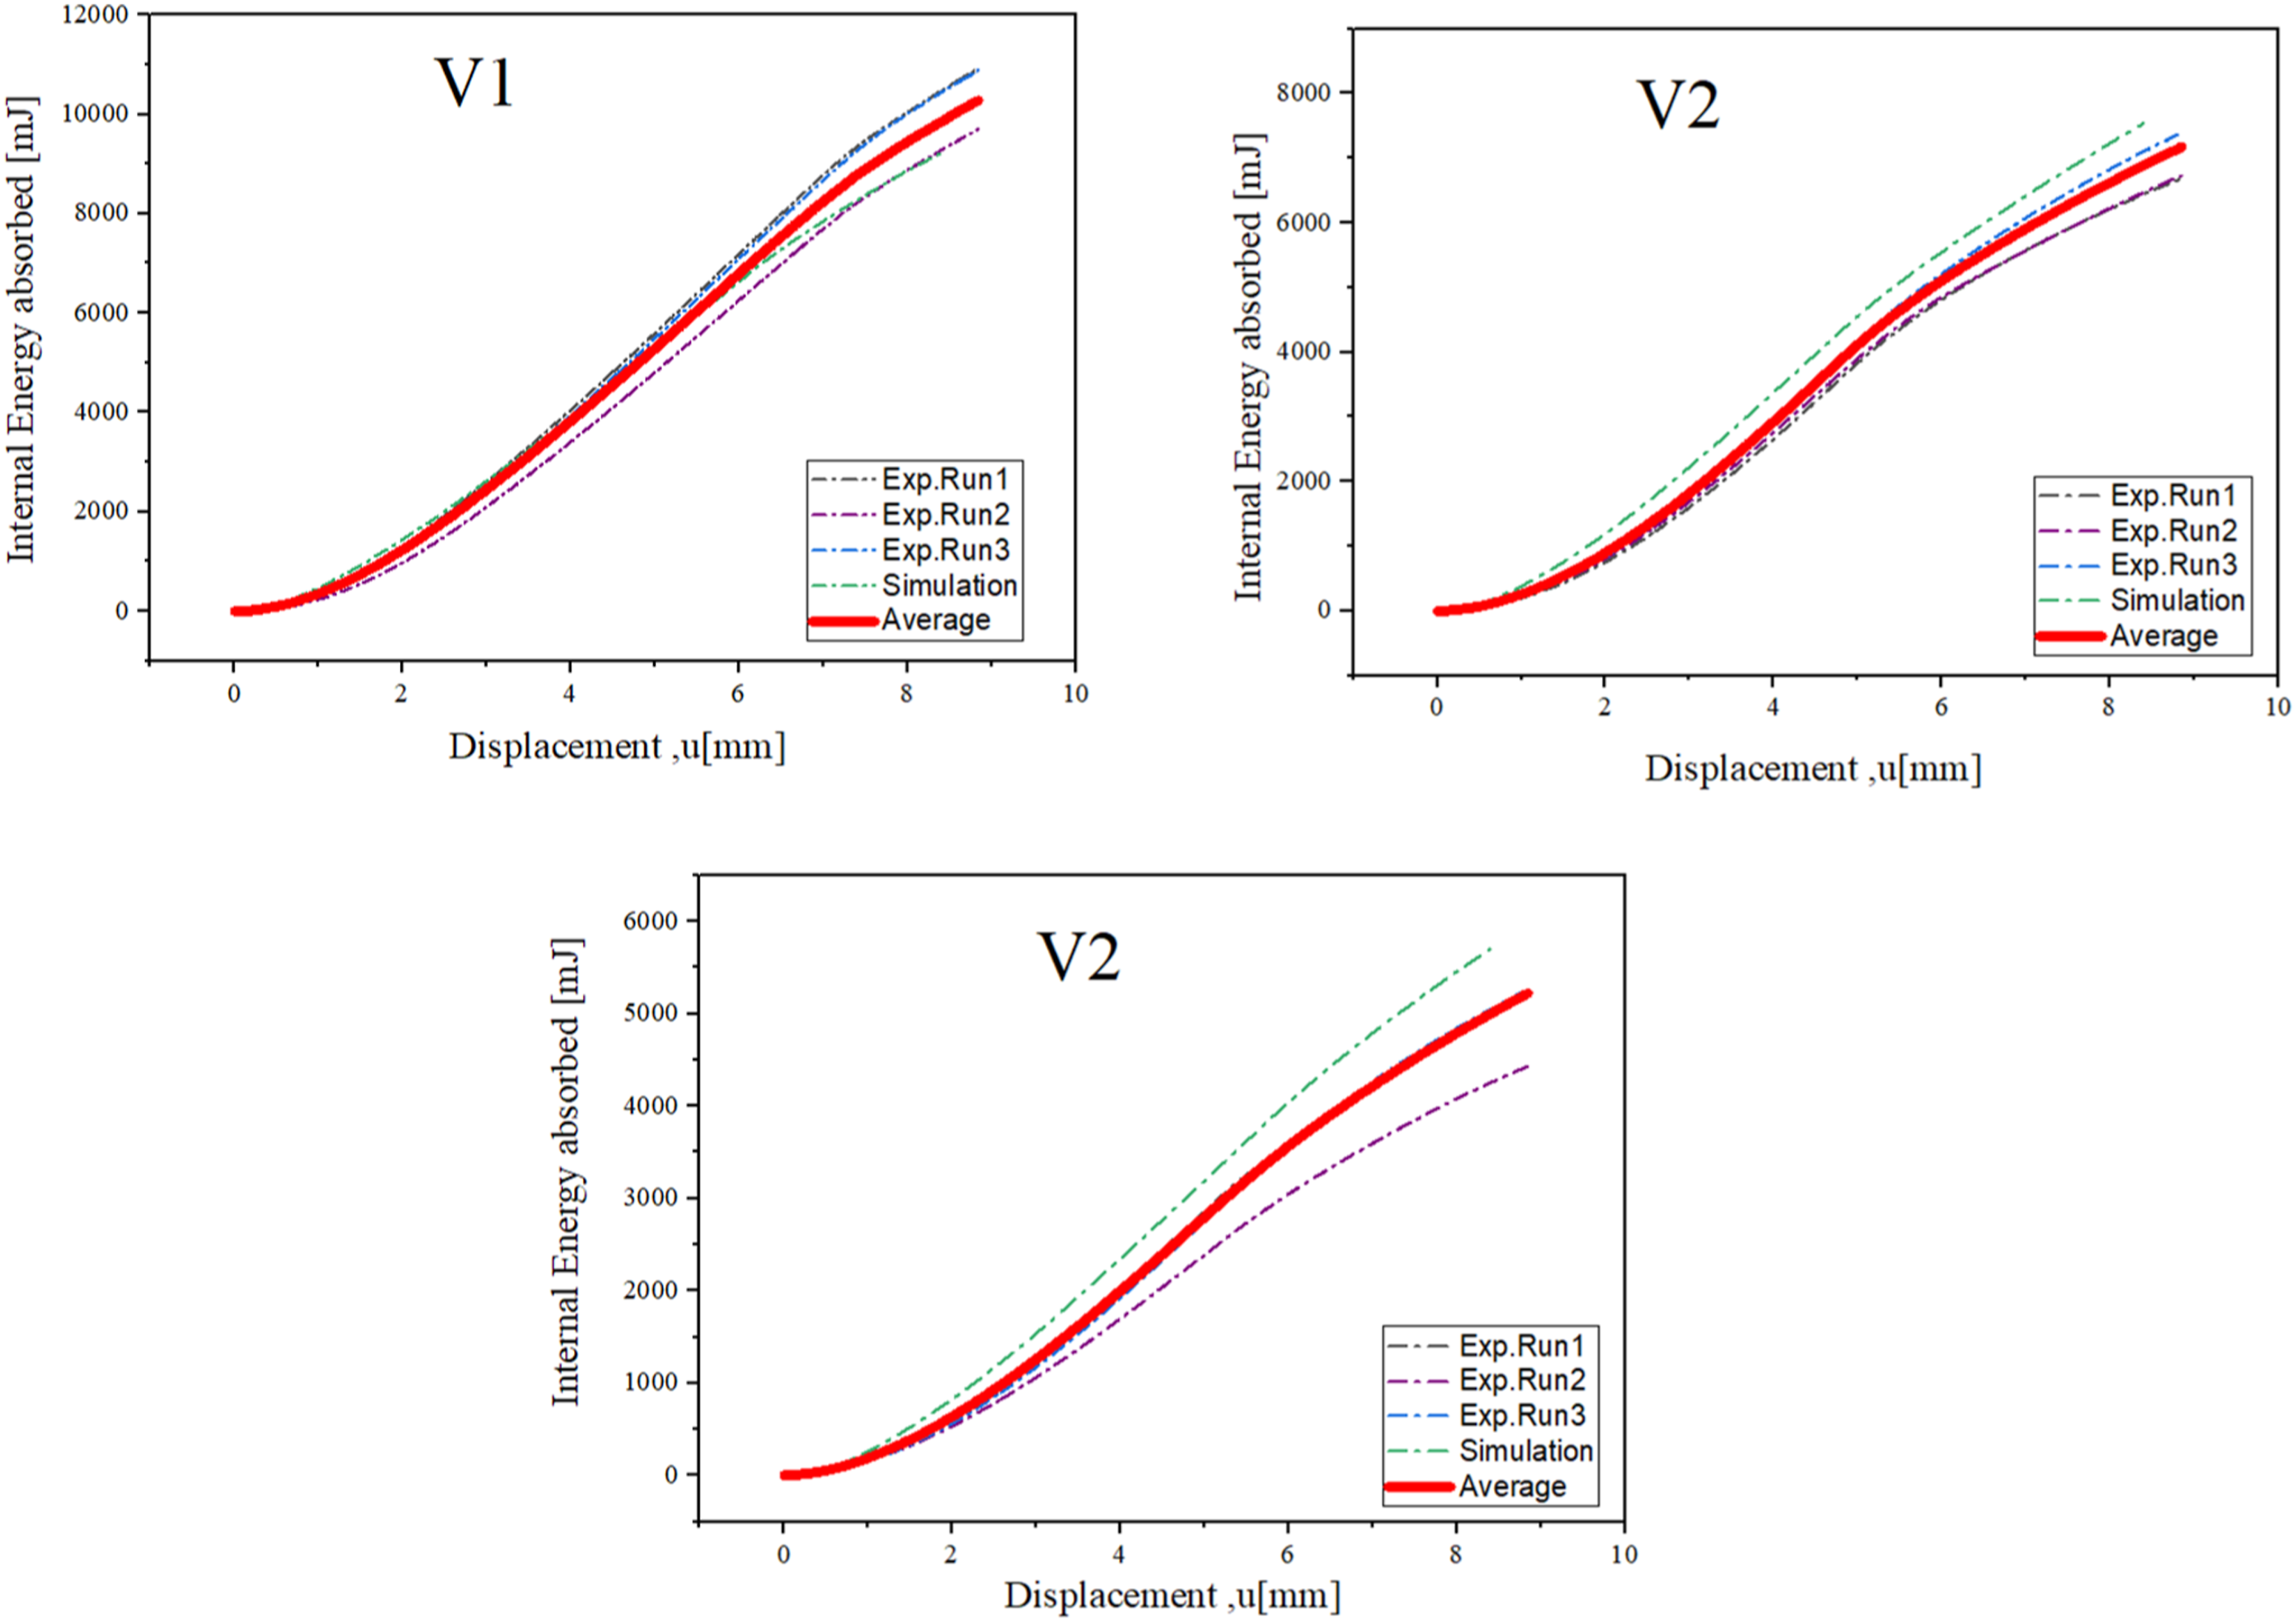
However, there are some differences between V2 and V3. Similar behaviors were shown in the study of Yonas et al., 51 where the forming process has to be considered, and the change should be as smooth as possible. Otherwise, the stress concentration can abruptly induce pre-deformation at the different points within the structure. Indeed, during the compression tests, it was also noticed that each specimen reacted differently. The rupture was not systematically in the same area of deformation exposed to the plateau stage region, leading to some specimens exploding, while others with the same model resisted. This behavior was in good agreement with both experimental and simulation results, illustrated in Figure 8. The deviations found in the deformations could come from the fact that the numerical simulation does not consider the cylinder rupture mechanism.
In brief, the further trend seems similar for V2, where the deformation in numerical and experimental did not appear in the same region. However, it might have been discussed and noticed as the behavior observed in the experimental results where the structures have undergone higher considerable progressive crushing in the plateau region. Thus, the deformation similarity could not be guaranteed in all as-tested specimens. Furthermore, a break in the structure might be observed during the experiment, which was the case in numerical simulation for V1 and V2, but not for V3.
Discussion
Fish cells were recently introduced by Naghavi Zadeh et al. 52 as metamaterial that exhibits Zero Poisson’s Ratio (ZPR) and compliance in two planar directions. Contrarily to this study designed new auxetic fishbone structures were found to store the maximum amount of energy and were revealed to exhibit unexpected deformation mode under a quasi-compression test. Thus, it must be mentioned to our utmost knowledge, that these structures have ultimately been characterized by optimum mechanical behaviors and anticipated within the element analysis to two negative Poisson ratio in consideration of morphing applications when actuation found in the longitudinal directions of cylindrical geometry. 7 Which, therefore, is a concern for the uptake of the study to the absorbing energy under deformation mode. As previously explained these two Poisson’s ratios were identified by the radius change to the longitudinal displacement and the torsion to stretch in this direction. To study all these mechanical behaviors, the bulk material, PETG, which has a high thermal property to resist under a low glass transition temperature of around 80°C 53 was used. However, as observed the humidity was suspected to affect the printed structures to be more rigid and increase the brittleness behavior of the parts. 54 Therefore, the observation of mechanical properties, pressure, maximum peak crushing force (PCF), and instantaneous crushing force varied according to the structure studied. Additionally, the re-entering deformation process generated the auxetic properties well, which is different in each structure. Thus, the results obtained in the physical deformation of the V1 structure explained well that the structure could withstand a high load and their energy absorption remains satisfactory.
In continuum mechanics, the mesh size influenced the mechanical properties of numerical simulation method,
55
where frequently, the smaller mesh size (MS) means more accurate results of the elements analysis simulations. However, the more the mesh size becomes small, the more the mismatch error between experimental and numerical data values increases. Therefore, according to equation (1), scaling up the density of the bulk material by a certain factor
Indeed, it was confirmed that the porosity defects from printing and low resolutions with slight precision were detected. Furthermore, the behavior depicted in experimental results (Figure 10) exhibited a mismatch value of the second run of batch-printed structures. However, the results remain close to the mean value. Thus, the behavior might be due to the standard parameters used during printing and the bulk materials of 3D printing, which primarily affects the element analysis considerably. Therefore, this might have affected the compression analysis during deformation and the dependence behavior of EA to loading stress distribution within the structure. As observed, the deformation mode captured in the elastic and plateau stage of all structures conducted the comparison; however, consideration of porous media of the structures affected the similarities of both analyses. The load-deflection response of the numerical and experimental analysis demonstrates this allowable correlation. Moreover, the EA was proportional to loading stress in both numerical and experimental analysis (Figure 10). Thus, with regards to Figure 10, both experimental and numerical analyses obtained from V2 and V3 structures show a decreasing loading force based on the degree of difference between V2.3 and V2 MS2 and V3.3 and V3 MS2, with a significant increase in the energy absorbed. Nevertheless, the rise in energy absorbed in V2 was not significant, whereas the decrease in V1 was substantial. Experimental and numerical results of load and internal energy absorbance of each specimen based on their behaviors in analysis.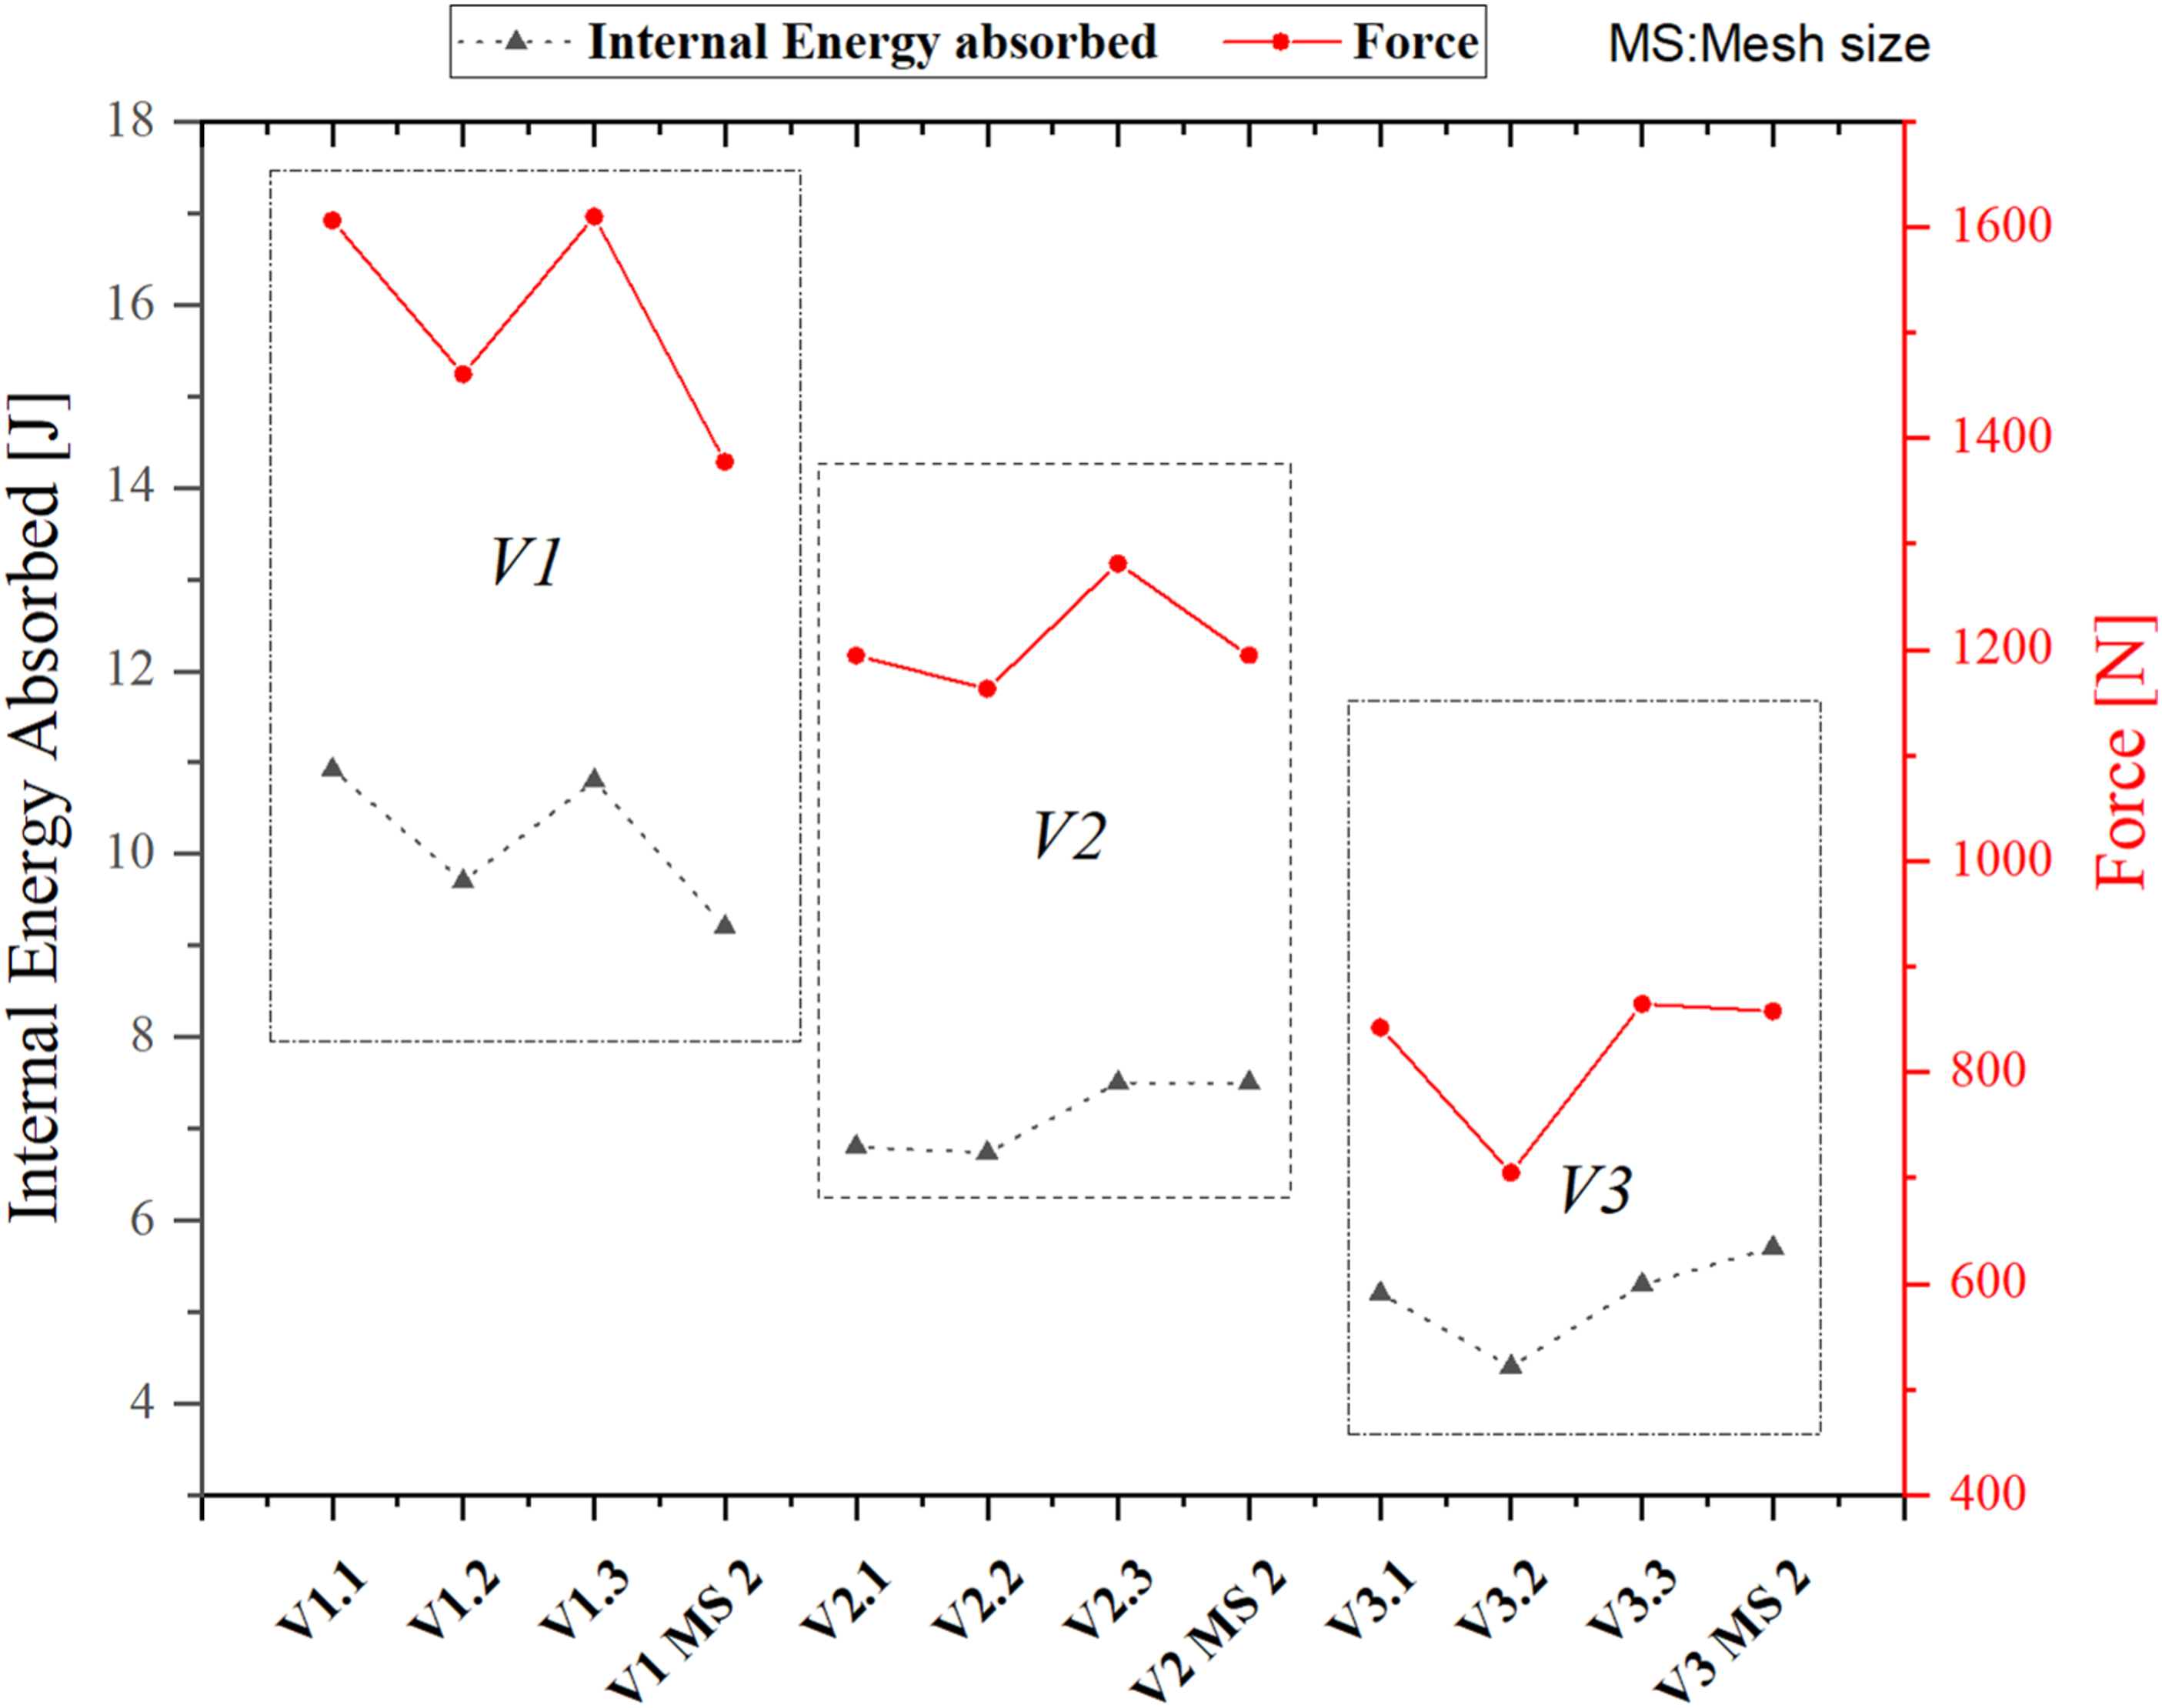
One possible reason for this behavior between experimental and numerical load-deflection responses and their energy absorbed could be attributed to non-homogeneous material properties in the tested specimens observed in both analyses. Therefore, it would be essential to propose a topology optimization on the structure to minimize stresses distributed. Furthermore, it is necessary to further future research and identify the effect of these discrepancies. Various effects might come to our attention and remain in our observations, such as the influence of the number of cells on the energy stored, 5 the impact of bulk material, and the effect of a topology modification to minimize internal constraints.
Conclusion
In this study, a comprehensive analysis of various structural models inspired by fishbone was introduced and analyzed. A primary modification was proposed based on the strut design, while high-quality CAD models were created and 3D printed via the FDM process with PETG as bulk materials. A significant series of FEA simulations with fine mesh were performed and compared with experimental analyses via quasi-static compression tests adhering to ASTM standards. Our analysis demonstrated allowable agreement correlation between both analyses, while the structures were revealed to exhibit auxetic behavior as well as similar deformation mechanisms. However, the V2 demonstrated negligible difference due to the distribution of deformation pressure differed from the experimental results. This divergence was suspected from the unique characteristics of V2 as shown during experimental analysis. Interestingly, the energy absorbed and the instantaneous crushing forces were found to be influenced by the structure’s design. The results show excellent integration potentials of these metamaterials due to concentrated loading displacement in both simulation and experimental analyses, observed as a reduction in the average energy absorption capacity and the distribution of loading stress. Specifically, these values decreased from 10.92 J to 5.2 J and from 1.61 kN to 0.7 kN, respectively, as a result of the structural modifications implemented.
Footnotes
Acknowledgements
The authors acknowledge the Euromed University of Fès (UEMF), African Scientific, Research and Innovation Council (ASRIC), INSA Lyon, and Universitité de Lyon for the support offered during this research.
Author contributions
“Conceptualization & methodology: Munyensanga. P, Eddahchouri. H and El Mabrouk. K; Software: Eddahchouri. H. and Morestin. F; Data curation: Eddahchouri. H, Munyensanga. P, Lamnawar. K; Investigation and supervision: El Mabrouk. K, Lamnawar. K, Bousmina. M. and Maazouz. A; writing-original draft preparation: Munyensanga. P and Eddahchouri. H; Project administration: El Mabrouk. K, Lamnawar. K and Bousmina. M. All authors have read and agreed to the published version of the manuscript”.
Declaration of conflicting interests
The author(s) declared no potential conflicts of interest with respect to the research, authorship, and/or publication of this article.
Funding
The author(s) received no financial support for the research, authorship, and/or publication of this article.