
Abstract
Accents provide information about a speaker's geographical, socio-economic, and ethnic background. An additional important variable in the social evaluation of accented speech is the listener's own accent. Just as with any in-group marker, there is a preference for accented speakers that sound like us. Here we employed an auditory version of the implicit association test to quantify own-accent bias. At a Welsh university, we recruited two groups of participants born and raised in distinct regions within the UK, Wales and England. These regions have a long-standing history of national rivalry. In Experiments 1 and 2 we show that the magnitude of the implicitly measured own-accent bias in both groups was comparable to biases based on visible group membership (e.g., race). In addition, Experiment 2 shows that this implicitly measured bias was large compared to the explicitly reported preference. The effect sizes of the in-group preference reported here may have societal impact.
Spoken language provides meaning beyond the semantic content of words. Even when the spoken language is the same, individuals from different regions of the same country often sound and talk differently. Accent refers to this variation in pronunciation of the same language spoken by different communities (Wardhaugh, 1992). While the grammar for different accents of a particular language is usually the same, the differences between accents are due to phonetic, phonological, and prosodic variations. Native speakers can perceive differences between accents (e.g., Clopper et al., 2012; Clopper & Pisoni, 2007) and identify which region of the country a given speaker is from (Clopper & Pisoni, 2004). Listeners make reliable social judgments about the friendliness and intelligence of the speaker (e.g., Clopper & Pisoni, 2007; Giles, 1970). A speaker's accent is therefore a valuable source of social information to the listener.
Accents are commonly associated with group membership and can index a particular geographical origin, ethnic background, or social class such as level and type of education (Labov, 2006). One of the most cited examples of the significant impact of accents is the biblical story of Shibboleth. In this story, two Semitic tribes are at war. After the battle, one tribe set up a barrier across a river which could only be crossed with the correct “password,” i.e., the pronunciation of the word shibboleth in the accent of the dominant tribe. There are several examples in history in which linguistic change and nationalist movements co-occurred underlining the role of language change in ethnic group relations (Khleif, 1979).
Long-standing research using explicit measures of accent preference has shown that listeners consistently rate standard accents positively (Gluszek & Dovidio, 2010; Pear, 1931; Ryan & Sebastian, 1980; see Bestelmeyer (2019) for review) and prefer their own regional accent or regional accents most like their own (Coupland & Bishop, 2007; see also Abrams & Hogg, 1987). Coupland and Bishop (2007) also showed that the accent identical to the listener's accent was rated similarly to Standard English in terms of social attractiveness and was next in line to standard varieties on prestige. This study highlights the importance of an additional variable in the social evaluation of speech – the listener's own accent.
Social Identity Theory (Tajfel & Turner, 1979) provides an explanation for our preference for speakers who sound like the listener. It suggests that humans perceive their environment in terms of categories in which they compare the sensory information to several stored representations of objects, individuals, or social situations. This social categorization is a fundamental process in person perception and involves classifying individuals in terms of the groups they belong to (in-group) or do not belong to (out-group). The purpose of this categorization is thought to simplify an otherwise overwhelming environment for the perceiver (Brewer, 1988; Fiske & Neuberg, 1990). However, this grouping or computational reductionism comes at a cost. Any group comparisons tend to be biased toward our own to protect positive social identity and distinctiveness, leading to a preference for the in-group at the expense of the out-group. This favoritism may occur without conscious awareness and involves a positive effect toward the in-group (Dovidio & Gaertner, 1993). In-group preference occurs even when the in-group is novel or based on an arbitrary categorization (Otten & Moskowitz, 2000). Social Identity Theory posits that individuals derive their sense of self from their group memberships. In other words, the groups individuals belong to (e.g., socioeconomic class) are an important source of pride and self-esteem and are so important to us that our identity is partially based on these group memberships. Thus, our groups shape our attitudes, determine the language we speak, and which accent we have (see also ethnolinguistic identity theory, Giles & Johnson, 1981).
Research in applied psychology demonstrates the impact of this own-accent preference. For example, a study on “ear witness” memory reported an interaction between the witness accent and offender's accent (Stevenage et al., 2012). Ear witnesses were less confident in their decision and more prone to confuse offenders who spoke in a different accent to their own. One explanation for this finding is that individuals with out-group accents may sound more alike and may therefore be more easily confused (Williams et al., 1999). Similarly, in higher education, North American students evaluated their North American accented teachers more positively and recalled more information from their lectures than from teachers who spoke English with a British or Malaysian accent (Gill, 1994). Research on accent perception in children, comparing native and foreign-accented speech, shows that this bias emerges early in life and cannot be entirely explained by the intelligibility of foreign-accented speech. Five-year-old children prefer native to foreign-accented speakers as friends even when they comprehend both speakers (Kinzler et al., 2007). In fact, when accent and ethnicity are pitted against one another for personal preference, accent is the dominant cue (Kinzler et al., 2009). These findings support the importance of accent in social categorization and group membership.
A traditional way of quantifying intergroup judgment is self-report measures such as feeling thermometers or, more specifically in language attitude research, ratings of particular accents on various social traits (e.g., Coupland & Bishop, 2007). Concerns of response and social desirability biases have been raised regarding this method, particularly for sensitive questions such as group prejudice (Hofmann et al., 2005). Yet, this method remains the most popular for determining language attitudes.
A newer assessment of bias is the implicit association test (IAT). This test is less prone to the disadvantages of direct measures, such as response or social desirability biases (Gawronski et al., 2015; Greenwald et al., 2009), and may therefore give a more accurate measure of the magnitude of group preference. The IAT is a computer-based sorting task that measures relative association strengths between pairings of concepts and attributes based on the participant's reaction times. In line with key concepts of associative learning, if a pairing is well established in memory a participant is assumed to respond more quickly and accurately than when a pairing is less well established (Greenwald et al., 1998). The test has been widely used in the stereotype literature assessing attitudes toward traditionally visual attributes such as race or sex. It has also been extensively used to show in-group favoritism based on, for example, race and religion (e.g., Axt et al., 2014).
The IAT was designed to measure unconscious attitudes that could predict behavior (Greenwald et al., 2009). The notion that this test taps into unconscious bias has been debated (Fazio & Olson, 2003) because participants can predict their biases (Hahn & Gawronski, 2019). In spite of this caveat, we used the IAT task because of the aforementioned and less controversial features that do not concern the measure of unconscious bias. First, it allows the quantification of association strengths between concepts and evaluations, and second, because participants are never explicitly instructed to rate the concept (i.e., the regional accent) avoiding many of the drawbacks of explicit questionnaires. These two features make the IAT an effective tool to measure spontaneous associations between accents and attributes.
Studies assessing language attitudes using auditory IATs are still rare. In a monograph, McKenzie and McNeill (2022) report a study in which the authors compare language attitudes toward a Northern and Southern English accented speaker in participants from England. The authors employed two different IAT tasks, one assessing implicit attitudes toward status/competence (e.g., using written words such as correct/not correct, high status/low status, educated/not educated) and another IAT that revolved around a social attractiveness dimension (e.g., using written words such as pleasant/not pleasant, friendly/not friendly). In-group bias was only found on the social attractiveness dimension. On the status dimension, the Southerners showed a bias toward the Southern accent, but the Northerners showed no bias toward either group. McKenzie and McNeill used a large participant recruitment area for their online IAT experiments. An alternative explanation for the inconsistent finding of in-group bias depending on IAT type may be that the area of participant recruitment for this study did not match the accent of the speaker used in the specific accent category. Listeners may therefore not have considered the speaker as part of their in-group. In addition, the Southern English speaker was a user of Standard Southern British English which is typically perceived as more prestigious than regional varieties (Coupland & Bishop, 2007) and may have diluted any in-group bias in the Northern English sample.
Other auditory IATs have concentrated on foreign accents. For example, Pantos and Perkins (2013) measured implicit and explicit attitudes toward a US and Korean accent. The authors showed an implicit bias in favor of the US accent in participants of predominantly US origin but an explicit bias in favor of the Korean accent. The authors discuss this divergence between implicit and explicit attitudes as a consequence of two separable underlying constructs or the possible result of a social desirability bias. Roessel et al. (2018) investigated whether foreign accents generally trigger negative associations irrespective of origin. Using auditory IATs with four different foreign accents, the biases that emerged were consistently negative. The negative associations were not moderated by foreign accent type (e.g., French vs Russian) and affected a variety of dimensions such as trust, affect, sociability, and competence. Given that these negative associations are spontaneous and happen across all accents, Roessel et al. concluded that these reactions are likely due to basic auditory perceptions of non-nativeness rather than national stereotypes against specific groups. While Roessel et al.'s finding could still be attributable to a general out-group stereotype, Dragojevic and Giles (2016) showed that disfluency of speech and intelligibility do also play a role in negative perceptions of accents.
A variety of partially intertwined reasons could lead to negative bias toward foreign-accented speech in a sample of native listeners. First, as mentioned previously, negative bias toward foreign accents could be the result of negative stereotypes of any accent that is not part of the in-group. Even when utterances are grammatically correct and intelligible non-native speakers are rated as less competent (Gluszek & Dovidio, 2010). Second, this bias could result from non-native accents being harder to understand than native accents. For example, Lev-Ari and Keysar (2010) showed that this difference in intelligibility and therefore greater processing effort meant that native speakers judged statements as less credible when spoken in a nonnative accent (see also Dragojevic et al., 2017). Related to this point, could be a reluctance to expend cognitive effort in processing nonnative speech (Rubin, 1992). In addition, foreign accents could be negatively perceived because listeners are not as familiar with processing foreign-accented speech. Familiarizing listeners with a nonnative accent increases comprehension (Gass & Varonis, 1984) and will also increase a listener's trust in what a nonnative speaker says (Boduch-Grabka & Lev-Ari, 2021).
Here we were interested in quantifying any in-group accent bias in two participant groups with mutually intelligible and familiar regional accents. We aimed to demonstrate any in-group bias in both sets of participants with different regional accents to ensure that a bias is not the result of greater acoustic attractiveness of one accent over the other. To this end, we employed an auditory version of the IAT in two experiments. At a Welsh university, we recruited two groups of participants born and raised in distinct regions within the UK, Wales and England. These regions have a complex and longstanding history of national rivalry and identity. This rivalry reflects a complex interplay of identity, politics, and competition, shaping both nations’ sense of pride and belonging. In experiment 1 we quantified own-accent bias and predicted that both groups will favor the accent of their in-group as predicted by Social Identity Theory. In experiment 2 we were interested in the relationship between the IAT scores and explicit measures in each group. Based on Social Identity Theory we predicted strong implicitly measured own-accent bias that is less pronounced in direct reports due to aforementioned issues with explicit measures (e.g., social desirability). We also explored moderating factors on the IAT scores that have not previously been explored in language attitude research using the IAT. These moderating factors included the listener's parental national identity, extent of cultural pride, and effects of exposure to the out-group accent in the English group.
Methods
Transparency and Openness
Data and materials are available online (https://osf.io/2ac9q/). The experiments were not pre-registered.
Participants
Experiment 1 included 111 volunteers. Fifty-two were from southeast England (30 females; mean age = 21 years) and 59 from northwest Wales (49 females; mean age = 22 years). Experiment 2 included 148 different participants from the same regions (Wales: n = 68, 61 females, mean age = 23 years; England: n = 80, 51 females, mean age = 21 years). We specified strict geographical criteria of origin and upbringing for our volunteers. Participants from the southeast of England (Surrey, Kent, Greater London, East and West Sussex) had lived all their pre-university life in this region and had resided in North Wales for varying durations (0–144 months; mean duration = 15.6 months across the full sample). The English participants had not lived anywhere else within the UK. Our Welsh participants had not lived outside northwest Wales (Anglesey, Gwynedd, Conwy, Denbigh, Flintshire). Participants were recruited at Bangor University. Seventeen participants responded to the recruitment advert but were not included because they did not meet the criteria (e.g., moved as children). The ethics committee at Bangor University approved the experimental protocol.
The sample sizes were guided by a power calculation using G*Power (Faul et al., 2009) based on pilot data (see Supplemental online materials (SOM)). G*Power with an error probability threshold of .05 and a statistical power of .9 revealed that a sample size of n = 50 in each group would be required to detect an effect size difference of d = .59.
IAT Stimuli for Experiments 1 and 2
To create the auditory stimulus material, we recorded 26 accented speakers (13 southeast English; 13 northwest Welsh), who had just arrived at Bangor University. These speakers were from middle-class backgrounds, educated in state schools, and born and raised in one of these areas. Speakers were recorded while reading two short paragraphs and a list of 50 semantically neutral words in a sound-attenuated booth. Recordings of ten speakers were shortlisted by two native English speakers for detailed stimulus evaluation. Care was taken that none of the Southern English speakers had a Standard Southern English accent. Following this screening, the material was extensively piloted on participants who did not partake in the reported IAT tasks.
Five participants from each region rated the set of neutral recorded words (e.g., paper, amount, part, interior) using an analogue scale on “prototypicality” for each accent. In this short stimulus selection task, we presented spoken words, and the participant was asked to use a slider to rate single words on how typical each one sounded for each region (from “extremely typical” for a given region to “extremely untypical” for this given region). Based on this pilot data we selected a subset of the 10 most typically accented words for each region spoken by 2 female speakers per region (5 words per speaker; “bathroom,” “contrast,” “material,” “part,” “profile,” “around,” “barrel,” “farm,” “pamphlet,” “pantry”). The selected speakers were from Croydon (South London), Crawley, Llangefni, and Bangor (Gwynedd). Using a two-alternative forced choice task these spoken words were correctly categorized into Northwest Welsh and Southeast English accents with an average accuracy of 93% in an independent sample of 44 participants from both regions.
The final stimulus material consisted of 20 written words and 20 spoken, accented words (10 neutral words spoken in each accent). The written words were socially valanced attributes (10 positive: adorable, attractive, capable, clever, dependable, educated, friendly, likable, smart, trustworthy; and 10 negative: clumsy, dishonest, disloyal, hateful, hostile, ignorant, repulsive, stupid, uneducated, unpleasant). We selected 10 semantically neutral words pronounced in a typical northwest Welsh and southeast English accent by four female speakers (5 words per speaker; “bathroom,” “contrast,” “material,” “part,” “profile,” “around,” “barrel,” “farm,” “pamphlet,” “pantry”).
Additional Materials for Experiment 2
In addition to the IAT, we also administered an adapted version of the Multigroup Ethnic Identity Measure (MEIM; Phinney, 1992) to assess explicit cultural identity. The original version of this questionnaire is available online (https://www.facs.nsw.gov.au/__data/assets/pdf_file/0004/536755/MEIM-questionnaire-Authors-summary.pdf). We replaced “ethnicity” or “ethnic group” with “cultural group” (e.g., Welsh) with all questions pertaining to the group of the respondent. The questionnaire consists of two subscales, “Identity Search” and “Sense of Belonging, Affiliation and Commitment.” A high score on the first subscale means the individual is keen to learn more about the culture and a high score on the second subscale indicates a person with greater cultural pride. We refer to the MEIM as a questionnaire on cultural pride.
We also included a feeling thermometer. Participants were asked to indicate their relative preference for Northwest Welsh and Southeast English individuals on a 7-point scale (from “I strongly prefer X to Y” to “I strongly prefer Y to X”). Positive scores indicated an in-group preference and centered at 0 (no preference), i.e., values ranged from −3 to +3. For purposes of illustration in Figure 3B the data were coded in the same way as the d’ score so that positive numbers indicate “Pro-Welsh” bias and negative numbers indicate “Pro-English” bias.
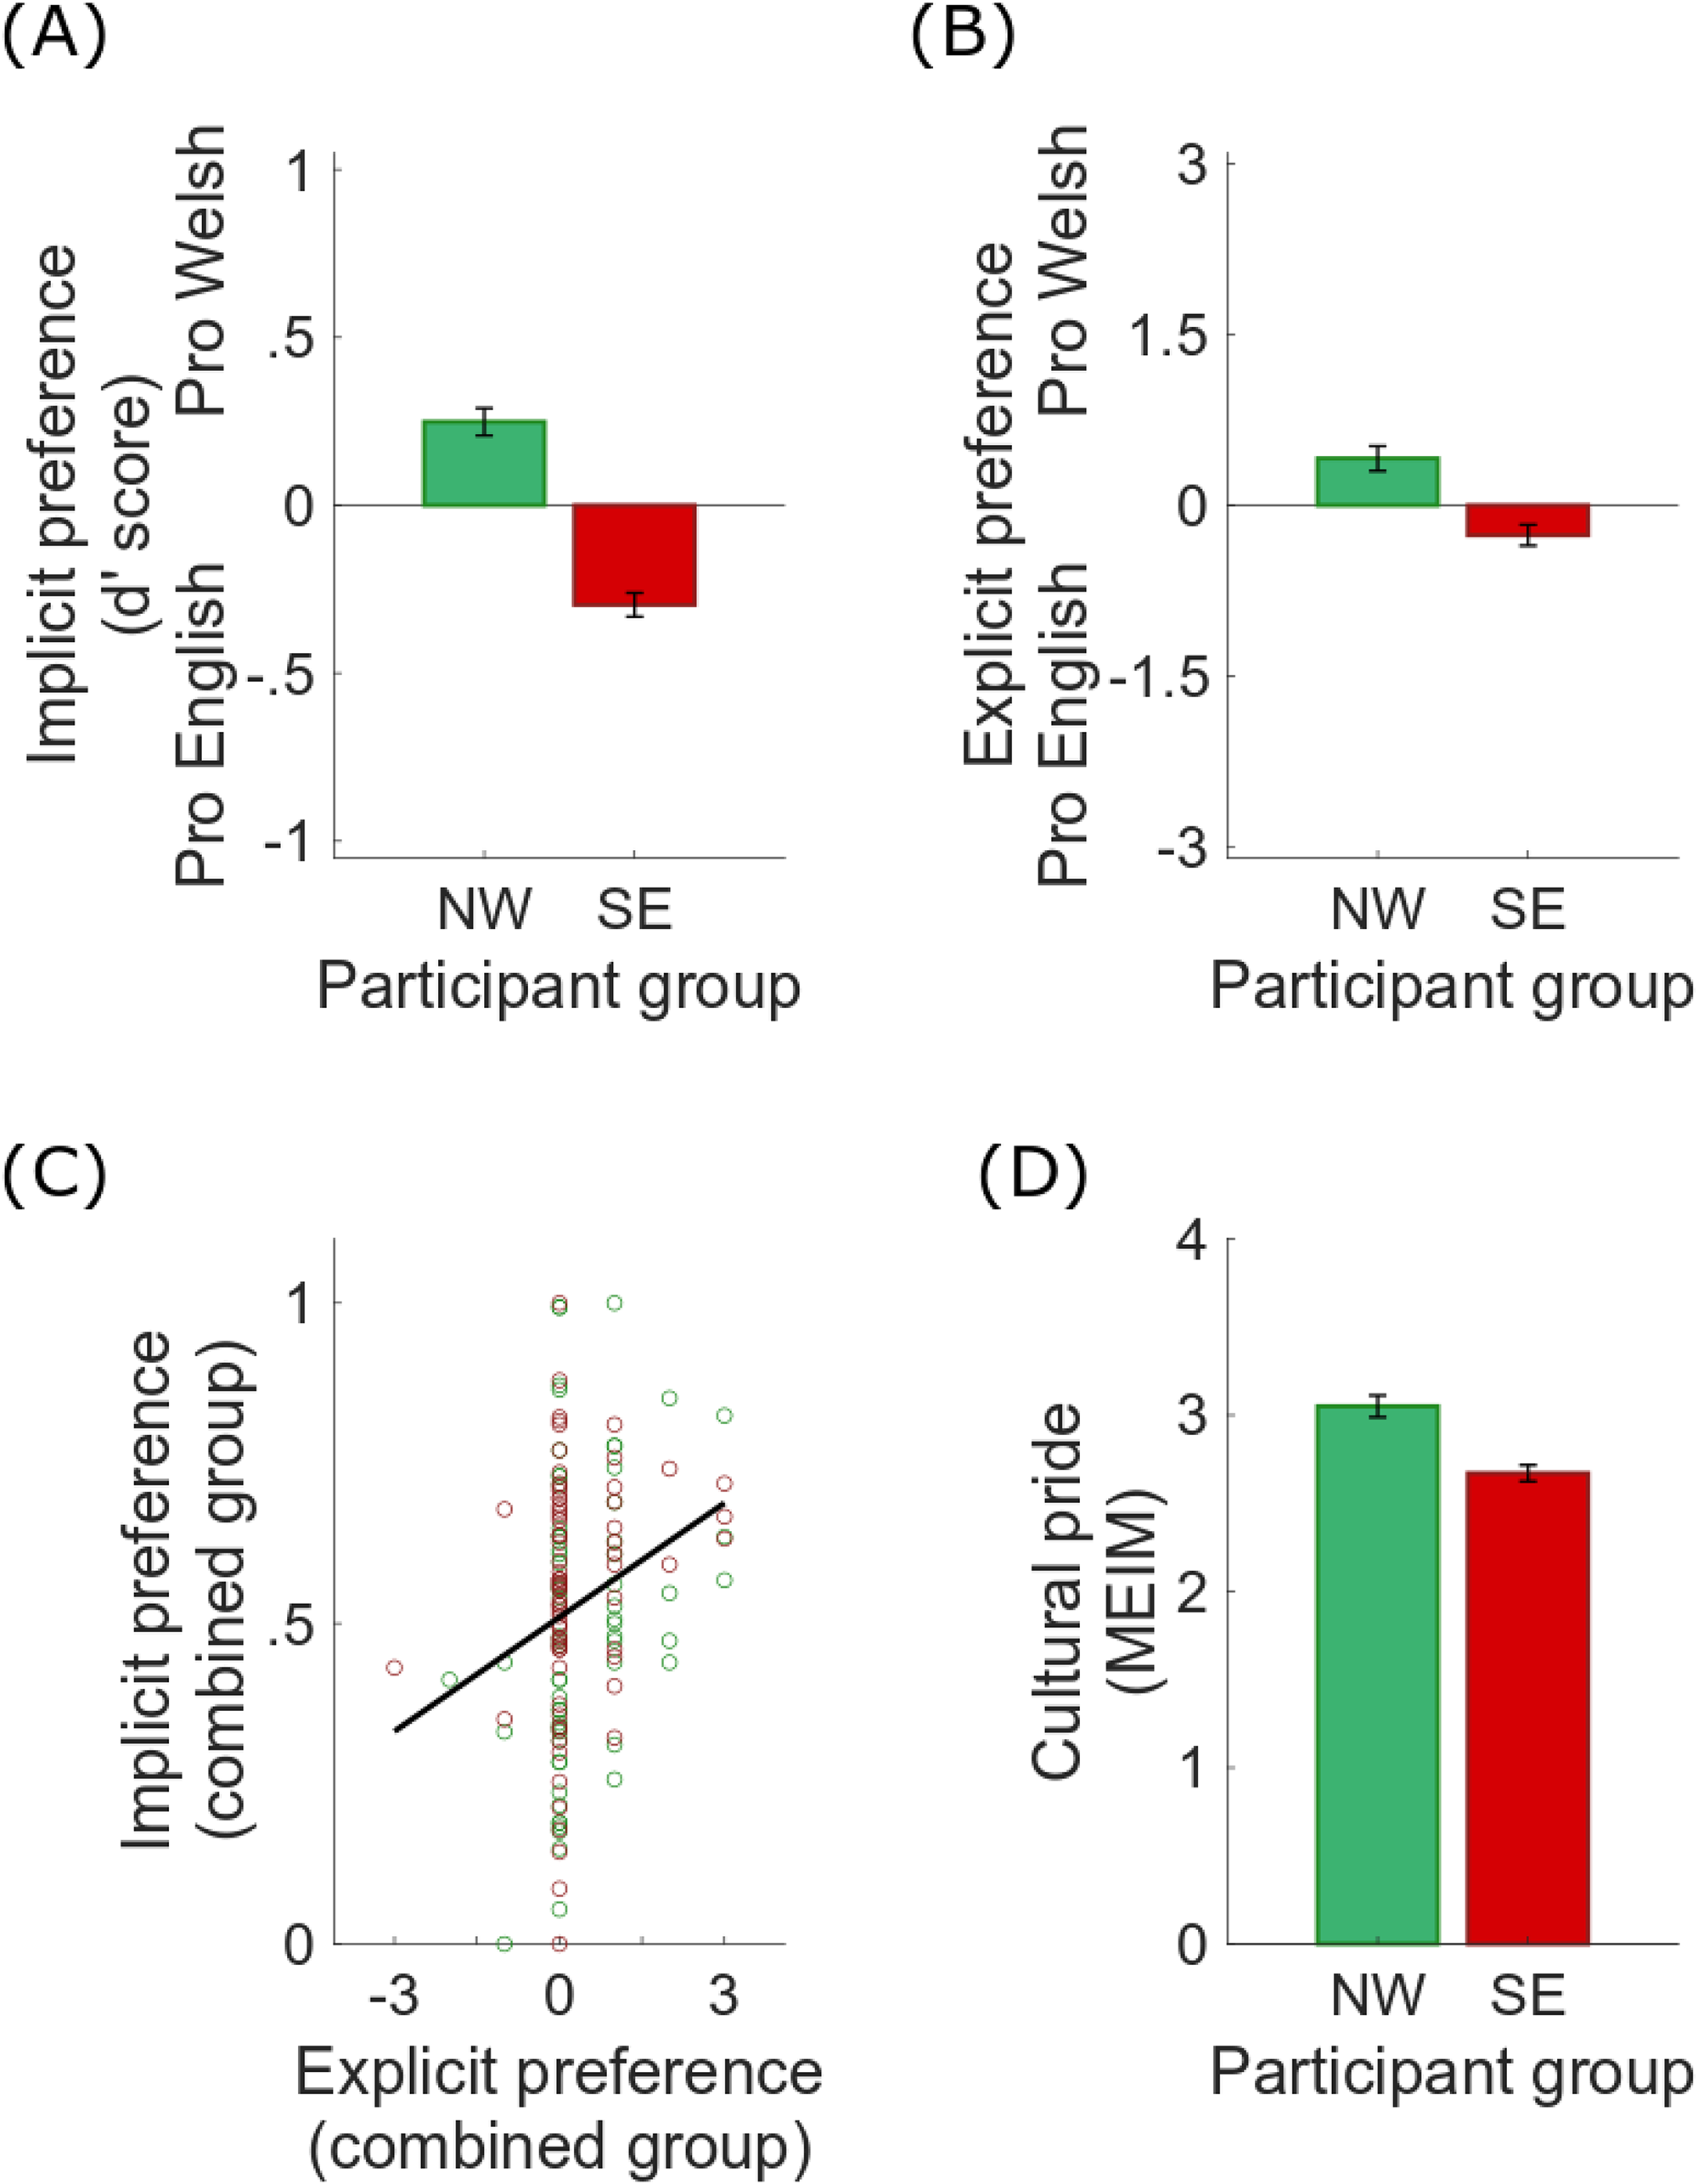
Results of the IAT and questionnaires in Experiment 2.
Procedure
The IAT was the same in both experiments and was run on a non-networked PC in a quiet lab space. Participant demographics were recorded before running the IAT. The IAT was built using the Psychtoolbox-3 (Brainard, 1997) for Matlab (2016; The Mathworks Inc). The task consisted of five blocks and is illustrated in Figure 1. Throughout all five blocks of the IAT, the task-relevant category labels remained in the upper corners of the screen. Participants were asked to react as quickly as possible while being accurate. Accents were presented via headphones and written words were presented in the center of the screen. In Block 1, participants categorized 20 randomized northwest Welsh and southeast English accented words representing social groups (target concept). In Block 2, participants categorized 20 randomized positive and negative written words representing associated attributes. Volunteers used separate computer keys (“z”/“m”), corresponding to the labels in the left and right corner of the monitor, to indicate whether each accent was Northern Welsh (NW) or Southern English (SE) and to indicate whether each written word was ‘good’ or ‘bad’. In Block 3, these two sorting tasks were combined such that written or accented words had to be sorted into one bimodal category. The labels in the top corners of this combined sorting task were “Welsh/good” and “English/bad.” After the first 20 trials (=practice block), participants were reminded to react as quickly as possible. Block 4 was a repetition of the first block except that the target concept labels swapped sides. Block 5 was a repetition of Block 3, except that the top corners were now labeled “Welsh/bad” and “English/good.” Again, after 20 trials the participants were reminded to respond as quickly as possible. Block 1/3 and Block 4/5 were counterbalanced across the sample.
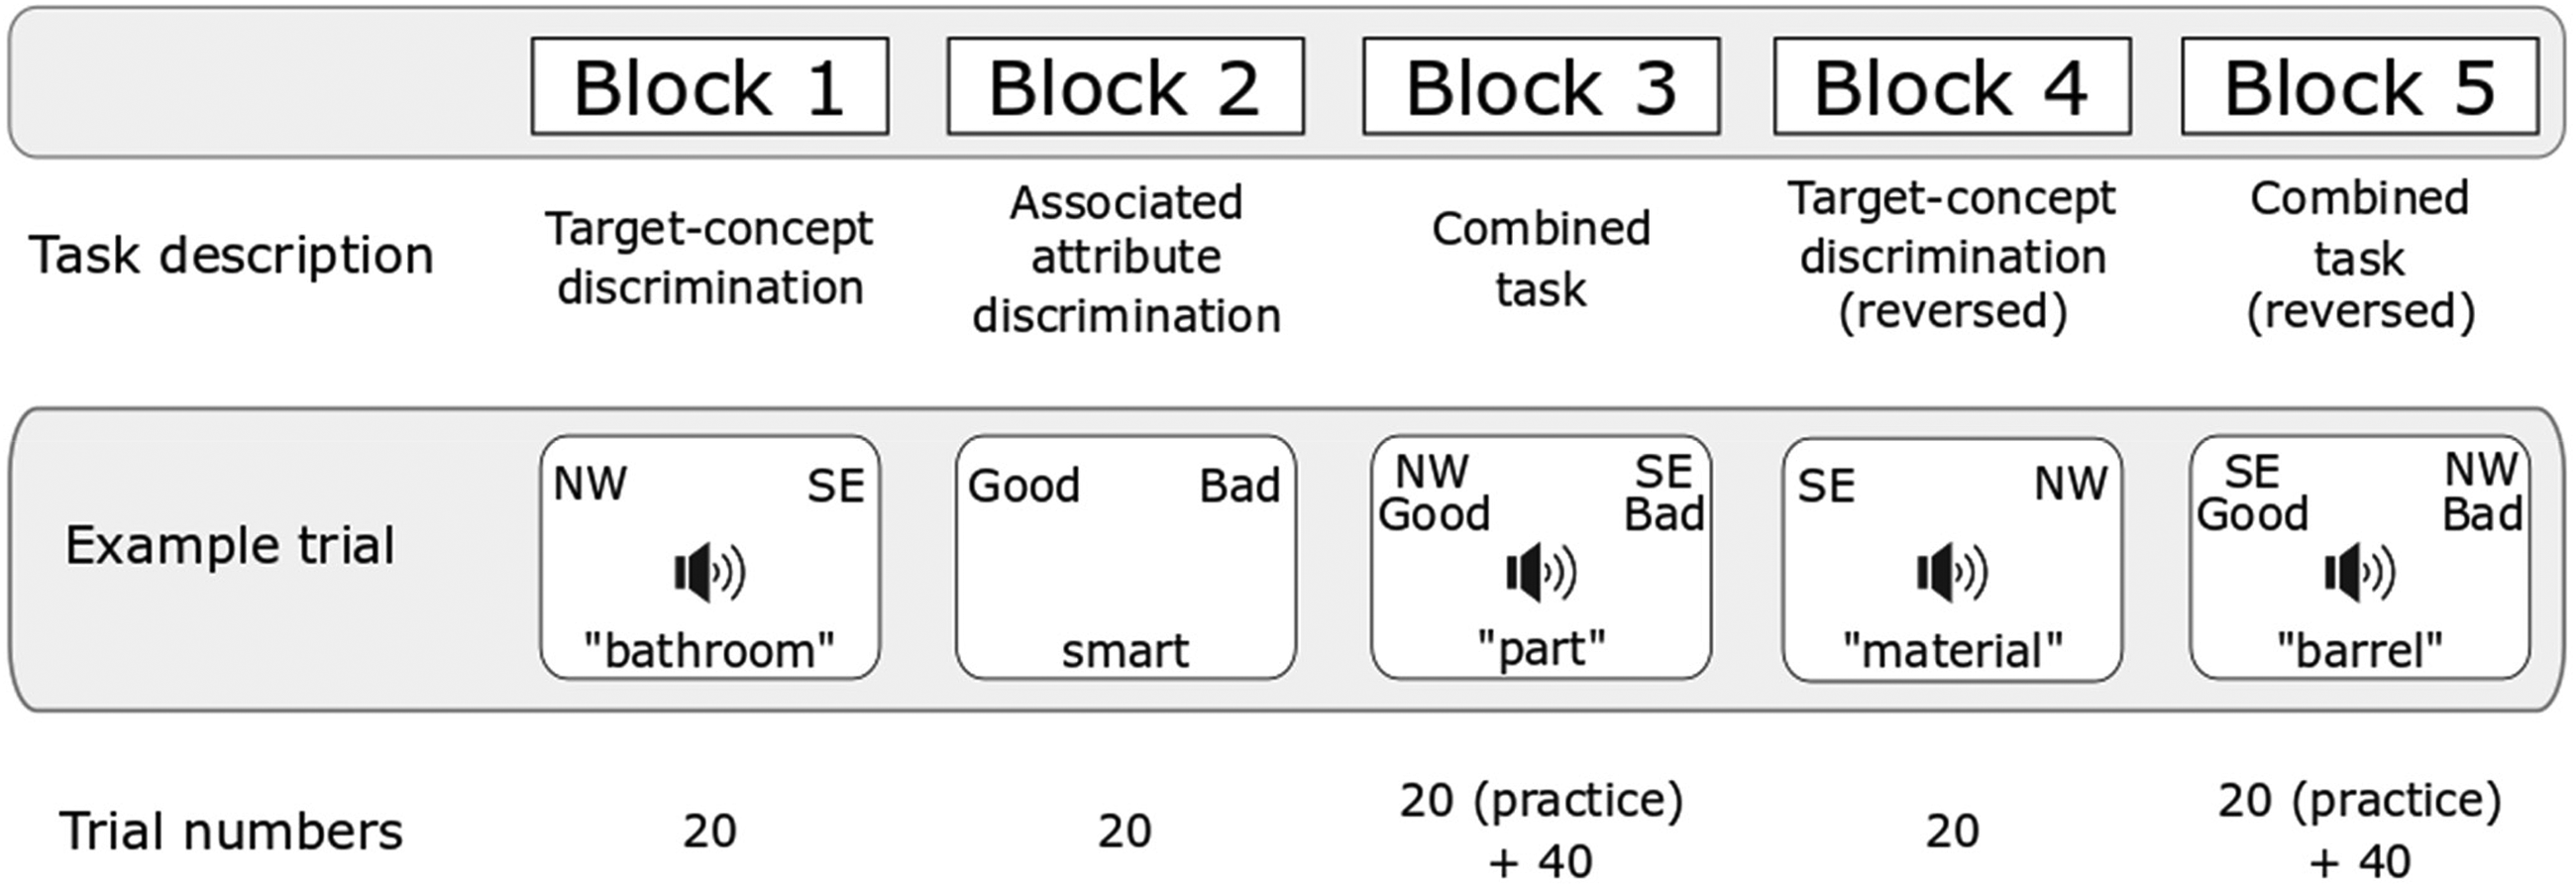
Illustration of the IAT used in Experiments 1 and 2.
In experiment 2, the cultural identity questionnaire and feeling thermometer were administered after the IAT task as a paper and pencil questionnaire. The IAT was always administered before the questionnaire rather than counterbalanced because the order of test administration (implicit first, explicit first, or counterbalanced) has been shown to have no effect (Nosek et al., 2005).
Data Analysis
Association strengths were computed as d’ score using Greenwald's revised algorithm (Greenwald et al., 2003; see also Greenwald et al., 2022). To calculate the d’ score we used data from Block 3 and Block 5. We divided Block 3 into two blocks equivalent to Greenwald's B3 (first 20 practice trials) and B4 (remaining 40 trials). Similarly, we divided Block 5 into two blocks equivalent to Greenwald's B6 (first 20 practice trials) and B7 (remaining 40 trials). We eliminated any trials with response latencies greater than 10s and less than 400ms. We calculated four separate means of correct responses for each block (B3, B4, B6, B7). We also computed one pooled standard deviation for the 20 practice trials in each block and all remaining trials in Blocks 3 and 5. We then replaced each error latency with the block mean and added 600 ms. We averaged the values for the 20 practice trials in each block and the 40 remaining trials in each block and computed two differences equivalent to Greenwald's B6 – B3 and B7 – B4. We then divided each difference by its associated pooled standard deviation and averaged the two quotients. Scores above 0 indicate a bias favoring northwest Welsh over southeast English. Scores below 0 indicate a bias in the opposite direction. For whole group analyses of the d’ score, we linearly rescaled the data so that all measurements were on a comparable scale lying between 0 and 1 using the ‘‘Min-Max’’-normalization. This rescaling preserves relationships among the original values.
Results
Experiment 1
Figure 2 illustrates the IAT d’ score for each participant group. Positive scores indicate a bias toward northwest Wales and negative scores indicate a bias toward southeast England. Welsh participants generally showed a positive bias while English participants typically showed a negative bias. A wide range of individual scores is indicated by the circles in each group. IAT d’ scores were significantly different between the two groups (t(100) = 8.69, p < .0001, 95%CI [.38, .60], Cohen's d = 1.72). When scores for each group were separately min-max rescaled to compare the magnitude of in-group bias, both groups showed similarly large d’ scores (t(113) = −.741, p = .46, 95%CI [−.10, .04], Cohen's d = −.14).
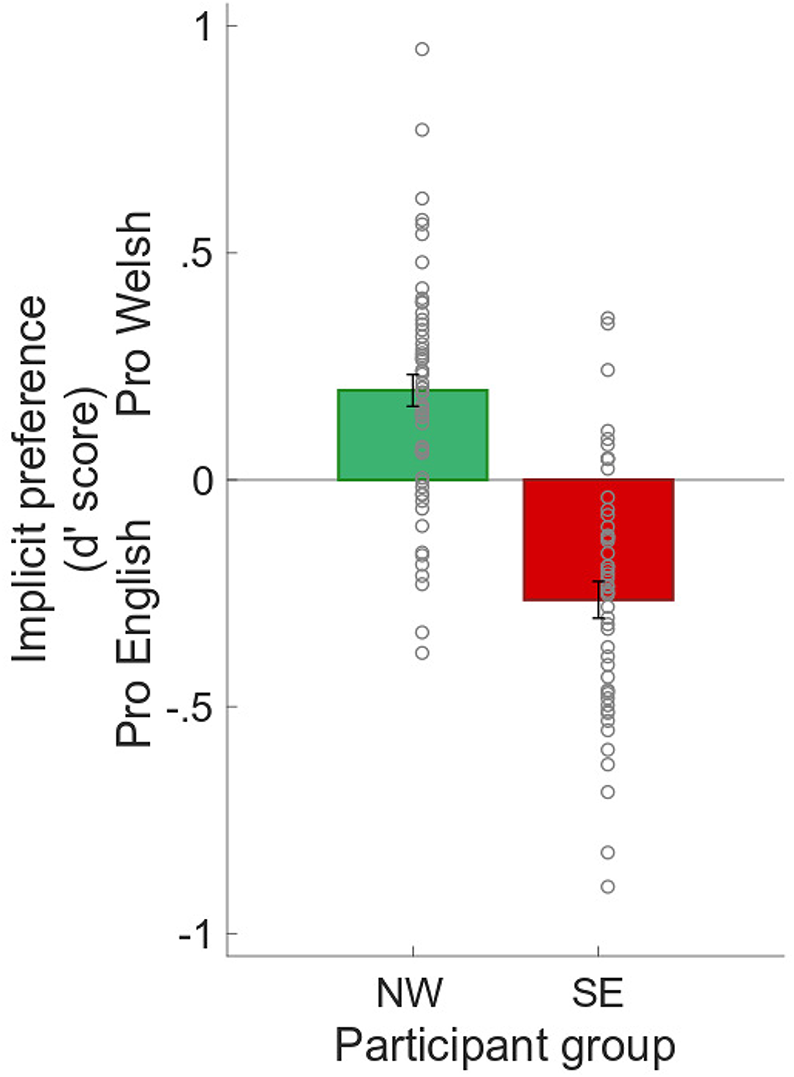
Results of the IAT in Experiment 1.
Experiment 2
Figure 3A illustrates the IAT results for each participant group. IAT d’ scores were significantly different between the groups (t(146) = 10.15, p < .001, 95%CI [.44, .65], Cohen's d = 1.67). The magnitude of in-group bias in the two groups was similar (t(146) = 1.59, p = .11, 95%CI [−.01, .12], Cohen's d = .26).
Figure 3B shows an explicit in-group preference in both groups. Participants significantly preferred members of their national group when asked directly (one-sample t-test on Welsh participants t(67) = 3.77, p < .001, 95%CI [.19, .63], Cohen's d = .46 and English participants t(79) = 2.85, p = .006, 95%CI [.08, .45], Cohen's d = .32). This preference was not significantly stronger in one group or the other (t(146) = 1.05, p = .29).
A one-sample t-test on combined group data revealed a significant in-group bias on the explicit test with a small effect size (t(147) = 4.68, p < .001, 95%CI [.19, .47], Cohen's d = .39). After recoding the d’ score of the English group to be on the same positive scale as the Welsh group, a one-sample t-test on these same participants also revealed a significant in-group bias on the implicit test with a large effect size (t(147) = 10.26, p < .001, 95%CI [.22, .33], Cohen's d = .84). A value of 0 (i.e., no bias) was used as test value in both cases.
Figure 3C illustrates the small positive correlation between implicitly and explicitly measured in-group preference across both groups (r = .24, p = .003).
Participants of each group identified as clearly culturally Welsh or English. Figure 3D illustrates the score of the MEIM questionnaire for both groups. The Welsh group showed a significantly higher score than the English group (t(146) = 5.02, p < .001, 95%CI [.23, .53], Cohen's d = .83).
Exploratory Moderating Effects on In-Group Bias
We examined the role of parental nationality on rescaled d’ scores across both groups (congruent/incongruent with that of the participant). Participants who were raised by parents of the same nationality as their own had a significantly larger own-group bias than participants who were raised by parents of a different nationality (t(239) = 3.29, p = .001, 95%CI [.03, .14], Cohen's d = .47). Welsh participants who grew up with Welsh as their dominant language had a significantly larger own-accent bias than Welsh participants who grew up with English as the dominant language (t(116) = −2.76, p = .007, 95%CI [−.27, −.04], Cohen's d = −.51). There was no correlation between implicit own-group preference (d’ score) and cultural pride (MEIM; r = −.06, p = .51). Duration of stay in Northwest Wales (range = 1–96 months; M = 14.8; SD = 20.2) did not correlate with the d’ score of the English group (r = .02, p = .82).
Discussion
The experiments aimed to quantify implicit in-group bias based on regional accents. We report associations for accents and attitudes that are comparable in strength to the effects seen in the other race literature of white respondents (Axt et al., 2014; Birmingham et al., 2015; Rae et al., 2015). The degree of in-group bias separating participants from Northwest Wales and Southeast England was large and was not weakened by exposure to the out-group accent in the English participants. Implicit preference of the in-group was not linked to the extent of cultural affiliation and pride. The data from a simple behavioral test illustrate that social bias is not only based on visible characteristics such as race or sex but highlights the role of regional accents within the same country as a salient cue to group membership.
Own-accent bias may have social justice implications, contributing to systemic inequalities across various aspects of life, including employment, career progression, education, and social mobility. Levon et al. (2021) found that individuals with Standard Southern British English accents are often perceived as more competent and suitable for high-status jobs compared to those with regional or working-class accents. The current experiments highlight an additional or competing variable, which is a preference for the accent of the in-group. This preference could lead to a biased work environment where talent and competence are overshadowed by a bias toward in-group speakers. Therefore, addressing accent bias is crucial for promoting fairness and equality, as it may affect an individual's access to opportunities and their treatment in various social contexts.
Possible moderating factors of own-accent bias were examined across both IAT datasets. Own-accent bias was stronger in participants who shared the same national identity as their parents. This is in line with previous research showing the considerable influence of parental national identity on their children's perception of their own identity (Muldoon et al., 2017). Similarly, dominant language use (English or Welsh) in the Welsh group affected own-accent bias. Here participants who grew up with Welsh as their primary language had stronger own-accent bias (in English) than Welsh participants whose primary language was English. Prior research has emphasized the role of the Welsh language in shaping the Welsh identity (Bourhis et al., 1973; Dabrowska, 2017) and strengthening the affiliation with the Welsh culture (Ellis et al., 2018). The extent of cultural pride and belonging was also considered as a moderating factor of own-accent bias across both groups as measured by the MEIM questionnaire. While MEIM scores showed that participants of each group identified as clearly culturally Welsh or English, the degree of pride and engagement with each respective culture did not covary with implicit bias toward own accent. In the case of regional accents, at least in our study, cultural pride did not appear to devalue the out-group.
Both bias measures revealed a preference for the in-group, but the effect size was large for the IAT in contrast to the explicit measure. This finding may be the result of individuals being less likely to admit to in-group favoritism. The correlation between the implicit and explicit measures was also modest (see also McKenzie & Carrie, 2018). This is a common finding in attitude research based on visual cues (e.g., Charlesworth et al., 2023) and may be due to individual differences in the ability to consciously access, or admit to, biases toward groups. It may also be the result of the possibility that implicit and explicit preferences are distinct but related processes that contribute to social evaluation (Ranganath et al., 2008). That said, when following a bogus pipeline approach, in which participants are told that their responses on the explicit questionnaires are being monitored to force more truthful answers (e.g., with a lie detector), a stronger correlation between explicit and implicit measures is reported (Nier, 2005). Thus, the conceptual separation between implicit and explicit attitudes might be exaggerated in the literature (see also reports by Monteith et al. (2001) and Olson et al. (2007) from different domains). Language attitudes are traditionally measured explicitly. The current research emphasizes that including implicit measures are beneficial for obtaining a more complete picture of group bias.
The difference in d’ score between our participant groups was large and comparable in size to that found in the other race literature (Axt et al., 2014; Birmingham et al., 2015; Rae et al., 2015). In-group biases are not necessarily harmful. According to Social Identity Theory (Tajfel & Turner, 1979), own-accent bias could contribute to stronger social identity and group cohesion among speakers of the same accent. The bias may reinforce a sense of belonging and solidarity within a particular linguistic group. On the other hand, we know that we attribute more positive traits (e.g., competence, trustworthiness; Lev-Ari & Keysar, 2010) and show a general implicit and explicit preference for speakers who sound like us. It is this preference at the expense of the out-group, which is likely going to unfairly influence hiring decisions, interpersonal interactions, and professional settings, particularly where communication skills are important. It may also influence language attitudes and policies leading to “linguistic racism” (or linguicism; Skutnabb-Kangas, 2015) or privileging in-group or high-status accents over others in education, media, business, or government. The true extent of discriminating behavior based on regional accents, however, has not yet been directly linked to an accent IAT measure.
Investigations of the predictive validity of the IAT score have been carried out in the visual stereotype literature, particularly pertaining to racial bias. While some reports suggested good predictive validity of the IAT (e.g., Greenwald et al., 2009; 2015) others have demonstrated that the IAT cannot predict individual-level behavior (e.g., Blanton et al., 2009). In other words, a single IAT score is unlikely a good predictor of an individual's behavior at a particular point in time, but the IAT does seem to be good at predicting group behavior (e.g., Jost, 2019). Here we have shown a reliable bias toward the in-group based on regional accents. It is thus likely that in-group favoritism does exist within these two regions and is reinforced in everyday settings. However, it is important to acknowledge the dynamic nature of in-group membership in certain situations. Levels of bias will depend on who is identified as the in-group and who is the reference in a given context based on additional variables such as social status (see literature on the reference frame effect e.g., Abrams & Hogg, 1987; Dragojevic & Giles, 2014). Future research may also want to delve deeper into different dimensions of in-group favoritism such as social attractiveness versus competence (Coupland & Bishop, 2007). The reported IAT task included words from both dimensions and can therefore not differentiate between the two.
Research on racial prejudice has explored ways to reduce implicit bias. One particularly frequently explored strategy is exposure to racial out-groups. This research, based on Intergroup Contact Theory (Allport, 1954), has provided mixed results whereby exposure to racial out-groups can be associated with more positive but also more negative intergroup attitudes (Rae et al., 2015). Based on this literature we expected a change in the English group with extended stay in Wales, but we found no change in the IAT score in this group. The reason for this finding may be that at an international university, the English students may not have had enough intergroup interactions with Welsh students and locals. Alternatively, exposure to the out-group (Welsh) accent may not have been long enough to influence the IAT score in the English group or may be dependent on the quality of social exposure to the out-group (see Pettigrew and Tropp (2006) for a meta-analysis regarding effects of quantity and quality of exposure on prejudice reduction).
It is not clear what mechanisms might drive this bias toward our own accent. The current study minimized a familiarity explanation of implicit preference for the in-group accent (e.g., Gass & Varonis, 1984; Lev-Ari & Keysar, 2010) because both groups were familiar with each other's regional accent. It has previously been demonstrated, typically for foreign accents, that language attitudes are influenced by listeners’ processing fluency. Processing fluency refers to the subjective level of difficulty with which information is processed and impacts how we evaluate speakers (Dragojevic & Giles, 2016). Effortless comprehension of speech leads to more positive evaluations of the speaker in terms of effect, status, and solidarity (Dragojevic & Giles, 2016). Conversely, when speech is harder to understand, speakers will be perceived more negatively (e.g., foreign compared to native accents with or without background noise; Spence et al., 2024). Most of the processing fluency literature concentrates on foreign-accented speech compared to native speech. However, it is plausible that even amongst regional accents, the accent of the out-group is more cognitively effortful to process and therefore results in more negative biases. Whether processing fluency and comprehensibility are significant moderators of regional accent bias as measured with an IAT is a question for future research.
Social Identity Theory provides an additional explanation for the consistent in-group bias reported here. A previous neuroimaging study examined the neural underpinnings of this preference for our own accent. The results revealed an interaction between participants’ own accent and the accents the participants listened to (Bestelmeyer et al., 2015). In other words, we process our own accents differently from accents of another region despite familiarity with and comprehension of, the outgroup's accent (e.g., via media exposure). This interaction between speaker and listener accent highlighted part of a network typically associated with auditory emotion perception. The data showed that the neural response to speech is modulated by the geographical background of the listener and suggests the possibility of an emotional response to speakers who sound like us. This finding of a potentially emotional response to in-group speakers is in line with a theoretical model of the effect of processing fluency on language attitudes (Dragojevic & Giles, 2016) as well as fluency-based affective reactions demonstrated through self-report and physiological measures (see Winkielman et al., 2003 for review).
Limitations
One of the limitations of the experiments concerns the sample of participants. Our participants were predominantly young, female university students. Coupland and Bishop (2007) showed that women provided more favorable evaluations of accents on ratings of prestige and social attractiveness. Men, on the other hand, provided more favorable judgments of their own accent. Coupland and Bishop collected explicit ratings of accents, but it is possible that a more representative sample of participants would have resulted in an even more pronounced own accent bias than reported in our experiments.
Experiment 2 shows that implicitly measured bias was large compared to explicitly reported preference. This may be because of social desirability issues affecting the explicit test, particularly in the English group not wanting to admit to bias against the Welsh while studying in Wales. However, the difference in effect size reported here may also be related to the fact that implicit and explicit tests commonly use different proxies for groups of people. For example, the IAT measured associative knowledge between specific accents of female speakers and valanced attributes, whereas the feeling thermometer measured attitudes toward groups of people.
Conclusion
We show with a simple behavioral test that regional accents serve as a salient cue to group membership and demonstrate that social bias is not only based on visible cues such as sex or race. While different fields have highlighted the importance of accents in the literature, our study emphasizes the importance of an additional variable in the social evaluation of speech, the listener's own regional accent. We also show that this own-accent preference is more pronounced when measured implicitly rather than with more traditional direct reports.
Supplemental Material
sj-docx-1-jls-10.1177_0261927X241287189 - Supplemental material for Regional Accents: Spontaneous Biases Toward Speakers Who Sound Like Us
Supplemental material, sj-docx-1-jls-10.1177_0261927X241287189 for Regional Accents: Spontaneous Biases Toward Speakers Who Sound Like Us by Patricia E.G. Bestelmeyer in Journal of Language and Social Psychology
Footnotes
Acknowledgments
The author is grateful to James Bragg and Harry Piper for help with data collection as part of their MSc lab rotation module.
Declaration of Conflicting Interests
The author declared no potential conflicts of interest with respect to the research, authorship, and/or publication of this article.
Funding
The author received no financial support for the research, authorship, and/or publication of this article.
Supplemental Material
Supplemental material for this article is available online.
Author Biography
References
Supplementary Material
Please find the following supplemental material available below.
For Open Access articles published under a Creative Commons License, all supplemental material carries the same license as the article it is associated with.
For non-Open Access articles published, all supplemental material carries a non-exclusive license, and permission requests for re-use of supplemental material or any part of supplemental material shall be sent directly to the copyright owner as specified in the copyright notice associated with the article.