
Abstract
Gender inequality is usually described as women’s disadvantage, only rarely as men’s advantage. Moreover, it is often illustrated by metaphors such as the glass ceiling—an invisible barrier to women’s career advancement—metaphors that often also focus on women’s disadvantage. Two studies (N = 228; N = 495) examined effects of these different ways of framing gender inequality. Participants read about gender inequality in leadership with a focus on either women or men, and either without a metaphor (women underrepresented vs. men overrepresented) or with a women-focused or men-focused metaphor (glass ceiling/labyrinth vs. old boys’ club). Metaphors caused participants to perceive gender inequality as (somewhat) more important. Regardless of metaphor use, women-focused descriptions led to more explanations of inequality focusing on women relative to explanations focusing on men, as well as to more suggestions of interventions targeting women at the expense of interventions aimed at systemic changes.
Despite noteworthy changes, gender inequality in the workplace persists. Women are underrepresented in leadership, especially in top management and executive positions in particular (e.g., Vinnicombe et al., 2019); they are less likely to be hired despite equal qualifications (e.g., Moss-Racusin et al., 2012) and are paid less than their male counterparts (World Economic Forum, 2018). Speaking more figuratively, women struggle with a glass ceiling keeping them from high-status positions, and their careers resemble a labyrinth of additional hurdles, detours, and dead-ends (Eagly & Carli, 2007).
Did you notice something about this introductory paragraph? It discussed gender inequality with a sole focus on disadvantages for women. We could have just as well said that men are overrepresented in leadership, are more likely to be hired and are often paid more, that boardrooms resemble boys’ clubs and that men’s career paths tend to be smoother than women’s. However, such men-focused descriptions of gender inequality are much less common in public discourse than descriptions with a focus on women, including simple comparisons as well as illustrative metaphors (see Bruckmüller et al., 2013).
The present studies address the effects of descriptions of gender inequality with a focus on women versus on men as well as of related metaphors. Specifically, we test how different descriptions of unequal representation in leadership affect the perceived importance of this issue, explanations for it, and suggestions of and support for interventions.
Metaphors for Gender Inequality
One common way to illustrate gender inequality in the workplace is the “glass ceiling.” This metaphor has been used since the 1980s to capture the subtle, yet very real, barriers that women face as they try to climb “career ladders.” The metaphor has enjoyed immense popularity and has inspired a range of similar metaphors describing challenges that women face in the workplace, such as the “maternal wall” or the “glass cliff” (see Bruckmüller et al., 2013).
Importantly, metaphors are not only creative figures of speech, they are extremely powerful in shaping our understanding of, and reactions to, complex social phenomena (Glucksberg, 2003; Lakoff & Johnson, 1980/2003). They highlight certain aspects of an issue, while they render others less salient or even invisible (Fauconnier & Turner, 1998). One likely reason why the glass ceiling metaphor was so successful is that it makes subtle forms of gender discrimination visible and easier to grasp, thus facilitating social discourse about the issue (see Eagly & Carli, 2007). Furthermore, the fact that the phenomenon has its own widely used metaphor helps communicate that the issue is important. This should not only be the case for the glass ceiling but also for other metaphors describing gender inequality that are widely used and/or easy to grasp (see below). Therefore, we predict the following:
Yet the glass ceiling metaphor has not been without criticism. One problematic element is that it suggests a single barrier below high leadership positions, implying no problems below (or above, for women who manage to “break through”)—a representation difficult to reconcile with evidence of gender discrimination at various levels of organizational hierarchies (Eagly & Carli, 2007). Alternative metaphors have been suggested as more accurate, most prominently, the “labyrinth” (Eagly & Carli, 2007), which illustrates that rather than a single barrier at the top, women’s careers have more twists, turns, hurdles, and dead ends, making it harder—but not impossible—to reach leadership positions.
The labyrinth may thus better capture women’s experiences at all levels of organizational hierarchies. Yet it shares another potentially problematic aspect with the glass ceiling, namely, its focus on women. Both metaphors conjure up images of individual women struggling with structural barriers such as ceilings, walls, detours, or dead ends, while men and men’s experiences are left out of the picture. As we have argued previously (Bruckmüller et al., 2013), this frames unequal representation as a women’s issue, not as a gender issue, a matter of justice, an organizational problem, or any other potential framing. This focus on women is, however, in line with other, less metaphorical descriptions of gender inequality (and gender differences in general) and it is problematic for several reasons, as we illustrate in the following.
Focus of Comparison in Descriptions of Gender Inequality
Descriptions of inequality usually entail comparisons (e.g., between different groups’ outcomes). Comparisons, in turn, are usually directional; that is, rather than merely stating a difference, they compare one group (the subject of comparison) with another (the referent). Who is compared with whom follows systematic principles. For example, people are more likely to compare untypical, nonnormative, and lower status groups with typical, normative, and higher status groups (Hegarty & Bruckmüller, 2013; Miller et al., 1991). Accordingly, gender differences are usually framed in terms of how women differ from men rather than vice versa—particularly in stereotypically male domains (Hegarty & Buechel, 2006; Miller et al., 1991). Similarly, descriptions of inequality tend to focus on the disadvantaged rather than the advantaged group (Lowery et al., 2007). Accordingly, descriptions of gender inequality will mainly focus on women.
Such a consistent focus on women may be problematic. Numerous studies have shown that the focus of comparison (who is compared with whom) affects social perception and judgment (for a review, see Wänke & Reuter, 2011). In intergroup contexts, consistently making nonnormative groups the subject of comparison, and thereby linguistically marking them as deviation from a (normative) referent group, can negatively affect members of nonnormative groups (Bruckmüller, 2013; Cihangir et al., 2013; Lowery & Wout, 2010). Moreover, as normativity is intertwined with status and power (Simon & Oakes, 2006), repeatedly presenting a group as the referent can cause this group to appear more powerful and higher in status (Bruckmüller & Abele, 2010) and can contribute to the legitimization of inequality (Bruckmüller et al., 2012).
Many of these effects can be explained by two related processes. First, the subject of comparison and its characteristics become more salient than the referent and are drawn on more in subsequent processing (see Chambers & Windschitl, 2004; Tversky, 1977). That is, saying that women are disadvantaged draws more attention to women than to men. Subsequent judgment is then primarily driven by what perceivers associate with women, not by what they associate with men. Second, comparing one group with another implies that the referent group (men in the example) is the normative standard that others are evaluated against (Hegarty & Bruckmüller, 2013; Lowery et al., 2009). This subtly reaffirms this group as the normal, to-be-expected case in the respective domain (e.g., men in leadership; see Bruckmüller et al., 2013).
The present studies focus on two further potential consequences of consistently framing gender inequality with a focus on women, namely, effects on how people explain gender inequality and what—if anything—they want to do about it. Complex phenomena such as gender inequality are almost certainly caused by a multitude of factors. Yet which of these factors people draw on in explanations matters as different explanations imply different consequences, such as legitimization, blame, sympathy, and/or (un)willingness to help (Edwards & Potter, 1993; Weiner et al., 2011). For example, explaining women’s underrepresentation in leadership with women’s career choices might lead to higher legitimization and lower perceived need for interventions than explanations drawing on external factors such as organizational structures or sexism.
Predictions for Explanations
Since the focus of comparison affects salience (Chambers & Windschitl, 2004), we expected participants reading descriptions of gender inequality with a focus on women to more often draw on factors associated with women when explaining inequality, for example, on women’s presumed abilities and ambitions (or lack thereof), a lack of female role-models, child care issues, and so on. A focus on men should instead highlight reasons associated with men, such as men’s presumed abilities and ambitions, masculine work cultures, or informal networks that help men succeed. We expected this to at least somewhat balance out the general tendency to focus explanations of gender differences on women (Miller et al., 1991).
Predictions for (Support for) Interventions
Similarly, the focus of comparison in descriptions of inequality should affect which types of interventions most easily come to mind and seem most appropriate when people think about possible ways to reduce inequality. Since women-focused descriptions make women particularly salient, we expect these descriptions to increase suggestions of and support for interventions that target women (e.g., special trainings, mentoring and networking programs, female role models). Especially when participants generate own suggestions for interventions, this should come at the expense of other interventions, most importantly those that aim at “fixing the system” rather than “fixing women” (e.g., changing workplace cultures or organizational structures, reducing gender stereotypes).
Please note that we expect these effects on explanations and interventions regardless of whether inequality is illustrated by a metaphor or not. We expect women-focused descriptions of inequality to raise women-focused questions, whether these questions are more literally why women are underrepresented and what can be done about it, or more metaphorically why women face a glass ceiling and what might help women “break through.”
Beyond effects on the focus of comparison in participants’ explanations (Hypothesis 2), predictions for specific kinds of explanations are more difficult to make. For example, central for many attribution theories (for an overview, see Malle, 2011) is the distinction between attributions to internal factors (e.g., ability, effort) versus external factors (e.g., systemic factors, other people’s behavior). Here, different effects and interactions with metaphor use seem plausible. On one hand, focusing descriptions on women may increase tendencies to “blame” women via internal attributions. On the other hand, glass ceiling-type metaphors not only present gender inequality as a women’s issue. They also highlight that gender inequality is a systemic problem residing in workplace characteristics, thus evoking external attributions. Moreover, moderating effects of participant gender are possible. The present studies allow for testing such interaction effects. However, since the respective predictions are less straight-forward, and since we found no consistent patterns across the two studies, we only report them in online Supplement C. 2
Method
We conducted two studies with equivalent methods, the second study being a preregistered, almost exact replication of the first one with a bigger sample (see https://osf.io/zvktc, osf.io/a582c). Accordingly, we describe the methods and results of both studies in a combined methods and a combined results section, respectively. Online Supplement A contains all materials. Online Supplement B contains coding instructions for open responses as well as examples of typical responses. Online Supplement C contains additional analyses. Data sets and analysis script can be found here: https://osf.io/a582c.
Overview
Participants read about the different representation of women and men in leadership, either with a focus on women or a focus on men, and either with or without a metaphor. In addition to the popular women-focused metaphor of the glass ceiling, we added the “labyrinth,” which has explicitly been suggested as an alternative to the glass ceiling (Eagly & Carli, 2007), and the men-focused metaphor of boardrooms as “old boys’ clubs.” While it may be debatable whether the latter is really a metaphor, it is a rather figurative expression that is used widely in (public) discourse and is easy to understand.
Participants and Design
Participants were recruited for an online survey via different websites and professional services. For Study 1, we used the platforms maximiles.co.uk (now called Bilendi), a U.K.-based commercial service that recruits participants for online research, as well as socialpsychology.org, a U.S.-based website that allows people interested in psychological research to participate in online studies. All 211 Maximiles participants had at least 3 years of work experience and all but 3 were based in the United Kingdom. Most socialpsychology.org participants were based in the United States (14 out of 17). Maximiles participants were compensated with £2, socialpsychology.org participants with a chance to win $50. Participants for Study 2 were recruited via pureprofile.com, another commercial service, and received £3 as compensation. All but one were based in the United Kingdom.
Sample Study 1
The sample consisted of 110 female and 118 male participants 3 with various professional backgrounds and a mean age of 44.26 years (SD = 17.09 years). They mostly rated their current occupational seniority level as “quite junior” (30%) or “intermediate” (47%).
Sample Study 2
The sample consisted of 274 female and 221 male participants from various professional backgrounds. They were on average 50.06 years old (SD = 11.56) and mostly rated their seniority level as “quite junior” (21%) or “intermediate” (51%).
Design
Participants were randomly assigned to read a text in which the representation of gender groups in leadership was described either with a focus on men or on women, and either without a metaphor (“men overrepresented” or “women underrepresented”) or with either a men-focused metaphor (“old boys’ club”) or one of two women-focused metaphors (“glass ceiling” or “labyrinth”). Since with one exception (see below) preliminary analyses revealed no meaningful differences between the two women-focused metaphor conditions (i.e., glass ceiling and labyrinth), we collapsed these conceptually similar conditions, resulting in a 2 (focus of description: on women, on men) × 2 (metaphor use: yes, no) design. To make visible the information lost by this approach, figures display means for the five original conditions.
Materials and Procedure
Procedure
Participants first read a short text describing the unequal representation of women and men in leadership that contained our manipulations. The text included specific numbers for the representation of gender groups for the most recent year available at the time (2013 in Study 1, 2015 in Study 2). A noteworthy difference between studies was that in Study 1, this text was preceded by a title that also included the respective manipulation (e.g., “Women still underrepresented in leadership”), while in Study 2 all texts were titled “Men and women in the workplace.”
Control Questions
We then asked participants to briefly summarize this text in their own words. We excluded participants whose responses obviously indicated that they had not read the text (e.g., “not a lot to say”). For participants recruited by professional services, three control questions throughout the study additionally ensured that participants read the items before responding (e.g., “If you have read this question, please select ‘not at all’ as your response.”). Only participants who passed at least two of these three control questions were kept in the sample.
Perceived Importance
Next, participants indicated how they felt about the unequal representation of men and women in leadership via five items that served as our measure of perceived importance (e.g., “important,” “irrelevant [reverse scored]”) on 7-point scales ranging from not at all to very much; Cronbach’s αStudy 1 = .80, αStudy 2 = .82.
Own Explanations
Participants were then asked to explain in their own words the different representation that they had just read about. For each response, a first judge blind to experimental condition excluded obvious nonresponses (e.g., no idea) and divided all other responses into meaningful substatements. This division was based on content, not syntax. That is, sometimes one sentence contained several statements to be coded separately (e.g., “men will always be seen as superior in their own heads and like to maintain this by promoting other men” contains two substatements, one on presumed male superiority and one on men supporting other men). Each (sub)statement was then coded as either focused on women, focused on men, or neither/both/ambiguous by two independent coders blind for hypotheses and conditions. Coders also decided for each statement whether it was an internal attribution, external attribution, or could not be coded as either. Interrater agreement ranged from substantial (for type of attribution in Study 2, κ = .61) to almost perfect (focused group: κStudy 1 = .96). 4 Disagreements were resolved by discussion.
Agreement With Given Explanations
We then asked participants to indicate how much they agreed with 12 different explanations that represented 6 internal and 6 external attributions, respectively. Details on this measure and the respective analyses can be found in the online supplements.
Own Suggestions for Interventions
Next, participants made suggestions in their own words for what could be done to reduce differences in representation. After sorting out obvious nonresponses and subdividing each response into meaningful (sub)statements (based on content, not syntax), two independent judges blind to experimental condition coded each (sub)statement into one of the following categories: (1) does not discuss interventions, (2) intervention aimed at changing women, (3) intervention aimed at changing the situation, (4) explicit suggestion to do nothing, or (9) “other.” 5 Interrater agreement was substantial, κStudy 1 = .69, κStudy 2 = .76. Disagreements were resolved by a coder conference with a third judge blind to hypotheses and condition.
Support for Given Interventions
Participants then indicated their support for various interventions on a 7-point scale from strongly oppose (coded as −3) to strongly support (+3). This included four interventions targeting women (such as special trainings or mentoring programs for women; αStudy 1 = .85, αStudy 2 = .86), four interventions targeting organizational structures (such as diversity trainings or work life programs; αStudy 1 = .83, αStudy 2 = .87), and two items that described quotas and preferential selection (rStudy 1 = .63, rStudy 2 = .64). However, rather than this three-factorial structure, factor analyses suggested a one-factorial solution (see online Supplement C). Thus, in addition to the conceptually driven test of Hypothesis 3b on interventions targeting women relative to those targeting organizations, we also tested for effects on the total support for interventions.
Demographics and Debriefing
Finally, participants indicated their age, gender, current profession, level of seniority, and the country they currently lived in before being fully debriefed. 6
Results
Analytic Approach
Since we collapsed the conceptually similar glass ceiling and the labyrinth conditions for our analyses (see above), the resulting 2 (focus of description: women, men) × 2 (metaphor use: yes, no) design had unequal cell sizes. Together with the violation of further assumptions for analyses of variance (ANOVAs), such as nonnormal distributions, unequal cell sizes can lead to a severe loss of power (Field & Wilcox, 2017). We thus calculated robust ANOVAs with trimmed means following recommendations by Field and Wilcox (2017). Specifically, we calculated robust 2 (focus of description) × 2 (metaphor use) × 2 (participant gender) between-subject ANOVAs using the R-package WRS2 (Mair & Wilcox, 2019), which applies Wilcox’ (2012) t3way function from the WRS2 package with a 20% trimmed means method. Accordingly, we report χ2-values with no degrees of freedom (Mair & Wilcox, 2019).
Since Hypothesis 2, Hypothesis 3a, and Hypothesis 3b concern how explanations and interventions with a certain focus relate to those with a different focus (and since, to the best of our knowledge, no statistics package is available yet for robust mixed-measures ANOVAs with three between-subject factors), we used difference scores as dependent variables (see below). In Study 1, we used two-tailed significance tests throughout. In Study 2, we used one-tailed tests whenever we had preregistered a directional hypothesis.
Hypothesis 1: Perceived Importance
Study 1
As predicted, participants in the metaphor conditions perceived the issue of unequal representation in leadership as more important (M = 5.17, SD = 1.33) than participants in the no-metaphor conditions did (M = 4.85, SD = 1.12), χ2 = 7.74, p = .008, d = .26. Women perceived the issue as more important (M = 5.43, SD = 1.05) than men did (M = 4.64, SD = 1.29), χ2 = 17.72, p < .001, d = .67. No other effects were significant, all χ2s < 1.65, ps > .10.
Study 2
Again, participants in the metaphor conditions perceived the issue as more important (M = 4.94, SD = 1.16) than participants in the no-metaphor conditions (M = 4.75, SD = 1.13), χ2 = 4.92, p = .014, d = .17, and women perceived it as more important (M = 5.18, SD = 1.03) than men did (M = 4.46, SD = 1.17), χ2 = 38.46, p < .001, d = .66. All other χ2s < 2.30, ps > 13.
Hypothesis 2: Focus of Explanations
Overall, 206 participants in Study 1 made 455 codable (sub)statements on how they would explain unequal representation in leadership. In Study 2, 452 participants made 639 codable statements. Since the number of codable (sub)statements per participant varied from 0 to 11, we calculated the proportion of statements focused on men and on women per participant. We then subtracted the former proportion from the latter, such that positive values indicate an overall focus on women and negative values indicate an overall focus on men. To make visible the information lost by this analytic approach, Figure 1 illustrates the percentage of explanations focused on women and on men separately.
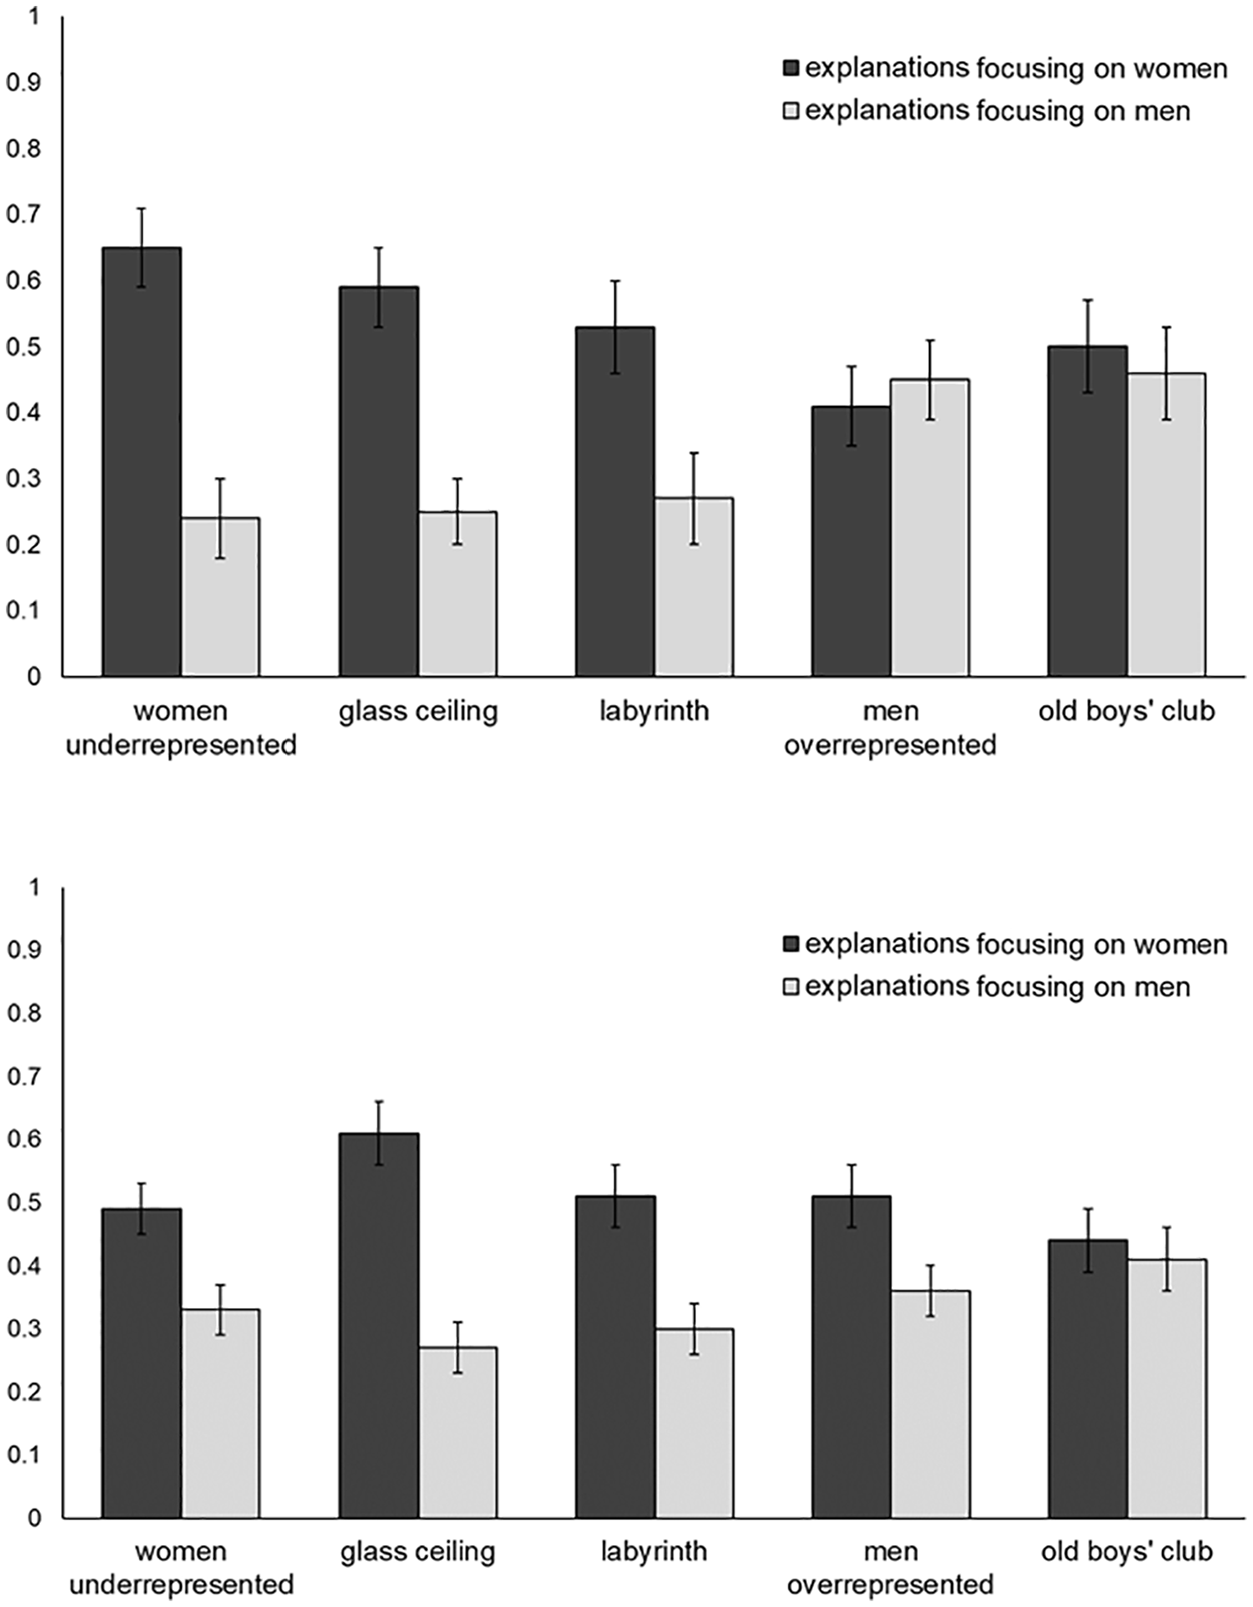
Mean proportion of participants’ explanations focusing on women and on men by experimental condition in Study 1 (upper panel) and Study 2 (lower panel).
Study 1
Overall, participants focused a higher percentage of explanations on women than on men, as evidenced by a mean value above zero (M = 0.20, SD = 0.78), t(208) = 3.71, p < .001, d = .26. The only significant experimental effect was the predicted main effect of focus of description, χ2 = 8.82, p = .007. When descriptions of unequal representation focused on women, so did participants’ explanations (M = 0.34, SD = 0.73), when descriptions focused on men, participants’ explanations focused on men and women equally (M = −0.01, SD = 0.80), d = .46; all other χ2s < 1.66, ps > .21.
Study 2
Overall, participants focused a higher percentage of explanations on women than on men (M = 0.18, SD = 0.78), t(441) = 4.72, p < .001, d = .22. Again, the only significant effect on this difference score was the main effect of focus condition, χ2 = 2.84, p = .047. In the women-focused conditions, participants’ explanations focused more on women then on men (M = 0.23, SD = 0.77), while explanations were more balanced in the men-focused conditions (M = 0.09, SD = 0.79), d = .18, even though the effect was smaller than in Study 1; all other χ2s < 1.36, ps > .24.
As Figure 1 illustrates, the smaller effect in Study 2 was primarily caused by the focus on men, no metaphor condition (“men overrepresented”). In Study 1, participants in this condition focused nearly equally on women and men (M = −0.04, SD = 0.78), t < 1, while participants in Study 2 focused somewhat more on women than on men (M = 0.15, SD = 0.79), t(87) = 1.78, p = .078, d = .19. The respective focus condition by metaphor interaction was nonsignificant, χ2 = 2.94, p = .089 (χ2 Study 1 < 1). We return to this in the discussion.
Hypothesis 3a: Participants’ Own Suggestions for Interventions
In Study 1, 228 participants made 374 statements on strategies to reduce the unequal representation of women and men in leadership. Of these, 248 were actual suggestions for interventions and 82 were “do nothing” statements (the remaining 44 did not discuss interventions). In Study 2, 462 participants made 588 statements, 456 of which were actual suggestions (81 “do nothing,” 52 did not discuss interventions). Since the number of codable statements per participant varied from 0 to 5, we calculated proportions for the different coding categories per participant. There were no effects of experimental conditions and/or participant gender on the proportion of “do nothing” statements, all χ2 < 2.35, all ps > .13. However, since participants who stated that nothing should be done actively opposed interventions, we excluded them from the analyses reported below (nStudy 1 = 46, nStudy 2 = 81). We then subtracted the proportion of suggestions aimed at organizational or societal change from the proportion of suggestions aimed at changing women. Accordingly, positive values indicate more interventions targeting women relative to more systemic interventions. To make visible the information lost by this analytic approach, Figure 2 illustrates the percentage of interventions targeting women and interventions targeting the system separately.
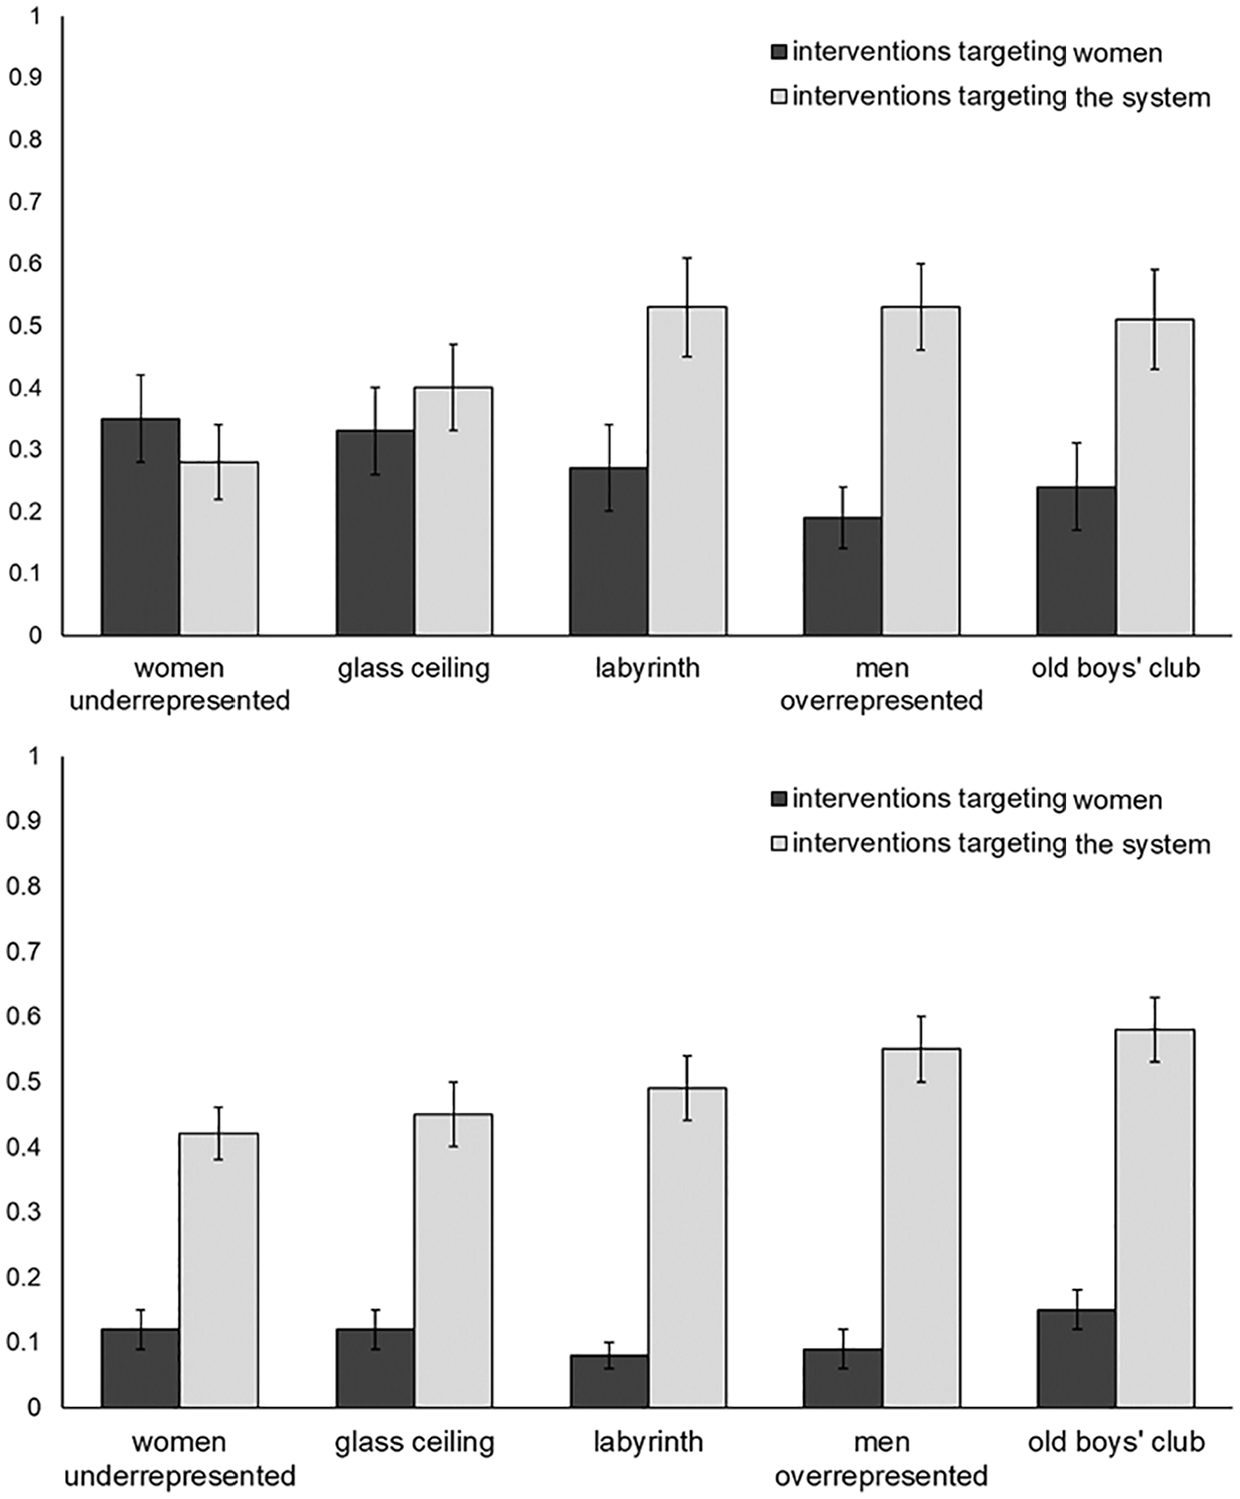
Mean proportion of participants’ suggestions for interventions targeting women and interventions targeting the system by experimental condition in Study 1 (upper panel) and Study 2 (lower panel).
Study 1
A negative mean difference score indicated that participants suggested a higher proportion of interventions aimed at changing the situation than at changing women (M = −0.17, SD = 0.75), t(197) = 3.18, p = .002, d = .23. A significant main effect of participant gender indicated that this was especially the case for female participants (M = −0.26, SD = 0.73; male participants: M = −0.07; SD = 0.76), χ2 = 4.26, p = .043, d = .26. Importantly, the predicted effect of focus condition was significant, χ2 = 7.96, p = .006. When descriptions of unequal representation focused on women, participants suggested about as many interventions aimed at “fixing women” as interventions aimed at “fixing the system” (M = −0.08, SD = 0.76). When the description focused on men, they suggested more interventions targeting the system (M = −0.31, SD = 0.72), d = .31. There were no other significant effects, χ2s < 3.11, ps > .08.
As Figure 2 (upper panel) illustrates, this effect was mostly driven by the women underrepresented and the glass ceiling conditions, where participants suggested a similar proportion of interventions targeting women and targeting the system (Mwomen underrepresented = 0.07, SD = 0.71; Mglass ceiling = −0.07, SD = 0.78), ts(40) < 1, ds < .10. In the labyrinth condition, participants suggested significantly more interventions targeting the system (M = −0.27, SD = 0.76), t(34) = 2.04, p = .049, d = .34, although the respective differences between conditions were not statistically significant (comparison “labyrinth” and “women underrepresented,” t(70.20) = 1.93, p = .058, d = .45).
Study 2
Overall, participants suggested more interventions aimed at changing the situation (M = −0.38, SD = 0.62), t(498) = −13.69, p < .001, d = .62. This was somewhat more pronounced among female than among male participants (Ms = −0.43 and −0.33, SDs = 0.63 and 0.61, respectively), χ2 = 4.38, p = .038, d = .13. The predicted focus of description effect was significant, χ2 = 6.46, p = .006. While participants in all conditions suggested a higher proportion of interventions targeting the system than interventions targeting women, this was more pronounced when descriptions of unequal representation focused on men (M = −0.44, SD = 0.66) than when they focused on women (M = −0.34, SD = 0.59), d = .16. There were no other significant effects, χ2s < 2.42, ps > .08. The labyrinth condition did not differ significantly from either of the other women-focused conditions, ts < 1.34, ps > .18.
Hypothesis 3b: Support for Given Interventions
Since Hypothesis 3b predicted an effect on support for interventions aimed at changing women relative to interventions aimed at changing organizations, we again created a difference score. There were no significant effects in Study 1, χ2s < 1, or Study 2, χ2s < 3.21, ps > .075.
We additionally tested for effects on the total support for interventions (all items combined). This revealed no significant effects besides main effects of participant gender (with women supporting interventions more than men did, Study 1: Ms = 5.32 and 4.43, SDs = 1.00 and 1.29, respectively, χ2 = 21.00, p = .001, d = .77; Study 2: Ms = 5.19 and 4.41, SDs = 1.06 and 1.24, respectively, χ2 = 62.82, p < .001, d = .68), all other χ2s < 2.94, ps > .08.
Discussion
The unequal representation of women and men in leadership remains stubbornly persistent (e.g., Vinnicombe et al., 2019). Considering how closely language, thought, and action are intertwined (Barsalou, 2008; Potter & Wetherell, 1987), the question how we frame this issue is therefore an important “language challenge” in the 21st century.
Gender inequality tends to be framed as women’s disadvantage and is often illustrated by structural barrier metaphors such as the glass ceiling or, more recently, the labyrinth (Eagly & Carli, 2007). Two studies tested how these framings of gender inequality (vs. a framing as men’s advantage or more metaphorically as a boys’ club) affect perceptions of and responses to gender inequality. We found that when descriptions of inequality focused on women’s underrepresentation rather than on men’s overrepresentation, participants constructed more explanations that also focused on women. In addition, participants who read about women’s disadvantage suggested more interventions aimed at helping or changing women relative to interventions aimed at systemic changes. Generally, these effects were independent of metaphor use. However, metaphors caused participants to perceive the issue of gender inequality as (somewhat) more important. Other effects, such as the labyrinth metaphor inspiring somewhat more suggestions for systemic interventions than other women-focused framings, were not stable across studies.
In previous studies, participants were able to shift from default tendencies of comparative framing to more balanced explanations when explicitly asked to do so (Hegarty & Pratto, 2001). The present studies show that merely changing the focus of comparison in descriptions of inequality can be sufficient to shape explanations and suggestions for interventions accordingly. This matters for several reasons. First, intergroup differences and inequality systematically tend to be framed with a focus on disadvantaged groups (Hegarty & Bruckmüller, 2013; Lowery et al., 2007). Second, explanations are powerful as they can make things appear more real and credible, especially if people actively construct explanations themselves (Anderson et al., 1980). Explanations further have important conversational and discursive consequences such as attributing blame and evoking different emotional and behavioral reactions (Bruckmüller, Hegarty, et al., 2017; Edwards & Potter, 1993; Hilton, 1990; Weiner et al., 2011). In line with this, participants in the present studies also suggested different kinds of interventions to tackle gender inequality depending on how inequality was framed.
However, we only found consistent effects for open responses, not for scale-type measures of agreement with given explanations (see online supplement) and interventions. One reason for this may be that while we managed to reliably code open responses with regard to our conceptual variables (focus of explanation; focus of intervention), the scale-based measures did not match this coding as closely as we had hoped. In particular, support for given interventions targeting women and for interventions targeting the system could not reliably be distinguished. Moreover, it is likely that open responses are more suitable to tap into the relevant psychological processes. If focus of comparison effects are mainly driven by salience (Chambers & Windschitl, 2004), that is, by affecting what comes to mind spontaneously, open responses should be affected more than agreement with predetermined items. One might be tempted to interpret this as an indication that different framings of inequality do not matter all that much. However, on a societal level, it is particularly problematic if there is one dominant framing that makes it difficult to see things in any other way than this particular framing implies (Wehling, 2016)—and framings of gender inequality as women’s disadvantage arguably are such a dominant framing. At any rate, our findings underline the importance of not only studying framing effects by means of predetermined responses on Likert-type scales but also by means of open responses.
An unexpected but consistent pattern was that effects were smaller in Study 2 than in Study 1. It is possible that the stronger effects in Study 1 were caused by differences between samples (e.g., in age), by the time of data collection (with Study 2 being run just weeks before the 2016 U.S. presidential election, where Hillary Clinton was a promising candidate), or simply random variation. However, we consider it most likely that this difference in effect sizes was caused by a difference in materials. In Study 1, we additionally manipulated framing via the title above the text describing gender inequality (e.g., “Women still underrepresented in leadership”). This was not the case in Study 2, where the title always was “Men and women in the workplace.” Considering the high number of participants whose summaries of the text in their own words indicated that they had briefly glanced at it at best, it is highly plausible that the manipulation was stronger in Study 1 than in Study 2, since presumably, participants who did not read the text at least skimmed the title.
This interpretation is further corroborated by the differences we found between studies for the “no metaphor, focus on men” condition. In Study 1, the title read “leadership still predominantly male arena.” Participants subsequently focused their explanations of inequality equally on women and men. In Study 2, where some participants may have missed the subtle variation between “women are underrepresented” and “men are overrepresented,” results looked more like in the “no metaphor, focus on women” condition with explanations predominantly focusing on women. 7 In sum, the manipulation of focus was already subtle in Study 1 and even subtler in Study 2. This may not only explain the smaller effects in Study 2 but also makes it rather meaningful that we still found consistent results across studies.
In terms of practical implications for language challenges in the 21st century, one may ask what our studies suggest for the framing of inequality. Given the problematic consequences of asymmetric comparative framings evidenced in previous research (e.g., Bruckmüller et al., 2012; Chestnut & Markman, 2018; Cihangir et al., 2013; Lowery & Wout, 2010), one may be tempted to conclude that gender inequality should always be framed as men’s advantage. We hesitate to give such advice. Being reminded of their privilege is often aversive for advantaged groups (e.g., Branscombe, 1998; Iyer et al., 2003). Framing inequality as a privileged group’s advantage thus carries the risk of causing reactance. Moreover, people weigh negative information more heavily than positive information (Kahneman & Tversky, 1979). Thus, focusing on the negative side of inequality (disadvantages for some) may be more effective in evoking emotions, in signaling that there is a problem, and in inspiring motivation to act than focusing on the “positive” side of inequality (advantages for others). In line with this, we recently found that a comparative focus on an economically disadvantaged group was more likely to evoke appraisals of differences in outcomes as illegitimate than a focus on the advantaged group (Bruckmüller, Reese, et al., 2017). Thus, it may be useful to draw on women-focused metaphors such as the glass ceiling or the labyrinth not only to illustrate women’s experiences in the workplace but also to draw attention to a persistent problem (see also Eagly & Carli, 2007).
Accordingly, our recommendation is to be more mindful of the way one describes (gender) inequality, for example, to consider what is made salient and what may be lost by a certain framing, and to then actively draw attention to aspects rendered invisible by common framings. For example, why not talk about women being underrepresented and about boardrooms being boys’ clubs? Why not illustrate the extra challenges that women face and highlight that ceilings and labyrinths are structures that are somehow put and kept in place—and that they can be changed? Why not add metaphors to the mix that make visible what a fairer alternative may look like, such as a “level playing field”? We hope that this research contributes to such rethinking and more conscious language use in social discourse in the 21st century.
Supplemental Material
SP-JLSP-203_SupplementA_B_C_FINAL – Supplemental material for One Group’s Advantage or Another Group’s Disadvantage? How Comparative Framing Shapes Explanations of, and Reactions to, Workplace Gender Inequality
Supplemental material, SP-JLSP-203_SupplementA_B_C_FINAL for One Group’s Advantage or Another Group’s Disadvantage? How Comparative Framing Shapes Explanations of, and Reactions to, Workplace Gender Inequality by Susanne Bruckmüller and Maike Braun in Journal of Language and Social Psychology
Footnotes
Acknowledgements
We thank Aysan Ashoee, Chiara Bertolli, Nadine Knab, and Marcel Schmitt for their help in coding open responses. Michelle Ryan and Alexandra Newbold provided helpful comments on the general research idea and a draft of the materials.
Declaration of Conflicting Interests
The author(s) declared no potential conflicts of interest with respect to the research, authorship, and/or publication of this article.
Funding
The author(s) disclosed receipt of the following financial support for the research, authorship, and/or publication of this article: Study 1 was partially funded by a research grant to the first author by the Richard Benjamin Trust (Grant Number RBT 1310).
Supplemental Material
Supplemental material for this article is available online.
Notes
Author Biographies
References
Supplementary Material
Please find the following supplemental material available below.
For Open Access articles published under a Creative Commons License, all supplemental material carries the same license as the article it is associated with.
For non-Open Access articles published, all supplemental material carries a non-exclusive license, and permission requests for re-use of supplemental material or any part of supplemental material shall be sent directly to the copyright owner as specified in the copyright notice associated with the article.