
Abstract
Prediction of chemical toxicity is very useful in risk assessment. With the current paradigm shift towards the use of in vitro and in silico systems, we present herein a theoretical mathematical description of a quasi-diffusion process to predict chemical concentrations in 3-D spheroid cell cultures. By extending a 2-D Virtual Cell Based Assay (VCBA) model into a 3-D spheroid cell model, we assume that cells are arranged in a series of concentric layers within the sphere. We formulate the chemical quasi-diffusion process by simplifying the spheroid with respect to the number of cells in each layer. The system was calibrated and tested with acetaminophen (APAP). Simulated predictions of APAP toxicity were compared with empirical data from in vitro measurements by using a 3-D spheroid model. The results of this first attempt to extend the VCBA model are promising — they show that the VCBA model simulates close correlation between the influence of compound concentration and the viability of the HepaRG 3-D cell culture. The 3-D VCBA model provides a complement to current in vitro procedures to refine experimental setups, to fill data gaps and help in the interpretation of in vitro data for the purposes of risk assessment.
Keywords
Introduction
Prediction of toxicity is very useful when assessing the health effects of chemicals. Human health risk assessment estimates the nature and frequency of the exposure, and the probability of adverse health effects to humans exposed to chemicals. Understanding the mechanisms of chemically induced adverse effects on cells, tissues or organs is crucial for predicting toxicity. To identify the toxic doses of a chemical, a dose–response relationship should be established based on the exposure to the chemical at several concentrations. Animal studies are often used for chemical testing and the results extrapolated to the human situation. However, in recent decades, the use and the appropriateness of animal data for human safety assessment has been questioned.1,2 The current trend in toxicology is to combine in vitro and in silico methods to compensate for the limitations of the individual methods, to enable a reduction in the numbers of animals used in in vivo experiments
3
in line with the Three Rs principles. As expected, the use of in vitro cell cultures with the appropriate medium composition has contributed to the understanding of the mechanisms of organ toxicity.
4
The correlation between the amount of chemical added to the cells (in vitro) and the real exposure (in vivo) should consider several factors that distinguish the two systems: — a circulating versus a static system: the distribution of chemicals in the human body generally is via the blood flow, while in regular 2-D in vitro cultures chemical distribution is rather static; — the chemical fate and ADME (Absorption, Distribution, Metabolism and Excretion) processes are different in vitro and in vivo. For example, adsorption to plastic surfaces can occur in vitro, whereas this does not occur in the body, in vitro cell culture plates are an open system and evaporation can occur, and in vitro medium composition is different to serum composition in vivo; — humans are exposed to numerous chemicals throughout their life, with the intake unit commonly expressed as mg/kg body weight (BW); the in vitro system can only be exposed for hours, days or maybe weeks (but not for longer) with the unit of exposure usually set as concentration (e.g. μM); — in vitro toxicity testing is currently carried out mainly with 2-D cell lines, which is in contrast to the complex structure represented by the organ; and — in vitro concentrations need to be extrapolated to in vivo doses by taking into consideration the biokinetics and mode of action of chemicals within the body.
In addition, it should be taken into account that the in vitro cell systems are exposed to a nominal concentration of the test chemical. This nominal concentration (added to the cells in the well) is not representative of the amount that ‘truly’ reaches the cells.5,6 The unbound (free or true) concentration is a better dose metric to apply when translating in vitro results to in vivo — thus, the concentration–response relationship should be adapted accordingly. This free concentration is the concentration available in the medium to elicit an effect on the cell line. The free concentration can be determined by conducting in vitro kinetic measurements, as reported by several groups5,7–11 or by using steady-state biokinetic models.12–14 To extrapolate the information from in vitro to in vivo, physiologically-based kinetic (PBK) models can then be applied in a reverse dosimetry fashion.
15
One example of an in silico method that can be used to examine the fate and effects of a chemical in in vitro cell cultures is the Virtual Cell Based Assay (VCBA) model. The VCBA model is a mathematical model that describes the uptake of a chemical at a given concentration by cell cultures. The VCBA model permits the calculation of chemical partitioning, enabling the prediction of the unbound free concentration in the medium, as well as the intracellular concentration. 16 The VCBA model is a computational model written in Matlab 17 and in R language, 18 and is based on ordinary differential equations. The solution of these equations enables the time-dependent analysis of the change to a chemical’s concentration in the cell culture medium, as well as the intracellular partitioning. In addition, the kinetic simulation is coupled to cellular dynamics by simulating cell viability. The VCBA model goes beyond the steady-state assumptions, and incorporates metabolic clearance and distribution into mitochondria for single and repeated exposure.16,19,20
Monolayer cultures (i.e. 2-D) present several advantages over other more complex models, such as the ease of performing small-scale and large-scale assays (such as high-throughput), especially for compound screening. However, such models are very limited when trying to recapitulate the real functions of the organs. Several studies have indicated that results obtained with 3-D cultures are more reliable than those obtained with 2-D systems. This is due to the cellular organisation and fluid flow not being captured as realistically in 2-D systems as it is in 3-D systems.21–24 These more-relevant systems can take the form of 3-D spheroids, bioreactors, microphysiological systems (MPS) and organ-on-a-chip (OoC), among others.25,26
The VCBA model consists of four sub-models (Figure 1): The Virtual Cell Based Assay (VCBA) model. The Virtual Cell Based Assay (VCBA) model is composed of four sub-models: (a) the fate and transport model, which describes changes of compound concentration in the medium; (b) the cell partitioning model, which simulates the partitioning between lipid, protein and water within the cell; (c) the cell growth and division model, which takes into account the changes in cell populations; and (d) the toxicity and effects model, which permits simulations of an endpoint (such as cell viability). Adapted from Zaldivar et al.
16
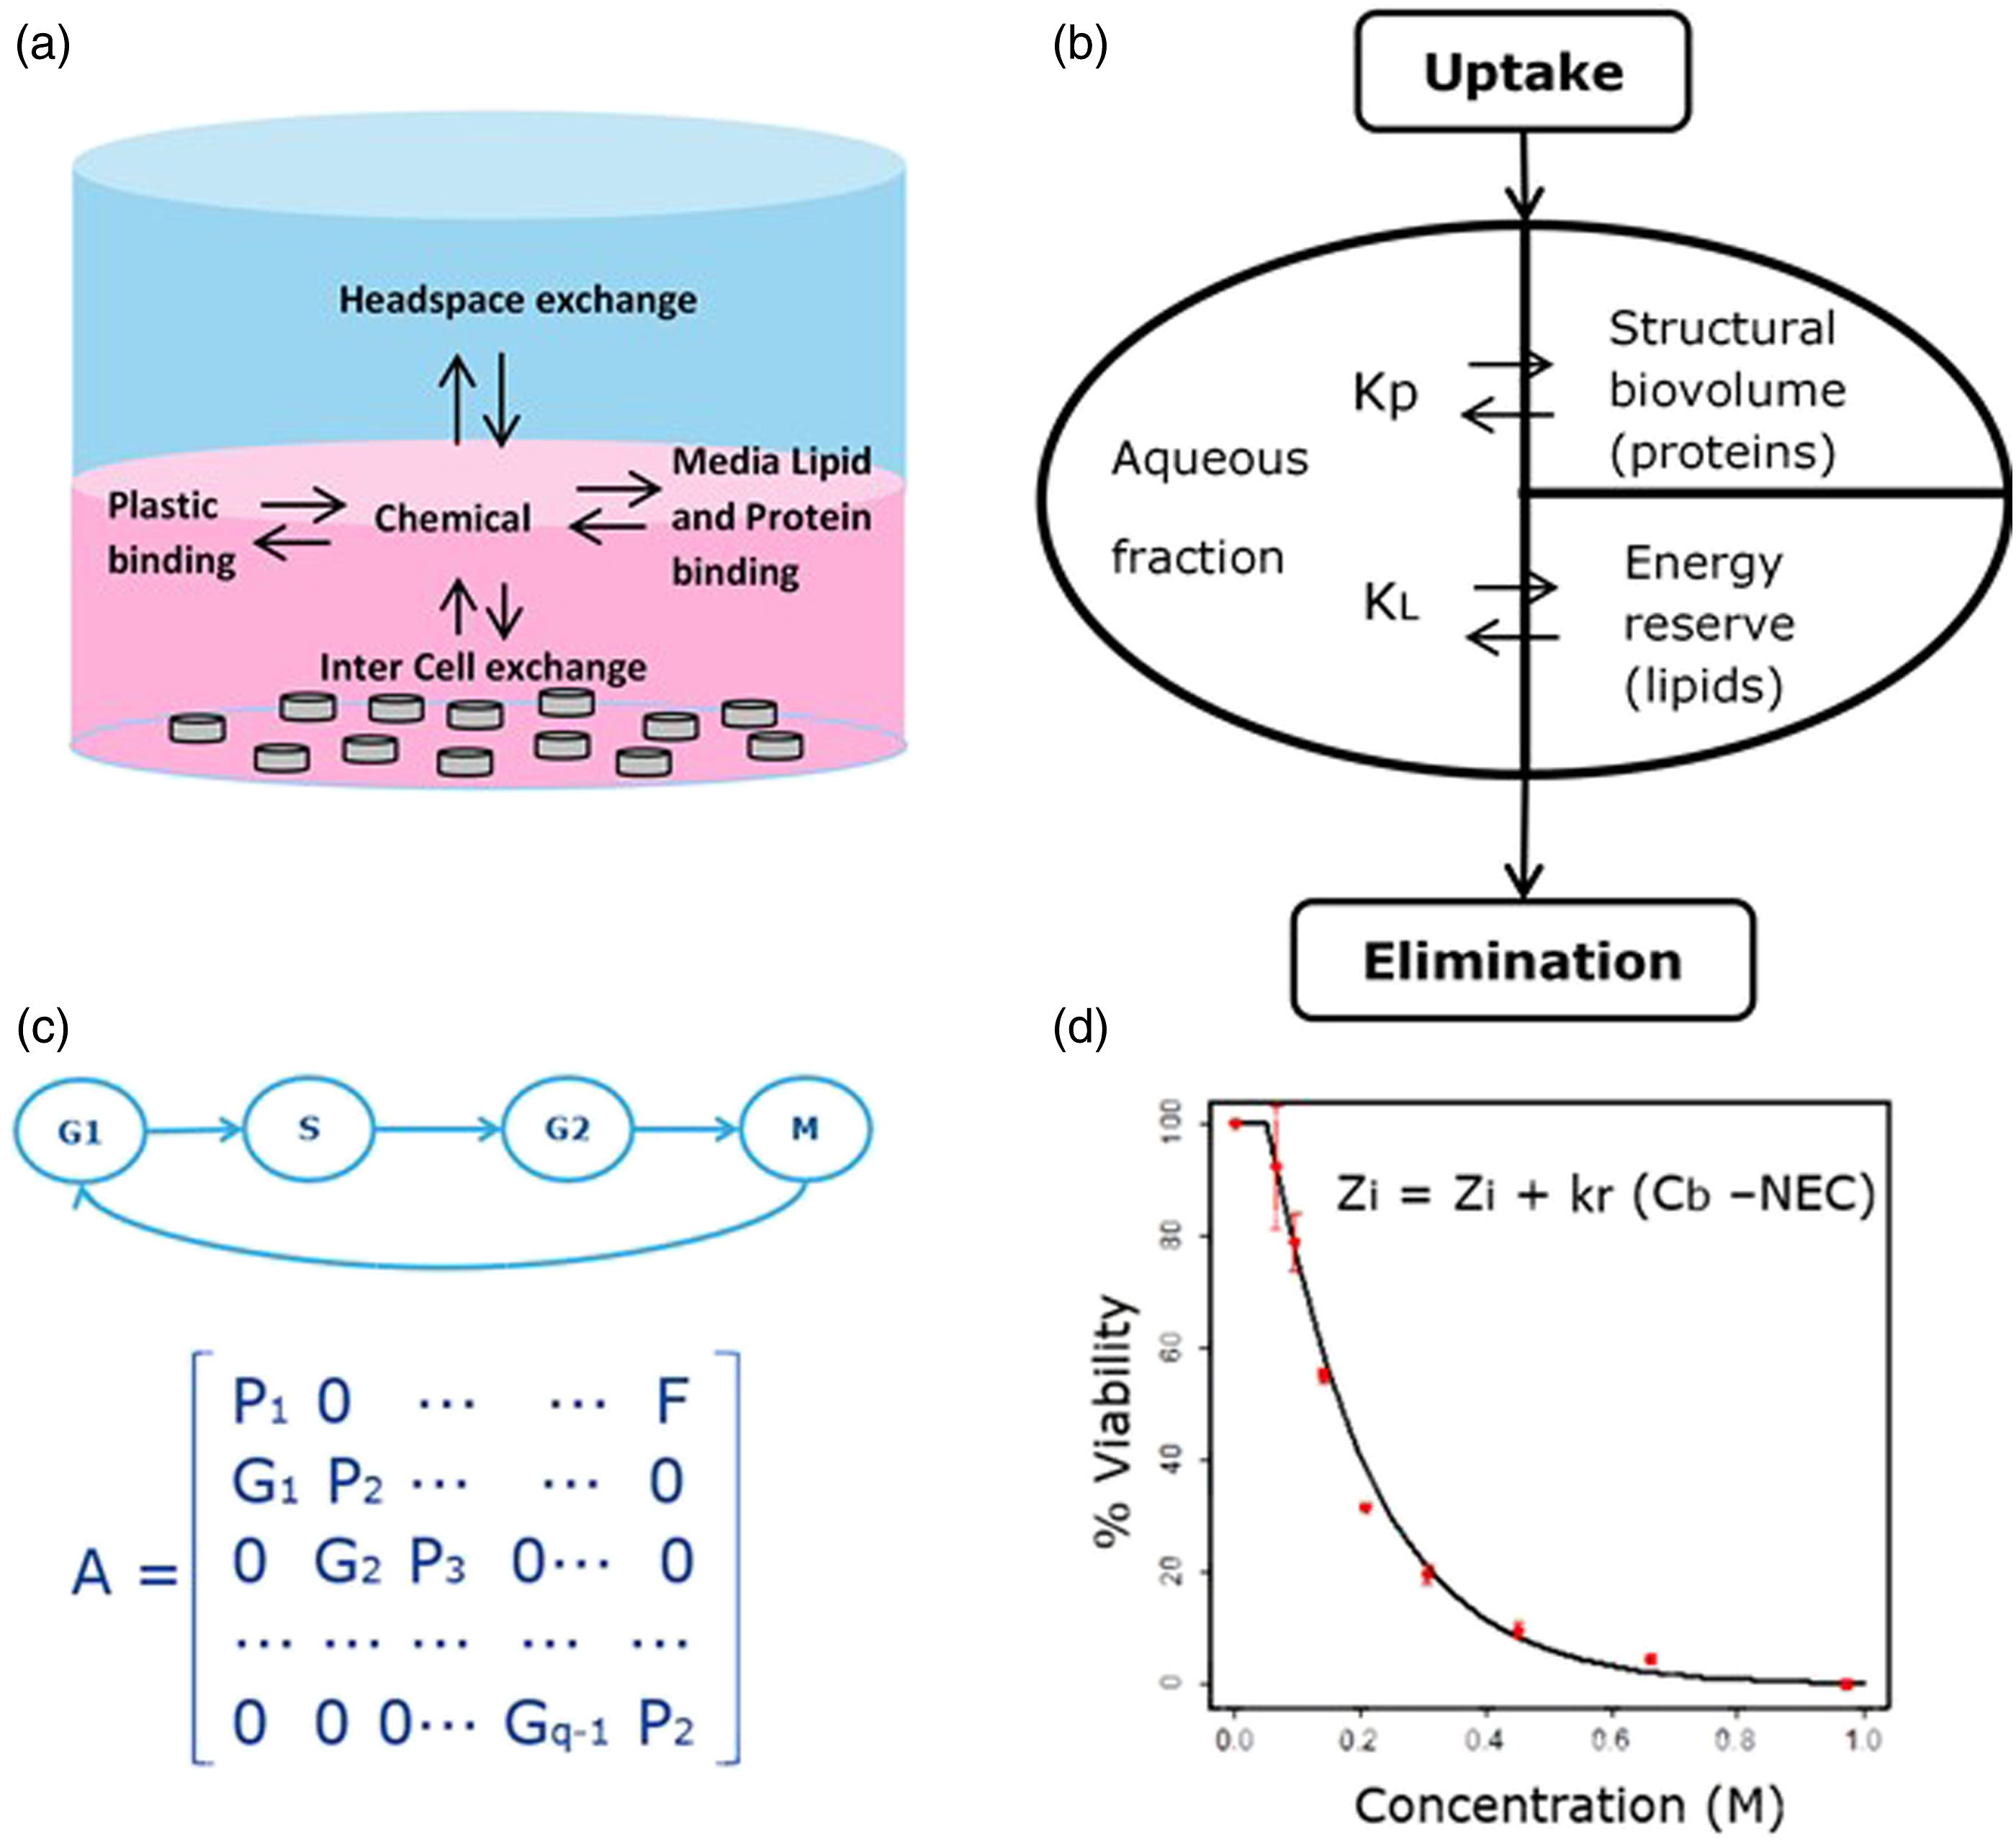
i) The fate and transport model: This describes changes in compound concentration in the medium (Figure 1(a)), which can occur as a result of adsorption to plastic, evaporation into the headspace, and binding to lipids and proteins in the medium.
ii) The cell partitioning model: This describes processes inside the cells, such as partitioning between lipid, protein and water (Figure 1(b)), which depends on the chemical characteristics of the test compounds and cell type/culture composition.
iii) The cell growth and division model: This focuses on changes in cell populations (Figure 1(c)), which are simulated through four stages (G1, S, G2 and M cell cycle phases) by using a Leslie matrix. Depending on the type of cell under study, the cell growth and division can be adjusted. For instance, differentiated HepaRG cells do not proliferate and only the G1 phase is considered, whereas for the 3T3 cell line, the four stages are considered since these cells proliferate, grow and divide.
iv) The toxicity and effects model: This simulates in vitro toxicity (toxicodynamics) by optimising two parameters (Figure 1(d)), the killing rate (kr) and the No Effect Concentration (NEC).
The full description of the original model and the relevant equations can be found in Zaldivar Comenges et al., 16 while an updated version can be found in Proença et al. 18
Additionally, the VCBA model considers the experimental setup, including the shape and size of the wells, the volume of media used and the amount of supplemented serum and, thus, the amount of protein and lipids in the medium. The VCBA model was developed in the context of the COSMOS project, funded by the EU’s seventh Framework Programme SEURAT-1 project (http://www.seurat-1.eu).27,28
As mentioned in Graepel et al., 28 one of the possible extensions of the VCBA is the integration of virtual cells into virtual organs and organisms — so called multiscale modelling. These models capture the interplay between different structures in tissues, organs and the whole body, by scaling up from cell level to full organism.29,30 One step towards multiscale modelling of the whole body could be achieved via the extension of the current VCBA model to incorporate 3-D culture systems to describe spheroids, for instance. 31
Modern toxicological assessments are increasingly based on the combination of several complementary methods, such as the Integrated Approaches to Testing and Assessment, which are being explored by the Organisation for Economic Co-operation and Development. 32 This includes the combination of in vivo, in vitro and in silico methods and/or models. To ensure the success of this approach, it is essential that the combined testing systems are compatible. To this end, extension of the 2-D VCBA model to describe and capture more complex systems like 3-D spheroid cell cultures, could improve the detection of potential toxic effects, assist in optimising the experimental setup and permit the better translation and interpretation of in vitro data for risk assessment.33,34
Methodology
Stepwise approach from a 2-D to a 3-D system
The aim of the current work was to extend the 2-D VCBA model, 16 in order to incorporate 3-D structure and capture the biological interactions that occur in 3-D culture systems (specifically a cell spheroid model). This was done by taking into account the differences between the 2-D and 3-D in vitro systems and translating 3-D in vitro culture systems into theoretical mathematical models, including the reporting of assumptions and simplifications. In order to achieve this, a stepwise approach was applied.
The first step was to choose, compare and highlight the main differences between the in vitro cell lines employed in the two models. HepaRG cells were used in the development of the 2-D VCBA model and were also explored in the current work in the form of spheroids. The architecture of the differentiated HepaRG cell line in both 2-D and 3-D format was studied, in order to capture the features of the 3-D structure and so to update the mathematical model. In addition, differences in the experimental setups were taken into account (i.e. the type of medium and ingredients, lipid and protein amounts, as well as geometrical features).
In addition, the behaviour of the in vitro cell systems when exposed to a toxicant was investigated. The differentiated HepaRG cell line and acetaminophen (APAP) was the chosen combination of test cell line and test chemical, because it is one of the most well-studied and representative pairings used to illustrate cytotoxic effects on the liver. HepaRG spheroid data were taken from Leite et al. 35 Exposure to APAP for 24 hours was used to validate model predictions of the toxic effects of APAP.
The third step was to adjust the VCBA code to a 3-D spheroid culture system by reporting characteristics of the system and assumptions, and by calibrating the model with information on the chemical and on the experimental setup. Finally, the 3-D VCBA model predictions were compared with the 3-D in vitro cytotoxicity data.
The assumptions made for the development of the in silico models and the actual characteristics of the in vitro systems on which they are based.
Adjustment of the VCBA code to 3-D culture
The 2-D VCBA code written in Matlab by Zaldivar Comenges et al.17,36,37 was adapted to account for 3-D spherical structure and biological changes after chemical exposure (code is available in Online Supplementary Appendix A). To do this, the principles reported in Achilli et al.
38
were used. They estimated spheroid cell culture as a series of concentric spheres (multilayers), with each layer resembling a shell geometry. In the current study, to make the adjustment, the spheroid 3-D culture was divided in a concentric manner into spherical layers. Each layer was one cell-thick and was considered as a 2-D VCBA model, sequentially, from the outermost to the innermost cell. The development of theoretical descriptions of this culture environment involves basic assumptions concerning the geometry and quasi-diffusion behaviour of the spheroid, as shown in Table 1 and Figures 2 and 3.
38
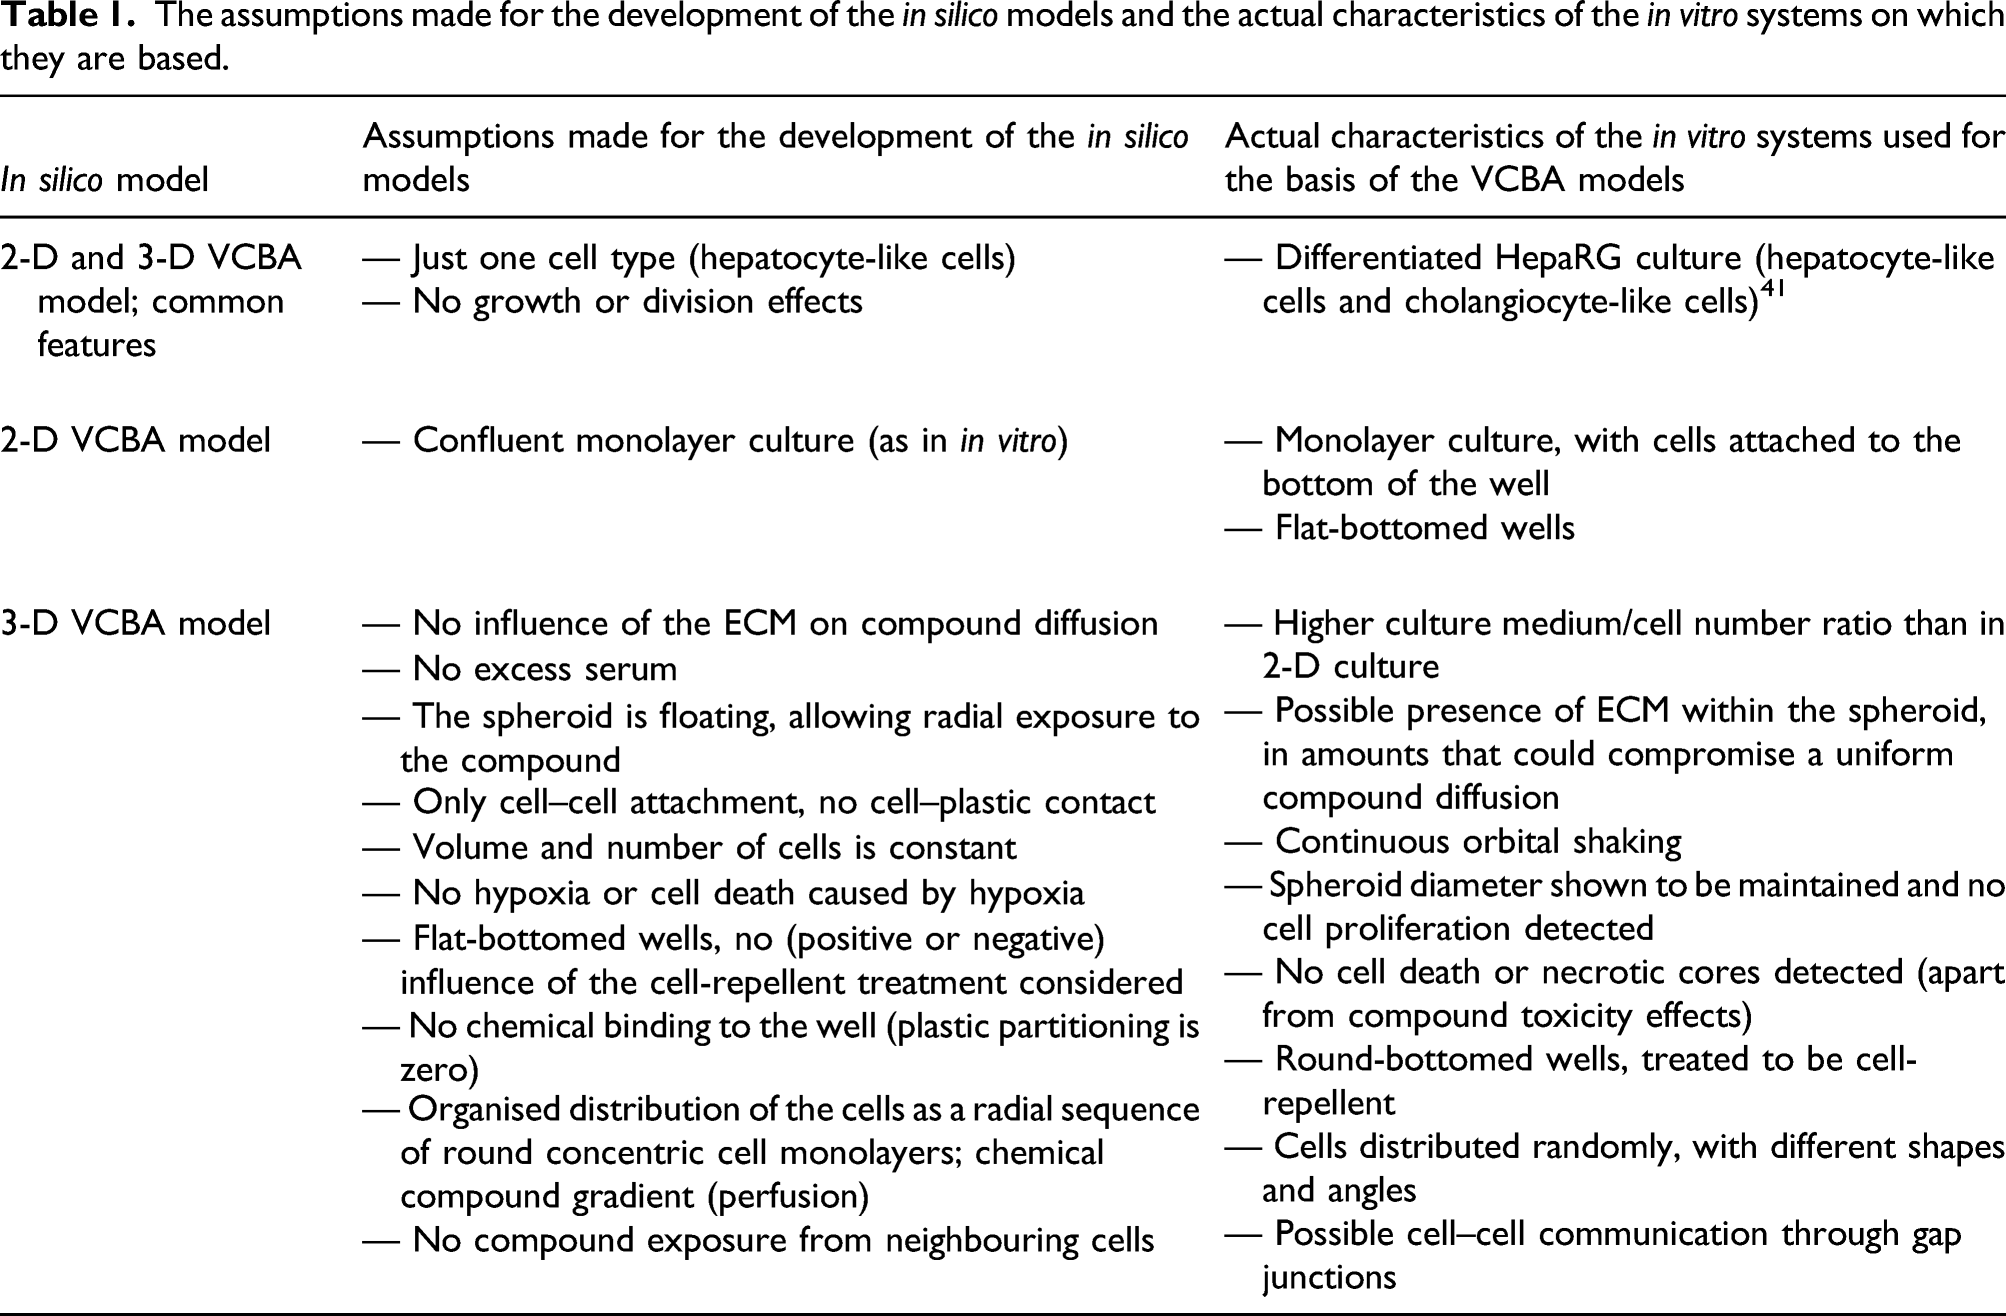
The mathematical basis of the 3-D culture model. From left to right: An actual HepaRG spheroid (size bar = 100 μm); a diagram to show the assumption that the spheroid is divided into seven layers of approximate radius; a spherical sector, simplified to 2-D and filled with cells. SR = spherical radius. A description of the chemical exposure of each layer. (a) Visualisation of the time delay process between consecutive layers (L1, L2, …, Ln) exposed to a certain concentration of a chemical compound. Layer L1 was exposed to the concentration of chemical C
tot
at time t
0
. After an assumed time delay (LTx), x percent of cells in the external layer (in this instance L1) were dead; at time t
L1
the L2 exposure to Ctot(n+1) begins. The process is repeated for consecutive layers. (b) An illustration of how the chemical concentration of a compound varies over the different layers. C
tot
was different for each layer L(n + 1), because of the chemical concentration in the cell, C
b(n)
, in the previous layer Ln.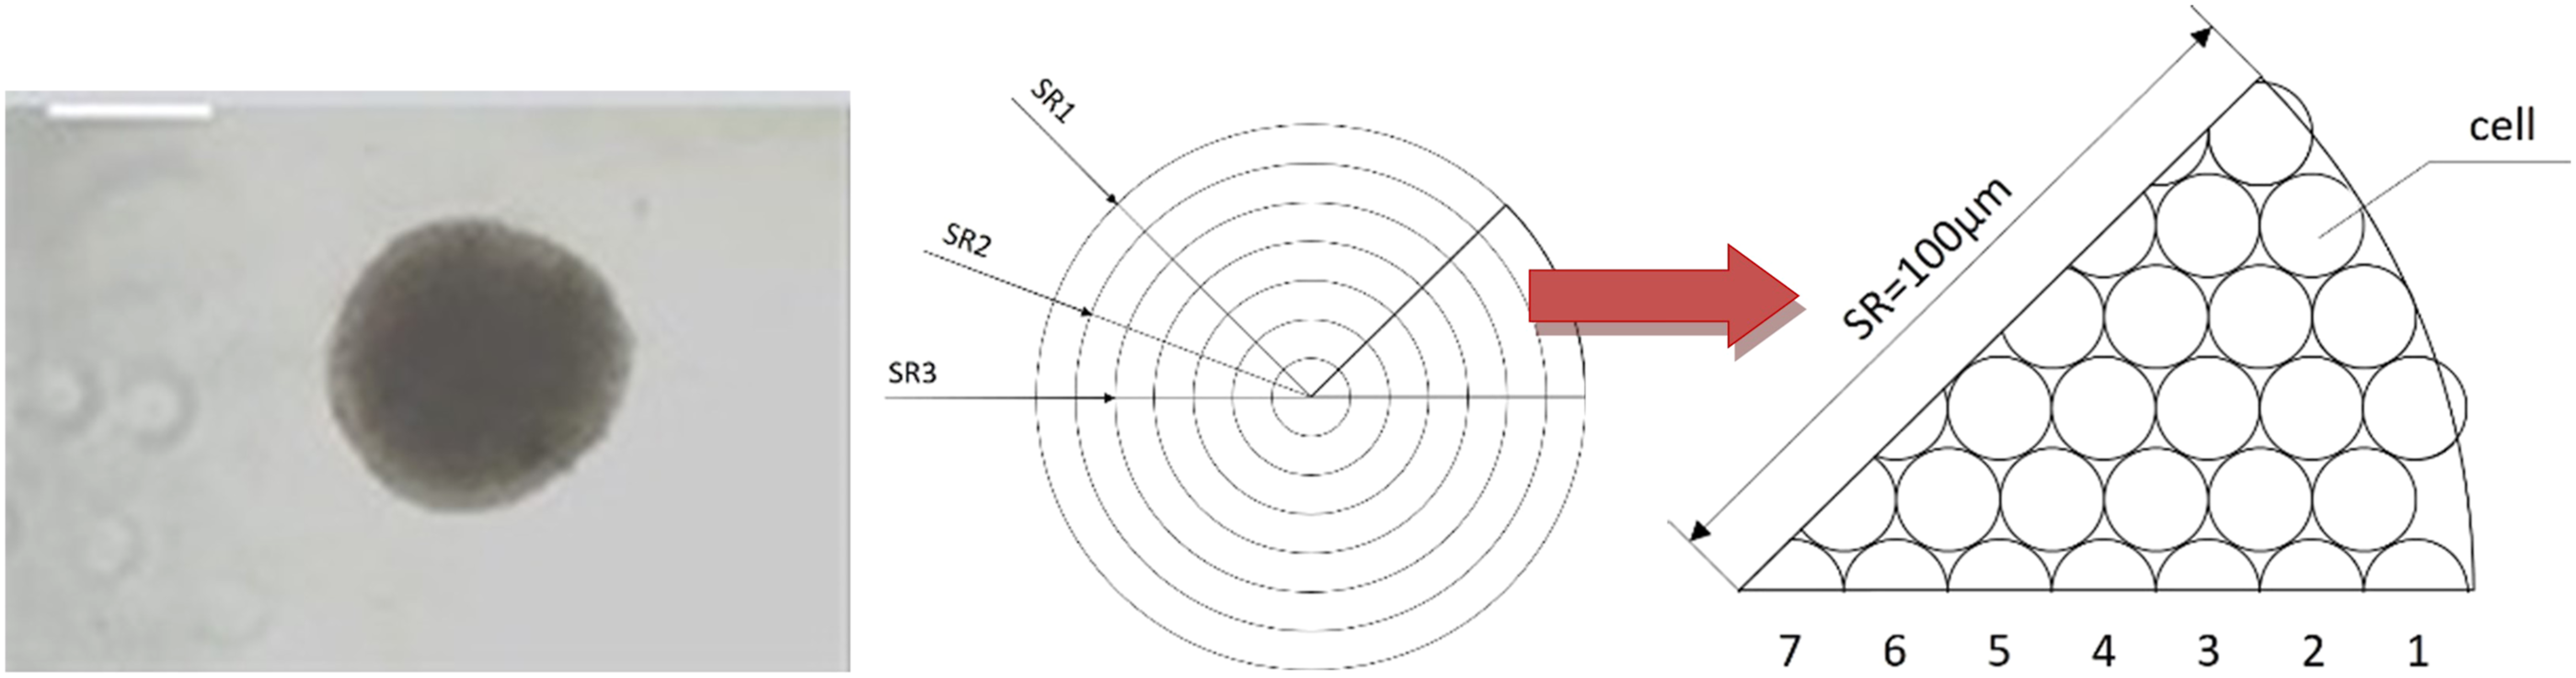
Mathematical description of the 3-D culture
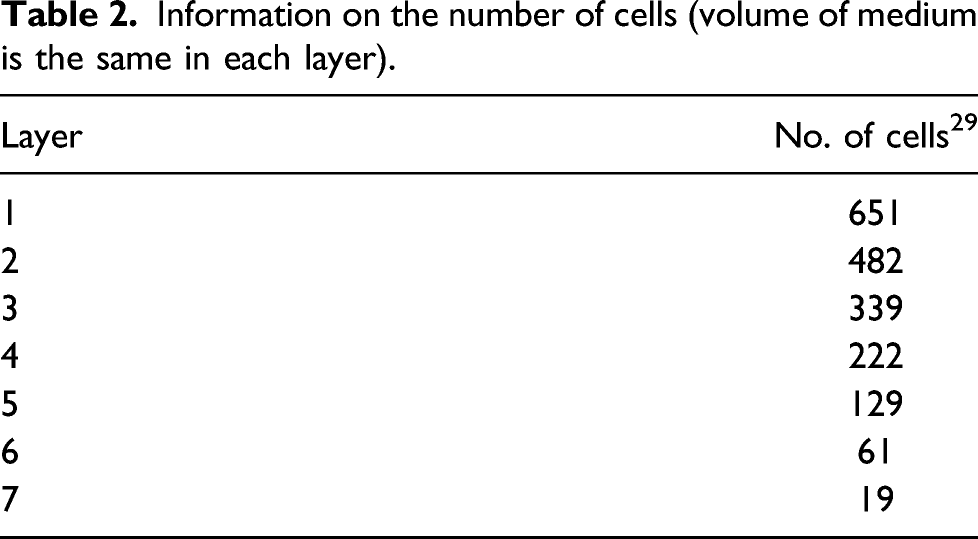
The mathematical description of the 3-D culture started by first estimating the number of cell layers and cell numbers in each layer. Although the in vitro data have shown random distribution of the HepaRG cells inside the sphere, for simplicity, a layered structure was assumed (Figure 2). 38 We also assumed that both the 3-D spheroid and single cell are perfectly rounded spheres, and that each cell is of the same size. For a close-packed arrangement of equal spheres, the greatest fraction of space occupied by spheres is about 0.74. Based on the average diameter of the 3-D spheroids (200 μm), it was possible to calculate the total number of cells in the spheroid (2000) and the cell radius (about 7.18 μm). By dividing the radius of the 3-D spheroid by the diameter of the cell, the number of cell layers was calculated to be seven. The possible formation of extracellular matrix (ECM) in between the cells was not considered in this study, and it was assumed that the small spaces in between the cells were occupied by culture medium.
In the 3-D VCBA model, every spheroid layer was ‘flattened out’ so that it could be treated as a monolayer (i.e. as 2-D). The chemical quasi-diffusion process was formulated with respect to the number of cells in every layer after simplification of the spheroid structure. The detailed diffusion process through the cell was not considered; the focus was on the time delay processes between consecutive layers after chemical exposure (Figure 3(a)). According to the process described, the cells in the first layer receive exposure to the chemical from the surrounding medium in the well (Figure 3(b)), which is considered the total concentration (
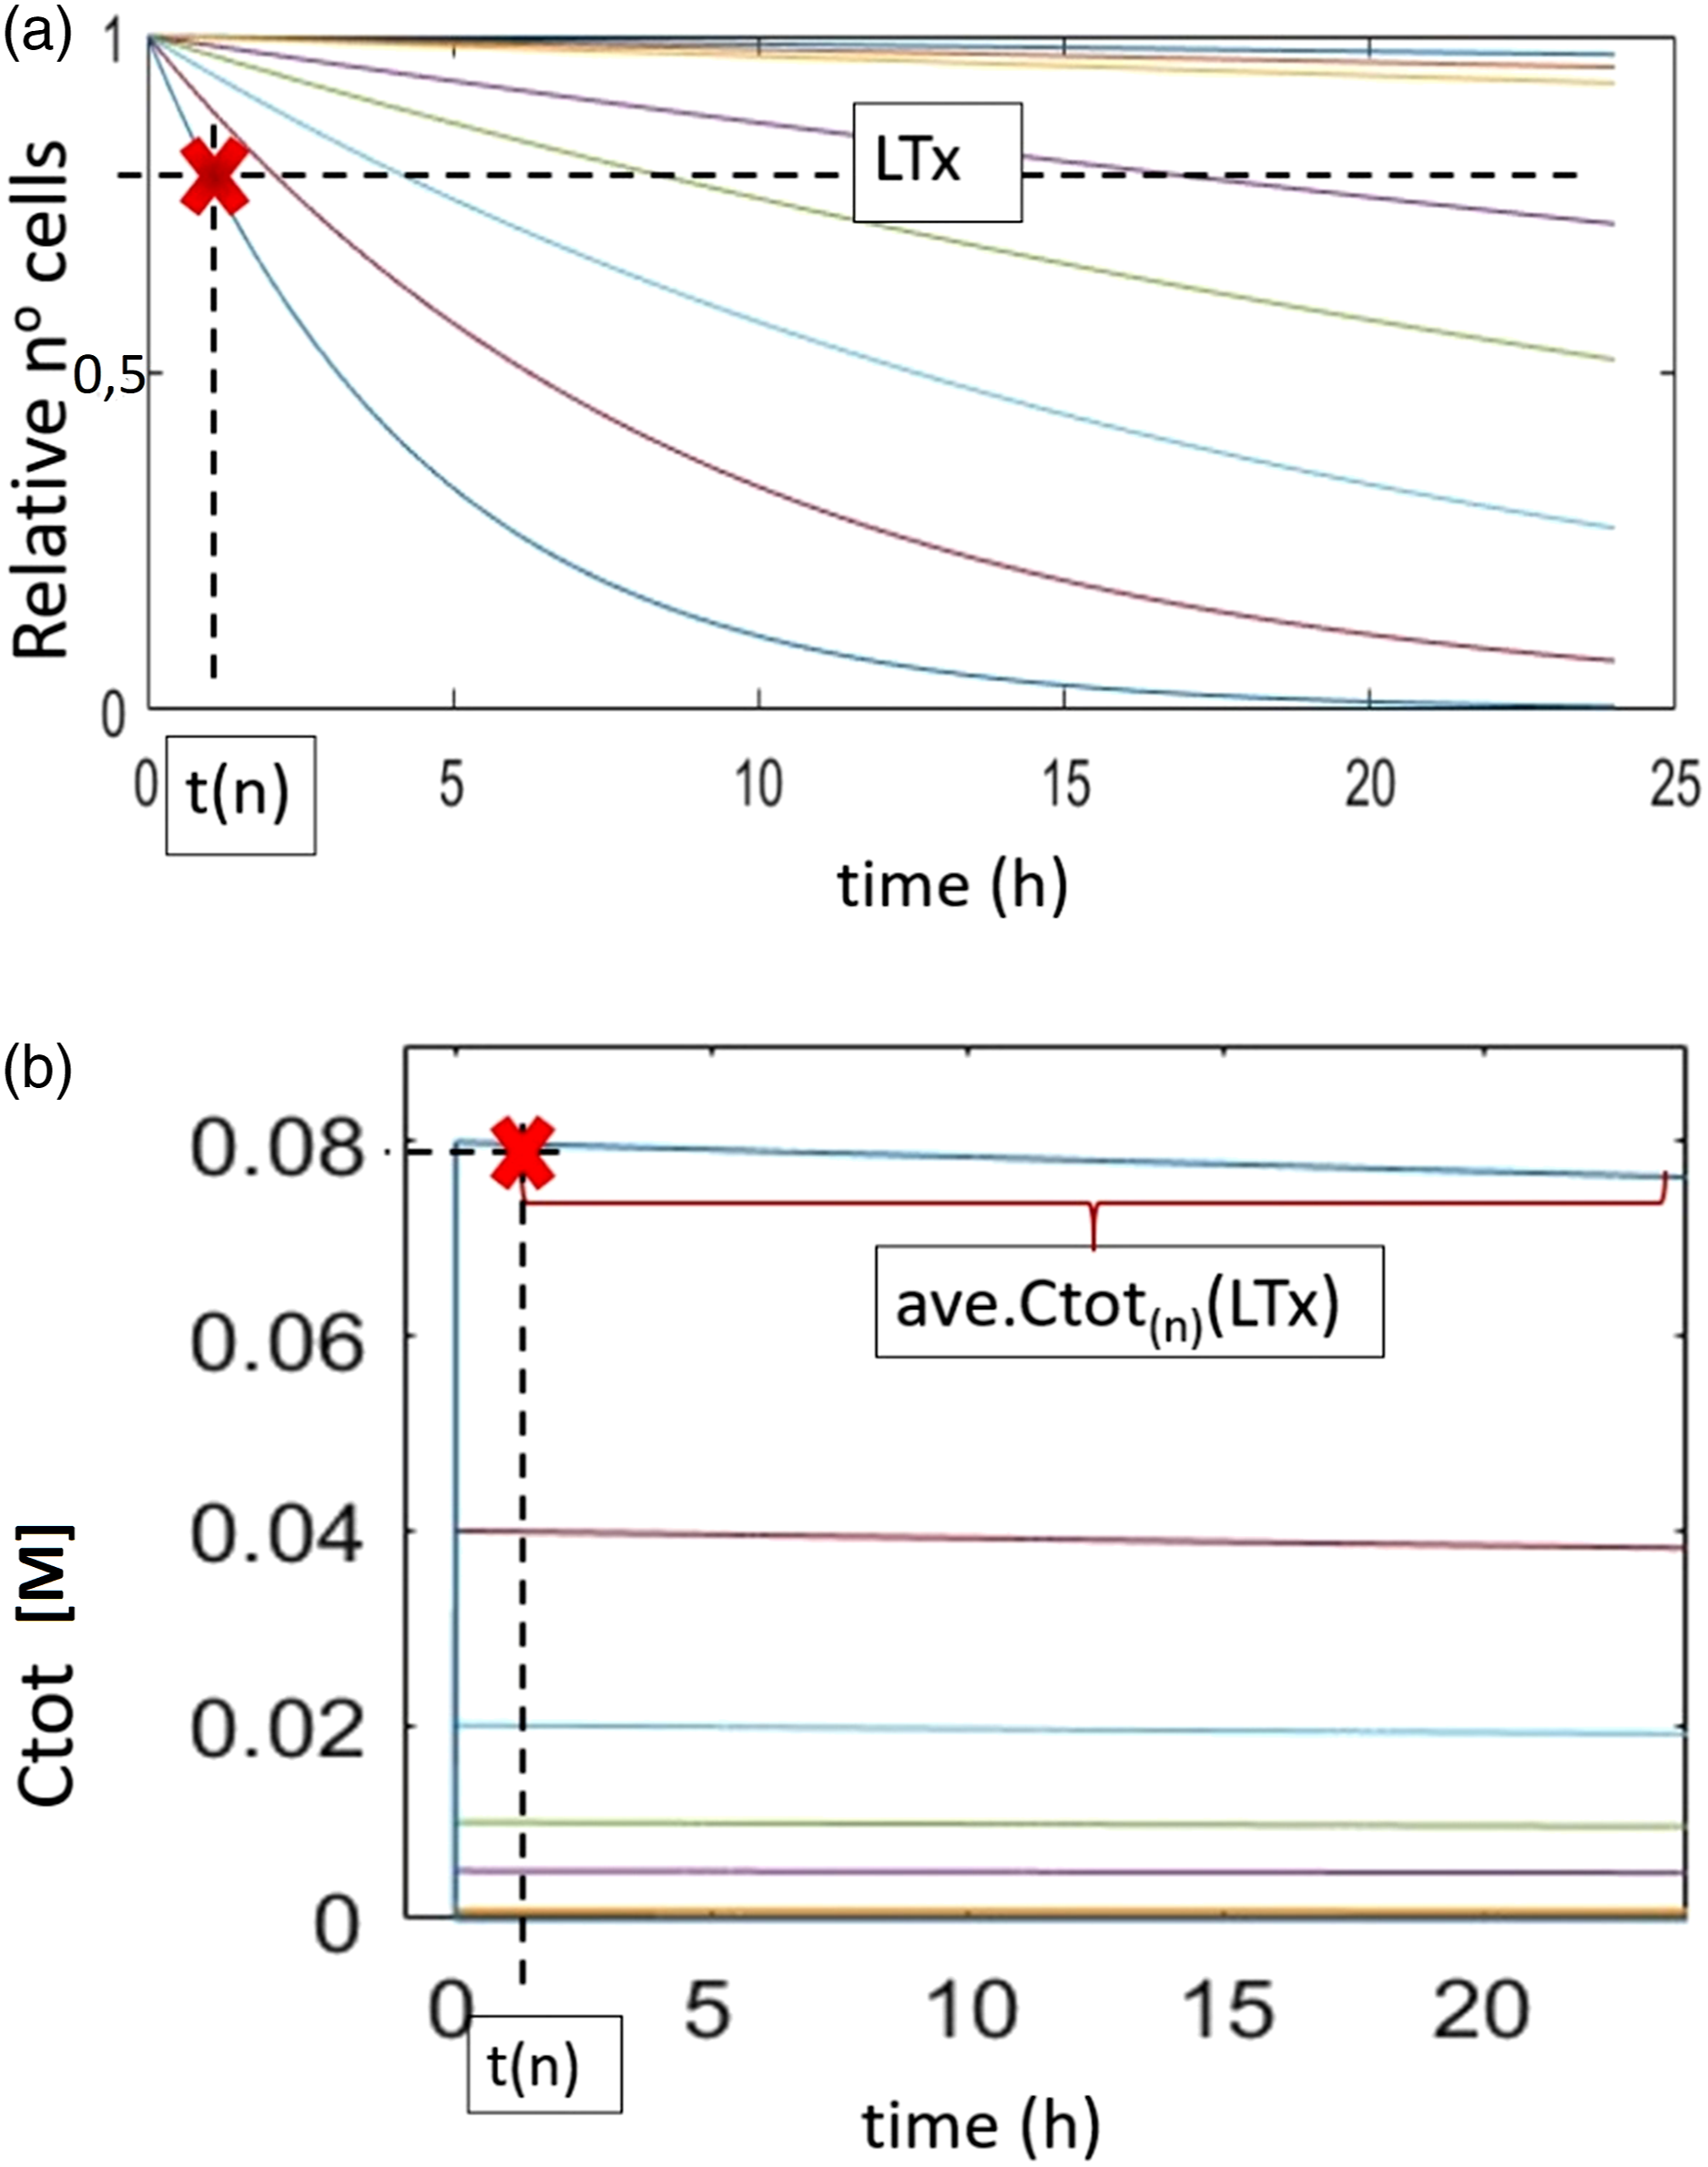
Estimation of the time t(n) for the selected layer (shown as coloured lines in Figure 4(a)) was made when a given quantity of triggering mortality (x% cell mortality) was reached. Identified t(n) (Figure 4(a)) was used to predict the The determination of lethal time and chemical concentration at the cell layer. (a) The mechanism of estimating time t
(n)
for a given lethal time, LTx, for a layer exposed to a given concentration of a chemical. (b) The mechanism for finding 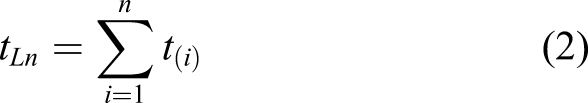
We believe that diffusion through the cells is probably not constant, that there is impedance, and that the outer layer receives the most significant exposure, as it is directly exposed to the medium and thus to the compound in the medium. For each inner layer, this would only happen if the previous layer disappeared, that is, if a very high proportion of the outer cells were killed.
Model verification and parameter description of the 3-D cultures
To verify and evaluate the proposed 3-D VCBA model, the predictions were compared with experimental data from Leite et al. 35 The 3-D HepaRG monoculture was subjected to a single exposure of APAP for 24 hours. The concentrations of APAP tested were: 0, 0.5, 1, 5, 10, 20, 40 and 80 μM. In order to run the model and compare the model predictions with the in vitro data, certain parameters, such as chemical properties of the toxicant and media, were defined, as well as the physical constants and geometry of the cells. The same parameter values were used as for the 2-D VCBA model, 16 with the necessary adjustments to 3-D (listed in Online Supplementary Appendix B). The toxicodynamic parameters kr and NEC were estimated from in-house experimental 2-D culture data (code and data in Online Supplementary Appendix A and Appendix C). The optimised value for kr is 0.1632 and for NEC is 0.
Results
Defining the 3-D structure in the VCBA model
Cell number and spatial arrangement in the spheroid are important input parameters for the VCBA model, and these were estimated based on the experimental data obtained by Leite and co-workers. 35
Information on the number of cells (volume of medium is the same in each layer).
Simulations of the VCBA, based on the 3-D structure
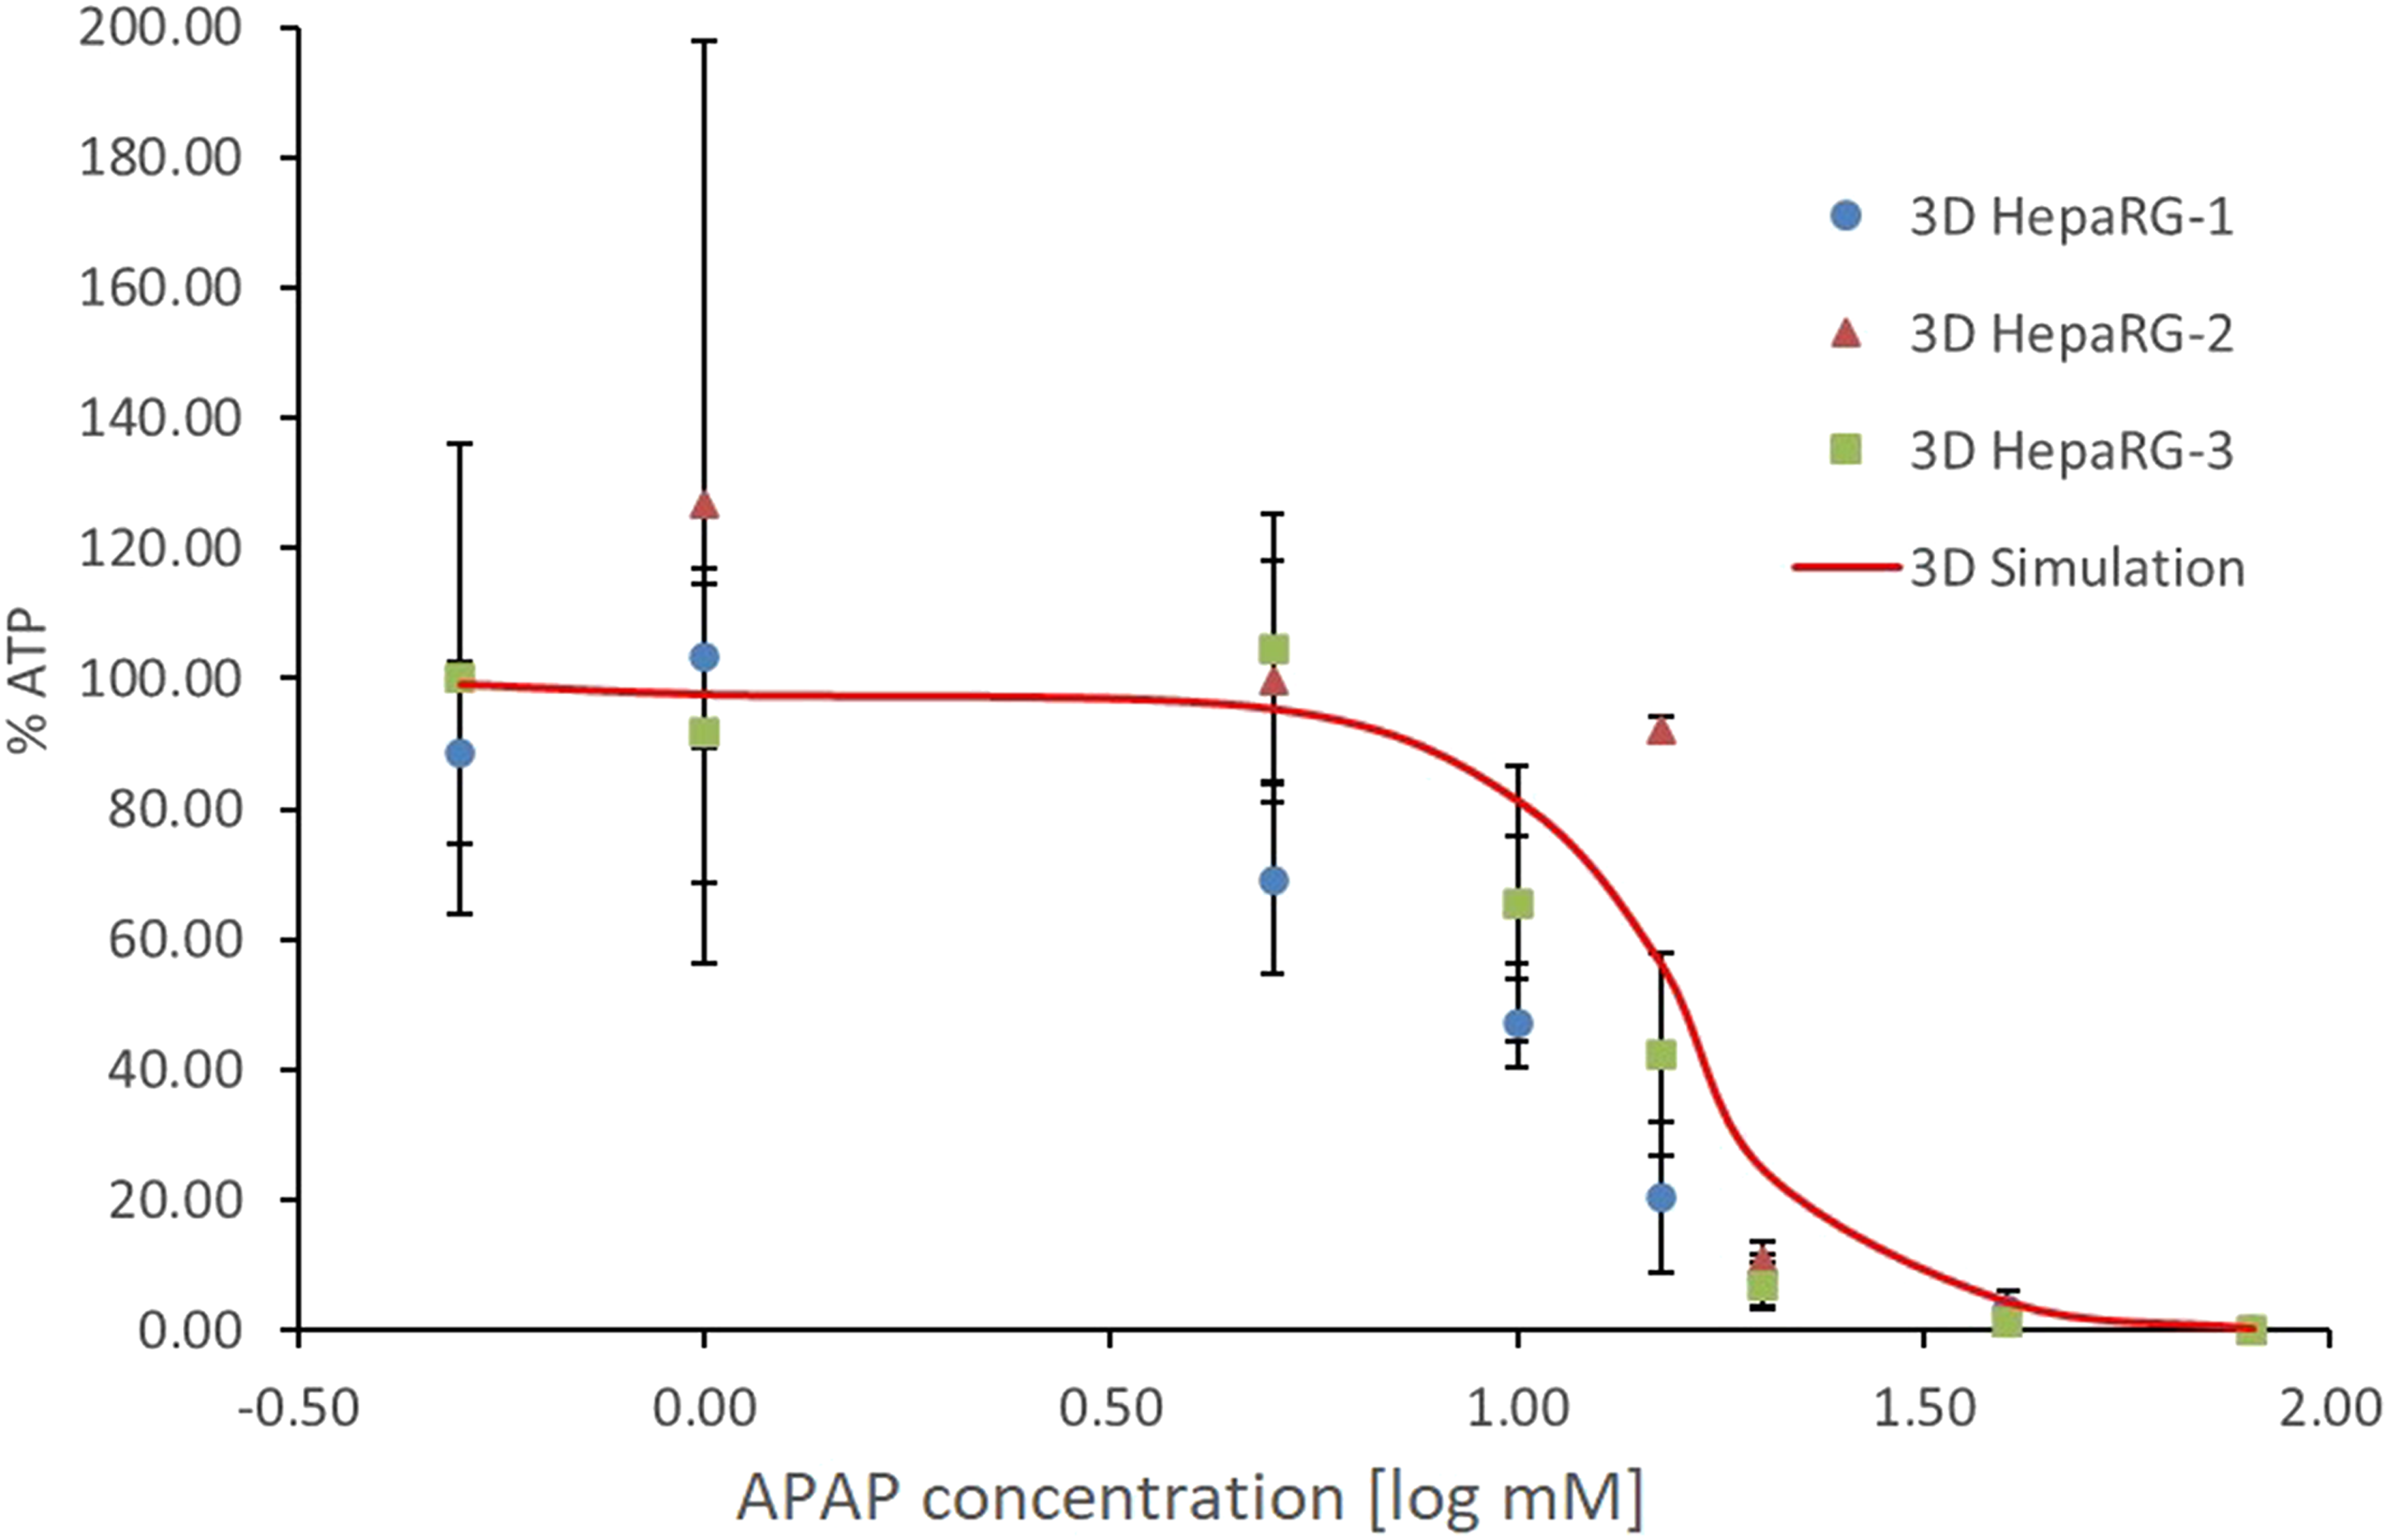
Following the process of model adaptation from 2-D to 3-D, after estimating the number of cell layers and the cell numbers in each layer, the lethal time for x% mortality (LTx) was determined according to the principles of the 3-D simulation. In line with the methodology (as described in the section Mathematical description of the 3-D culture), the VCBA model theory was applied to every layer. As highlighted earlier, each subsequent layer has a different number of cells and a different time delay influencing the toxicity of the chemical (Figure 3(a)). The time delay was associated with the fact that external layers were exposed first. Additionally, the amount of chemical assumed to reach each subsequent layer is different from that of the previous one, because of the chemical uptake by the cells in the previous layer. In order to compare the results from the in silico model with the experimental findings, the number of surviving cells in every layer was summed up after a 24-hour exposure to eight APAP concentrations (Figure 5). The results from the model were compared with experimental data from Leite et al.
35
(Figure 6). The number of living cells in each layer after a 24-hour exposure to different APAP concentrations, as simulated by the 3-D VCBA model. A comparison between historical experimental data, obtained after a 24-hour exposure to APAP, and the results obtained with the 3-D simulation. The historical experimental data, obtained after a 24-hour exposure to APAP, were taken from Leite et al.
35
These are shown as blue circles, orange triangles and green squares, according to the HepaRG cell batch. The 3-D simulation is shown as a red curve (kr = 0.16, LT10). The data represent the decrease in cell viability (% ATP) as a result of exposure to increasing concentrations of APAP (log mM). Error bars represent the mean ± SD.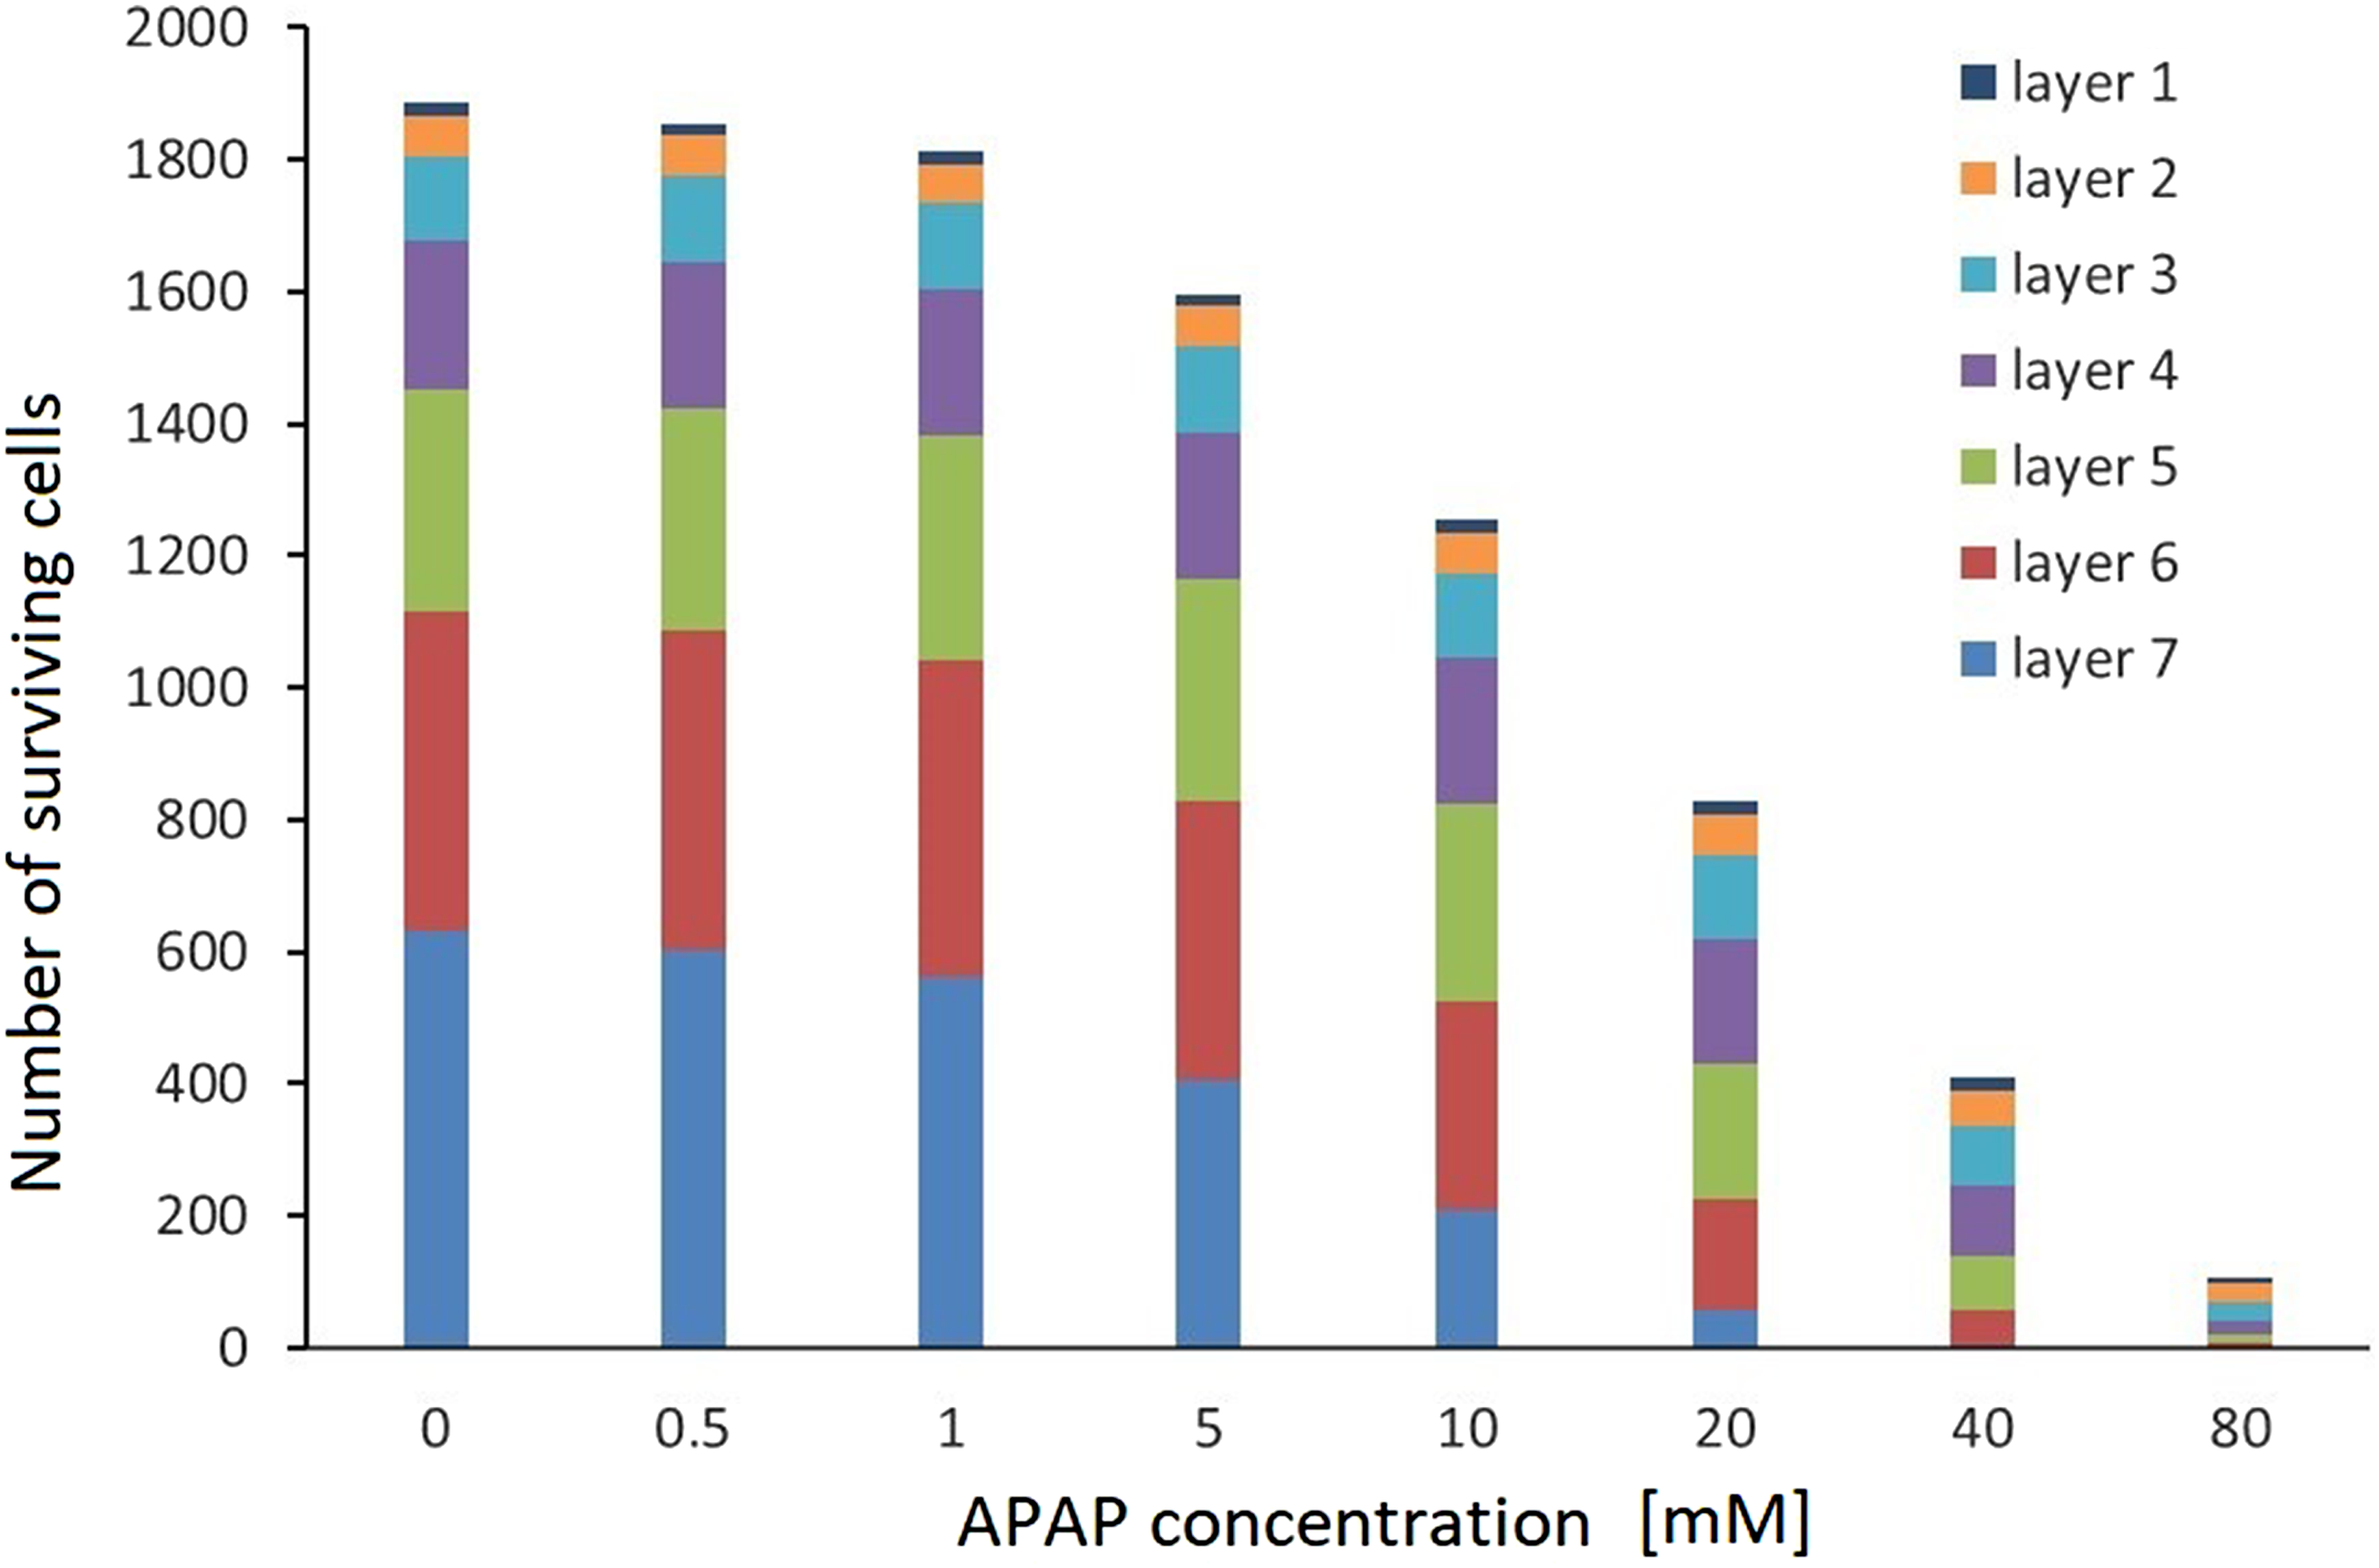
Verification of the VCBA 3-D simulations
To verify the 3-D model, the computational predictions were compared with the results obtained experimentally with 3-D cultures. Figure 6 shows the in vitro toxicity results of three different batches of cells in 3-D culture (i.e. 3D HepaRG-1, 3D HepaRG-2 and 3D HepaRG-3, as explained in the section Stepwise approach from a 2-D to a 3-D system), and the computer-simulated prediction model (Figure 6, 3D Simulation). It is evident that there is close correlation between the VCBA simulations and the experimental data with regard to the influence of compound concentration on the viability of the HepaRG 3-D cell cultures. The two sets of data match well at low (< 1 mM) and high (> 40 mM) APAP concentrations, but for intermediate concentrations, the toxicity of APAP is slightly underestimated.
Figure 7 shows the delay in cell death in successive layers in a time-dependent manner, with assumed lethal time LT10. Cell toxicity decreases as the layers become more internal within the spheroid (from 1 to 7). In other words, cell viability is higher for cells in the deeper layers. This observation is consistent with the quasi-diffusion assumptions. Reproducing the delayed effect in the 3-D culture mathematical simulation. The delayed effect refers to the time-dependent delay in cell death that affects successive layers in spheroids, from the outermost layers to the interior layers. This effect was simulated in the 3-D culture mathematical model (kr = 0.16, LT10, 24 hours). Layers 1–7 correspond to the cell layers in the spheroid, 1 being the outer layer and 7 the core.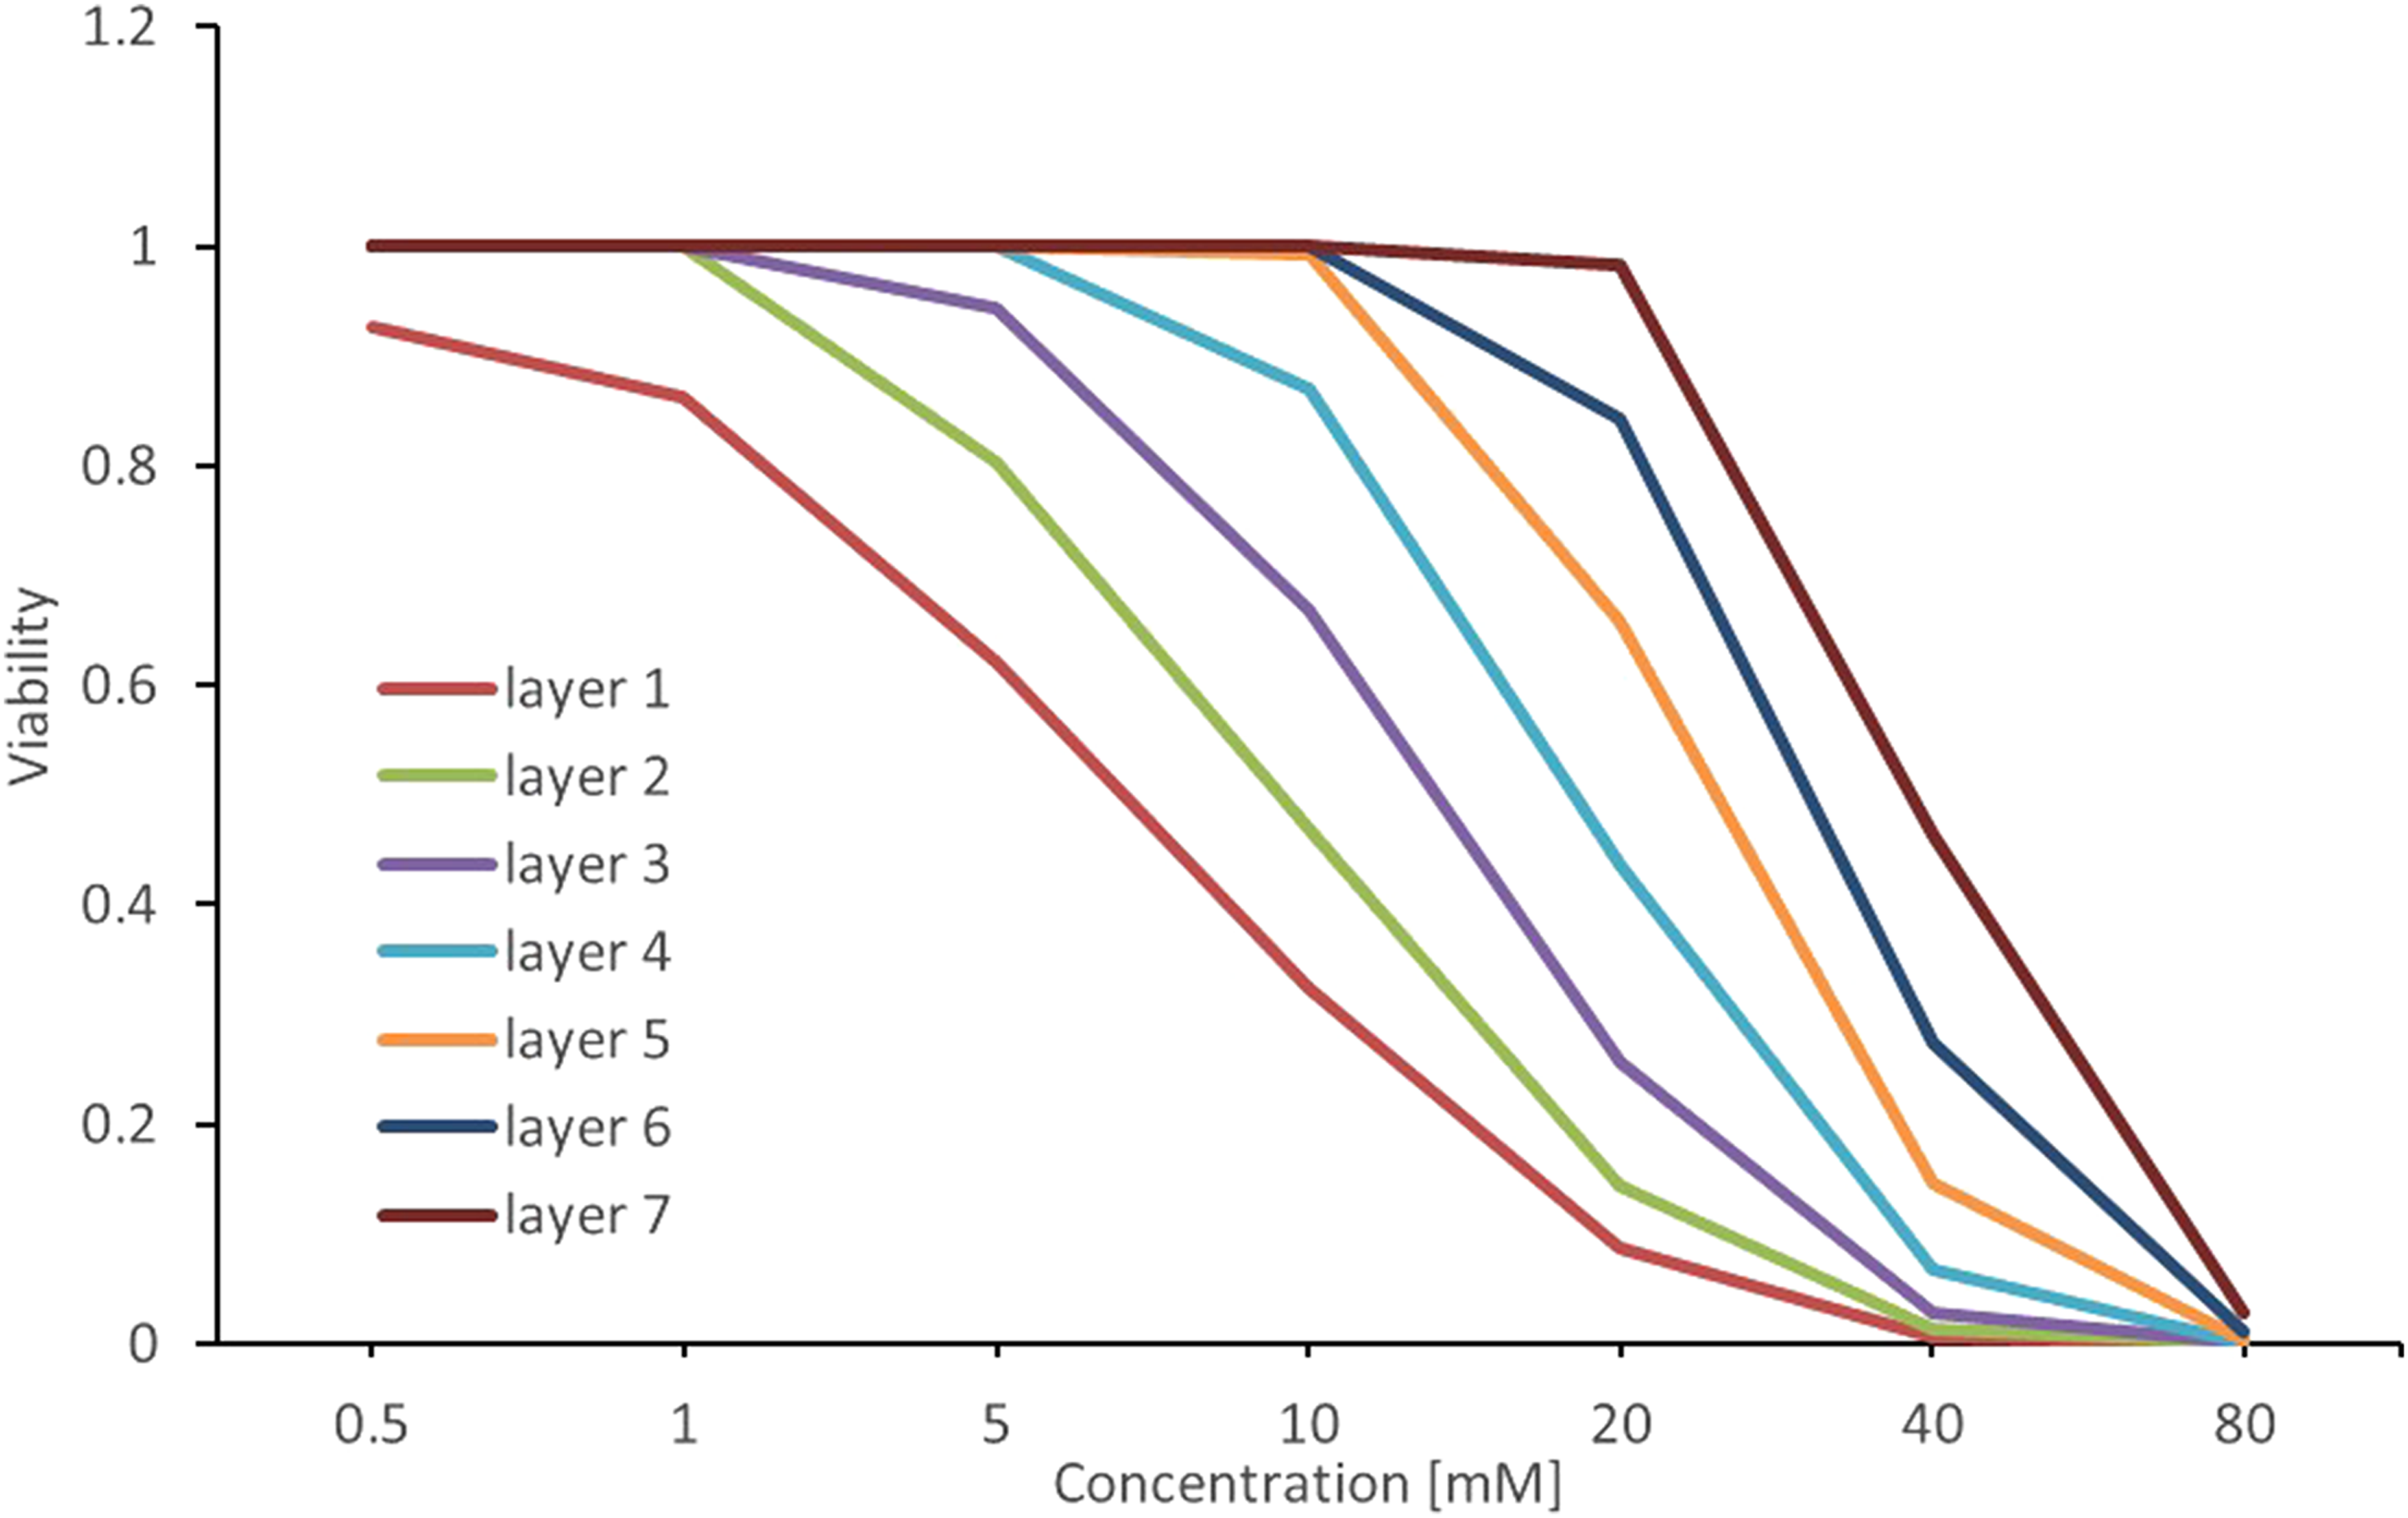
Figure 8 compares the results of the simulations when different lethal times were applied. Percentage cell mortality values of 10% and 20% were used, and the corresponding time delays were marked as LT10 and LT20, respectively. The results show that changing the triggering mortality (x% cell mortality) accelerates or inhibits the simulated rate of cell mortality. The comparison confirms the impact of the assumed lethal time in the whole diffusion process (see the section on Mathematical description of the 3-D culture). A comparison between historical experimental data, obtained after a 24-hour exposure to APAP, and the results obtained with the 3-D simulation when using different lethal times. The historical experimental data, obtained after a 24-hour exposure to APAP, were taken from Leite et al.
35
These are shown as blue circles, orange triangles and green squares, according to the HepaRG cell batch. The 3-D simulations are shown as red and blue curves, each referring to a different lethal time (LT). Error bars represent the mean ± SD.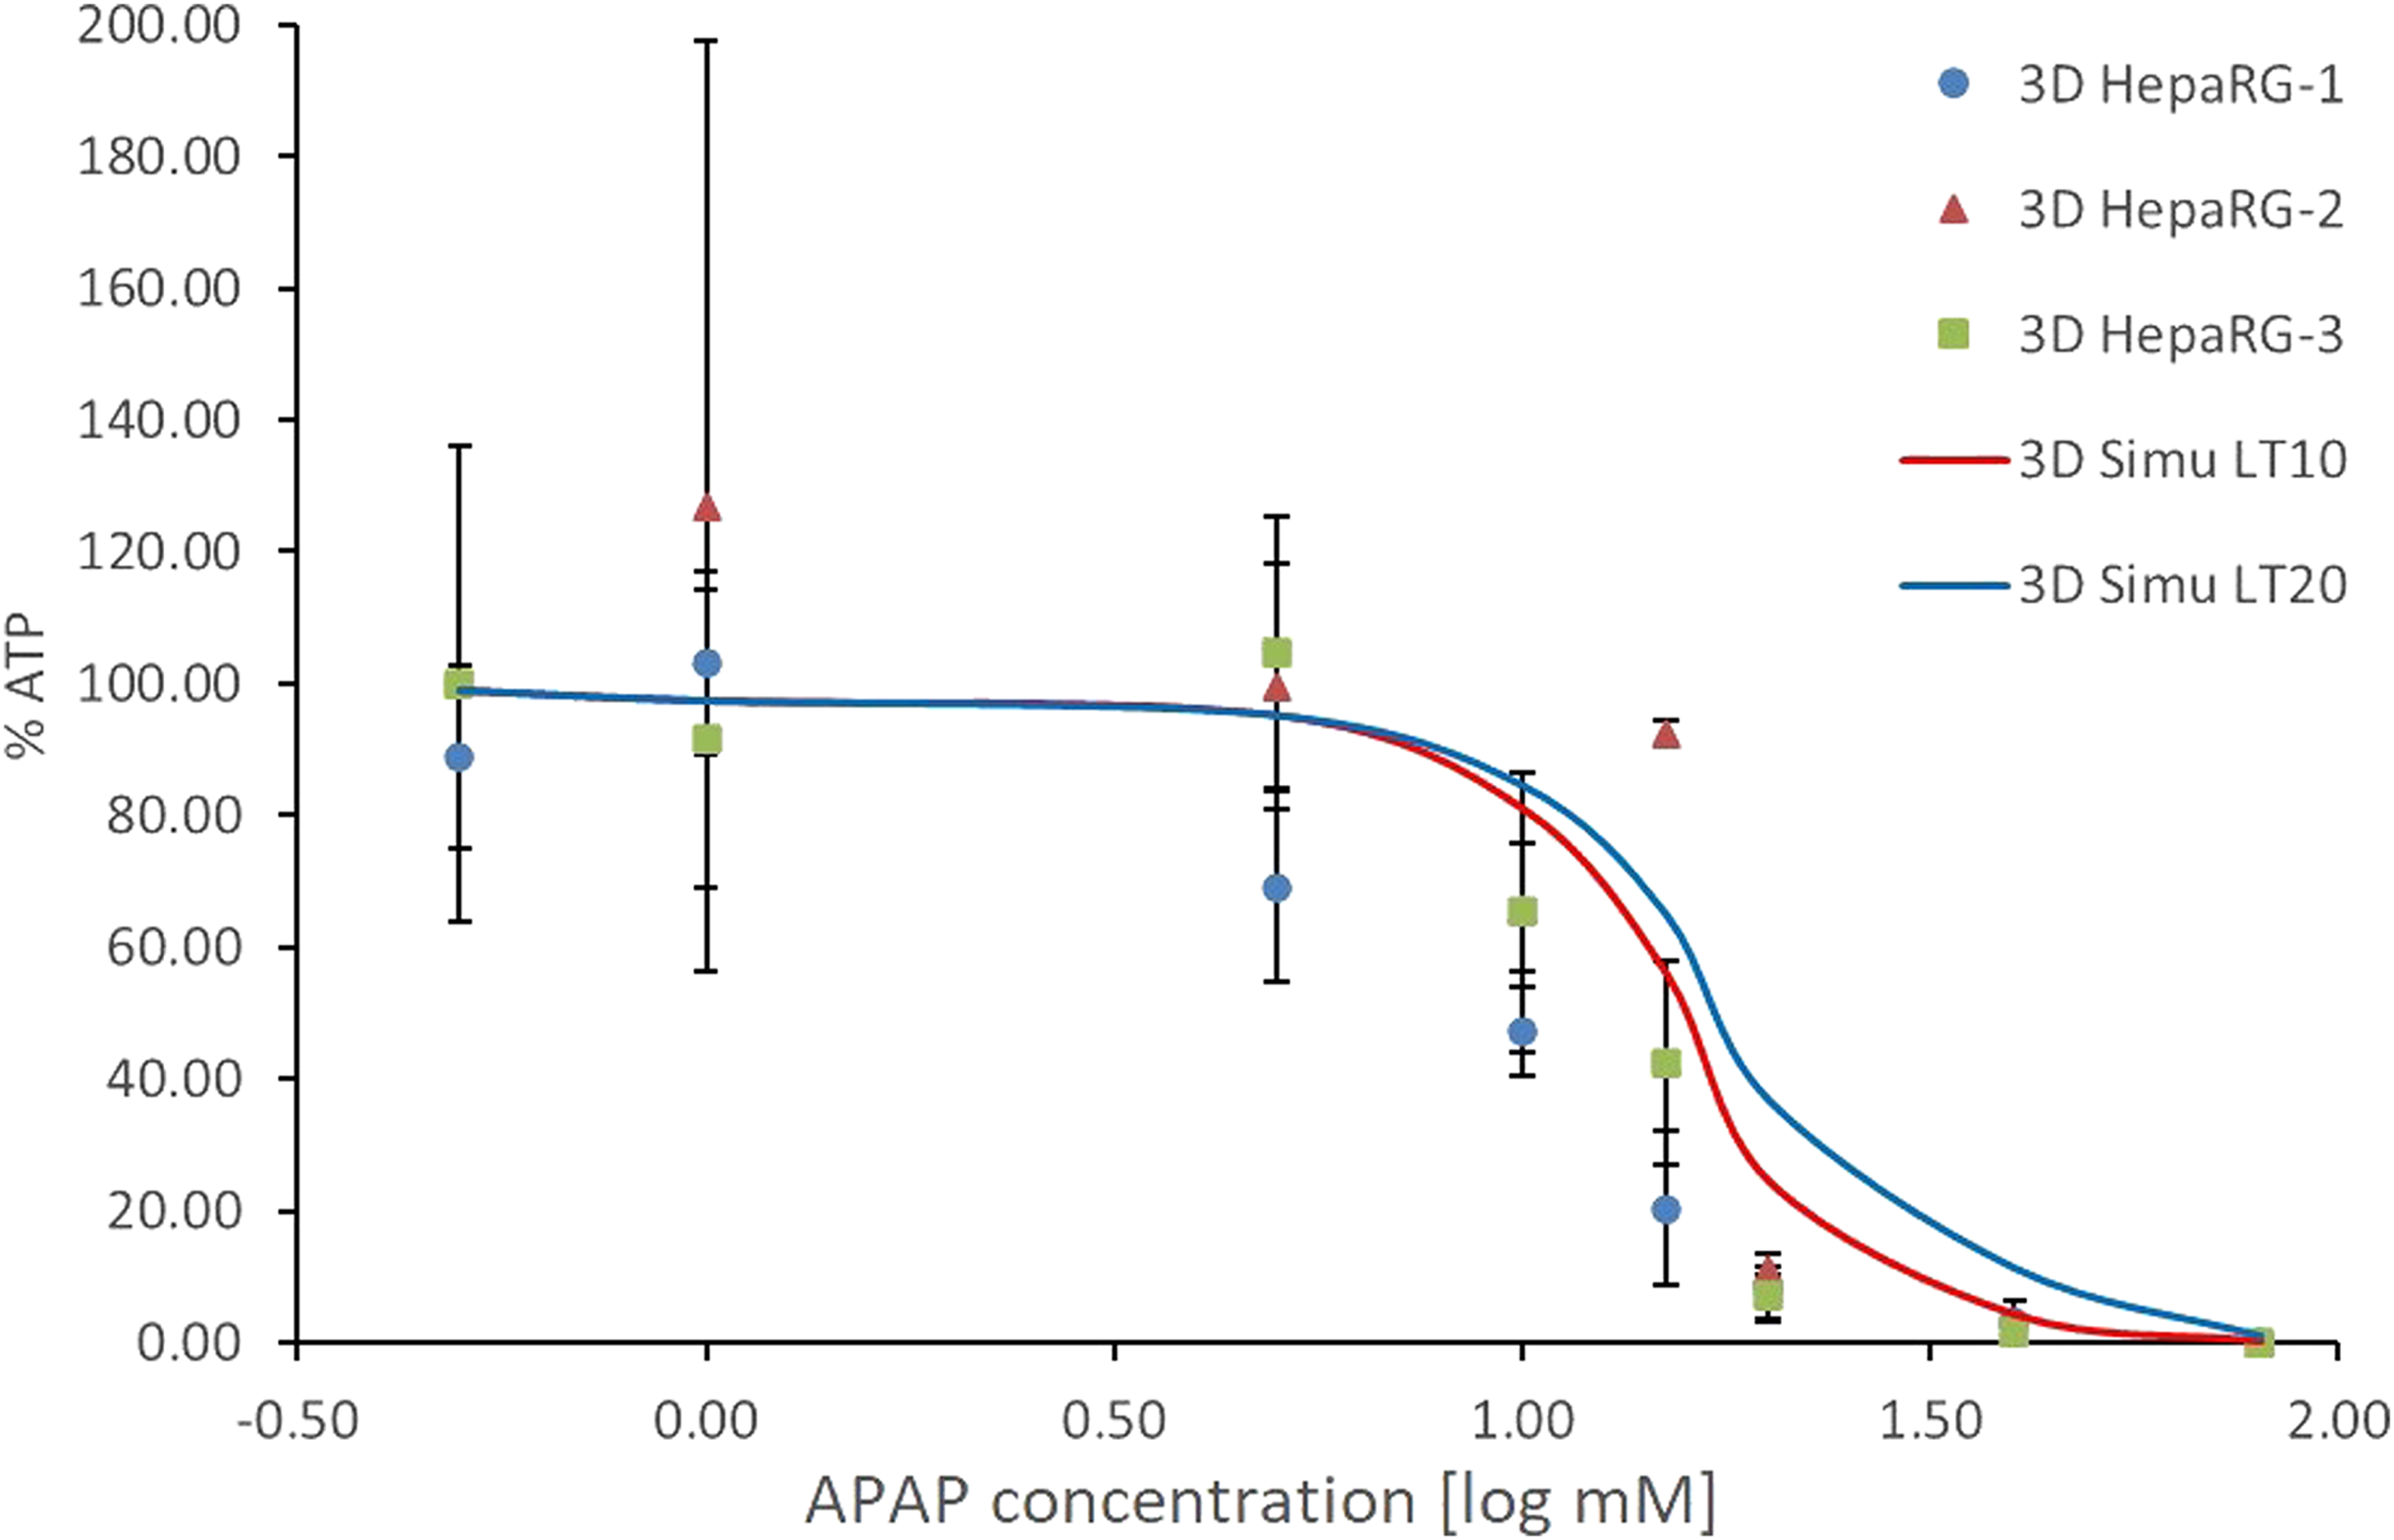
Discussion
The work described in this paper attempts to extend the 2-D VCBA model 16 into a 3-D cell spheroid model, starting by adapting the architecture of the cell culture system. For this purpose, predictions of APAP toxicity in HepaRG spheroids were used. The results were then compared with experimental data obtained from the 3-D HepaRG model of Leite et al. 35 The 3-D VCBA model structure was developed by adapting the Matlab code developed by Zaldivar Comenges et al.17,36,37 allowing predictions of chemical fate and toxicity.
To have developed a mathematical model capturing 3-D architecture is a highly efficient step forward. The theoretical description of the model can help to improve the design of in vitro toxicity studies, as well as the interpretation of the experimental results. Although the mathematical model does not simulate CYP metabolism of APAP because it is based on toxicity data, it is assumed that the metabolite will also exert an effect, and this is taken into account indirectly in the toxicity data. In 3-D cultures, higher APAP toxicity is observed when compared with 2-D cultures. This is probably the result of higher CYP activity in the former case, as shown in the Supplementary data of Leite et al. 35 Therefore, the mathematical model can help to save time and resources, expediting the assessment of a chemical for cellular effects before (or even instead of) the in vitro screening.
The VCBA model has thus gained a more structural and functional physiological representation of 3-D culture systems and could, in the future, be extended to systems that include blood flow dynamics, such as fluid flow in organ-on-chip culture systems. For simplification, the presented 3-D mathematical model is based on a series of assumptions. These assumptions lead to some limitations in terms of the accuracy of the representation of the in vitro system. For instance, the possible impact of the ECM, in terms of compound diffusion and compound exposure from neighbouring cells, was not considered. Also, the HepaRG cultures consist of hepatocyte-like and cholangiocyte-like cells — but this heterogeneic nature of the spheroids was not taken into account. Both these parameters (i.e. ECM impact and cellular heterogeneity) might affect the diffusion of the compound and the shape that the spheroids assume. The mathematical model is also based on assumptions associated with the physical structure of spheroids and their environment that do not fully represent the in vitro setup, such as flat-bottomed wells or constant volume and number of cells. Altogether, this might explain the small differences observed between the results obtained with the mathematical and the in vitro models. A refined biological description would be worth pursuing in future work.
The simulated results were compared with experimental data available in the literature. 35 This comparison showed that the VCBA model, after calibration, has the potential to be used as a predictive tool to refine experimental setups and investigate toxicity, taking into account 3-D structure. To make the model more robust, the above hypothesis should be confirmed by carrying out additional calculations for different compounds. The results already indicate that the adaptations carried out for the extension of the VCBA model from 2-D to 3-D cell culture can approximate the data generated in vitro. However, the experimental data showed fewer living cells than the mathematical model, suggesting a faster rate of cell death. In addition, the in vitro results showed a steeper decline in cell viability from 5 mM to 20 mM APAP, as compared to the mathematically predicted results, where the decrease was shallower. What could explain such a difference?
The difference between the in vitro 3-D culture and the 3-D model simulation data might be caused by: i) the parameters kr and NEC, which were optimised based on 2-D cultures; ii) simplifications adopted in the mathematical description; and iii) the assumptions made for the 3-D culture data (Table 1). Nevertheless, the difference between the simulated and experimental data curves was not significant, given the inherent variability of in vitro studies. Additionally, our data show the impact of the lethal time (LT; i.e. time to cell death) on the viability of cells in the spheroid — due to a lower lethal time, APAP penetrates faster, and so more cells are exposed to it.
Most of the mathematical models in the literature that describe 3-D cell culture models are focused on tumours. Some of these were summarised in a review by Karolak et al., 39 in which the authors provided examples of multi-culture spheroid mathematical models. Our proposed mathematical description of quasi-diffusion of a chemical through a spheroid culture considers the 3-D structure as being composed of concentric layers, and aims to predict the in vitro chemical concentration in each layer. The idea is based on the work of Achilli et al. 38 from Brown University, Providence, USA. Observing the diffusion of calcein through gap junctions, they developed an algorithm to explore drug diffusion in 3-D spheroids. The model was developed for an ovarian cell line, but it is adaptable to many different cell types and may serve as a quantitative 3-D model that more accurately replicates in vivo barriers to drug uptake and diffusion.
The investigation of chemical diffusion has also been explored by others. In a recent publication, Leedale and co-workers reported a mathematical simulation of drug transport through spheroids based on similar foundations. 40 In this case, the mathematical description of spheroid structure was based on a Voronoi tessellation, unlike the concentric division into 2-D layers used in our model. Moreover, the Leedale model does not consider changes of chemical concentration in the medium, and for the diffusion parameter, it uses permeability as a function of lipophilicity. In our model, the transition of chemical concentration from one layer to the next follows an assumed lethal time LT, that is, time to cell death.
Conclusions
This work, based on the theoretical approach proposed by Achilli et al., 38 demonstrates that changing the 2-D VCBA model architecture to account for cell-to-cell connectivity in a 3-D culture resulted in reliable 3-D mathematical model predictions when compared to actual in vitro data. This work illustrates that the mathematical model can be developed solely on in vitro toxicity data to predict the in vitro mode of action. Based on this model, reasonable predictions of in vitro chemical concentrations were made. An interesting step for future work would be to carry out more in vitro experiments after parameter adjustment in the in silico experiments, with a view to further validating the results of the mathematical model.
In conclusion, the mathematical model described here provides a promising means of improving the design of in vitro experiments, filling data gaps and informing the interpretation of in vitro data for the purposes of risk assessment. It could also play a role in reducing the need for animal experimentation, in line with the Three Rs principles. We believe that in silico models can improve the usefulness of in vitro methods by optimising the dose concentrations of the compounds to be tested, and this increases the relevance of alternative methods. Hence, this attempt to cover 3-D structure through extension of the VCBA model, and thus increase its relevance with regard to current 3-D in vitro culture systems, is a step forward in the reduction and replacement of animal use in experiments.
Supplemental Material
sj-pdf-1-atl-10.1177_02611929221082200 – Supplemental Material for Extension of the Virtual Cell Based Assay from a 2-D to a 3-D Cell Culture Model
Supplemental Material, sj-pdf-1-atl-10.1177_02611929221082200 for Extension of the Virtual Cell Based Assay from a 2-D to a 3-D Cell Culture Model by Ewa Bednarczyk, Yanfei Lu, Alicia Paini, Sofia Batista Leite, Leo A. van Grunsven, Andrew Worth and Maurice Whelan in Alternatives to Laboratory Animals
Supplemental Material
sj-xlsx-2-atl-10.1177_02611929221082200 – Supplemental Material for Extension of the Virtual Cell Based Assay from a 2-D to a 3-D Cell Culture Model
Supplemental Material, sj-xlsx-2-atl-10.1177_02611929221082200 for Extension of the Virtual Cell Based Assay from a 2-D to a 3-D Cell Culture Model by Ewa Bednarczyk, Yanfei Lu, Alicia Paini, Sofia Batista Leite, Leo A. van Grunsven, Andrew Worth and Maurice Whelan in Alternatives to Laboratory Animals
Supplemental Material
sj-xlsx-3-atl-10.1177_02611929221082200 – Supplemental Material for Extension of the Virtual Cell Based Assay from a 2-D to a 3-D Cell Culture Model
Supplemental Material, sj-xlsx-3-atl-10.1177_02611929221082200 for Extension of the Virtual Cell Based Assay from a 2-D to a 3-D Cell Culture Model by Ewa Bednarczyk, Yanfei Lu, Alicia Paini, Sofia Batista Leite, Leo A. van Grunsven, Andrew Worth and Maurice Whelan in Alternatives to Laboratory Animals
Footnotes
Acknowledgements
The authors would like to acknowledge Professor Tomasz Lekszycki for his support in reviewing the draft of this paper.
Declaration of conflicting interests
The author(s) declared no potential conflicts of interest with respect to the research, authorship, and/or publication of this article.
Funding
The author(s) received no financial support for the research, authorship, and/or publication of this article.
Supplementary material
Supplementary material for this article is available online.
References
Supplementary Material
Please find the following supplemental material available below.
For Open Access articles published under a Creative Commons License, all supplemental material carries the same license as the article it is associated with.
For non-Open Access articles published, all supplemental material carries a non-exclusive license, and permission requests for re-use of supplemental material or any part of supplemental material shall be sent directly to the copyright owner as specified in the copyright notice associated with the article.