
Abstract
Across the spectrum of industrial sectors, including pharmaceuticals, chemicals, personal care products, food additives and their associated regulatory agencies, there is a need to develop robust and reliable methods to reduce or replace animal testing. It is generally recognised that no single alternative method will be able to provide a one-to-one replacement for assays based on more complex toxicological endpoints. Hence, information from a combination of techniques is required. A greater understanding of the time and concentration-dependent mechanisms, underlying the interactions between chemicals and biological systems, and the sequence of events that can lead to apical effects, will help to move forward the science of reducing and replacing animal experiments. In silico modelling, in vitro assays, high-throughput screening, organ-on-a-chip technology, omics and mathematical biology, can provide complementary information to develop a complete picture of the potential response of an organism to a chemical stressor. Adverse outcome pathways (AOPs) and systems biology frameworks enable relevant information from diverse sources to be logically integrated. While individual researchers do not need to be experts across all disciplines, it is useful to have a fundamental understanding of what other areas of science have to offer, and how knowledge can be integrated with other disciplines. The purpose of this review is to provide those who are unfamiliar with predictive in silico tools, with a fundamental understanding of the underlying theory. Current applications, software, barriers to acceptance, new developments and the use of integrated approaches are all discussed, with additional resources being signposted for each of the topics.
Introduction
The agenda for change has been clearly mandated, with a global drive towards reducing, refining or replacing animal tests with non-animal alternatives. Legislative changes, as well as commercial and ethical pressures, have provided motivation for the pursuit of alternatives to the traditional in vivo assays used in product development and safety assessment. However, tangible progress varies significantly between sectors and geographic regions. 1 For example, cosmetic products or their ingredients, to be marketed within the European Union (EU), can no longer be tested on animals, whereas the registration of new therapeutic entities (NTEs) is contingent upon safety, efficacy and dosing protocols being established in animal models.
In order to develop products that are safe for humans and animals (including environmental species) there is a need to understand the potential effects of chemicals, on a wide range of organisms, and how this can be affected by factors such as developmental stage, health status or individual genetic composition. The ability of a chemical to elicit an effect is determined by its concentration–time profile (internal exposure) at a relevant site, as well as its inherent activity (toxicity). For some chemicals, data may be available for certain species, under specific exposure scenarios. However, there are no chemicals for which comprehensive data are available for all target and non-target species that might be exposed to it. Considering the totality of the exposome — ranging from once in a lifetime, to multiple daily exposure (orally, dermally, via inhalation, etc.) of low or high concentrations of a myriad of chemicals and mixtures — chemical safety assessment clearly cannot be achieved through testing alone, and thus predictive methods are essential. As a one-to-one replacement of an animal test with a non-animal alternative is not generally practicable, due to the inherent complexity of biological systems, it is necessary to employ a range of alternative methods. Each method can contribute a different piece of information that can be used to build a complete, mechanistic understanding of how a chemical interacts with a biological system, to cause a perturbation resulting in an apical effect (i.e. an observable or measurable whole-organism outcome). In silico (computational), in vitro, omics, organ-on-a-chip technology, high-throughput screening (HTS) and mathematical biology can all play a role in providing complementary information. 2
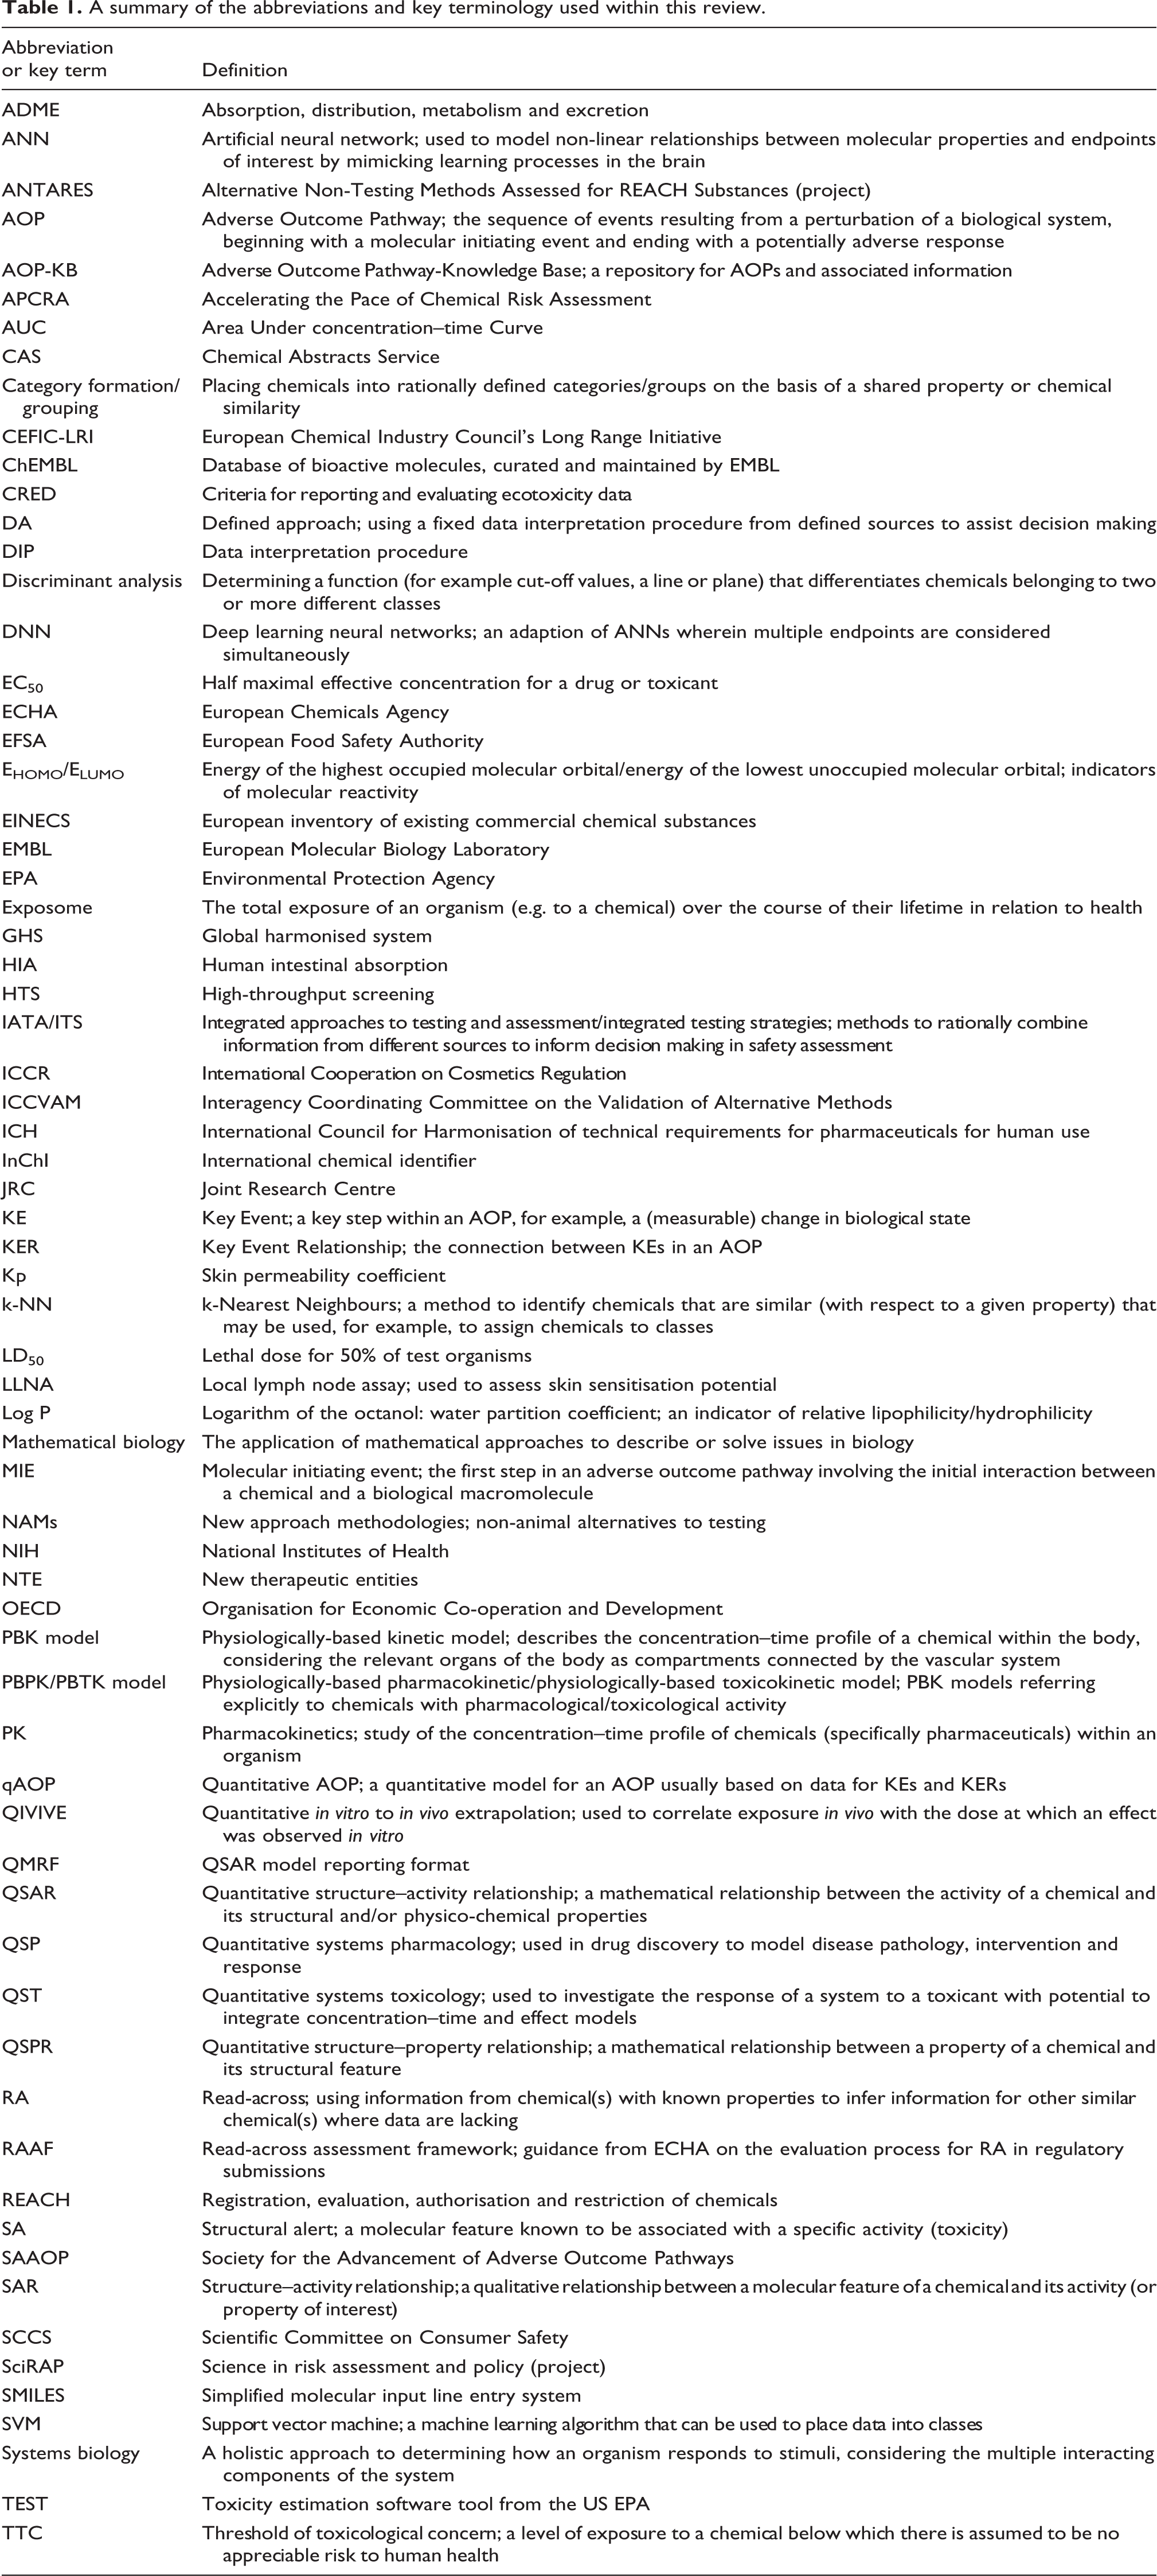
Knowledge of the key terminology used in this area of science is important to understanding this review, hence commonly used abbreviations and key terms that are used herein have been summarised in Table 1. For example, the term ‘new approach methodology’ (NAM) applies to any of the non-animal alternatives that can be used alone or in combination to provide information for safety assessment. ‘Integrated approaches to testing and assessment’ (IATAs) combine information from a range of sources to determine if there is sufficient knowledge on which to make safety-based decisions, or direct future experiments to fill knowledge gaps. ‘Defined approaches’ (DAs) use a fixed data interpretation procedure (DIP) to interpret information from a defined set of sources to assist decision making. 3 It is the combination of data on absorption, distribution, metabolism and excretion (ADME), as well as activity (hazard or toxicity) data that leads to a more realistic prediction of the potential of a chemical to elicit an effect in vivo. A wide range of in silico tools are available that can predict the ADME characteristics of a chemical (determinants of its internal exposure) as well as its intrinsic activity (toxicity). While external exposure is an essential precursor to this process, the mathematical models to predict external dose for different products, pollutants and scenarios are beyond the scope of the current article (the reader is referred to previous reviews of exposure modelling software). 4,5
A summary of the abbreviations and key terminology used within this review.
The power of in silico models is that the predictions are derived entirely from the structures of the chemicals of interest. The fundamental tenet of these models is that the intrinsic properties, potential interactions and ultimate effects of a chemical are encoded within its molecular structure; understanding this enables (quantitative) structure–activity relationship ((Q)SAR) or (quantitative) structure–property relationship ((Q)SPR) models to be developed. Similar chemicals are expected to elicit similar effects. Hence, knowledge of one chemical (or a group of chemicals) can be used to predict the characteristics of similar chemicals. Limitations to this approach are recognised, for example, the level of sophistication by which the molecule can be described at a structural level and the role of mitigating factors (e.g. structural features that may attenuate or intensify a response) can alter activity. The ‘similarity-paradox’ refers to the problem of chemicals that are ostensibly similar, but exhibit markedly different activity profiles. Activity cliffs occur when a smooth relationship between structure and activity abruptly ceases, and a small change in structure leads to an extreme change in biological response. Activity cliffs may provide an opportunity for medicinal chemists to develop new leads, but they are problematic in developing QSARs. 6
Notwithstanding, in silico models have been used for a multitude of applications, from predicting the toxicity of pollutants or agrochemicals to environmental species, to optimising drug candidates. The history of the development of in silico tools has been summarised recently. 7 Thousands of models and hundreds of software packages for predicting ADME properties and biological activity are now available. The purpose of this review is neither to recount the complete history of the field, nor to catalogue large numbers of available models or software applications. Rather, its purpose is to provide an introduction to the breadth of tools available, as well as the underlying theory and applications of these tools, for those new to the area of in silico prediction. The range of techniques and their applications — for example, prediction of intrinsic activity (hazard) or internal exposure (ADME properties) — are summarised as key concepts in Figure 1 and explained in detail below. Examples are also given regarding the use of these tools across different sectors, e.g. drug development in the pharmaceutical industry, safety assessment in the personal care product and food industries, and environmental toxicity prediction. An explanation of the theories that underpin the key methods, and how model reliability may be evaluated is also presented, with additional resources (e.g. exemplar software and comprehensive reviews of individual methods) being signposted within the relevant sections.
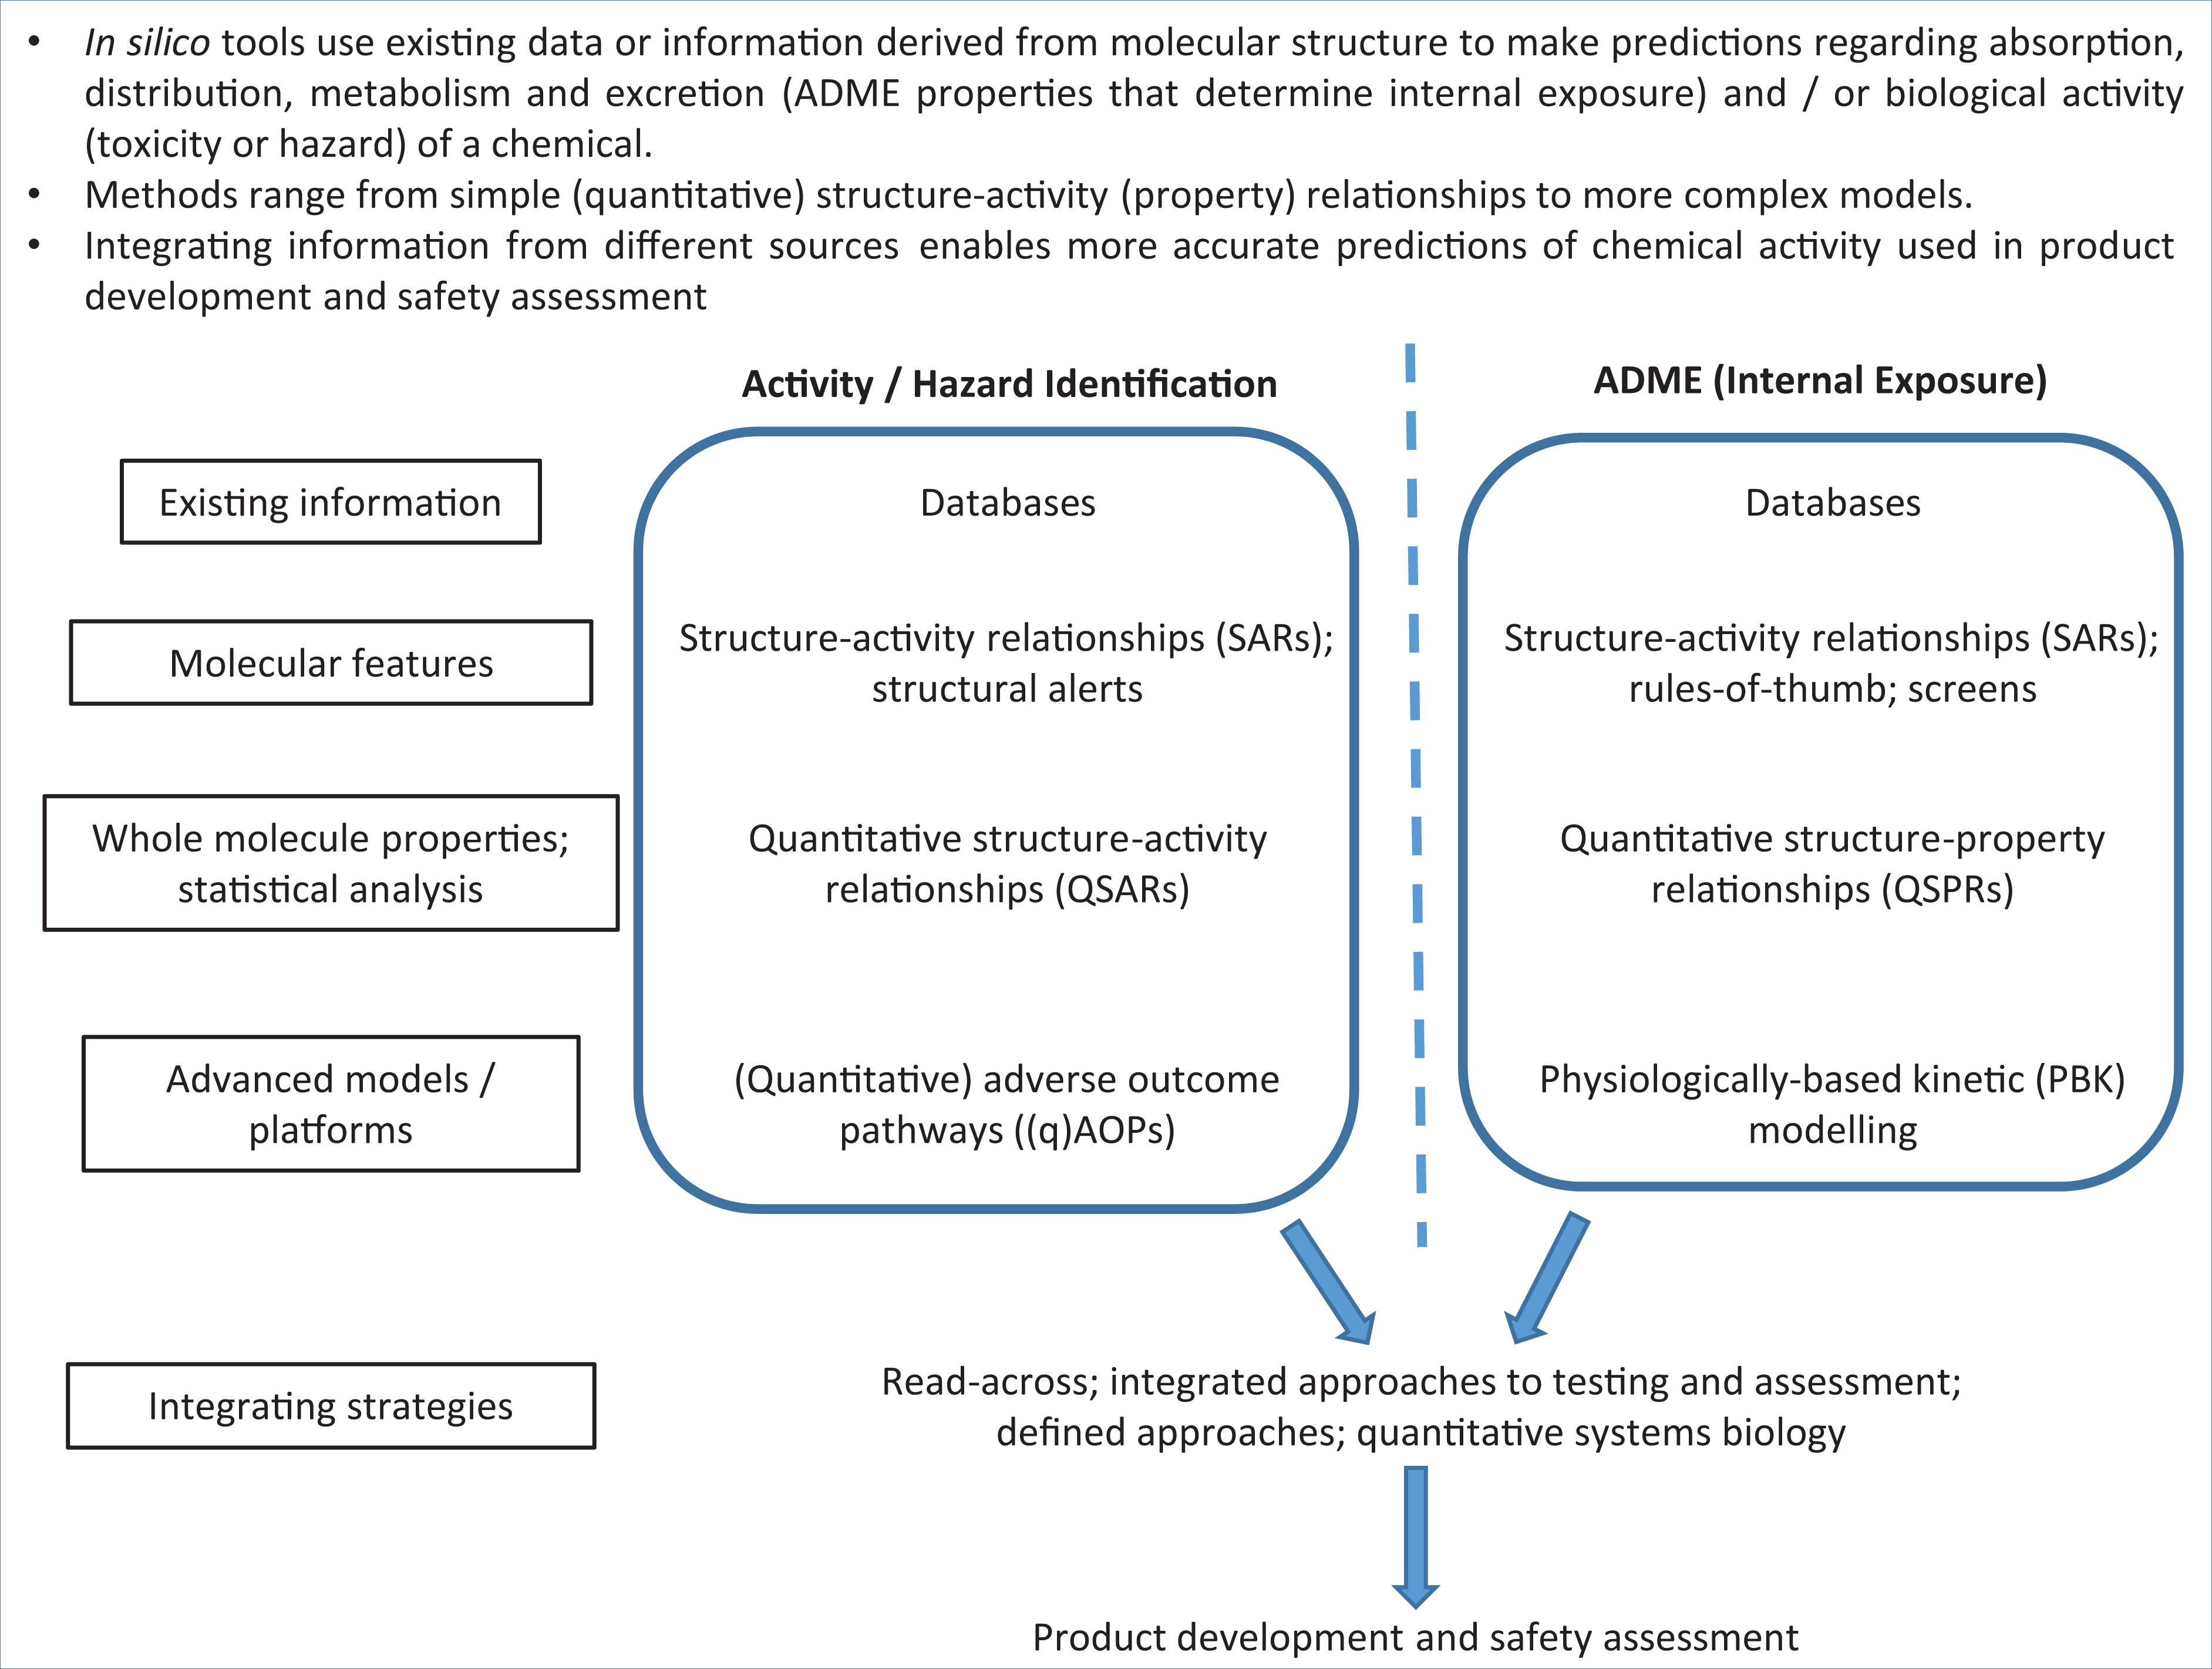
Key Concepts Box: Overview of in silico tools and their applications.
Applications of in silico models
As the number of in silico tools has expanded, so too has their application across different industrial and regulatory sectors. This is advantageous, as new information on the development or application of tools in one sector can be leveraged by another. This cross-disciplinary sharing of ideas and practice enables more rapid advancement, acceptance and uptake of new in silico methods. Historically, in silico models have been widely used for predicting the toxicity of chemicals to environmental species, particularly fish, aquatic invertebrates, algae and more recently bees. 8 However, there are multiple examples of their application within medicinal chemistry, in the design of bioactive chemicals, predictive toxicology and safety assessment. 9 In the pharmaceutical industry, models have been used extensively to maximise the efficiency of the drug development process, to ensure that only those candidates likely to be successful are taken forward to the animal testing stages and to avoid late-stage attrition or post-marketing withdrawal. The personal care product, (agro)chemical and food industries also use a range of in silico tools in product development, and as a result there is now increased recognition of the potential of in silico tools to provide information for regulatory submissions to meet legislative demands.
The EU regulation concerning the Registration, Evaluation, Authorisation and restriction of Chemicals (REACH), which came into force in June 2007, aims to protect humans and the environment from the adverse effects of the use of chemicals. 10 The REACH regulation specifically promotes the use of in silico prediction (e.g. QSAR and read-across methods) as alternatives to animal testing, providing that: the results are derived from a (Q)SAR model for which scientific validity has been established; the substance falls within the applicability domain of the (Q)SAR model; the results are adequate for purpose (e.g. classification or labelling); and adequate and reliable documentation of the applied method is provided. ECHA’s 4th Report on the Use of Alternatives to Testing on Animals for the REACH Regulation confirms that results from alternative methods continue to be used over and above new animal tests in dossiers submitted for REACH. 11 Read-across is the most common alternative strategy, but use is also made of QSARs, waiving and integrated testing strategies (ITS).
Since 2013, the Cosmetics Regulation (Regulation (EC) No 1223/2009) has banned the testing of cosmetic ingredients and products on animals, and has prohibited the marketing of cosmetics for which the ingredients or products were tested on animals since the introduction of the ban. 12 The 10th revision of the Notes of Guidance for the testing of cosmetic ingredients and their safety evaluation (from the European Commission’s Scientific Committee on Consumer Safety (SCCS)) similarly promotes the use of in silico models, stipulating that for safety evaluation of cosmetic ingredients, all available scientific data are considered, including results from (Q)SARs, chemical categories, grouping, read-across and physiologically-based kinetic (PBK) modelling. 13 For the safety assessment of food and food ingredients, a stepwise roadmap for evaluation that draws upon information from in silico models including QSAR and read-across has been proposed. 14
In the USA, the Frank R Lautenberg Chemical Safety for the 21st Century Act of Congress (2016) enshrines into US law that animal studies should be reduced or replaced as much as practicable. 15 A cross-sector partners’ forum (organised by the European Partnership for Alternatives to Animal Testing (EPAA)) resulted in a report on the use of read-across by the pharmaceutical, cosmetics (personal care product), chemical, agrochemical, food and fragrance industries and their associated regulatory organisations. The report identified cross-industry synergies in approaches, and highlighted the need to incorporate toxicokinetic information in read-across. 16 This evidences the increasing use of in silico tools across all sectors, highlighting the extensive economic and ethical contribution of this area of science.
Databases
The rate of acquisition of scientific knowledge is expanding more rapidly now, than at any other time. To maximise the value of this new information, there is a significant need for much of it to be made available in the public domain. This has led to a rapid expansion of databases, often freely accessible, that can provide a wealth of information on millions of chemicals. Whether or not a database itself can strictly be defined as an in silico tool is debatable. However, the searching strategies incorporated within modern databases (e.g. algorithms to identify similar chemicals or the capacity to modify and combine search parameters) are certainly some of the most widely used ‘tools’ in finding data on chemicals to develop and/or evaluate models. Often chemicals are characterised as being ‘data-rich’ (having a high volume of relevant data readily available) or ‘data-poor’ (having little or no relevant data available).
The interrogation of existing databases is a vital first step in determining potential effects of a chemical; if appropriate data are already available, then this obviates the need for testing or generating predictions. Generally, it is better to use an experimental rather than predicted value (unless there are known problems with the experiment); where multiple values are available, judgement, or consideration of data quality must be applied, as discussed in the next section. If information is not available for the chemical of interest, it may be possible to make a prediction through rational use of information available for other chemicals; this practice underpins in silico modelling tools such as (Q)SAR and read-across. Identifying the existing data also highlights where there are knowledge gaps, and therefore can help to prioritise future testing strategies, ensuring that the maximum information is obtained from those chemicals that are selected for testing.
Databases are usually searchable by using a range of chemical identifiers, such as: − name; − Simplified Molecular Input Line Entry System (SMILES) string; − hashed code derived from the International Chemical Identifier (i.e. InChIKey); or − registry number (e.g. Chemical Abstracts Service (CAS) or European INventory of Existing Commercial chemical Substances (EINECS) number).
Of paramount importance is ensuring that the data obtained (activity, toxicity, hazard data or ADME values) have been correctly and unambiguously assigned to the correct chemical structure. With increasing automation, it is easy for errors in chemical names or structures to be propagated in databases or literature collations. High quality databases often report the methods used to assess data record accuracy and may have standard protocols for error reporting and fixing. Cross-checking that at least two, and ideally three, identifiers give consistent results can be performed to check consistency in structure identification; where inconsistencies are identified, primary literature may need to be consulted. Some databases offer the capability to search for chemicals that are similar to the chemical of interest by using chemical fingerprints (vide infra) and/or physico-chemical properties.
In a recent comprehensive review, over 900 databases were identified and characterised in terms of the type of information available, as well as their public or commercial accessibility, interoperability, search criteria, etc. 17 The categories for the types of database considered (with the number of associated databases given in parentheses) were: biological (268); drug discovery (157); clinical trials (116); chemistry (80); omics (60); toxicology (57); protein–protein interactions (54); alternative methods (39); ADME (38); pathways (38); environmental exposure (30); nanomaterials toxicity (22); and patents (9). Of the hundreds of databases available, some representative examples of freely accessible databases are shown in Table 2, in order to indicate the nature and scope of these resources.
Summary information for key, freely available databases for toxicological, physico-chemical and other relevant information for safety assessment.
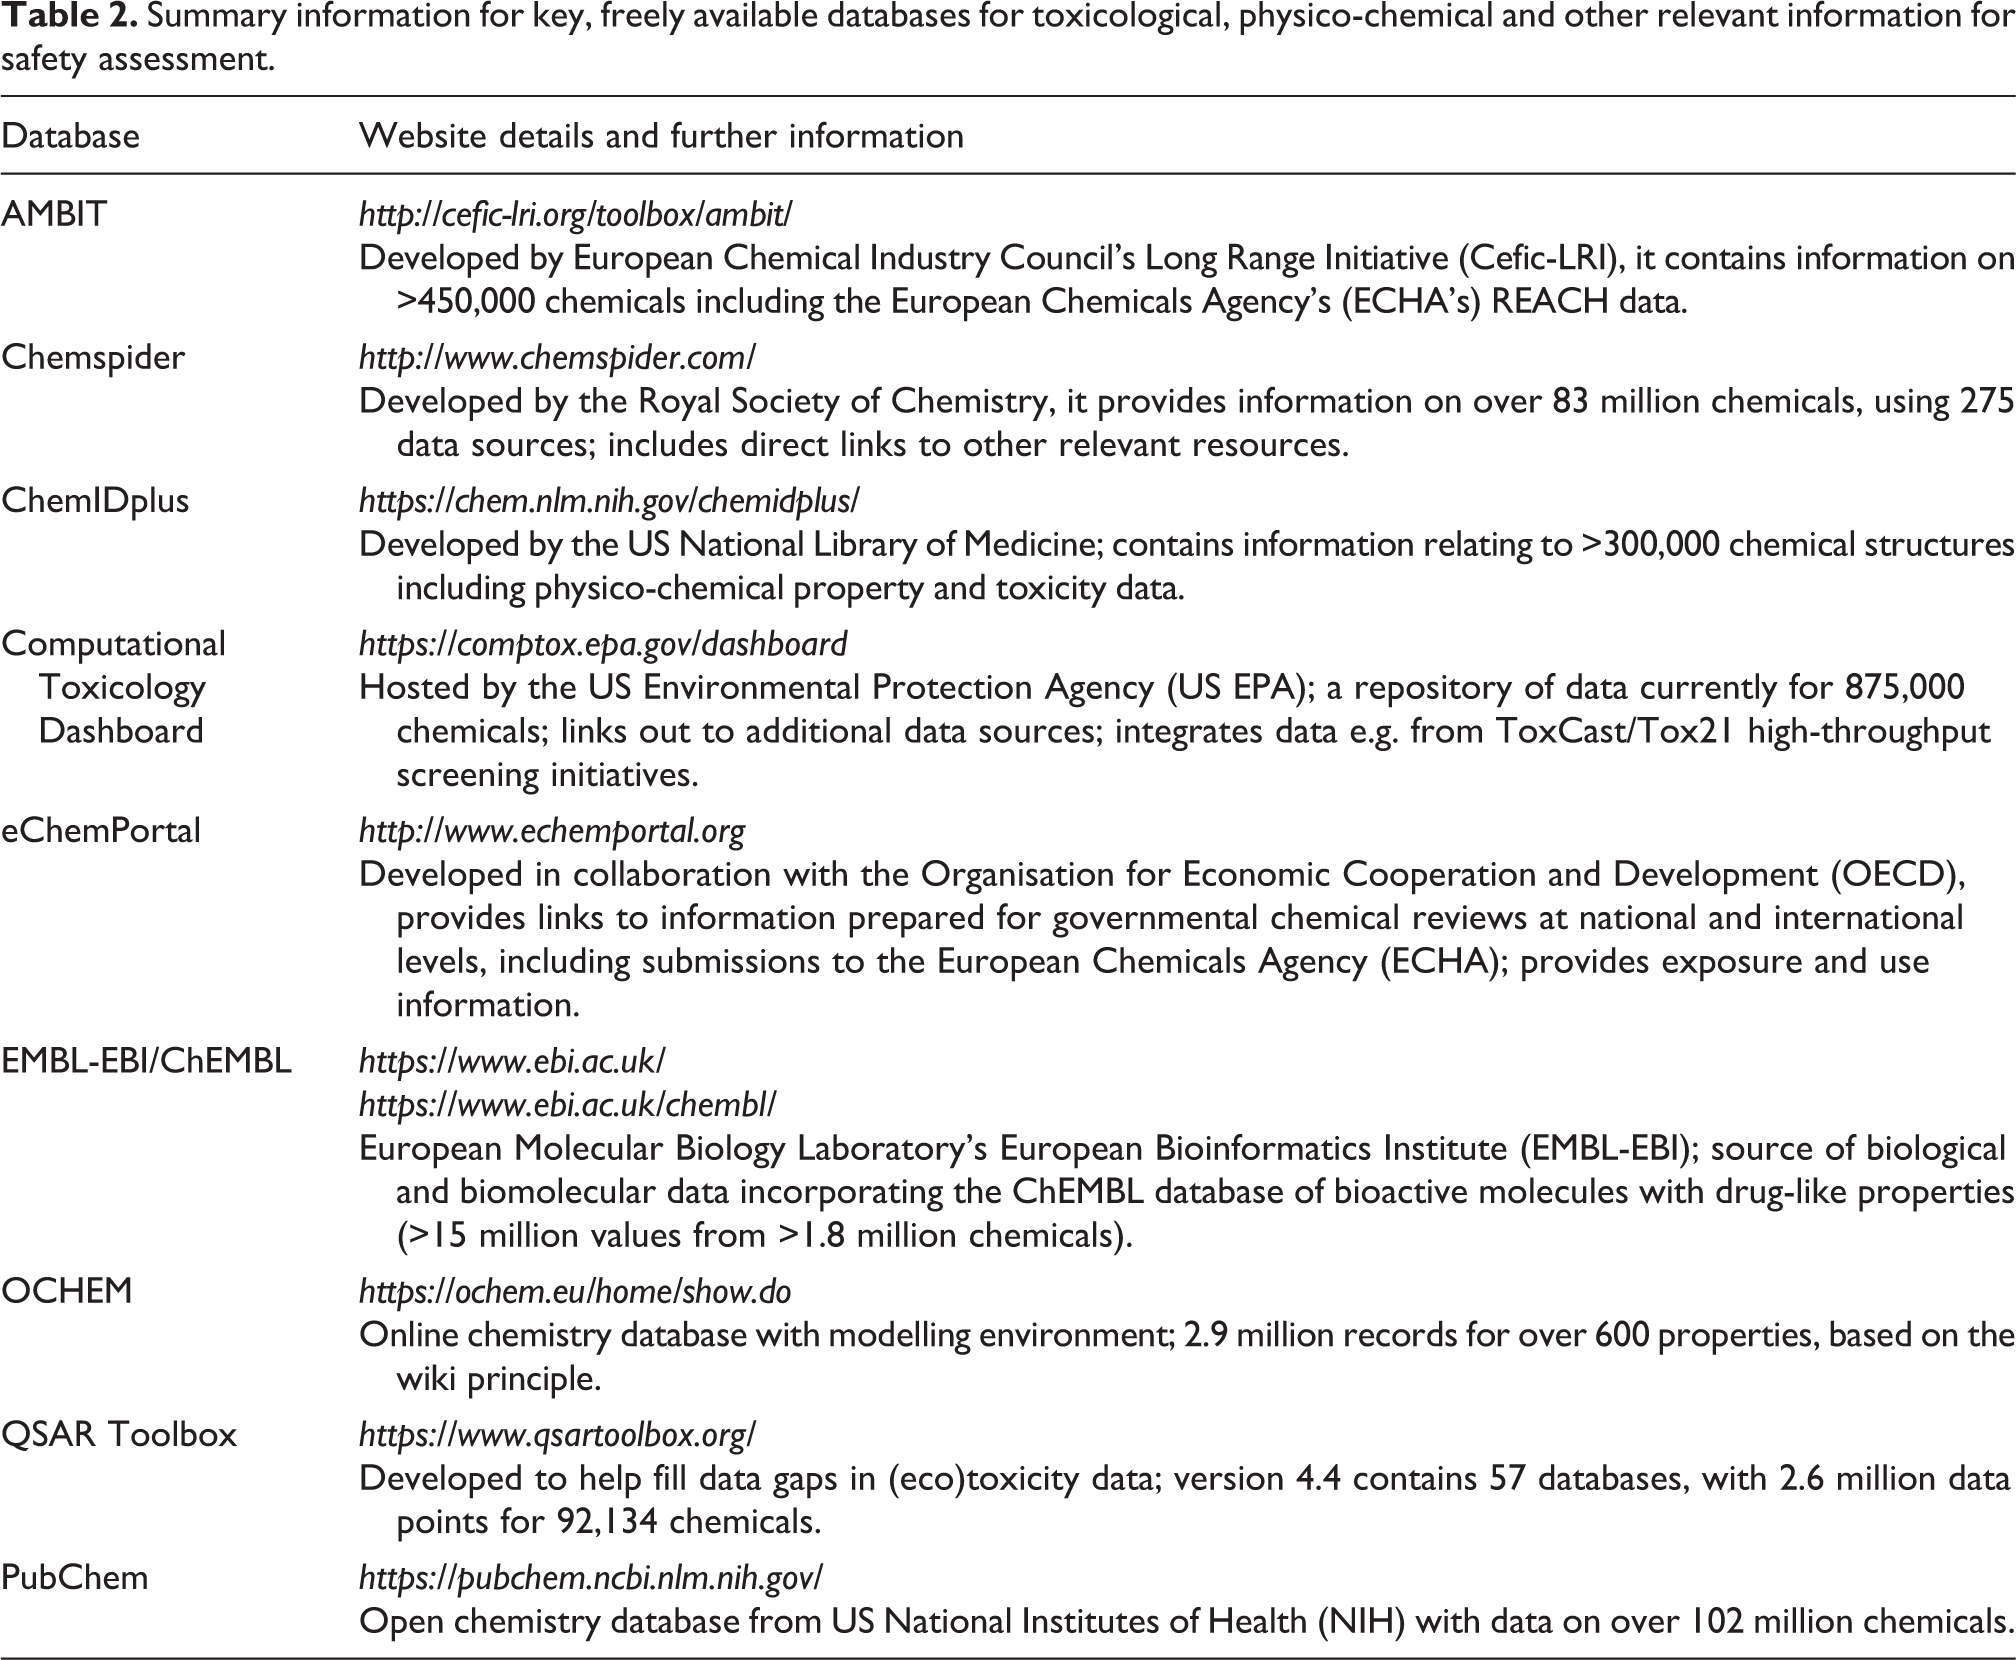
PubChem is one of the most comprehensive sources of chemical information. It can be searched by using name, synonyms, molecular formula, structure, SMILES, InChIKey or registry number. It is also possible to search for chemicals that are similar with respect to 2-D fingerprint or physico-chemical properties. The type of information available is divided into approximately 20 major categories (depending on the nature of the chemical), and each major category expands into multiple subcategories providing information on, for example: identifiers; chemical and physical properties; uses; pharmacology; safety/hazard data; and toxicity data references. Similarly, Chemspider is another comprehensive resource with information on identifiers, physical properties and chemical properties (experimental and/or predicted values), with links to predictions from ACD/labs, EPISuite, Chemaxon and Mcule. Chemspider provides information on common uses, chemical class, safety information, references, and links to other sources of information.
ChemIDplus is searchable by using a range of identifiers, and provides chemical classification codes, physical property and toxicity data (e.g. LD50 data for multiple species and routes) with links to original references.
The Computational Toxicology (CompTox) Chemicals Dashboard can be searched by chemical identifiers (e.g. CAS number), product categories and assays/genes associated with high-throughput screening. It provides extensive information on chemistry, toxicity and exposure data, including physical and chemical properties, environmental fate, usage, in vivo toxicity data and results from a wide range of in vitro assays.
The QSAR Toolbox has been developed to support read-across predictions. A significant number of databases have been donated to this project, hence, it represents a useful resource for human and environmental toxicity endpoint data, as well as physico-chemical property and metabolic data.
AMBIT, also designed to support chemical safety assessment, contains the REACH data from the European Chemicals Agency, as well as the European Food Safety Authority (EFSA) OpenFoodTox databases.
The eChemPortal is searchable by chemical name, registry number, chemical property or Global Harmonised System (GHS) classification. It provides links to hazard and risk information prepared for chemical review, including data on exposure and use.
The online chemical database with modelling environment (OCHEM), contains information on physical and chemical properties, ADME, biological activity and toxicity data from both publications and user uploads.
Finally, the European Molecular Biology Laboratory (EMBL) describes itself as a source of the “world’s most comprehensive range of freely available and up-to-date molecular data resources.” ChEMBL (which is developed and maintained by EMBL) provides extensive datasets of binding, ADME and biological activity data.
Data quality assessment
The scale of the resources outlined in Table 2 indicates the vast amount of data that are available, from which in silico models can be built to predict properties of interest (e.g. ADME or activity/toxicity). It is essential to ascertain the quality of the data to be used, as any model is only as good as the data on which it is built. Equally important, is the sequitur that no model can be more accurate than the data from which it is derived. In addition, biological data are inherently variable, and this sets the upper limit for the accuracy of predictive models, as was recently exemplified in an investigation into the levels of uncertainty in models based on data from the US EPA’s Toxicity Reference Database (https://www.epa.gov/chemical-research/exploring-toxcast-data-downloadable-data). 18
‘Quality’ is a relative term — the purpose for which the data are to be used dictates the minimum level of data reliability and relevance that would be considered acceptable, i.e. this determines the suitability of the data for a given purpose (data adequacy). Definitions for the various terms that are associated with data quality have been outlined previously,
19
but they are summarised below: − Validity of data can be defined as “evaluating the method used to generate data relative to accepted guidelines” or “the extent to which the methods used find the truth as a result of the investigator actually measuring what they intended to measure.” − Accuracy can be defined as “the closeness of agreement between test method results and accepted reference values.” − Reliability of data is linked to the reliability of the experiments carried out. For example, whether the results can be confirmed by comparison to standards, and whether the methodology is repeatable. − Relevance is the relationship between the test that is carried out and the effect that is of interest (i.e. the meaningfulness of the assay). For example, the highest quality data are required for the safety assessment of individual chemicals; however, lower quality data may suffice for general screening or ranking of chemicals in product development.
Industry often works with specific types or subsets of chemicals; therefore, models built using in-house data can be more relevant than those built using external data sets. In-house data sources are usually reliable and have the advantage of an audit trail for tracing or resolving issues where necessary. One disadvantage in attempting to formally assess the quality of data is that the results can be highly subjective. The Klimisch criteria are the most widely used for classifying data quality. 20 The application of these criteria enables data to be categorised as: (i) reliable without restriction; (ii) reliable with restriction; (iii) unreliable; or (iv) not assignable (i.e. insufficient information exists on the data for a judgement of its quality to be made). The ToxRTool available from the European Commission’s Joint Research Centre (JRC) (https://eurl-ecvam.jrc.ec.europa.eu/about-ecvam/archive-publications/toxrtool) is designed to help data users and modellers assign Klimisch quality scores to in vitro and in vivo toxicity data, by posing a series of questions relating to the methodological details. More recently, the Science in Risk Assessment and Policy (SciRAP) project has developed web-based tools (www.scirap.org) for the evaluation and reporting of (eco)toxicity data with the aim of increasing the structure and transparency of data reliability assessments. The Criteria for Reporting and Evaluating ecotoxicity Data (CRED) provide a means to characterise the quality of data for ecotoxicological endpoints. 21 The quality of the data used to build or evaluate a (Q)SAR model is a determinant of model quality and prediction reliability. Hence, appropriate precautions should be taken, such as checking for accuracy (e.g. avoidance of transcription errors in large compilations), reliability and relevance, by using primary sources where possible.
Structure–activity relationships and structural alerts
Structure–activity relationships (SARs) refer to any definable relationship between a molecular feature of a chemical and its activity. Simple ‘rule-based’ classification schemes, cut-off criteria or generic rules-of-thumb are the simplest examples. Lipinski’s Rule of Fives, which is designed to screen out drug candidates with potentially poor oral absorption, is probably the most well-known of these. 22 Lipinski’s Rule states that chemicals with a molecular weight above 500 Da, a logarithm of the octanol:water partition coefficient (log P) above 5, more than 5 hydrogen bond donors or more than 10 hydrogen bond acceptors, are associated with low oral absorption. Simple rules have also been developed for other properties of interest — for example, if the number of nitrogen plus oxygen atoms in a molecule is less than or equal to five, it has the potential to penetrate the blood–brain barrier. 23 While there are clearly many exceptions to such generic rules, many have been taken up widely for preliminary screening purposes, notably in early drug development.
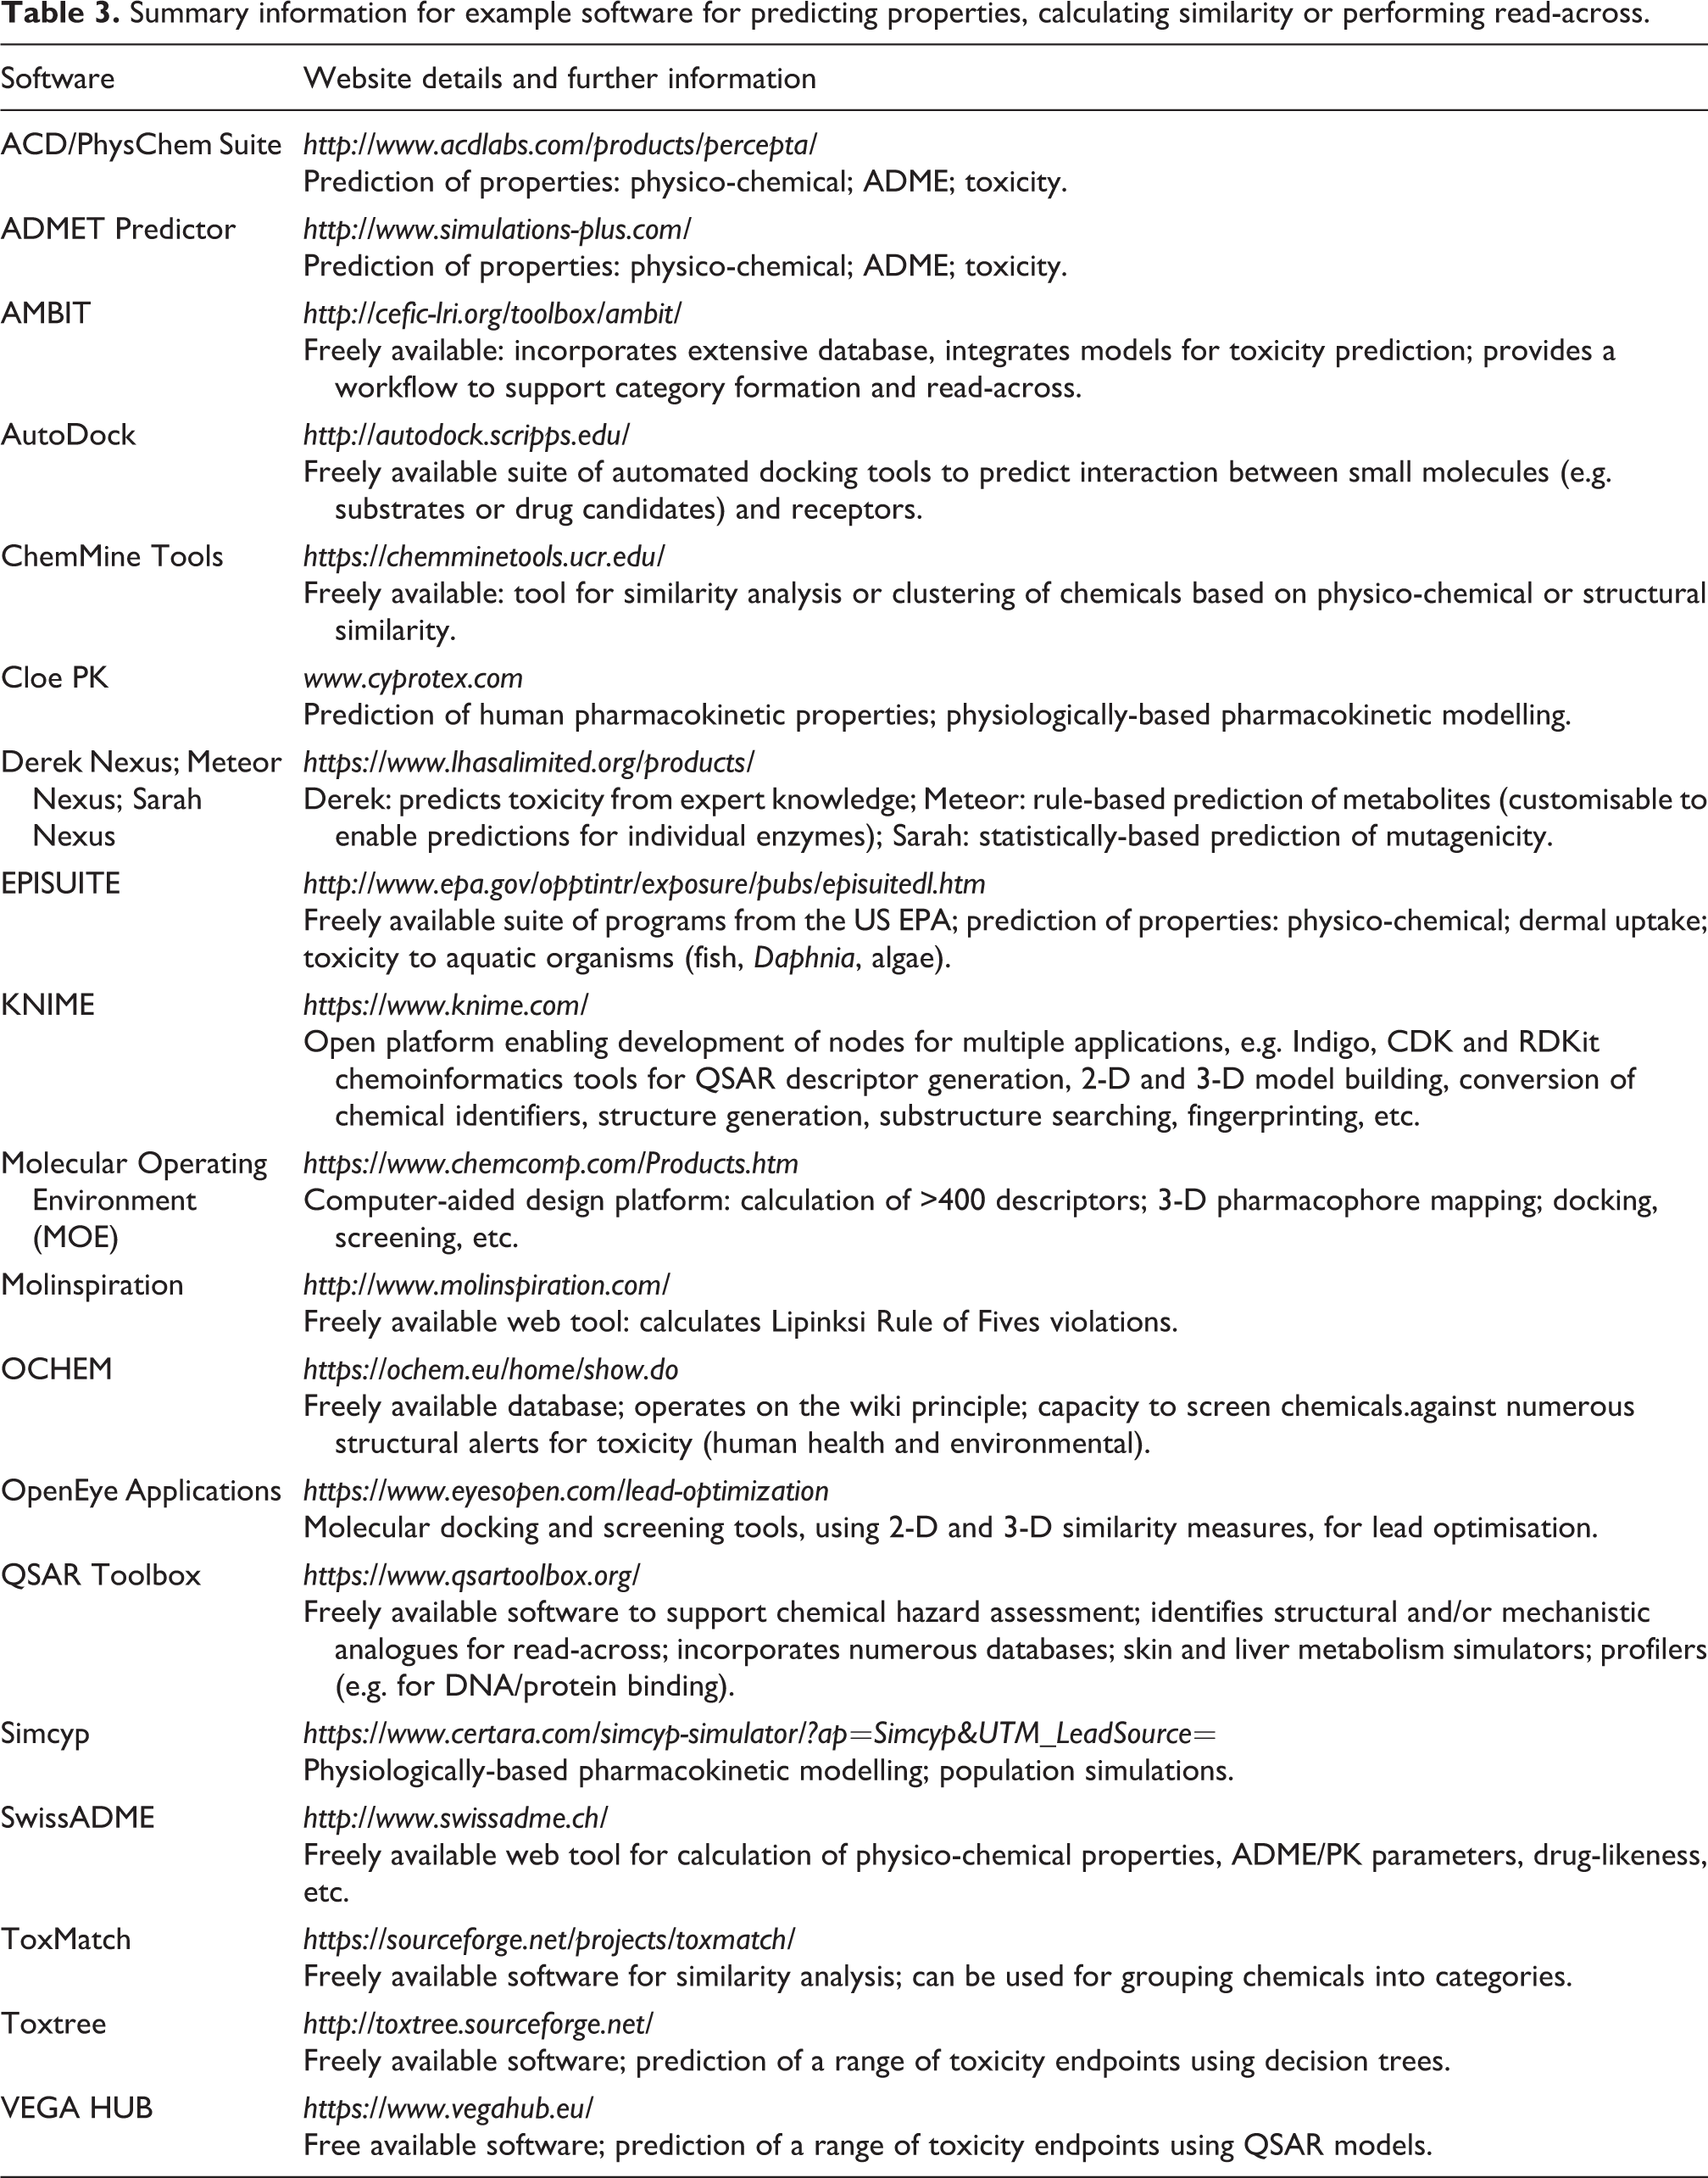
There are numerous examples of software (freely available and commercial) that can generate simple physico-chemical properties for chemicals, apply rules-of-thumb or cut-off criteria, and broadly classify chemicals into categorical classes (for example, poorly absorbed versus effectively absorbed across the gastrointestinal tract; blood–brain barrier penetrants versus non-penetrants, etc.). The freely available web-based application SwissADME, from the Swiss Institute of Bioinformatics (http://www.swissadme.ch/index.php), is one such example. Similarly, Molinspiration (freely available at: http://www.molinspiration.com/) readily identifies chemicals with potential Lipinski Rule of Fives violations. Table 3 provides further examples of predictive software for a range of endpoints that includes examples of SARs.
Summary information for example software for predicting properties, calculating similarity or performing read-across.
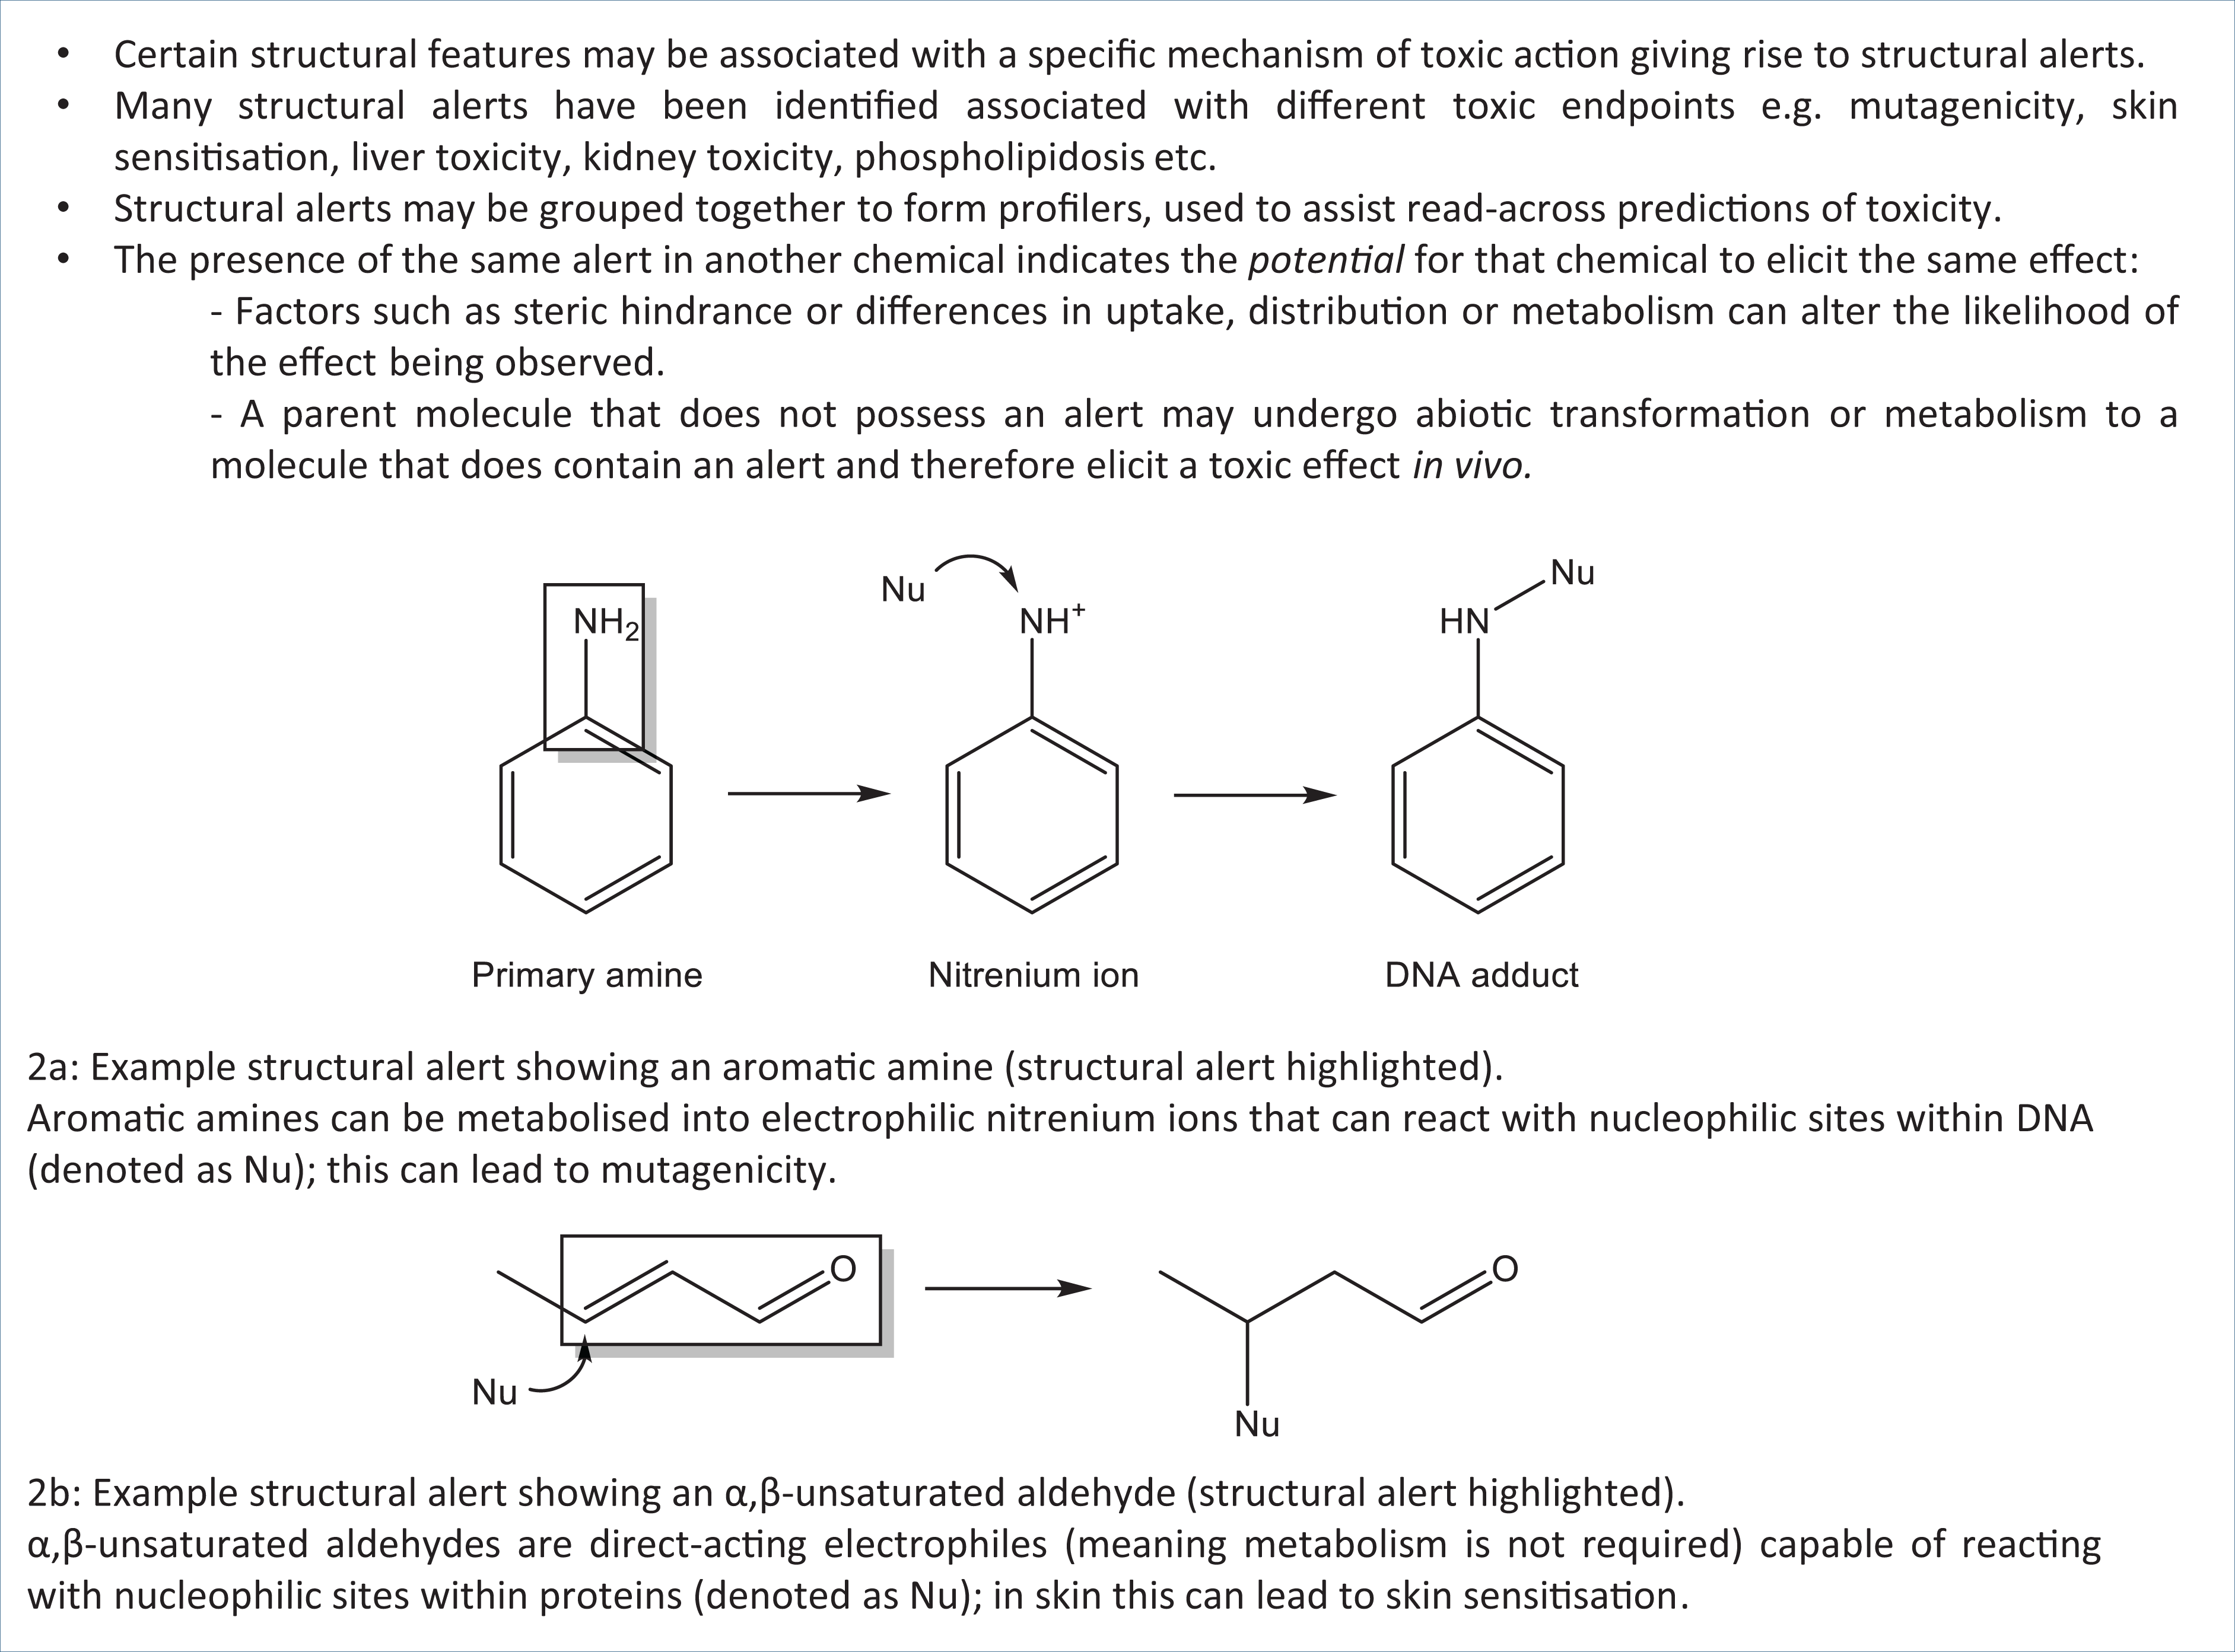
Structural alerts (SAs) are also derived from simple relationships between molecular features and known activity (toxicity), and they can be used to screen chemicals for potential hazard. In this approach, the molecular structures of chemicals known to be associated with a specific toxicity are investigated, in order to identify which sub-structural features or fragments are associated with the activity. A mechanistic rationale can then be posited, where possible. These fragments can be used to define SAs, i.e. specific molecular features that, if present in a chemical of interest, are indicative of the potential to elicit a toxic effect. In 1988, Ashby and Tennant published a ‘poly-carcinogen’ molecule, i.e. a hypothetical molecular structure that incorporated the SAs for carcinogenicity that were known at the time. 24 Work has been ongoing in this area for decades, to identify additional SAs associated with DNA binding, that could be related to mutagenic/carcinogenic activity. 25 –27
Many SAs have also been defined to aid the identification of chemicals with the potential for protein binding that may be associated with skin and/or respiratory sensitisation. 28 –30 The relevant key concepts outlined in Figure 2 show two examples of SAs associated with DNA and protein binding. The presence of these functional groups in other chemicals (for which test data are not available) indicates the potential of that chemical to elicit toxicity via DNA or protein binding. When identifying SAs, it is important to be able to rationalise the observed activity/toxicity in terms of the mechanistic chemistry behind the chemical-biological interaction, in order to justify the prediction. The aromatic amines provide an example of how such an effect can be rationalised, as depicted in Figure 2. Aromatic amines can undergo metabolism (via N-hydroxylation and O-acetyl transferase) to form a reactive nitrenium ion. The electrophilic nitrenium ion interacts with nucleophilic groups on DNA to form a DNA adduct, a process associated with mutagenicity.
Key Concepts Box: Structural alerts associated with DNA and protein binding.
SAs for skin and respiratory sensitisation (associated with allergic contact dermatitis and airway hypersensitivity, respectively) are widely used within industry — for example, to predict potential toxicity of personal care and household products. In drug development, alerts associated with the formation of reactive metabolites, hepatotoxicity, etc. are of major concern, as these are often associated with late stage or even post-marketing withdrawal of drugs. Detailed reviews of the definition, characterisation and mechanistic rationalisation of SAs associated with the formation of reactive metabolites, mitochondrial toxicity, phospholipidosis and hepatotoxicity have all been published previously. 31 –37 However, it is important to note that the presence of a structural alert does not necessarily equate with a biological response. Modulating factors may ameliorate or potentiate the response in vivo — for example, a compound with an alert may not be bioavailable or, from a chemical structure perspective, significant steric hindrance may interfere with access to an active site. Also, it is possible that metabolic deactivation/activation may render a potentially toxic chemical non-toxic, and vice versa. SAs can be grouped together to form ‘profilers’, with chemicals then being screened against these profilers to identify groups of chemicals that share common feature(s). This concept is discussed further below, in relation to the functionality of the QSAR Toolbox.
SAs have also been encoded within several predictive toxicity software and web-based applications, examples of which are provided in Table 3. Toxtree uses SAs, decision trees and QSARs to predict toxic hazards, reactivity and potential metabolism. It encodes the Cramer rules and the revised Cramer decision tree, which relate to oral systemic toxicity. 38 Through the use of structural information, chemicals are allocated to a toxicity class (where Class I relates to low toxicity, Class II intermediate and Class III high toxicity). Within Toxtree, the Kroes Threshold of Toxicological Concern (TTC) decision tree can be used to establish whether a substance can be assessed for oral systemic toxicity by using the TTC approach. 39 TTC is a concept that establishes the level of exposure for all chemicals (with or without toxicity data) below which there would be no appreciable risk to human health. The method incorporates Cramer classification rules and rules for prediction of genotoxic carcinogens; it also requires information relating to the estimated daily intake.
The Verhaar scheme for predicting mechanism of action of fish acute toxicity is also encoded within Toxtree. Chemicals are placed into classes I–V, with Class I representing non-polar narcotics, Class II polar narcotics, Class III reactive chemicals and Class IV specifically acting chemicals; Class V is used for chemicals that cannot be allocated to classes I–IV. 40 Other functionalities within Toxtree use SAs and physico-chemical information to predict potential for carcinogenicity (genotoxic and non-genotoxic), mutagenicity, skin sensitisation, protein and DNA binding, as well as skin and eye irritation/corrosion, biodegradability and cytochrome P450-mediated drug metabolism.
OCHEM is another freely available web tool, which includes (in addition to the other capabilities described herein) compilations of SAs associated with different toxicities (e.g. skin sensitisation or environmental endpoints) against which a target chemical can be screened. If an alert is identified within the target chemical, further information on the alert is provided, such as the literature source(s) from where the alert information was derived.
The advantages of using SAs are that they are transparent and can be readily interpretable, if developed from a mechanistic basis. Work is ongoing to identify further alerts associated with toxic effects and to understand the mechanisms behind the interactions. One drawback of the approach relates to how the absence of any SAs for toxicity within a chemical’s structure can be interpreted, as this cannot (usually) be considered as evidence of safety.
The use of screening to detect potential toxicity in the early stages of product development (including personal care products, manufacturing intermediates or drugs) means that those formulations likely to be associated with significant toxicity can be identified earlier in the development process. Only candidates that are more likely to be successful are taken forward, while those presenting toxicity issues are discontinued. This ultimately reduces the number of chemicals tested on animals.
Quantitative structure–activity relationships (QSARs)
Since the pioneering work of Hansch et al. in 1962, 41 quantitative structure–activity relationships (QSARs) have been used to demonstrate the quantitative relationship between properties of interest for a chemical and descriptors that are derived from its chemical structure. Such models have been applied to the prediction of (eco)toxicity and drug potency, and have also been used to predict physico-chemical properties (where they are referred to as quantitative structure–property relationship (QSPR) models).
The philosophy of QSAR or QSPR modelling can be explained in relation to its three constitutional requirements, outlined below:
The first requirement is for quantitative measures of the property of the chemical that is to be modelled (i.e. endpoint values), for a series of related chemicals. Endpoints include: biological activity or toxicity — for example, half maximal effective concentration for a drug (EC50), or lethal dose for 50% of test organisms (LD50); ADME parameters, such as the percentage of human intestinal absorption (% HIA); or physico-chemical properties, such as melting point.
The second requirement is to generate, or obtain, descriptors derived from knowledge of the chemicals’ structures for the series of chemicals used to generate the model. It is now possible to generate thousands of descriptors, and care must be taken to ensure that spurious relationships are not developed by the incorporation of too many, or irrelevant, descriptors into the model. Generally, readily interpretable descriptors are favoured in generating QSARs, particularly where these are used to inform safety assessment or regulatory submissions. However, there are many examples of QSARs based on statistical correlations. Although these can be difficult to interpret, they can be useful screens in early product development. Frequently used descriptors include those relating to partitioning — for example, the logarithm of the octanol:water partition coefficient (log P), aqueous solubility; and tissue:blood partition coefficients. These indicate relative lipophilicity/hydrophilicity of chemicals, and have been shown to correlate with the ability of chemicals to traverse biological membranes and hence reach a site of action. Size and shape descriptors — for example, molar volume, molecular weight (M Wt), topological indices and surface area are often incorporated, as they may reflect the ability of the chemical to reach a site of action or interact with a target in the body. Electronic effects, such as hydrogen bonding ability, Energy of the Highest Occupied Molecular Orbital (EHOMO), Energy of the Lowest Unoccupied Molecular Orbital (ELUMO) and dipole moment, can be used to indicate potential reactivity or binding at an active site. For example, Schwöbel et al. 42 reviewed the use of descriptors, based on electrophilic reactivity, for predicting toxicity associated with the interaction of biological nucleophiles with electrophilic xenobiotics (e.g. DNA binding and skin sensitisation).
The final requirement of a QSAR is a statistical technique that is used to demonstrate the correlation between the activity (toxicity, or other property of interest) with the descriptor values. Many statistical methods are used, ranging from simple linear regression, where a single descriptor is associated with an activity, or multiple linear regression, where several descriptors are used. The equation below shows an example of a simple, readily interpretable QSAR — namely, the Potts and Guy model for dermal penetration, where Kp is the skin permeability coefficient. 43 Here, Kp is shown to have a positive correlation with log P and a negative correlation with molecular weight.
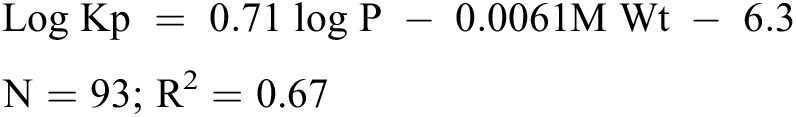
The square of the correlation coefficient (or coefficient of variability), R2, indicates the variability in the property of interest (Kp) that is accounted for by the descriptors (log P and M Wt). In correlating an individual descriptor with a property of interest, an r value of 1 demonstrates a perfect positive correlation, whereas a value of –1 indicates a perfect negative correlation. Correlation coefficient values above 0.7 are often quoted as indicating a useful model. However, definitive rules are not realistic, as it is highly dependent on the nature of the data. R values close to 1 are generally unrealistic for models predicting biological activity, because of the inherent experimental variability in the data used to generate the model, as referenced above. 18
Once a reliable QSAR model has been generated with training set data, a test set can be used to assess the predictivity of the model for chemicals outside of the training set. R2 CV (or Q 2 ) is the cross validated R2 value that is obtained by using the model to predict the activity of a test set, either by withholding part of the training set during the model building process (internal validation) or by using an external dataset (external validation). R2 CV values of 0.6 are often referred to as useful but, again, caution should be used in applying rigid definitions.
Models should only be used for making predictions for those chemicals that fall within the applicability domain of the model — a concept which is discussed further below. Outliers in QSAR models (i.e. chemicals that are poorly fitted to the model) require investigation. These outliers may indicate that alternative mechanisms of action are involved in the process, which are not accounted for by the model, or that a data point is erroneous, in which case it should be discounted. The principles of internal and external validation of QSAR models and a comparison of the validation methods that may be applied have been described previously. 44
The immutable truth in statistics is that correlation is not the same as causation. If a correlation exists between descriptors and properties, it does not necessarily mean that the change in one causes the change in the other. A causal relationship needs to be demonstrated, as correlation may be driven by another external factor. There is a strong correlation between total volume of tea consumed and the wisdom of humans, however (disappointingly), both of these are in fact determined by age — tea drinking does not lead to wisdom. Misinterpreting the difference between correlation and causation, and attempting to make predictions for chemicals outside of the applicability domain of the model, are common reasons why QSAR models are believed to ‘fail’. With appropriate use, models can provide insight into mechanisms of action and provide useful predictions where endpoint data are missing for certain chemicals. Cherkasov et al. 45 provide a detailed history of the development of QSAR models, trends in use, emerging applications and guidance for best practice in developing and evaluating QSARs. A summary of the key concepts of simple QSAR models is given in Figure 3.
Key Concepts Box: Quantitative structure–activity relationships (QSARs).
As the amount of data available (both endpoint and descriptor) has expanded exponentially, more advanced modelling techniques and machine learning methods have been employed to investigate potential patterns within these data. Non-linear relationships between descriptors and endpoints have been derived using artificial neural networks (ANNs), which are designed to mimic the learning processes of the human brain. ANNs comprise an input layer, that is connected to a sequence of ‘hidden’ nodes, in turn connected to an output layer. By adjusting the weighting of the hidden nodes, statistically significant correlations can be developed between the descriptors and an endpoint of interest; endpoint data can be used to train the network to minimise prediction error (supervised learning) or patterns between descriptors can be investigated without the use of endpoint data (unsupervised learning).
More recently, deep learning neural networks (DNNs) have been used to simultaneously predict more than one endpoint of interest from a collection of QSAR datasets. By apparently using the signal from adjacent chemicals involved in other QSAR tasks (i.e. where one QSAR task is embedded within several other QSAR tasks) improved predictions may be possible; however, this is not always the case. 46 Support vector machines (SVMs) have also been used to identify non-linear relationships, for example, by defining the hyperplane (boundary between regions) that provides the best separation between different classes of chemicals. Many other methods have been used for deriving non-linear relationships between descriptors and endpoints. While these have shown some success in predictive modelling, they are often considered as ‘black box’ models because the methodology is opaque. These may be useful for investigating datasets or for preliminary categorisation. However, in terms of chemical safety assessment, such methods are disfavoured because of their lack of interpretability. In the same way that data are investigated to assess their suitability for a given purpose, the same philosophy applies to selecting the most appropriate modelling method for a given purpose.
Three-dimensional approaches
QSAR models based on simple descriptors (e.g. log P, reactivity, etc.) are useful for a range of endpoints, such as aquatic toxicity or gastrointestinal absorption, etc. However, for certain endpoints that result from receptor binding interactions, such as endocrine disruption, 3-D descriptors may be more appropriate. 47 Pharmacophores (relating to drug activity) or toxicophores (relating to toxicant activity) describe the relative spatial orientation of key molecular features (such as hydrogen bond-donating or accepting groups) within a molecule that align with the complementary region of the target receptor. Three-dimensional modelling enables chemicals to be classed as potentially active or inactive, depending on the degree of fit or binding potential to the target. This approach has been used to develop and rationalise a pharmacophore for ligands associated with PPARγ activation, a mechanism involved in liver steatosis. 48 Fitting to this pharmacophore could be used as a screening tool to identify potential PPARγ agonists. A drawback of 3-D QSAR models is that they can be computationally expensive, as conformational flexibility of chemicals needs to be accounted for, and a suitable (energetically-minimised) conformation selected to assess binding potential. Molecular docking is a widely used in silico method to predict interactions between ligands and targets. Examples of both freely available (e.g. AutoDock) and commercial (e.g. Molecular Operating Environment and OpenEye Scientific) software for 3-D analysis are indicated in Table 3.
Predicting categorical data
QSAR analysis, as described above, is useful for deriving models for continuous data (for example, LD50 values). For certain endpoints, a categorised approach may be more appropriate. In this context, local lymph node assay (LLNA) data for determining skin sensitisation potential is often used to create discrete classes. These may be binary (such as sensitiser versus non-sensitiser) or provide an indication of relative potency (such as non, weak, moderate, strong or extreme sensitisers) based on discretisation (categorisation) of experimental data. Classification-based models can use molecular-based or similarity-based descriptors to assign chemicals to the appropriate class. In discriminant analysis, relevant properties can be used to distribute the chemicals in two or higher-dimensional space. A line or plane (discriminant function) is then used to separate the different classes of chemicals; cut-off values for specific properties can also be used to differentiate members of different classes. In a recent study, discretisation of enzyme inhibitor data and knowledge of molecular properties was used to develop a classification-based model to assign inhibitors of beta-secretase (BACE1) into one of two classes (i.e. high activity or little/no activity) to aid the identification of potential therapeutic agents for Alzheimer’s disease. 49 In the k-nearest neighbour (k-NN) approach, chemicals are placed into classes based on their similarity to other chemicals within the class (concepts of chemical similarity are discussed further below). Kovarich et al. 50 describe the use of k-NN to allocate brominated flame retardants to classes of ‘actives’ and ‘inactives’, based on their potential to elicit endocrine disruption.
Predictive software
There are many examples where existing QSAR models have been incorporated within predictive software. For example, EPISUITE (freely available from the US EPA) enables a range of endpoints to be predicted, based on the chemical’s structure and application of a suite of integral QSAR models. The endpoints include physico-chemical properties, such as log P, aqueous solubility, Henry’s law constant, dermal uptake and toxicity to environmental species (i.e. via the ECOSAR application that predicts acute and chronic toxicity of chemicals towards algae, aquatic invertebrates and fish). VEGA HUB also provides access to a range of freely available QSAR models that were either developed as part one of the many EU projects (such as CAESAR), or obtained from TEST (the Toxicity Estimation Software Tool from the US EPA). There are four categories of predictive models, namely: − toxicity (e.g. mutagenicity, carcinogenicity, developmental and reproductive toxicity, oestrogen receptor binding, skin sensitisation and hepatotoxicity models); − ecotoxicity (e.g. fish, Daphnia and bee acute toxicity models); − environmental fate (e.g. bioconcentration, half-life, biodegradability and persistence models); and − physico-chemical property models (e.g. log P prediction).
Detailed and accurate reporting of QSAR models and predictions derived therefrom are important, if the predictions are to be used with confidence, especially for regulatory submissions. VEGA, as well as other software, provides detailed reports based on a standardised QSAR Model Reporting Format (QMRF). Table 3 provides further examples of software that are widely used to predict physico-chemical properties, ADME information or toxicity. These are representative examples to indicate the capabilities of such software, the list is by no means exhaustive. As an output of the ANTARES project (Alternative Non-Testing methods Assessed for REACH Substances), a comprehensive list of software available for predicting physico-chemical, (eco)toxicological, environmental fate and ADME properties was previously reported (http://www.antares-life.eu/index.php?sec=modellist). A more recent review by Kar and Leszczynski 51 describes a range of freely available tools for ADMET prediction. The Computational Chemistry List (http://www.ccl.net/chemistry/links/software/index.shtml) also provides a large compilation of available resources for QSAR modelling. Also noteworthy, is the open source KNIME platform, through which a community of users has developed and shared numerous ‘nodes’ for a wide range of chemoinformatic applications. More information (and download access) is available at https://www.knime.com/.
Chemical structural similarity
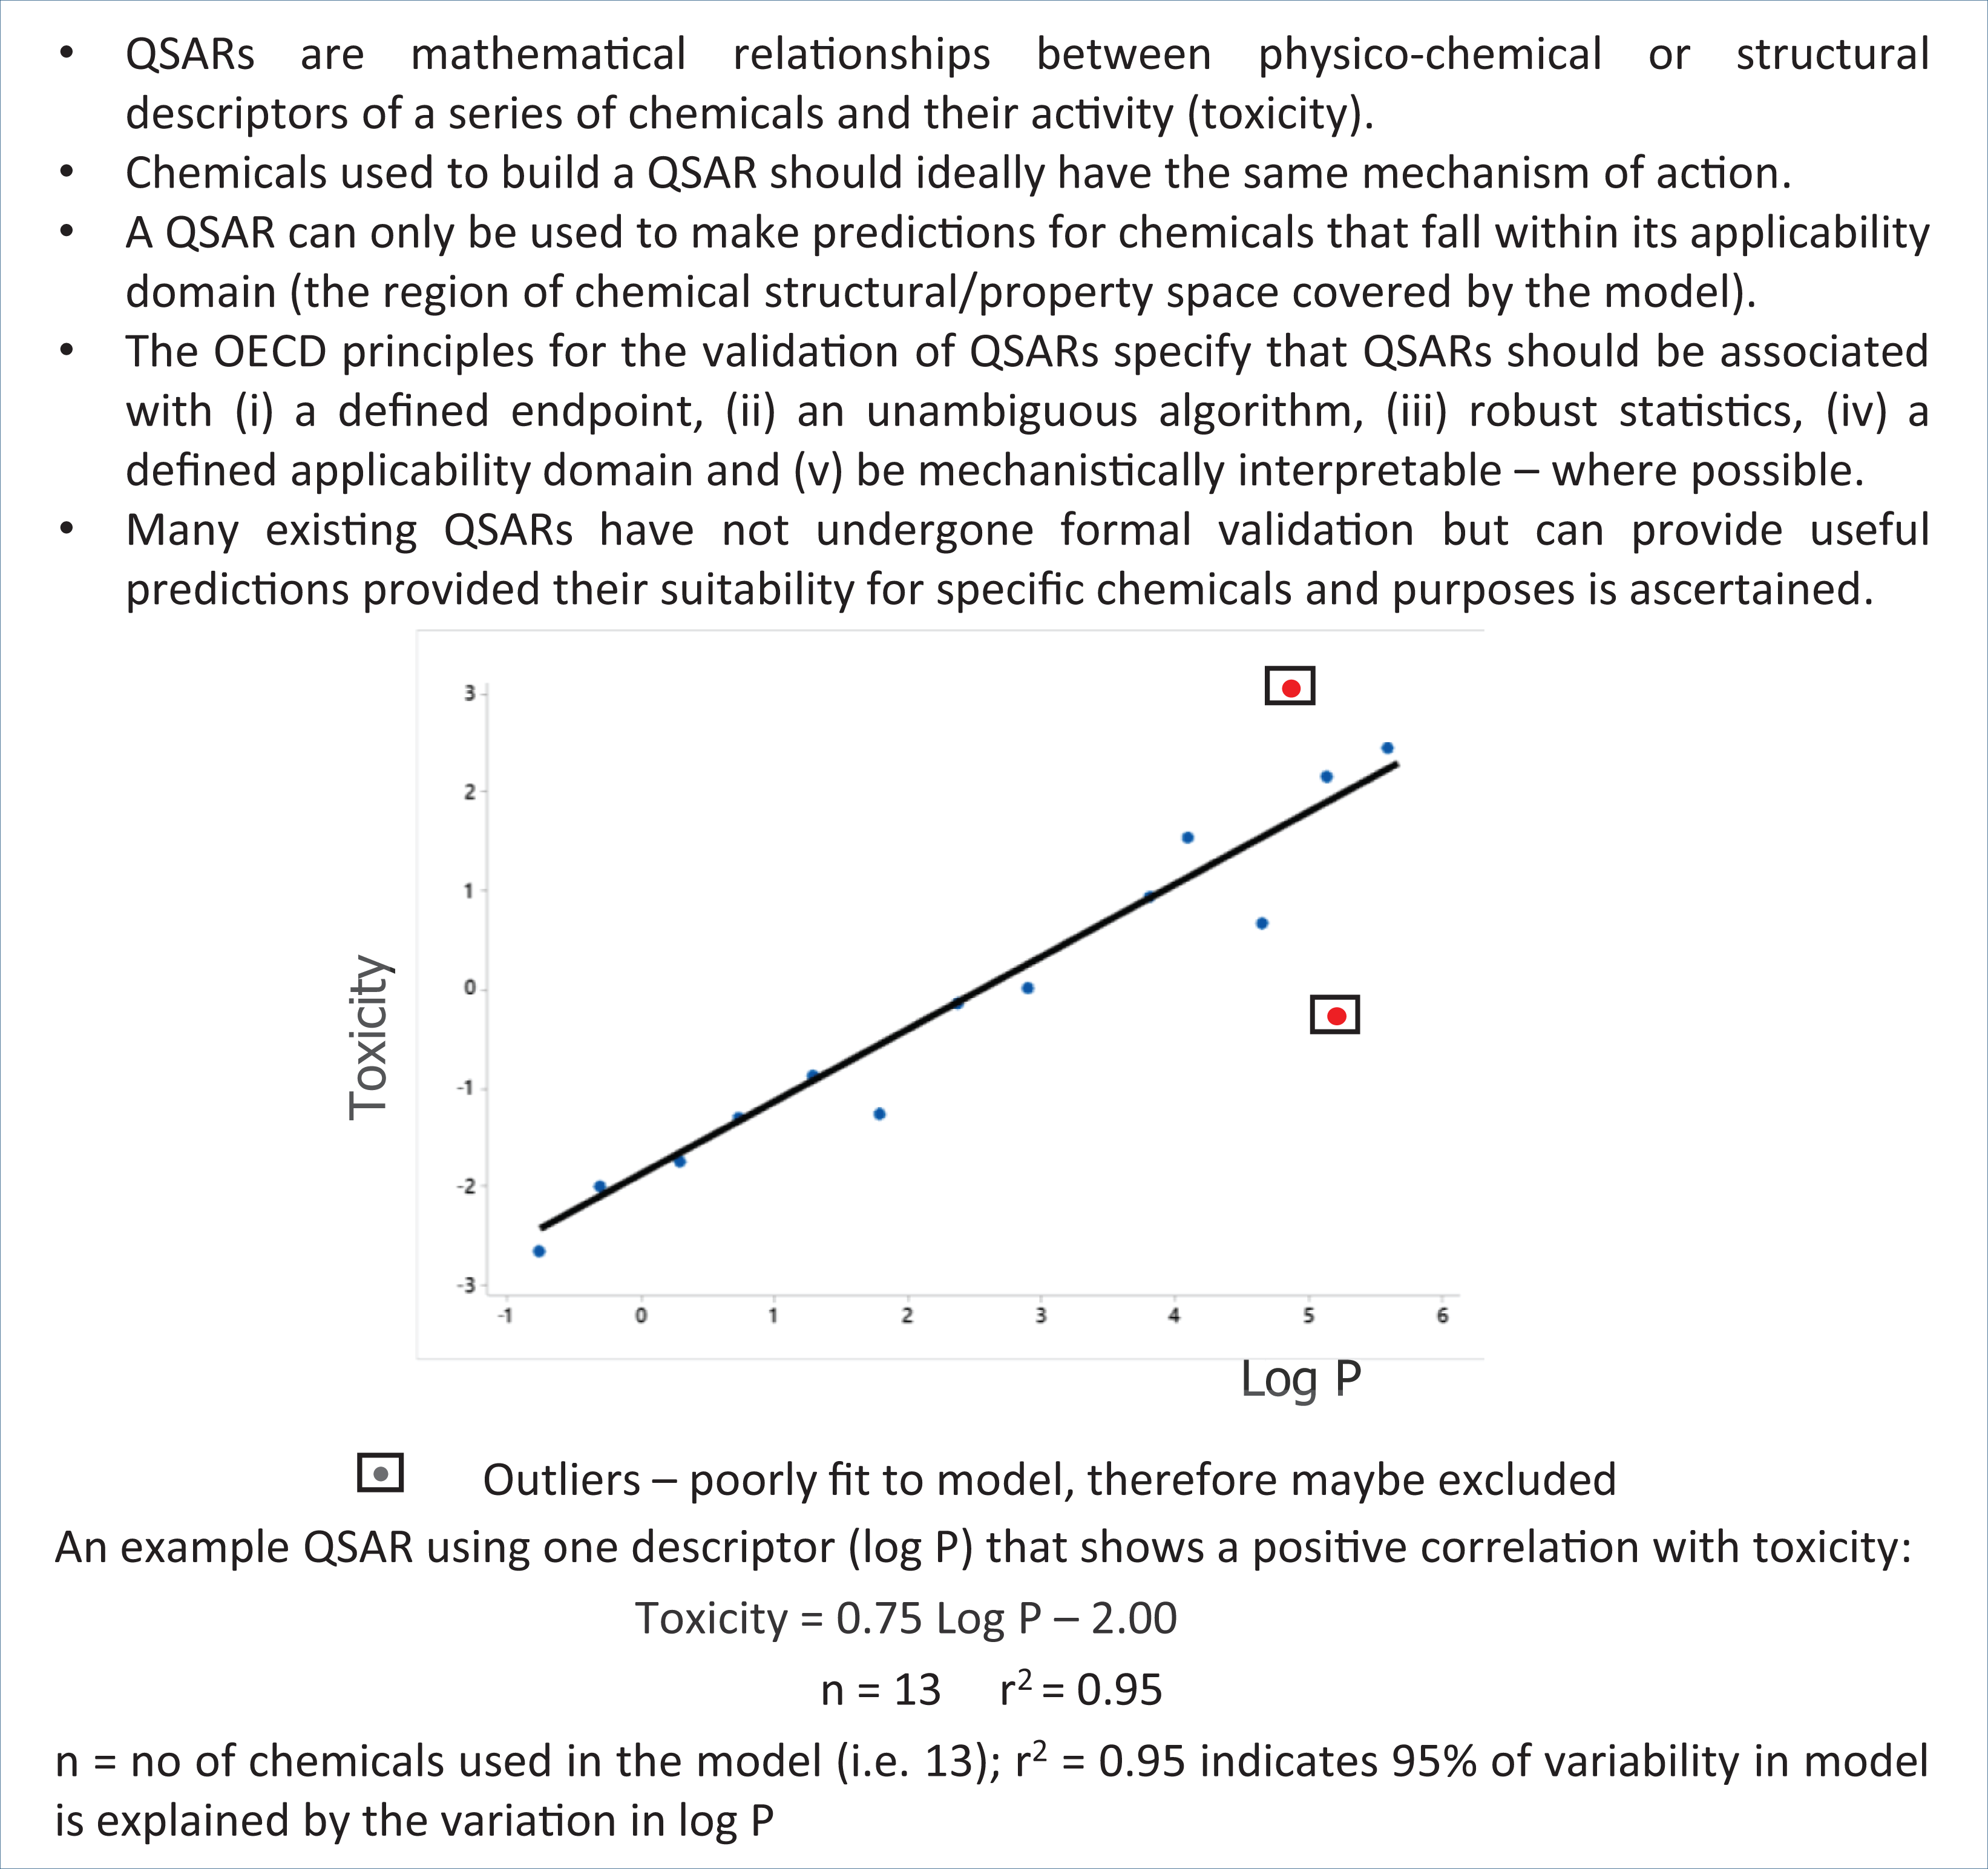
It is often observed that similar chemicals exhibit similar effects. Therefore, despite the caveats noted above, there is a desire to identify which chemicals are similar, to enable predictions to be made for chemicals lacking data, from those with data. It is essential to understand that no chemical can be absolutely similar to another, only similar with respect to a given property (or properties). Chemical fingerprinting is a technique that is commonly used to identify chemicals that are structurally similar. To generate a chemical fingerprint, the presence or absence of specific structural features (keys) within a molecule is indicated by ‘1’ or ‘0’, respectively. This enables a bitstring to be generated for every chemical within a group. The calculated degree of similarity between chemicals depends, firstly, upon which structural features (keys) are sought within the structure. Many different sets of keys are used for this purpose, with different numbers and types of features sought. For example, the fingerprinting algorithm available through the PubChem website uses 881 keys, Daylight fingerprinting uses 1024 keys and MACCS uses 166 keys. Once the fingerprints have been generated for the chemicals of interest, a mathematical formula is used to calculate the degree of overlap between the bits occurring in the fingerprints of different chemicals. The calculated degree of similarity between chemicals depends, secondly, on which mathematical formula is used to calculate the overlap. The Tanimoto coefficient is commonly used for this purpose. However, there are many other methods (as summarised by Daylight Chemical Information Systems Inc.; https://www.daylight.com/dayhtml/doc/theory/theory.finger.html).
The key concepts illustrated in Figure 4 include an example calculation for the generation of similarity indices using the Tanimoto coefficient. (Note that, in this case, a few example bits only have been included for illustrative purposes. Typically, hundreds of bits are used.) Chemicals with an index of similarity (e.g. Tanimoto coefficient) close to 1 are considered similar, values approaching 0 indicate little or no similarity. Tanimoto coefficients of 0.6 or 0.7 have been used as cut-off values to differentiate similar or dissimilar chemicals — however, these are arbitrary and other values may be more appropriate in certain circumstances. The selection of bit strings to compare (e.g. those generated by MACCS, PubChem fingerprints, etc.) and the method used to compare the bitstrings (e.g. Tanimoto, Euclid, Pearson, etc.) can give very different results for the calculated degree of similarity. This concept was exemplified by Mellor et al., who demonstrated (among many other examples) that for 3-methyl-6-n-butylphenol and 2,6-di-tert-butylphenol, using CDK FCFP6 type fingerprints, the Tanimoto coefficient of similarity was 0.26 (i.e. dissimilar), whereas using CDK PubChem fingerprints, the Tanimoto coefficient was 0.88 (i.e. similar). 52 As yet, there is no consensus as to which is the most appropriate similarity metric to use. It is likely that different metrics will be appropriate for different scenarios, which is an important consideration in view of the fact that knowledge available for similar chemicals is increasingly used to inform data gap filling. The KNIME platform (https://www.knime.com/) provides nodes for molecular fingerprinting and analysis by using a range of similarity metrics.
Key Concepts Box: Similarity and fingerprints.
Analogues, grouping and read-across
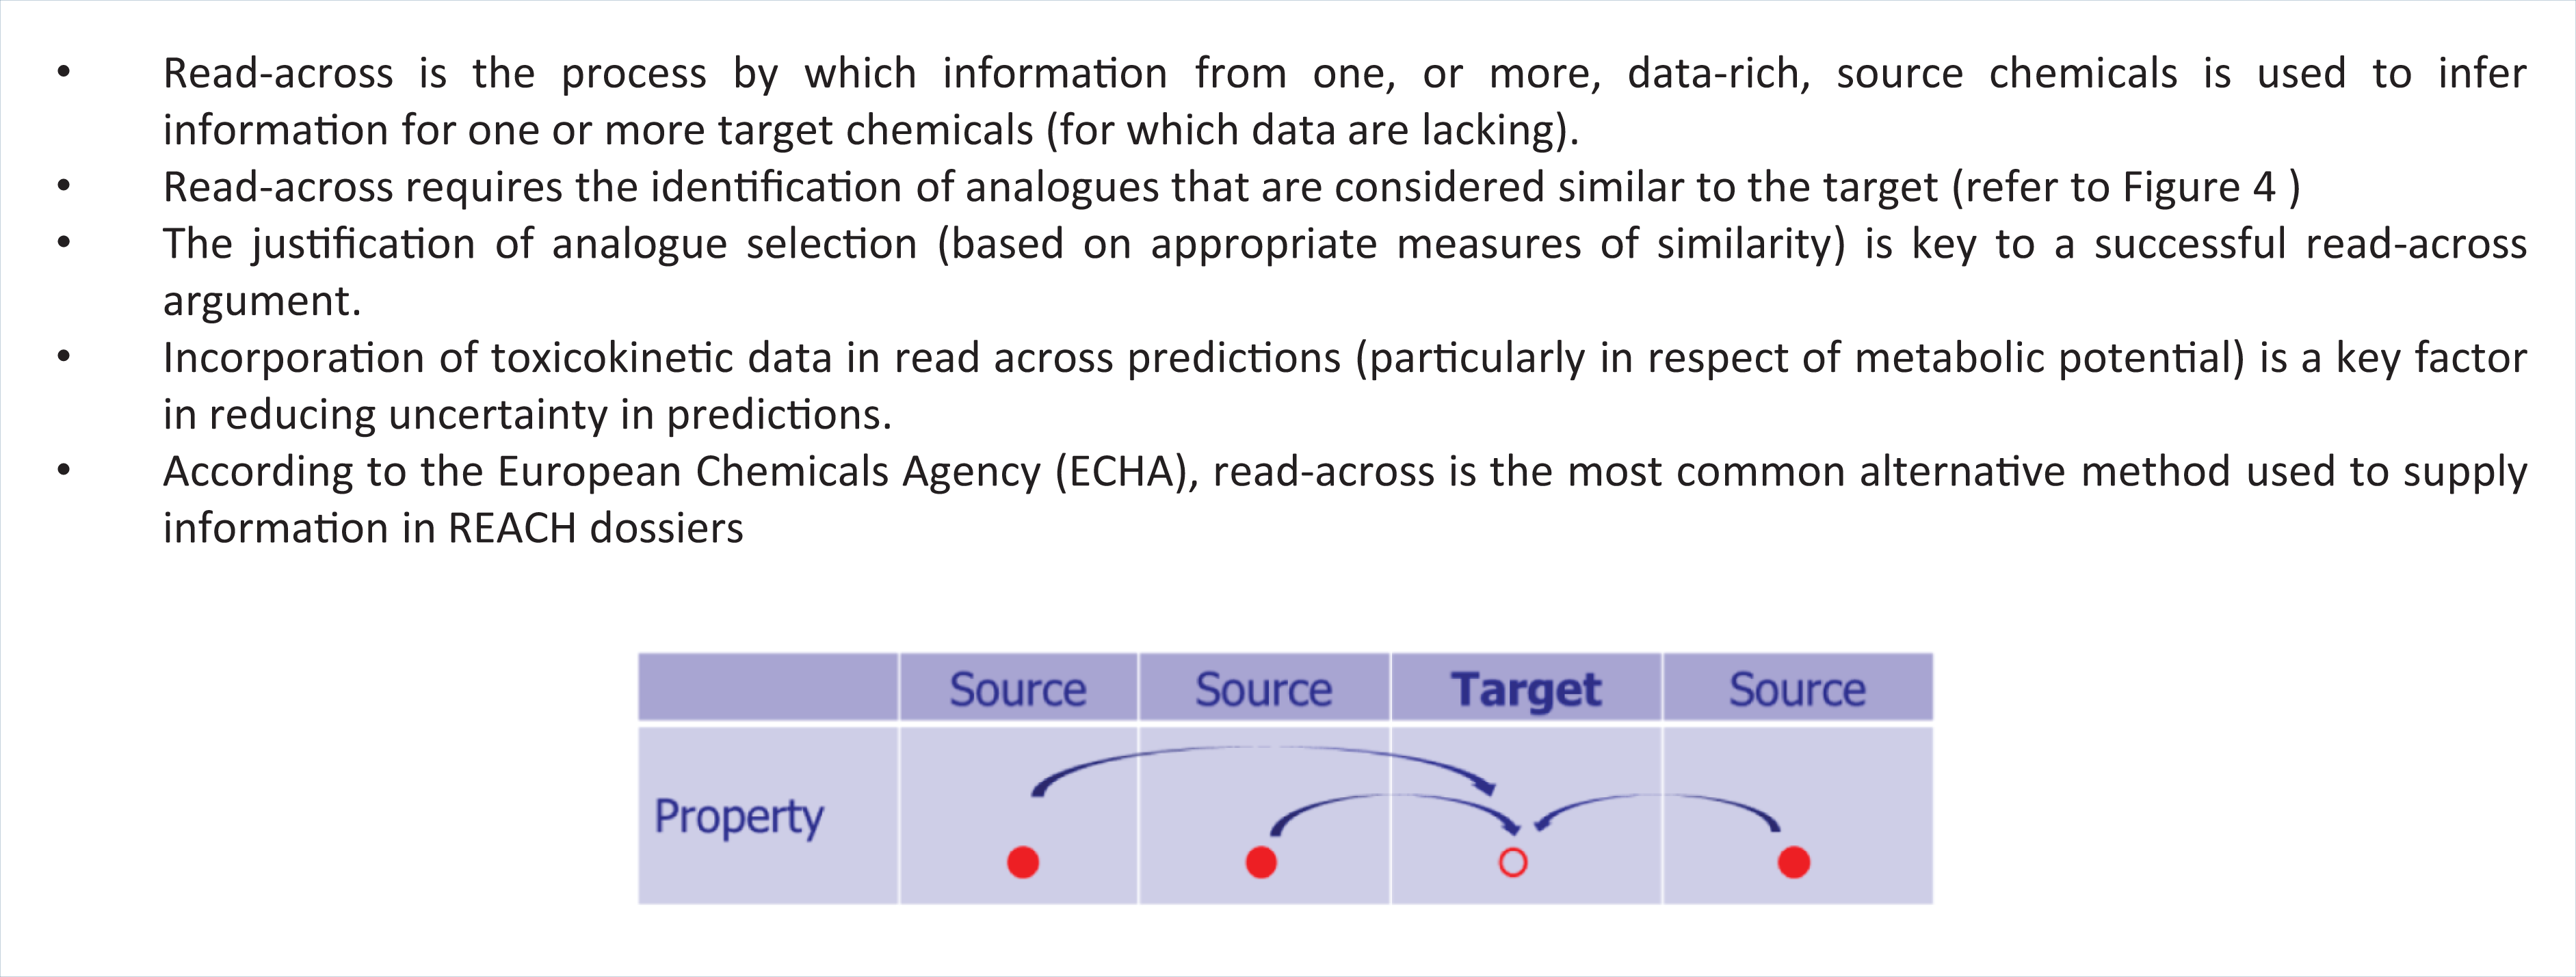
In recent years, a conceptually simplistic process has become prevalent in industrial and regulatory settings — i.e. the use of read-across to assist chemical safety assessment. Read-across is the process by which endpoint information for one or more data-rich (source) chemicals is used to make predictions for one or more data-poor (target) chemicals, that are considered to be similar (as illustrated in Figure 5).
Key Concepts Box: Read-across.
In the analogue approach, one (or few) highly similar chemicals are used to perform read-across from source to target chemicals. Grouping is a process whereby chemicals that share one or more common properties are placed together in groups or ‘categories’ of related chemicals. Where information is available for some members of the group, this is used to make inferences for other group members. Key to identifying analogues, generating groups or performing read-across is identifying which chemicals can be considered to be similar. Similarity may be considered in terms of chemical fingerprints (as described above), being part of the same chemical class (e.g. varying in carbon chain length), physico-chemical properties, presence or absence of specific structural features (e.g. SAs) and/or mechanism of action.
Forming a group on the basis that all chemicals share a common mechanism of action, is a robust method for grouping, where the mechanism of toxic action is known — for example, this grouping could be based on the presence of a relevant structural alert that is known to be associated with a specific toxicity. If the mechanism is unknown, then analogues may be selected by using similarity metrics. As there is no single ‘best’ method to determine similarity, pragmatically it may be appropriate to use several similarity metrics initially, and then rationalise analogue selection based on additional criteria. Software to identify structurally similar chemicals (using a range of metrics) has been available for many years — for example, ToxMatch (from Ideaconsult) and the Compound Similarity workbench from ChemMine Tools (see Table 3). These can provide quantitative measures of similarity between different chemicals, enabling appropriate groups to be formed. In order to make a successful read-across prediction for an in vivo response, analogue selection should take into consideration similarity, not only of chemical structure, but more importantly, similarity in mechanism of (toxic) action and ADME profile (i.e. pharmacokinetics or toxicokinetics).
The acceptability of read-across predictions relies upon full justification and accurate documentation of how the appropriate source chemicals, from which the prediction for the target was made, were selected. Hence, justifying the criteria by which ‘similar’ chemicals have been selected for read-across is of paramount importance. Extensive guidance on how to perform read-across based on analogues or grouping, as well as on how to record the requisite information, has been produced by the Organisation for Economic Co-operation and Development (OECD). 53 The read-across assessment framework (RAAF) from the European Chemicals Agency (ECHA) provides guidance on how read-across predictions can be evaluated, to ensure suitability for regulatory submission. Originally devised for internal use by ECHA, this has been made publicly available to assist those submitting dossiers incorporating read-across, to help ensure the appropriateness of their argumentation. The process is exemplified through a series of ‘scenarios’ comprising different ‘assessment elements’ against which the validity of the read-across is judged. 54
The past five years has seen a plethora of articles on how to perform, and document, read-across predictions (for regulatory purposes), particularly the identification and justification of analogue selection. 53 –55 More recent publications have focused on: lessons learned from read-across submissions to ECHA, highlighting pitfalls and reasons for rejection; 56 how uncertainty in predictions can be characterised, reported and reduced; 57 and how to select analogues accounting for pharmacokinetic/toxicokinetic similarity, 58 –61 all with the aim of increasing regulatory acceptance of read-across predictions. Bespoke tools for performing read-across have also been developed. AMBIT (from the European Chemical Industry Council’s Long Range Initiative, Cefic-LRI) includes an extensive, searchable database, as well as integrating models for toxicity prediction (i.e. Toxtree models). A comprehensive assessment workflow can be used within AMBIT to identify source chemicals for a given target, assist with read-across and generate standardised reports; the features of AMBIT are summarised in Table 3.
QSAR Toolbox
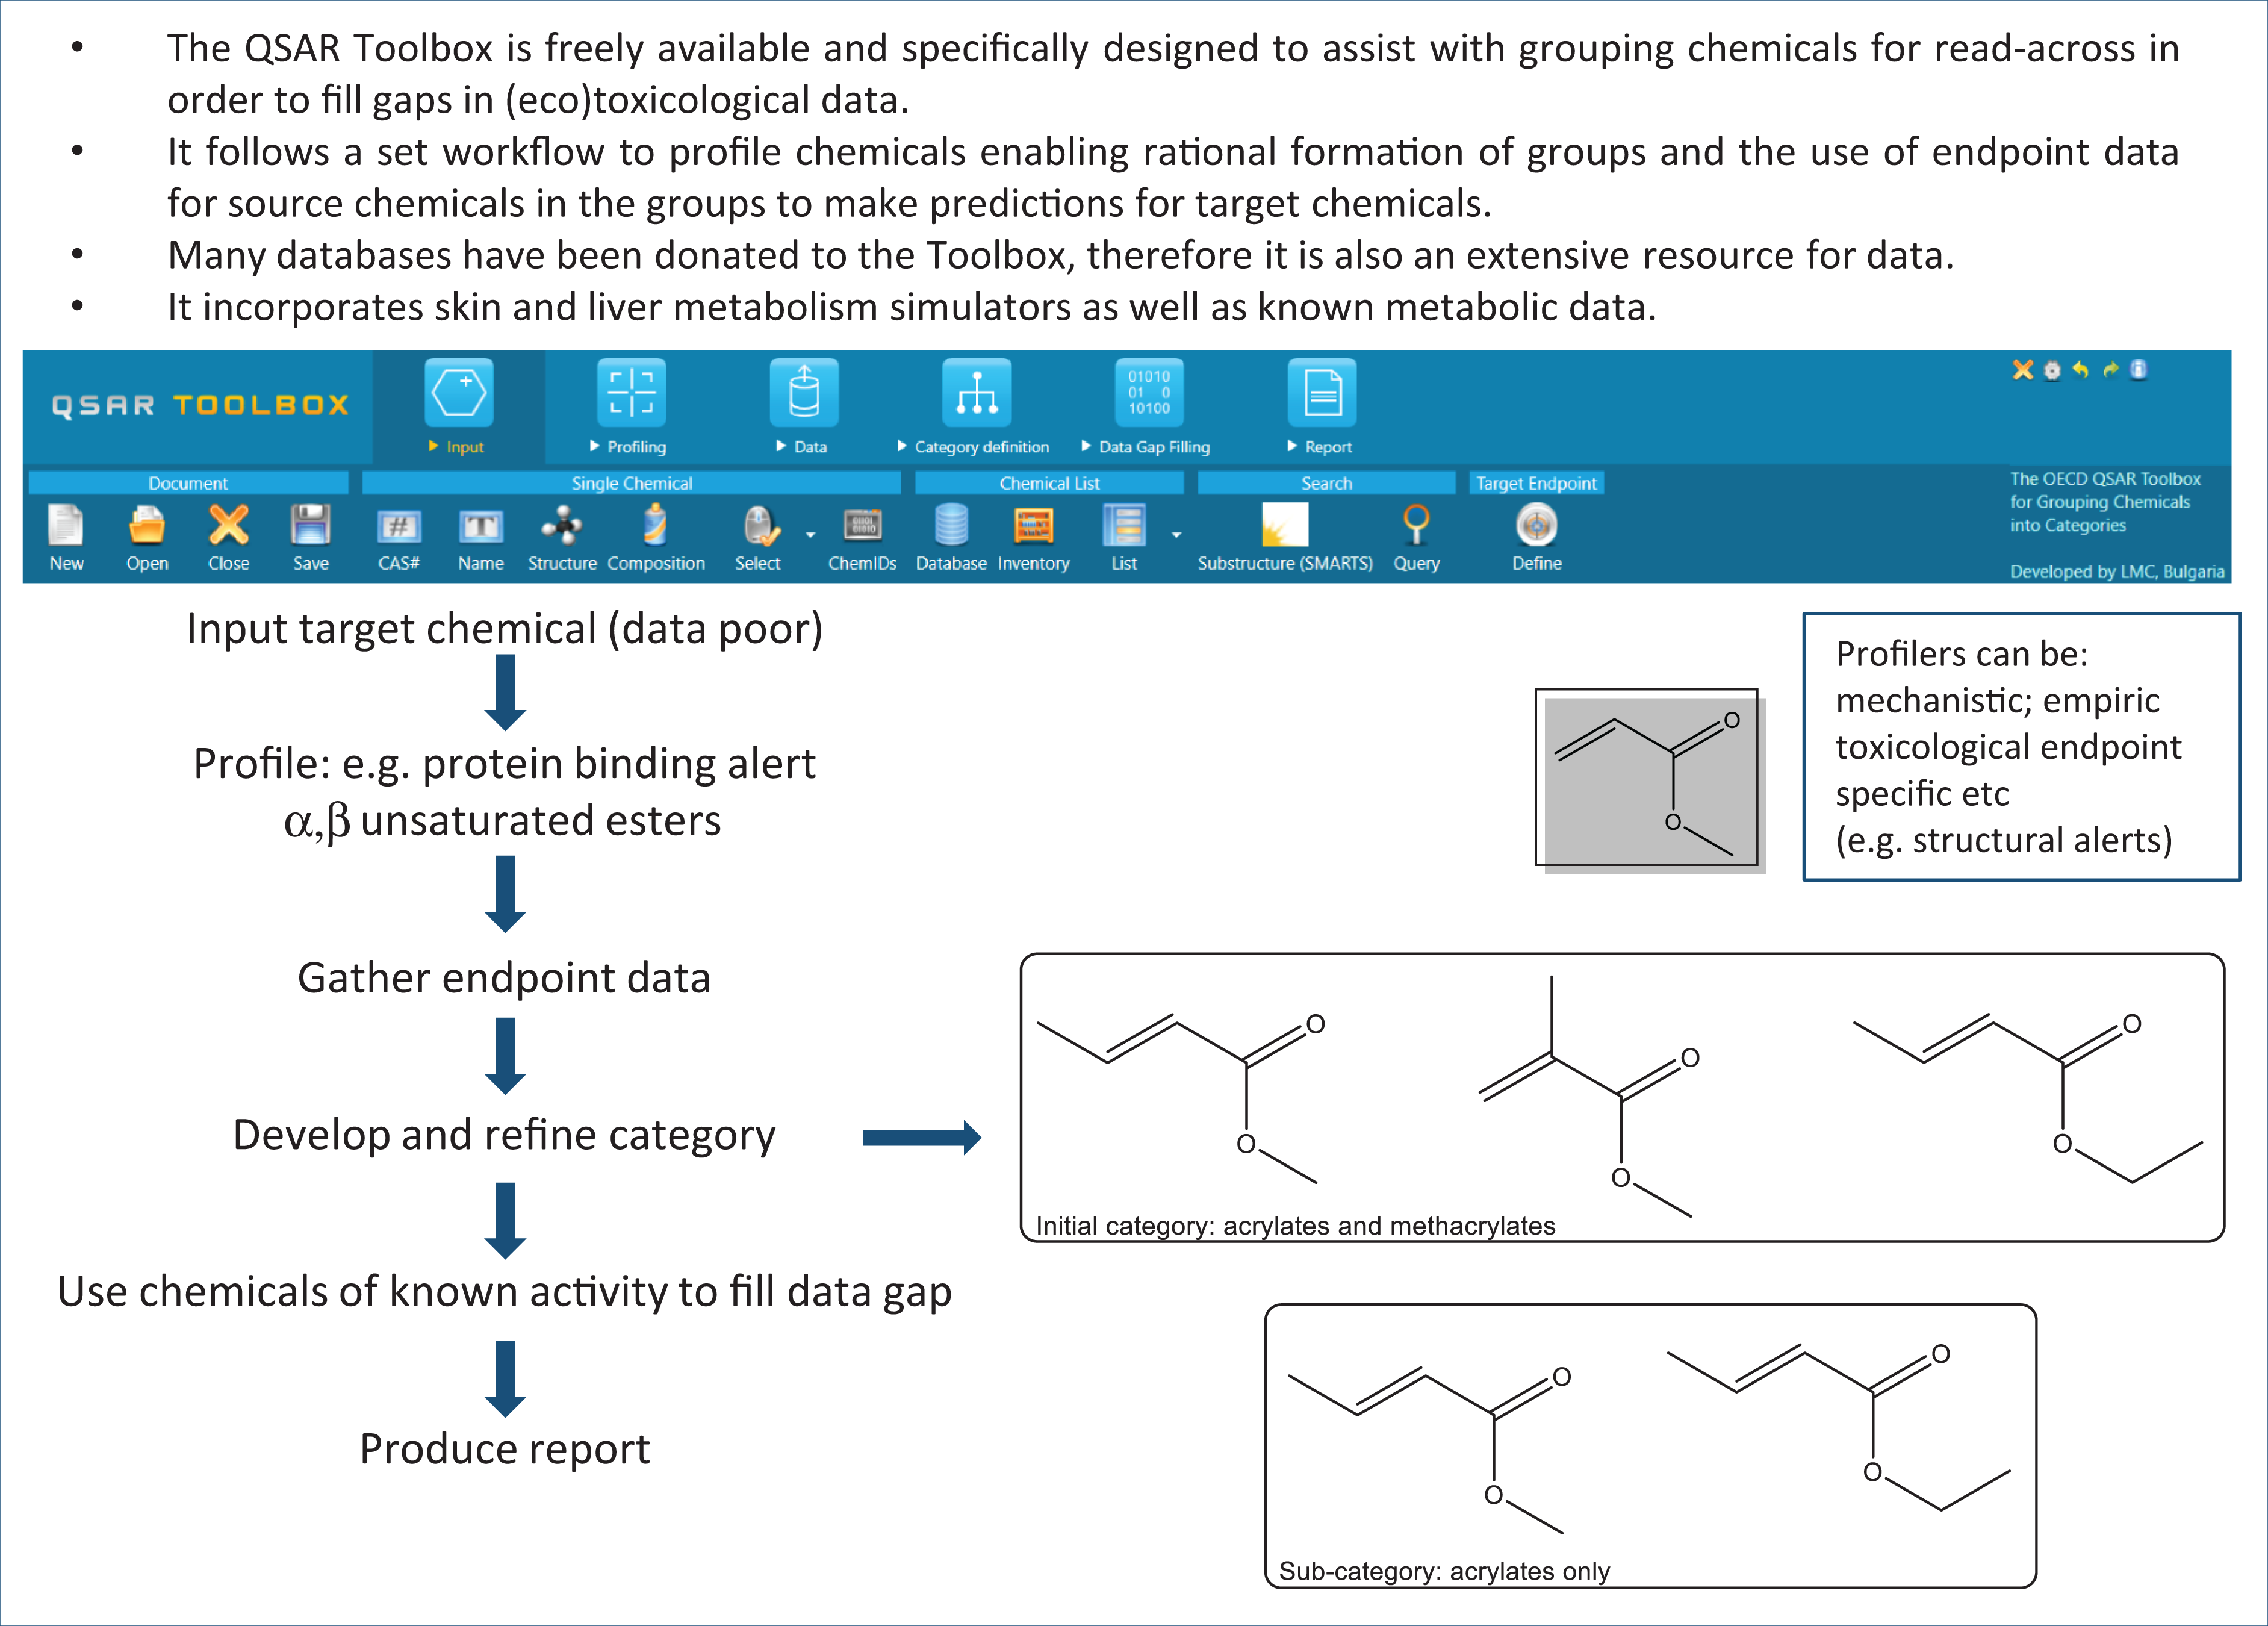
The QSAR Toolbox (formerly the OECD QSAR Toolbox) is a freely available, prototypical tool for performing read-across, designed for use by industry and regulators. 62 The first version was released in 2008 and, following multiple improvements and updates, version 4.4.1 was released in April 2020. This software was designed specifically for the purpose of grouping chemicals together into rationally-based categories and performing read-across to fill gaps in (eco)toxicity data for hazard assessment. Detailed step-by-step user guidance documents, online tutorials and example case studies are available with the software download files (from https://qsartoolbox.org/). The Toolbox follows a logical workflow, whereby a query (target) chemical is input and can then be profiled using one of the many profilers incorporated into the system. These profilers are categorised as empiric, toxicological endpoint specific or mechanistic (i.e. used to identify functional groups or features associated with a structural alert, as described above). Many databases have been donated to the Toolbox project, and as a result it also represents a useful stand-alone database for physico-chemical property toxicity data and metabolic information.
The Toolbox enables rationally-based chemical categories to be developed. These can be further refined, if necessary, to ensure that a suitable sub-category is formed — i.e. that the structures of chemicals in the group are sufficiently similar and that the group is representative of the query (target) chemical for which the read-across prediction is to be made. Chemicals within the category for which data are known (source chemicals) are used to infer the activity of the target chemical(s) using read-across. The Toolbox includes functionalities for predicting skin and liver metabolism, in addition to the known metabolic information in the database. The formation of common metabolites is an acceptable reason to group chemicals, and the metabolites themselves may be profiled (e.g. for the presence of particular functional groups or SAs). As the Toolbox is continually updated with information and functionalities, the resulting software has become quite complex for novice users. Consequently, automated workflows have now been developed for acute aquatic toxicity and skin sensitisation, enabling non-experts to generate predictions with minimal interaction. Standardised workflows, requiring the user to select relevant options based upon their judgement, are available for more experienced users. 63 Key to a successful read-across is the complete, transparent recording and documentation of the process of category formation. These features are embedded in the reporting module of the QSAR Toolbox, to ensure the prediction has been adequately justified. Software to assist with read-across is also summarised in Table 3, and the generic workflow of the Toolbox is represented in Figure 6.
Key Concepts Box: Workflow of the QSAR Toolbox.
Evaluation of in silico models
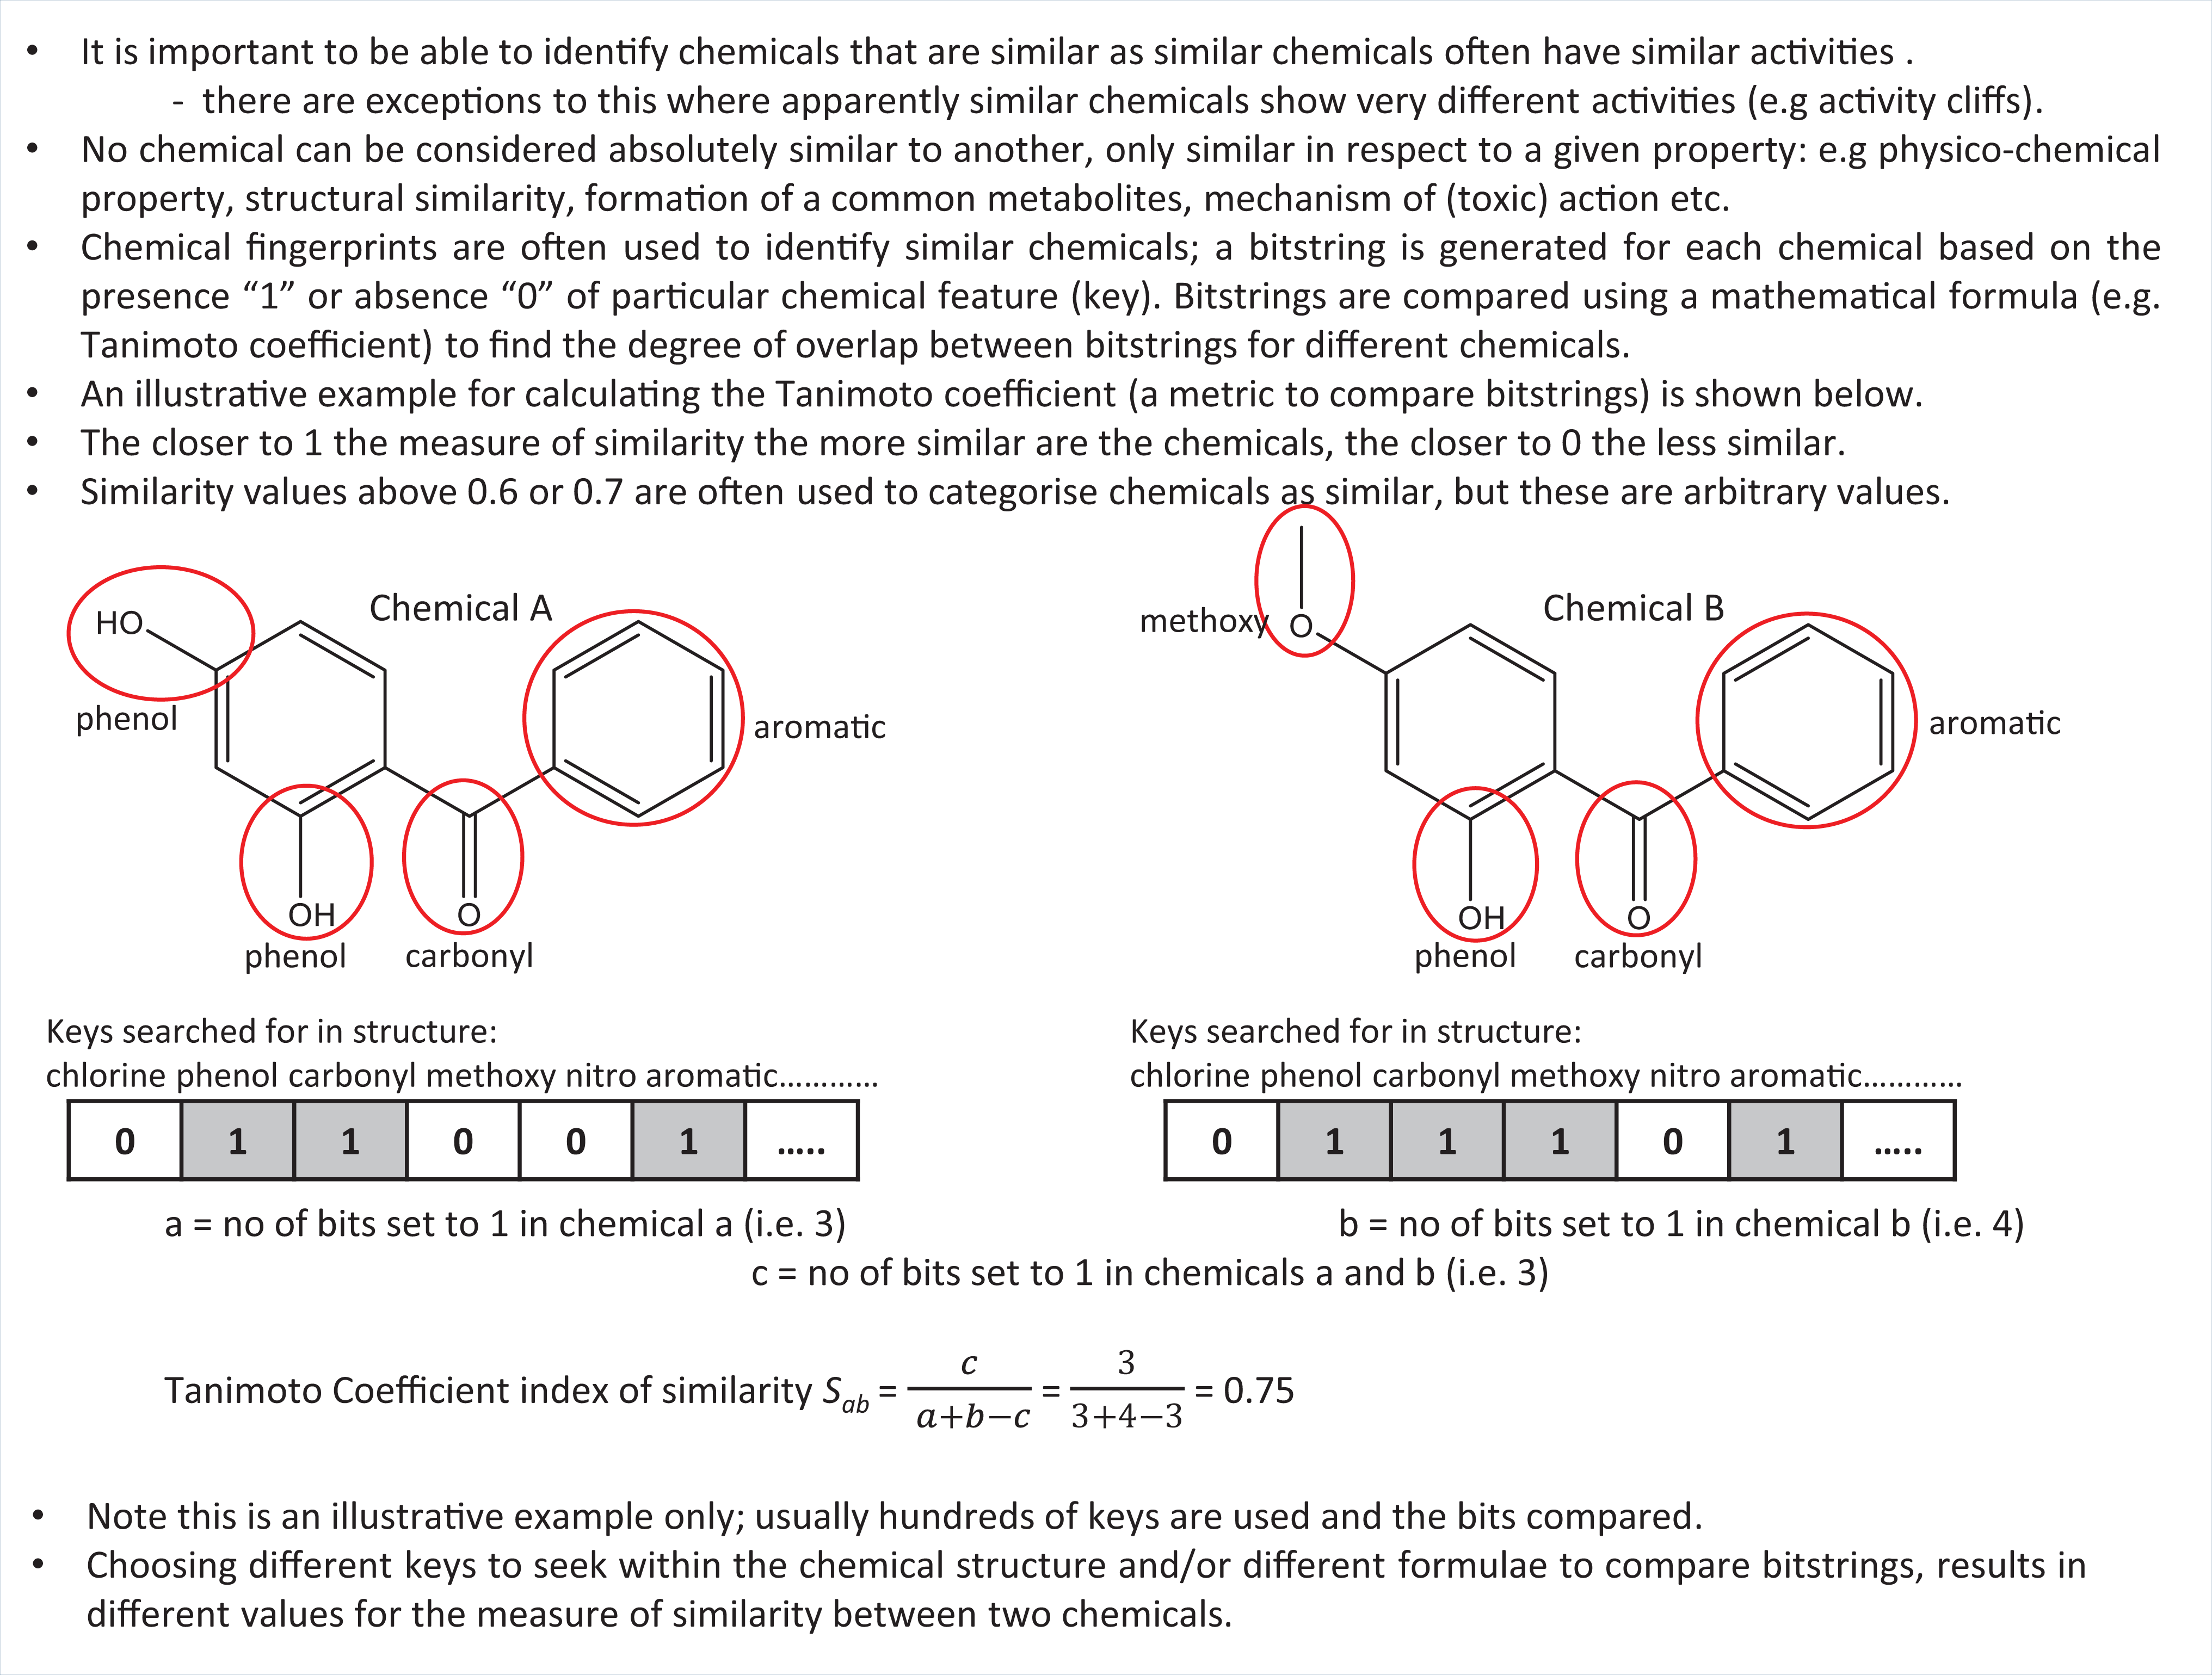
In silico models, and predictions based upon their application, should be evaluated to ensure the quality of the model and the level of confidence in the predictions obtained. In 2003, the OECD established an Expert Group on QSARs, and in 2004 the OECD member countries agreed on the OECD Principles for the Validation, for Regulatory Purposes, of (Q)SAR Models.
64
The Principles state that “to facilitate the consideration of a (Q)SAR model for regulatory purposes, it should be associated with the following information: a defined endpoint; an unambiguous algorithm; a defined domain of applicability; appropriate measures of goodness-of-fit, robustness and predictivity; a mechanistic interpretation, if possible.”
While the terminology formally refers to QSARs, the Principles are equally valid for evaluating other types of in silico models.
It is clear that a model must be derived for a specific endpoint; however, the relevance of the endpoint to the outcome of interest must also be established. For example, many models have been derived to predict mutagenicity, and the results are compared to those from the Ames mutagenicity assay. However, the true endpoint of interest is quite often carcinogenic potential in humans; therefore, the relevance of the endpoint must be considered. Chemicals that are predicted to be mutagenic may ultimately lead to carcinogenicity, but there are many reasons why this might not occur (e.g. metabolism to a non-mutagenic entity or compensatory pathways in vivo). Similarly, models that are based on the results of a rodent carcinogenicity assay may not be predictive of toxicity to humans. With respect to the first of the OECD Principles, the endpoint should be both well-defined and relevant.
Algorithms used to generate in silico models, such as multiple-linear regression or SAs, are generally unambiguous and readily reproduced. In moving to more complex modelling methods, such as Support Vector Machine (SVM) learning or ANN, the algorithms may become less transparent or difficult to reproduce, and there is a danger of over-fitting data. Although complex models can play a role in evincing subtle relationships within datasets that may, for example, lead to alternative directions in product development, the lack of transparency constrains their use for regulatory safety assessment.
The third OECD Principle captures the concept that (Q)SARs cannot be applied universally to all chemicals, only to those within their applicability domain. This can be defined as the physico-chemical, structural or mechanistic region of chemical space (represented by the chemicals in the training set) for which reliable predictions can be made. For example, if the training set chemicals all had a log P value below 2, the model is unlikely to be reliable for chemicals of significantly higher log P or for chemicals with more diverse functionalities than those of the training set.
Where models for biological activity (toxicity) are used for prediction, the chemicals used to develop the model should act via the same mode or mechanism of action. Inappropriate use is one of the most common reasons why in silico models produce unreliable predictions. As the model user must determine the suitability of the model for a given purpose, adequate documentation of the model — for example, inclusion of the training/test set data, a detailed description of the algorithm and model performance statistics — is vital. A means of addressing these issues with regard to the use of in silico models is to characterise their uncertainties, as well as areas of bias and variability; schemes have been developed to this effect, for both read-across and QSARs. 57,65 Uncertainties in modelling, and the methods by which this may be evaluated, are not restricted to in silico models for toxicity prediction. Uncertainties can arise from a range of factors, including measurement error or inherent randomness of the system. Causes of uncertainty in modelling, and how this uncertainty may be described, evaluated and communicated, has been explored across a range of disciplines. 66,67 These studies have largely drawn upon the better understanding of uncertainties in risk assessment. The definition of uncertainties should not be seen as a means to definitively validate an in silico approach (although it can assist in that), but rather it should be seen as a way to identify areas of weakness where more information or evidence may be required. The long-term aim is to be able to define the level of uncertainty that may be acceptable for a particular purpose, and have the means to determine if a particular model reaches the threshold of acceptability, and, if not, what is required in order for it to reach that level.
In silico tools as components of integrated frameworks
In silico tools are generally not capable of acting as one-for-one replacements for in vivo toxicity assays, although they are now accepted for the assessment of mutagenic impurities under the International Council for Harmonisation of Technical Requirements for Pharmaceuticals for Human Use (ICH) M7 guidelines. 68 More often, these tools provide pieces of relevant information that can help to build a complete mechanistic understanding of the processes involved when a chemical interacts with a biological system. Predictions from in silico models are more useful when used in conjunction with other methods, but this requires a flexible framework through which relevant chemical and biological information can be integrated.
For safety assessment, evidence from a range of sources can be compiled on a case-by-case, weight-of-evidence approach. Integrated Testing Strategies (ITS) or Integrated Approaches to Testing and Assessment (IATA) have been used to organise existing information that is relevant to toxicity assessment, in an effectively logical manner. Such approaches make it easier to determine whether there is sufficient information available on which to base a decision, or whether further evidence is required — and, if so, how testing should best be directed. 69
The in silico protocol for skin sensitisation describes a framework for the integration of results from in silico methods, as well as from experimental sources, to help identify potential sensitisers. The framework is a consensus on how to predict skin sensitisation derived from the experience of 39 cross-industry organisations. 70 Further integration of approaches and techniques is inevitable, with modelling being supported, as appropriate, by in vitro, HTS, organ-on-a-chip, data technologies, etc. For instance, the International Cooperation on Cosmetics Regulation (ICCR) has proposed a set of principles for the Next Generation Risk Assessment. 71 The principles are based on exposure and an understanding of mode/mechanism of action. They include computational approaches such as the Threshold of Toxicological Concern (TTC) and evaluation of exposure, before a more detailed assessment of toxicodynamics is undertaken. These complement, and to some extent extend, the ab initio approaches to risk assessment which are intended for use when read-across is not possible. 72
Physiologically-based kinetic models
As biological response is determined by a combination of intrinsic activity and the concentration–time profile of the chemical at the relevant site, an important component of integrating approaches is knowledge of the spatio-temporal distribution of chemicals within the organism of interest. Physiologically-based kinetic (PBK) models are increasingly being used to provide information for such approaches, in addition to their traditional use in drug development and designing dosing regimen. Historically, physiologically-based pharmacokinetic (PBPK) models were developed within the pharmaceutical industry to describe the concentration–time profiles of drugs in the blood and/or organs of interest. However, the methodology is equally applicable to toxicants, giving rise to the term physiology-based toxicokinetic modelling (PBTK). Therefore, the terms PBK, PBPK and PBTK are commonly encountered. These models help to quantify the amount of chemical reaching a target site (the internal dose), which is more relevant for predicting activity than considering the external dose to which an organism is exposed.
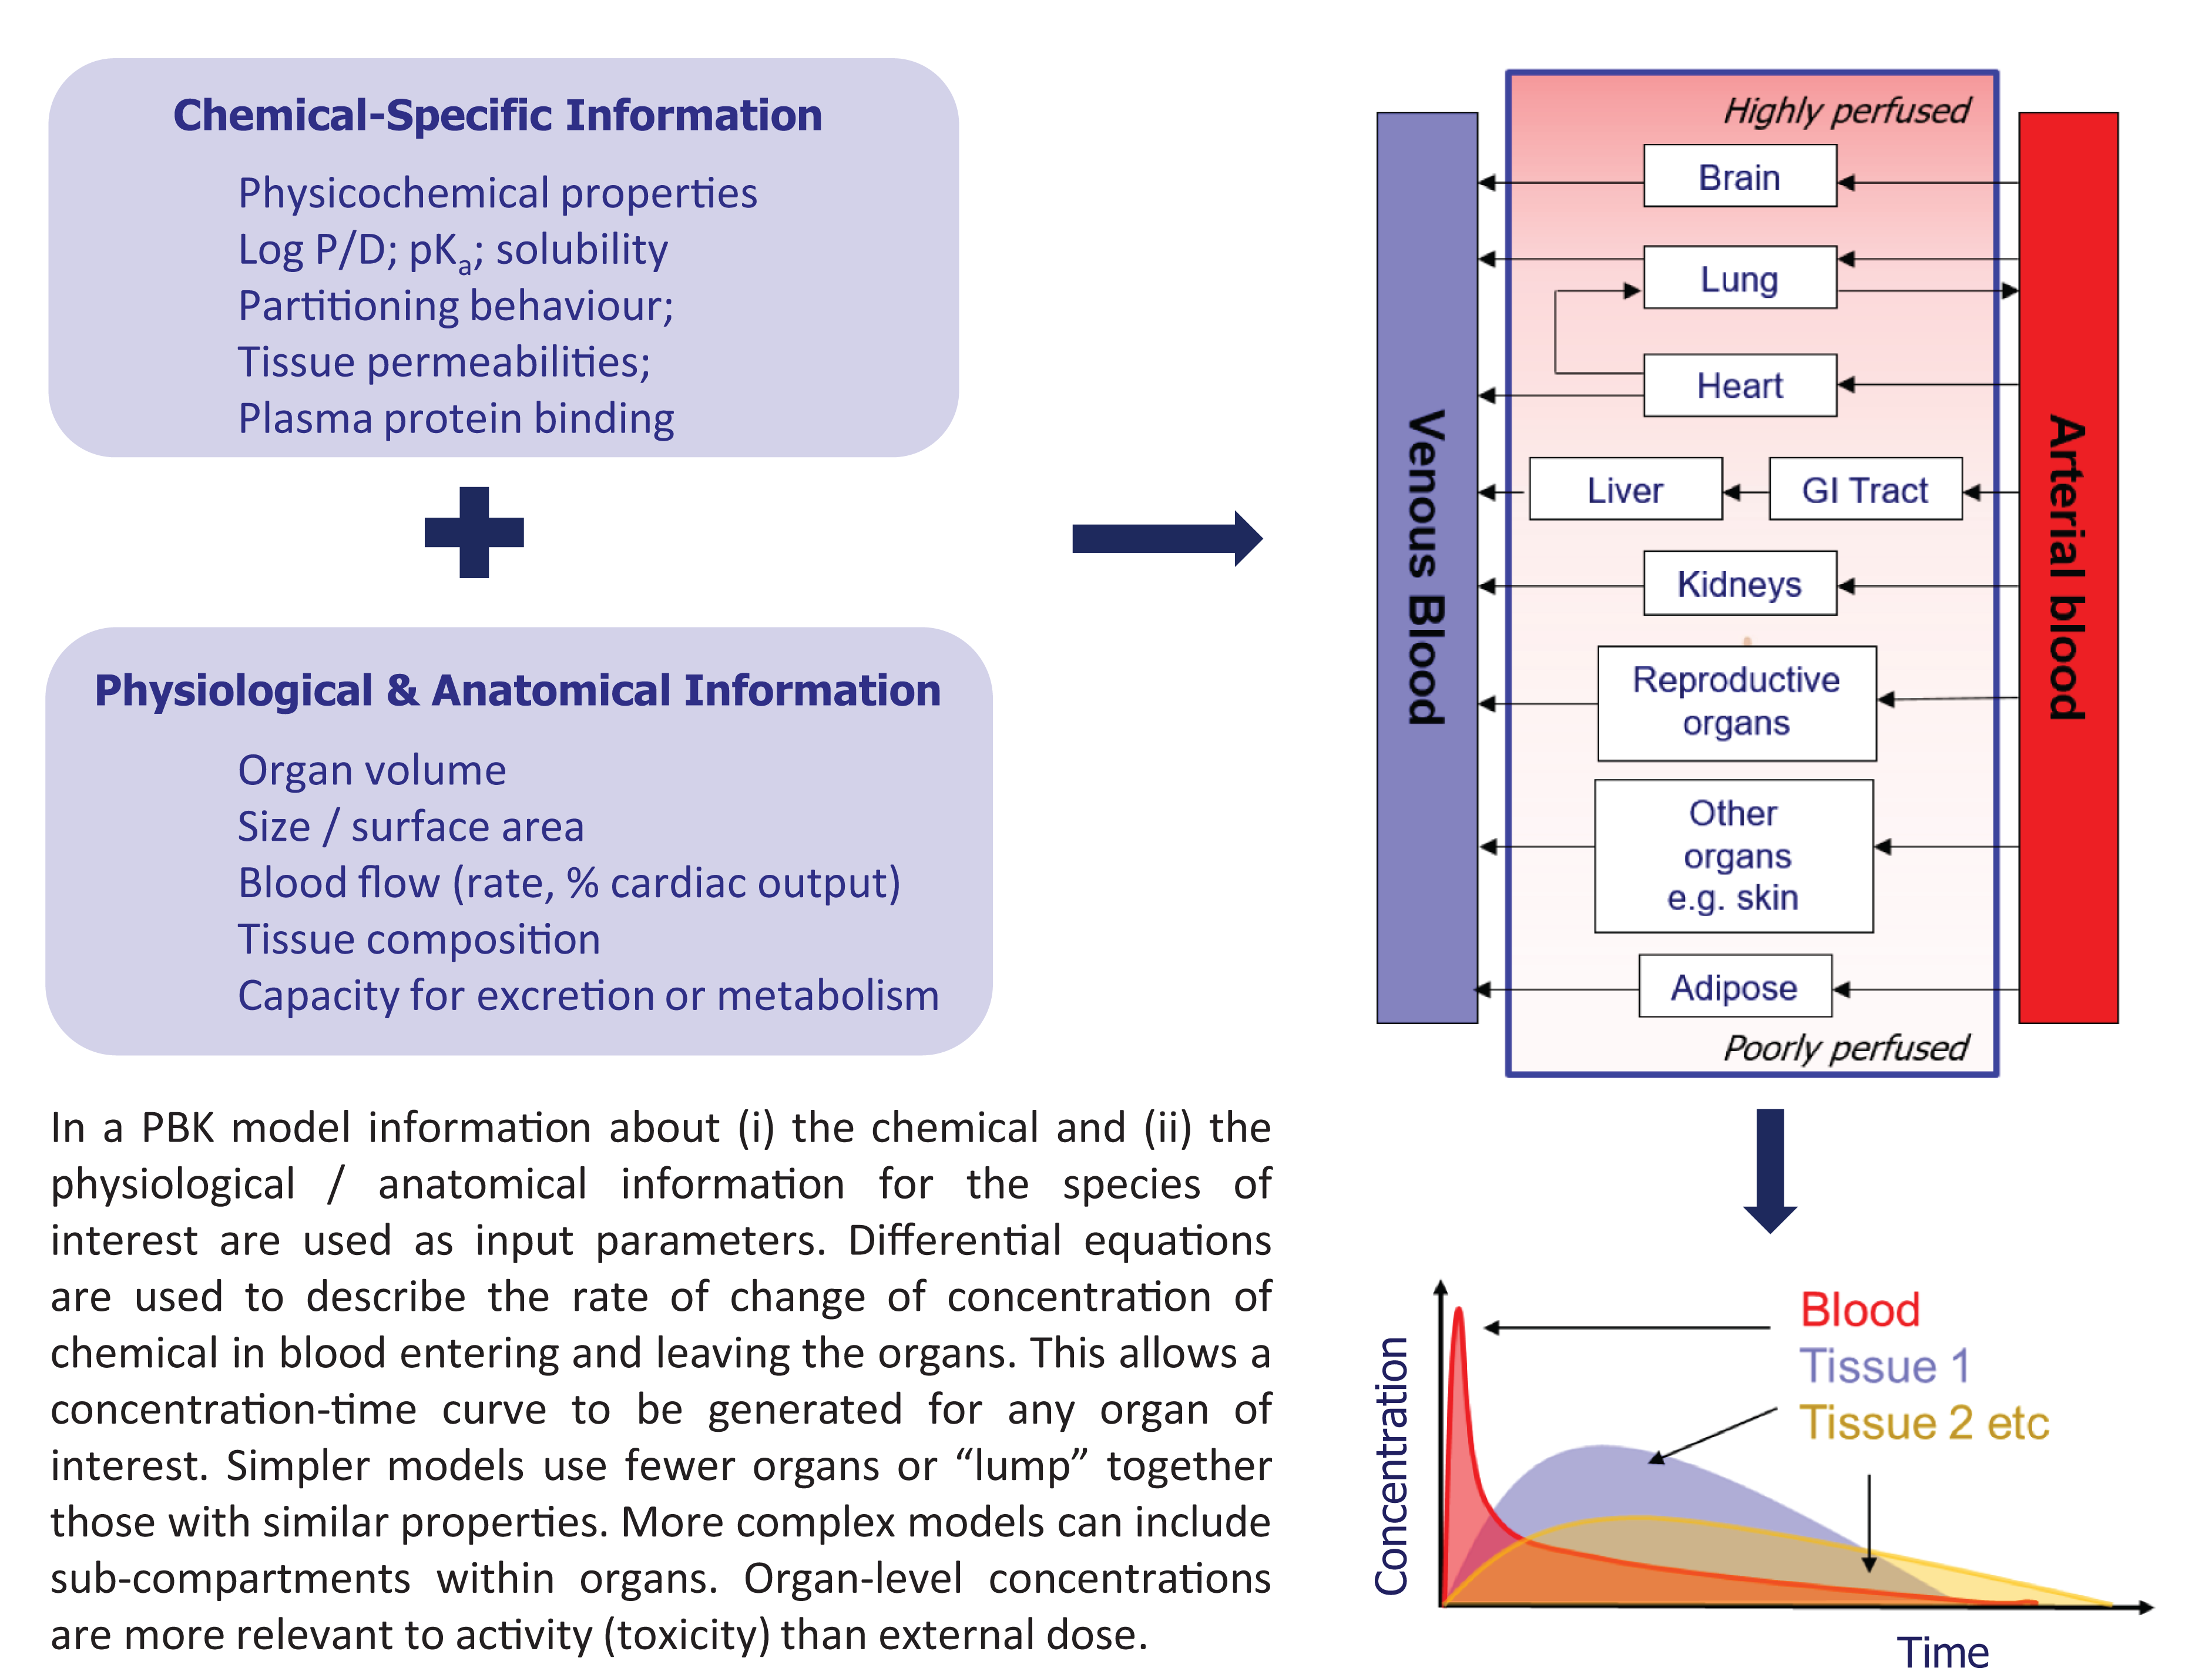
In a PBK model (as depicted in Figure 7) the body is considered as a network of compartments (organs) linked via the blood supply. The amount of chemical entering and leaving the organ over time is calculated by using differential equations from which organ level concentration–time profiles can be generated. Organs may be ‘lumped’ together into classes (e.g. highly perfused or poorly perfused organs are considered as groups) to simplify the modelling, or each individual organ may be considered separately. The models use information on the chemical (e.g. molecular weight, aqueous solubility, lipophilicity, plasma protein binding and tissue:plasma partitioning behaviour) and information on the biological system (e.g. organ weights, volumes, blood flows, capacity for metabolism or excretion). Although data-hungry to generate and evaluate (ideally by using kinetic parameters measured in the species of interest), such models are highly adaptable — e.g. organ volumes/blood flow can be altered to represent different species or members of a population within a species, or metabolic capability can be modified to represent different species, age groups or diseased individuals. Concentration–time profiles based on external exposure can be derived (forward dosimetry), and species-to-species extrapolation or individual-to-individual extrapolation within a species, are both possible.
Key Concepts Box: Physiologically-based (PBK) models.
Reverse dosimetry (dose reconstruction) is the process by which external exposure is derived from observed concentrations in vivo, such as values from biomonitoring data. Quantitative in vitro to in vivo extrapolation (QIVIVE) simulates concentration in the blood (or tissues) to determine the in vivo dose level that results in the concentration in the blood (or tissues) equivalent to the concentration at which an effect was observed in vitro. The area under the concentration–time curve (AUC) or the maximum concentration in the tissue, derived by the models, can be quantitatively correlated with biological response in a pharmacokinetic/pharmacodynamic model.
A description of PBK models, their development and use across industrial sectors, has been reviewed previously,
73,74
and recent applications of PBK modelling in drug development specifically reported.
75
In terms of personalised medicine, the models can account for genetic predisposition, developmental stages, ethnicity, specific disease states and drug–drug interactions. PBK models, therefore, enable dose selection and adjustments to be made that could not be predicted by using other modelling methods. This is of particular importance for paediatric medicine. While there have been many developments in PBK modelling, acceptance and use within the regulatory sector has been limited. Various factors that are contributory to this shortcoming have been suggested, such as: − difficulties in recruiting peer reviewers with appropriate expertise; − lack of confidence in PBK models for which in vivo data are not available for evaluation; − problems of transferability of models across platforms;
76
− lack of dialogue between developers and regulatory users; and − poor consistency in model reporting.
Current collaborations between PBK modellers and risk assessors have resulted in the publication of a harmonised template for reporting PBK models that could assist in decision-making. Such efforts may lead in the future to greater acceptance and uptake of these models. 77
Systems biology
Systems biology approaches explore how a biological entity responds to stimuli. The overall response of the system is the cumulative, integrated output of all of the individual system components. Response may be modulated by prior experience, positive or negative feedback systems and/or compensatory mechanisms. As there are multiple potential interactions, mathematical models are used which comprise: (i) the relevant components of the biological system; (ii) the individual temporal dynamic behaviour of each component; and (iii) the interconnectivity and temporal dynamic interaction between the system components. 78
Quantitative systems pharmacology (QSP) is an application of the systems biology approach, whereby the efficiency of drug discovery and development programmes can be increased by facilitating the modelling of disease pathology, chemical intervention and response. These models, which can incorporate experimental data, simulate the outcome when a biological system is perturbed by the presence of a xenobiotic (e.g. drug candidate) and can provide greater mechanistic insight into the drug–target interaction.
As with any predictive method, the models are devised to represent a part of the system, i.e. they offer a simplified version of the true, complete system. More complex biological endpoints are difficult to model accurately by using such simple models — however, useful information can be obtained if a contributory model is developed and used appropriately. This is an important area for 21st century toxicology, with the prospect of Quantitative Systems Toxicology (QST) potentially providing a platform to integrate various models for toxicodynamics and toxicokinetics. 79
The role of in silico tools in adverse outcome pathways (AOPs)
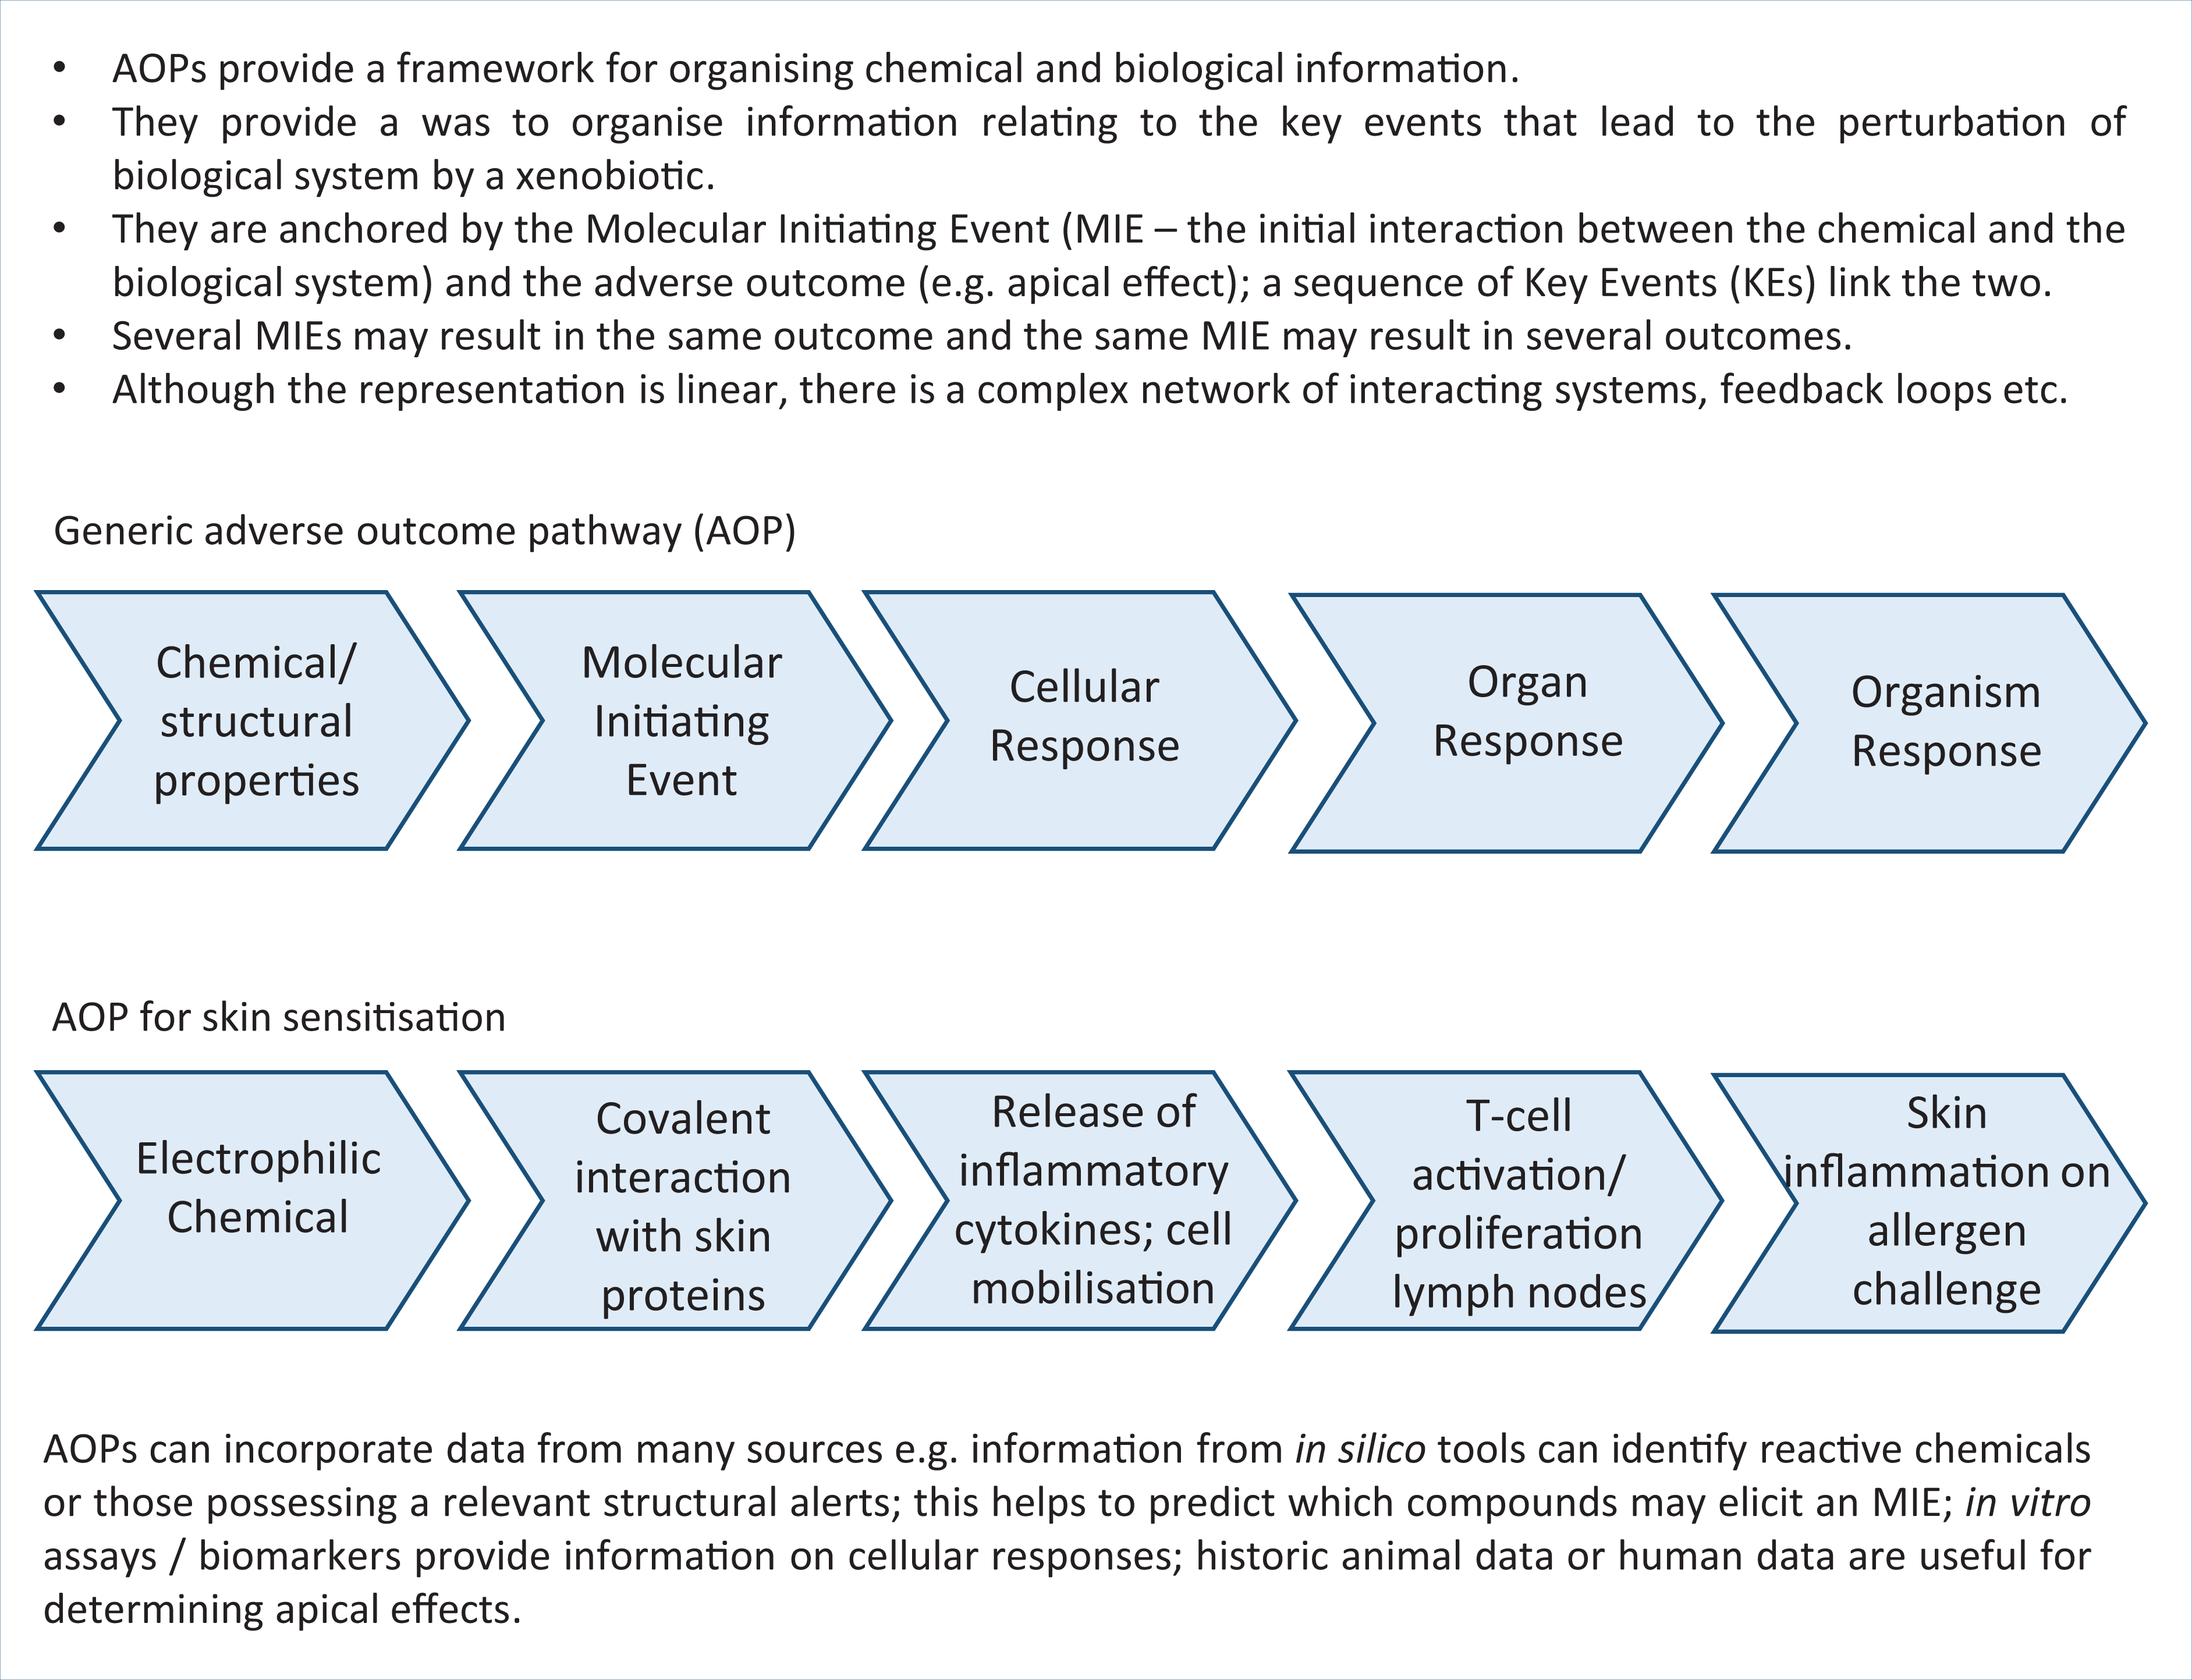
The adverse outcome pathway (AOP) concept is an example of a comprehensive framework that enables knowledge acquired from in silico models, chemoinformatics, bioinformatics, in vitro assays, high-throughput screening, omics technology and biological systems to be fully integrated, and gaps in knowledge identified. AOPs are used to describe the sequence of events from the initial interaction between a chemical stressor and a biological macromolecule (a molecular initiating event (MIE)), through the cascade of biological responses, to the resultant downstream apical effect (the adverse outcome (AO)). The chemical stressor must possess the relevant physico-chemical and/or structural properties. The MIE and the AO are characterised by a chain of Key Events and the relationship between them (KERs). The relevant key concepts are shown in Figure 8, with an outline of the generic structure of an AOP and a specific example how the AOP concept can be applied to skin sensitisation.
Key Concepts Box: A generic adverse outcome pathway (AOP) and a specific example for skin sensitisation.
In silico tools can make significant contributions to developing and understanding AOPs at different stages of the process. At the initial phase, in silico tools can provide information on chemical properties (e.g. solubility, partitioning behaviour, chemical reactivity) that can be sourced from databases and/or predictive models. In silico tools (such as SARs) can be used to identify chemicals with the potential to interact with a biological macromolecule, i.e. its potential to elicit a Molecular Initiating Event (MIE) — which is generally considered to be the primary step in the AOP. Knowledge of the MIE is very powerful in predictive toxicology, and a range of MIEs and the approaches to identifying and understanding the MIE, at a mechanistic level, have been reported in terms of AOP development. 80 For instance, covalent interactions are known to occur between xenobiotic, electrophilic chemicals and nucleophilic groups of biological molecules; interactions with DNA can lead to mutagenicity or interactions with proteins of the skin or lungs can give rise to skin sensitisation or respiratory sensitisation, respectively. 28 –30 SAs, which may be grouped together as profilers (as discussed above), can be used to identify chemicals associated with a specific MIE, thereby providing information regarding the first step in the pathway.
The AOP concept and its applications have been described in detail in a series of OECD Guidance Documents; 81,82 continuing this effort, the OECD launched a programme on the development of AOPs in 2013. The Adverse Outcome Pathway-Knowledge Base (AOP-KB), with associated wiki (https://aopwiki.org/), serves as the repository for AOPs developed as part of the OECD AOP Development Effort by the Extended Advisory Group on Molecular Screening and Toxicogenomics. The wiki, currently hosted by the Society for the Advancement of Adverse Outcome Pathways (SAAOP), lists all registered AOPs and their current developmental status.
Effectopedia (http://www.effectopedia.org/) is an open-knowledge platform to facilitate interdisciplinary collaborations to assist in AOP development. It is designed to enable results from one experiment to be translated across species, chemicals and levels of biological organisation, identifying where further information is required to determine causal links between chemical interaction and biological outcomes, offering visualisation of the elements within an AOP. Humans and animals are usually exposed to mixtures, rather than individual chemicals; AOPs have also been shown to be useful in studying the effects of mixtures in relation to chemical-induced neurotoxicity in developmental stages. 83
As the collection of AOPs develops, these will find increasing use to support the development of QSARs. For instance, Key Event Relationships (KERs) can inform QSAR development; 80 in turn, these KERs can be quantified, should sufficient data be available. This is the basis of quantitative AOPs (qAOPs), which can assist in the prediction of toxicological points of departure, as used in safety assessment. 84 Since AOPs are often criticised for being presented as linear, there is growing interest in developing AOP networks, which are more representative of the underlying biology. For instance, Spinu et al. 85 combined various AOPs for human neurotoxicity to develop an overall network. Cytoscape (available at https://cytoscape.org/) provides a means to capture AOP networks. Analysis of such networks helps to identify the most relevant Key Events, and hence prioritise the development of assays and predictive models. One drawback of AOPs is that, traditionally, there has been greater focus on the steps that lead to an adverse outcome, from a mechanistic perspective, and less focus on the influence of the concentration–time profile of the chemical at the target site. Greater integration of information, such as that derived from PBK modelling, will help to develop a more complete understanding of AOPs and the relationship with internal dose.
Overcoming model limitations and barriers to uptake — Future perspectives
The use of alternatives is well accepted for certain endpoints (for example, mutagenicity, irritancy or skin sensitisation). However, for other, more complex endpoints (such as repeat-dose toxicity or developmental and reproductive toxicity) there are real challenges associated with their use. 86 These particularly complex endpoints are the result of a multitude of interacting processes that are sensitive to the exposure scenario (i.e. substance concentration, exposure duration and timing, etc.), with these processes also varying between species and individuals. While, for animal testing, extrapolations between different exposure scenarios or different species are fraught with inconsistencies (that may or may not be predictable), there is a long history of their use and comfort is derived from keeping to the familiar uncertainties — the ‘known unknowns’. When using combinations of NAMs to make predictions, there is the concern of moving to unfamiliar uncertainties and the ‘unknown unknowns’. Obtaining ever-more detailed information from newly developing alternatives helps to reduce these uncertainties and provide greater confidence in the models and the predictions derived therefrom. The rate at which new technology is advancing and new knowledge is being gained will no doubt alleviate concerns over time.
Twenty years ago, resources such as PubChem and Chemspider did not exist; now data on over 100 million chemicals can be accessed on a mobile phone. Significantly, the past 20 years has also seen many more initiatives to share data, in a range of countries worldwide. For example: − eTOX (http://www.etoxproject.eu/) and eTRANSAFE (https://etransafe.eu/) are examples of a former and a current EU-funded project. In these initiatives, pharmaceutical companies, academia and regulators have worked together to maximise the use of available preclinical data for in silico model building and evaluation. − The EUToxRisk project (https://www.eu-toxrisk.eu/), through multi-partner collaboration, is currently developing methods for safety assessment of chemicals to move away from animal testing to mechanistically-based understanding of cause and effect of chemical toxicity by combining cell biology, omics, systems biology and in silico modelling. − In 2019, a memorandum of the US EPA committed to reducing requests for, and funding of, experiments on mammals by 30% by 2025, with the aim of eliminating these entirely from 2035 (https://www.epa.gov/research/epa-new-approach-methods-efforts-reduce-use-animals-chemical-testing). − A recent Blue Sky Workshop organised by the European Partnership for Alternative Approaches to Animal Testing (EPAA) considered the application of NAMs, strategies for their use, challenges and opportunities. The resulting report provided recommendations for future development of the area, in terms of both scientific research and regulatory policy.
2
− The Accelerating the Pace of Chemical Risk Assessment (APCRA) initiative, involving collaborations between ECHA, US EPA and Health Canada, specifically aims to identify what is required to enable the application and acceptance of NAMs in the regulatory sector. − The “strategic roadmap for establishing new approaches to evaluate the safety of chemicals and medical products in the United States”, published by ICCVAM (Interagency Coordinating Committee on the Validation of Alternative Methods), was developed from the views of 16 Federal Agencies, working groups and the public. It highlights the disparity between the rate at which NAMs are being developed and the impact that they currently have in improving prediction of effects in humans. The roadmap sets out three strategic goals for addressing this disparity: (i) connecting end users with developers of NAMs; (ii) fostering the use of efficient, flexible, and robust practices to establish confidence in new methods; and (iii) encouraging the adoption and use of new methods and approaches by Federal Agencies and regulated industries.
87
Initiatives like these will help to overcome barriers to the acceptance of evidence-based NAMs in the future, and may open the debate on how best to apply information from developing methods such as the newer applications of artificial intelligence and machine learning techniques. Recently, a framework has been published that provides a consistent set of criteria by which the fitness-for-purpose of any NAM could be evaluated. The framework comprises three steps: (i) determining the context of use (prioritisation, hazard screening or risk assessment); (ii) ensuring consideration of the core principles (accuracy, transparency, understanding limitations and domain of applicability); and (iii) evaluating criteria that are relevant to the fitness for a given purpose. The universally applicable criteria were developed in collaboration with stakeholders from industry, academia and the regulatory sector, with the aim of encouraging the development of NAMs and increasing confidence in their use in regulatory contexts. 88 This demonstrates commitment to overcoming the barriers to the use of alternatives at the global level. Ongoing dialogue between researchers, model developers, industry and regulators will help to overcome hesitancy, as will the technological developments that will enhance the capabilities of alternatives.
Conclusions
The above narrative has outlined the principles and numerous applications of in silico tools to predict activity, toxicity and ADME properties. Evidently, these are widely used across many industries, from product development through to safety assessment and regulatory submissions. Tools range from databases, read-across and (Q)SARs, to predictive software and complex machine learning algorithms. Some methods are simple and intuitive, while others require much more expertise to develop and use. Recent efforts have been directed towards developing more transparent, mechanistically-driven models. The key to modelling, to quote a common aphorism, is to ensure that the model is as simple as possible, but no simpler. Looking to the future, access to the vast amount of data being produced, the development of new technologies, and the use of all available tools, in combination, will drive forward the replacement of animal tests with scientifically-justified, mechanistically-interpretable and species-relevant alternative methods.
Footnotes
Declaration of conflicting interests
The author(s) declared no potential conflicts of interest with respect to the research, authorship, and/or publication of this article.
Funding
The author(s) received no financial support for the research, authorship, and/or publication of this article.