
Abstract
Background
Growing evidence suggests positive association between sodium intake and the risk of obesity. Evidence on this topic is lacking from Finland, despite the population's historically high sodium intake and long-standing national salt reduction initiatives.
Aims
To examine whether sodium intake and spot urine sodium concentration are associated with general or abdominal obesity in Finnish adults.
Methods
We used cross-sectional, population-based data of the National FinHealth 2017 Study (men=2222, women=2792, ≥18 years-old). Sodium intake was estimated using a validated food frequency questionnaire. A subsample of participants provided spot urine samples (men=558; women=702). General and abdominal obesity were assessed using body mass index and waist circumference. Associations on sex-specific quartiles were examined using multinomial logistic regression, adjusting for key sociodemographic and lifestyle confounders. Spot urine samples were validated against 24-h urine collections.
Results
Women in the highest quartile of sodium intake had higher odds of general obesity (OR 4.30, 95% CI 2.60–7.12) and abdominal obesity (OR 3.42, 95% CI 2.11–5.56) compared with the lowest quartile. Men in the highest quartile of urine sodium concentration had higher odds of general obesity (OR 6.05, 95% CI 2.83–12.93) and abdominal obesity (OR 4.68, 95% CI 2.44–8.96) compared with the lowest quartile. Spot urine samples showed moderate agreement with 24-h urine collections, with a Spearman's rho of 0.45.
Conclusion
In this cross-sectional analysis, higher dietary sodium intake and urine sodium concentration were associated with higher odds of general and abdominal obesity. Prospective studies are needed to confirm causality and to better understand underlying biological mechanisms.
Introduction
High sodium intake and obesity are both significant global health risks, contributing to increased mortality and a burden of disease worldwide. In 2021, high sodium intake was estimated to contribute for 1.8 million premature deaths and 41 million additional disability-adjusted life years (DALYs) globally (Institute for Health Metrics and Evaluation, 2024). Similarly, obesity is projected to increase DALYs by nearly 40% from 2020 to 2030 (Chong et al., 2023), increasing the prevalence of chronic diseases and reducing the quality of life (WHO, 2025). The WHO set a target to reduce sodium intake by one-third by 2025 (WHO, 2022). While formal evaluation data are not yet available, existing progress report indicate that the target is unlikely to be met (WHO, 2023).
The direct association between sodium intake and cardiovascular diseases is well-established, primarily mediated through elevated blood pressure (Campbell et al., 2023). Obesity may further modify or mediate this relationship, as excess adiposity is associated with increased salt sensitivity and altered renal sodium handling (Watso et al., 2023). Growing evidence also suggests that sodium intake may be independently associated with overweight and obesity. Among anthropometric measures, body mass index (BMI) and waist circumference (WC) have shown the most consistent associations with sodium intake (Elfassy et al., 2018; Lee et al., 2018; Moosavian et al., 2017; Navia et al., 2014; Yi et al., 2015; Zhang et al., 2018; Zhao et al., 2019; Zhou et al., 2019). However, most available evidence is derived from cross-sectional studies, whereas longitudinal and prospective data remain limited. According to prevailing hypotheses from observational and experimental studies, prolonged exposure to high sodium intake may lead to metabolic changes, potentially affecting body composition and weight regulation (Ma et al., 2015; Navia et al., 2014; Yi et al., 2015; Zhao et al., 2019). This underlying biological mechanism has been observed in animal models (Dobrian et al., 2003; Lanaspa et al., 2018), but also in human studies (Wu et al., 2023).
In Finland, mean sodium intake significantly declined during the 1970s–1980s through the North Karelia Project and other public health initiatives (Laatikainen et al., 2016), but has since plateaued at levels well above the WHO recommendation of 5 g/day (Kaartinen et al., 2021). During the same period, obesity prevalence has risen significantly, reaching nearly 30% among adults, with slightly higher prevalence observed in men than in women (Sääksjärvi et al., 2025). Sodium intake also remains sex-specific in Finland (Valsta et al., 2018), yet its association with obesity has not been previously examined in this population. Understanding this association in the national context supports the development of more effective prevention strategies both at the individual and population level and lays the foundation for further mechanistic research. In this population-based cross-sectional study of Finnish adults, we aimed to examine the association between sodium intake and obesity using two complementary exposure measures (food frequency questionnaire-based sodium intake and spot urine sodium concentration) and two obesity outcomes (general and abdominal obesity). Given known sex differences in dietary patterns, sodium intake, and obesity prevalence, sex-specific analyses were performed to allow detection of potential differences between men and women.
Materials and methods
Participants
FinHealth 2017 is a national cross-sectional population-based study, which was conducted with the aim of producing information on the health, well-being and functional capacity of the Finnish adult population (Borodulin and Sääksjärvi, 2019). The study included a nationally representative sample of adults aged 18 years and older (n = 10 247), of whom 58.1% (n = 5952) participated in a thorough health examination on 50 study sites across Finland. During the health examination, various tests, biological samples and anthropometric measurements were taken from participants. The participants also filled out several questionnaires. Details on materials and protocols used in the FinHealth 2017 survey have been previously published (Borodulin and Sääksjärvi, 2019).
Data collection
Dietary data. Information about habitual food intake was collected using a food frequency questionnaire (FFQ) developed for and validated in the Finnish adult population (Kaartinen et al., 2012; Männistö et al., 1996; Paalanen et al., 2006). All participants attending the health examination were asked to describe their habitual diet over the past 12 months by filling out the FFQ form, which listed 134 foods, mixed dishes and alcoholic beverages commonly used in Finland. Average use of foods and products in predefined, sex-specific portion sizes were recorded by selecting from 10 frequency categories ranging from “never” to “at least six times a day.” Average daily intake of food groups, energy and nutrients (including sodium intake) were calculated using the Finnish Food Composition Database (Fineli®) and in-house software. The FFQ form was given for the participants at the health examination to be filled later at home on paper or electronically, and instructions for answering were reviewed together with trained study personnel. From all participants attending the health examination, altogether 86% (n = 5125) returned an acceptable FFQ (Borodulin and Sääksjärvi, 2019). Sodium intake was available both as salt (mg/day) and as sodium (mg/day). In this study, analyses were performed using sodium variable without conversion.
Urine collection. A specific spot urine subsample consisted of participants aged 25–74 years old (n = 2802), of which 1546 participants provided a random spot urine sample (Borodulin and Sääksjärvi, 2019). Of these participants, 1275 also had an accepted FFQ. The spot urine sample was collected on-site during the health examination. In the invitation letter, the study participants were instructed to fast for at least 4 h prior to the examination. Collection time varied between 07:30 and 18:00 on weekdays. Previous urination time was not recorded. Urine samples were mixed and aliquoted into 1 ml cryo-tubes after sample administration, following a freezing procedure at −20 °C in the study site immediately after sample processing.
In addition to spot urine collection, a 24-h urine sample collection was carried out. This sample consisted of those belonging to the spot urine sample in preselected study sites (Borodulin and Sääksjärvi, 2019). Of this 24-h urine subsample (n = 1546), 380 participants provided an acceptable sample. Participants were instructed on the collection protocol and received written instruction with a urine collection diary. The 24-h urine collection was performed on Sunday and the canister was returned to study site on Monday morning. The contents of the returned urine canisters were first measured and mixed, after which storage samples were aliquoted and frozen in −20 °C immediately after the handling (Borodulin and Sääksjärvi, 2019). Of the eligible participants, 315 had both 24-h collection and spot urine collection available.
Anthropometric measurements. All anthropometric measurements were performed by trained study personnel according to the standardized European Health Examination Survey protocols (Tolonen, 2016). Height and weight were measured in a standing position without shoes in light indoor clothing with a stabilized and regularly calibrated stadiometer and a bioimpedance scale (Tanita DC-430-MA). For those participants whose weight could not be measured with a bioimpedance scale due to pregnancy, a cardiac pacemaker or another electric device, or metal parts in the body, a digital floor scale (Seca 877) was used. Height was determined to the nearest 0.1 cm and weight to the nearest 0.1 kg. BMI was calculated by dividing weight (kg) by the square of height (m). WC was measured on bare skin or in light underwear using a plastic measuring tape placed horizontally to the midway between the lower rib margin and the iliac crest (Borodulin and Sääksjärvi, 2019). For this study, cut-off values for general and abdominal obesity were based on established international guidelines. Overweight was defined as BMI of 25.0–29.9 kg/m2 and obesity as BMI ≥30.0 kg/m2, according to WHO criteria (WHO, 2025). Waist circumference was categorized into moderate- and high-risk abdominal obesity using commonly applied thresholds: ≥94 cm for men and ≥80 cm for women (IDF European cut-offs) to indicate moderate risk, and ≥102 cm for men and ≥88 cm for women (ATP III cut-offs) to indicate high risk (Alberti et al., 2006).
Sociodemographic and lifestyle data. Age and sex were derived from the national population register-based sampling frame of the FinHealth 2017 Study. Education was categorized into tertiles (low, middle and high) by sex and birth year based on years of full-time studies. Smoking status was categorized to never-smokers, current smokers and ex-smokers. Leisure-time physical activity was categorized as inactive, moderately active, or highly active based on self-reported leisure-time activities, where inactivity reflected predominantly sedentary behaviors, moderate activity included regular walking or cycling, and high activity reflected frequent participation in strenuous or competitive sports. The exact answer options regarding sociodemographic and lifestyle background information can be found in the FinHealth 2017 Study methodology report (Borodulin and Sääksjärvi, 2019).
Analytical sample
Inclusion and exclusion criteria for the present study are presented in Figure 1. From the total amount of returned FFQ's (n = 5302), we excluded blank or incompletely filled FFQ's (n = 110) and duplicate FFQ's (n = 9; only the first FFQ filled in by the participant was retained). In addition, participants who withdraw their consent were excluded (n = 7). To consider extremely implausible habitual food consumption, we excluded 0.5% of the participants at both ends of the total energy intake distributions for men and women separately (n = 51). Those participants who had missing anthropometric data for either BMI or WC were excluded from the analysis (n = 81). In addition, pregnant participants (n = 30) were excluded, as pregnancy increases both BMI and WC. Spot urine samples that were not eligible for laboratory analyses due to the sample being too small in liquid volume, frozen before sample administration, gross hematuria or delayed testing were not used in the analysis (n = 15). Finally, we used two analytical samples; the FFQ sample (n = 5014) and the spot urine sample (n = 1260).
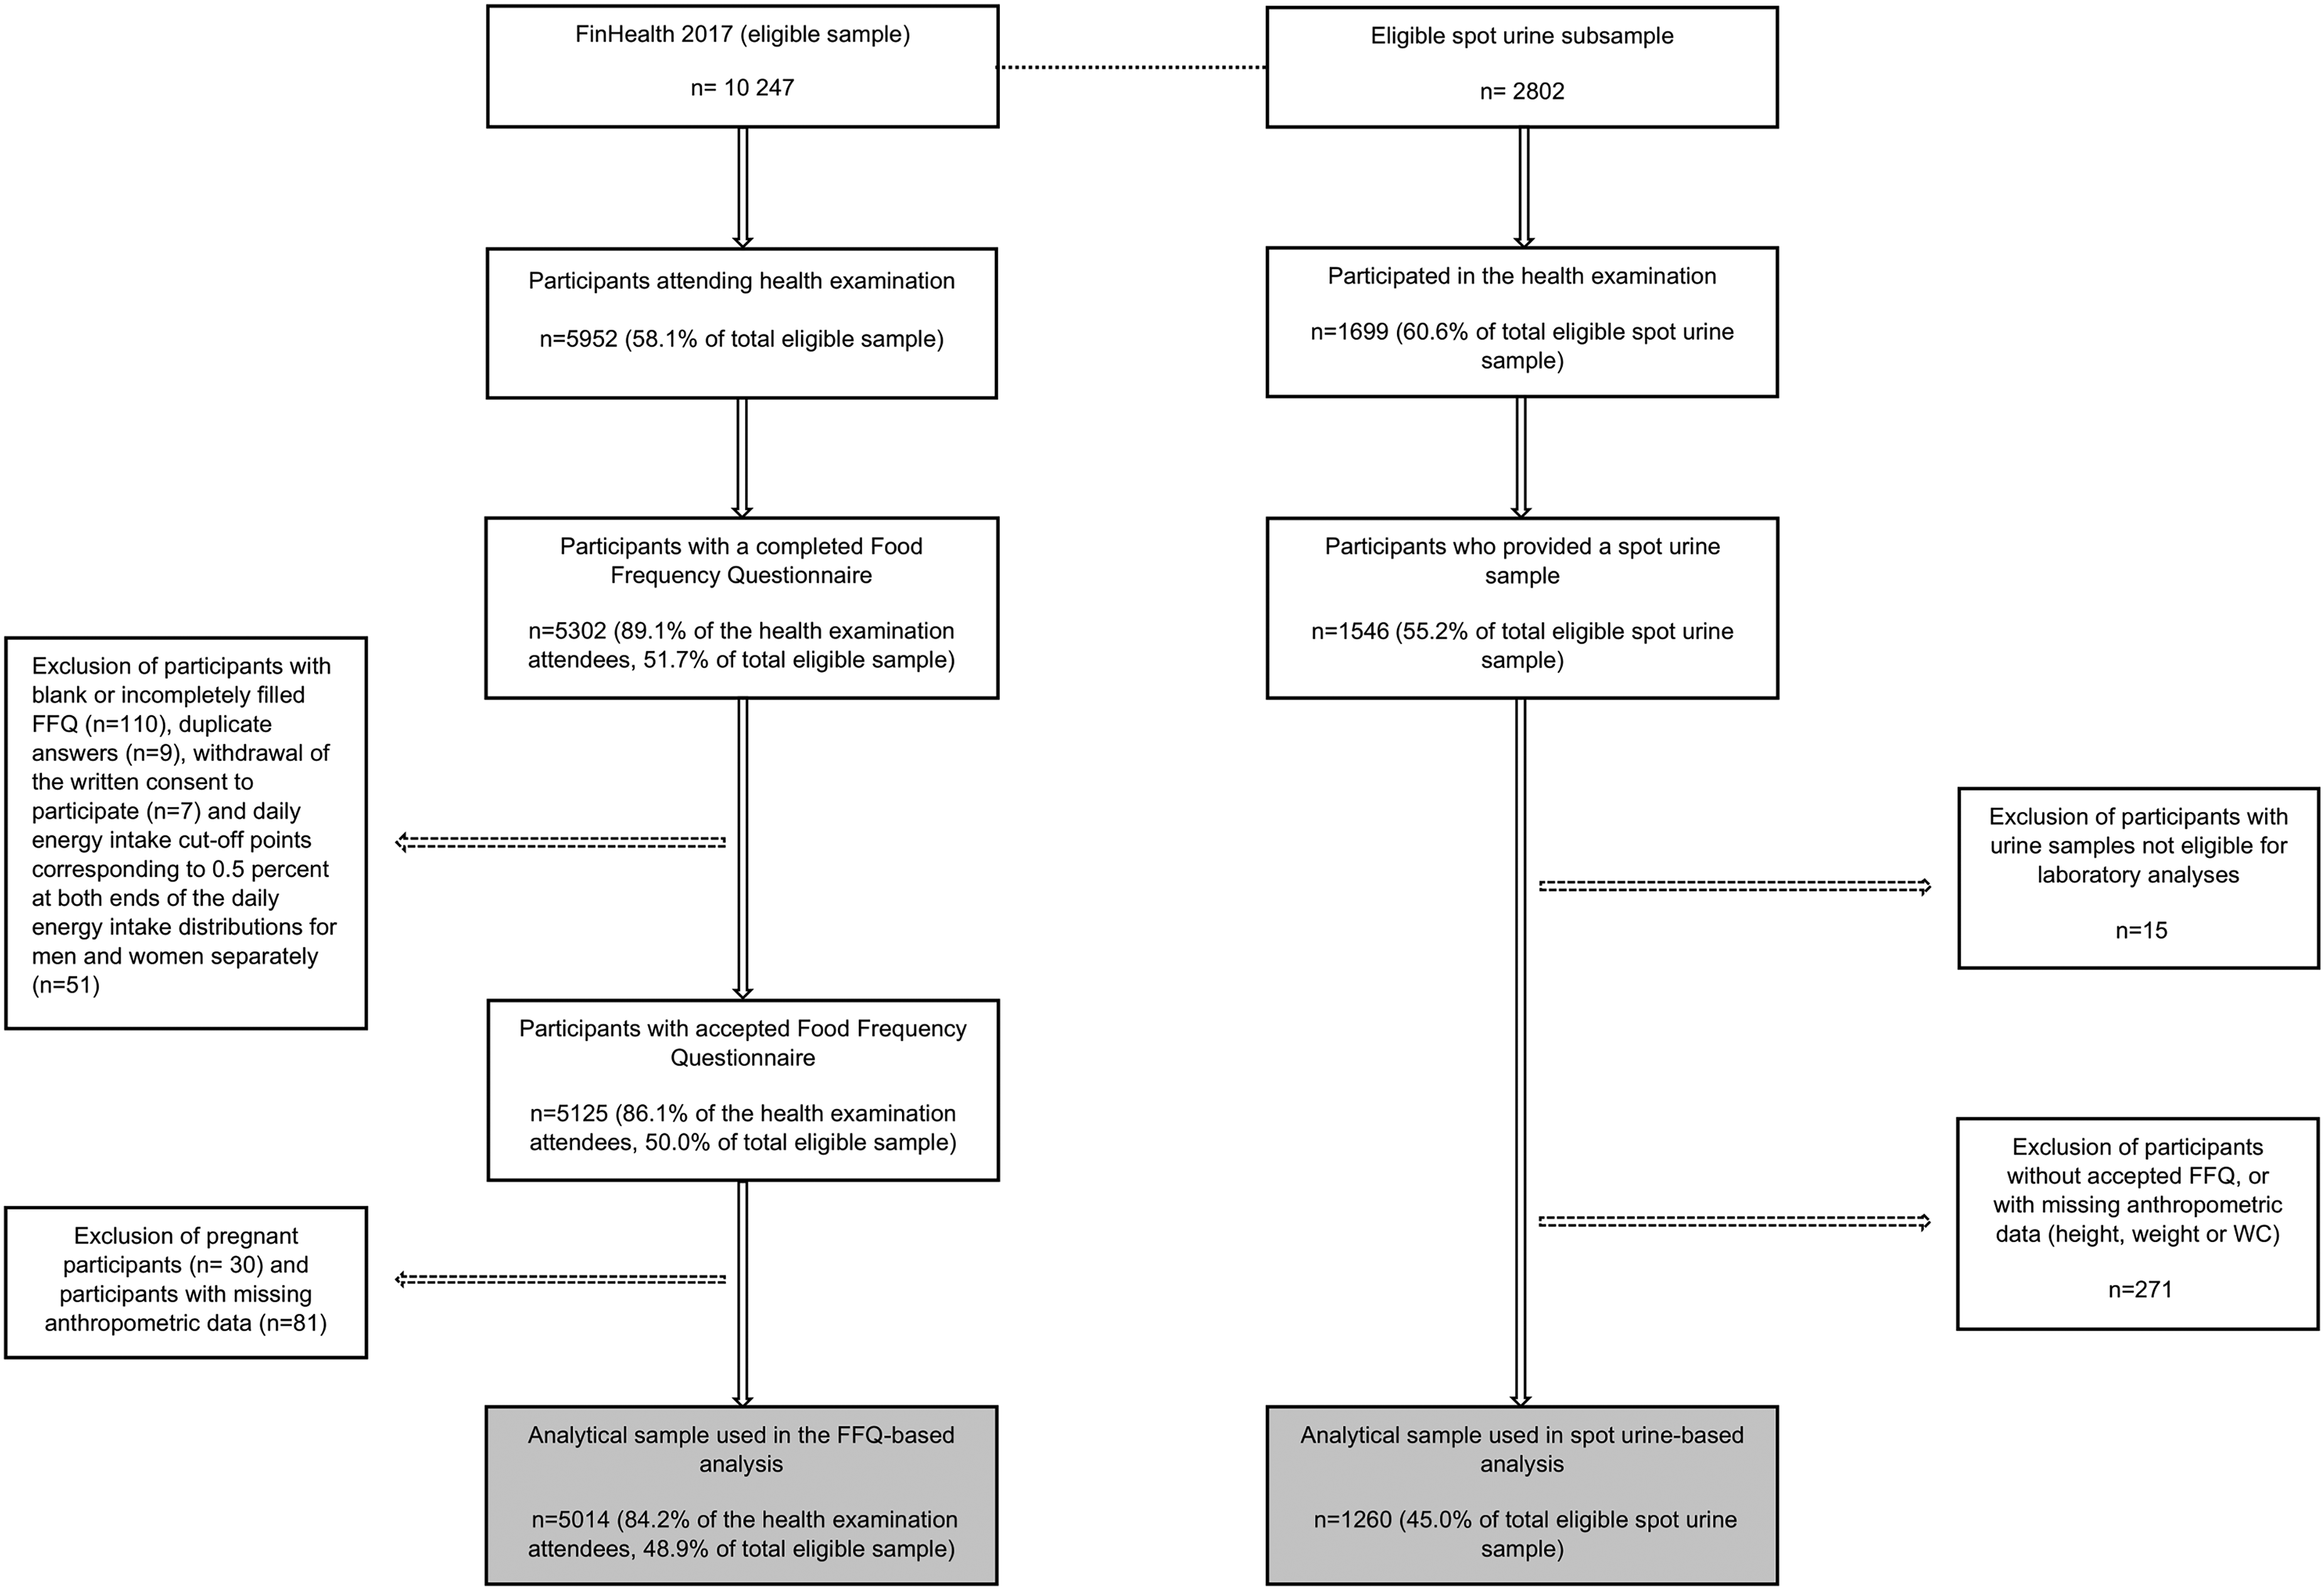
Flow chart of inclusion and exclusion of participants.
Statistical analyses
All analyses were stratified by sex due to the differences in sodium intake, general food consumption habits and dietary patterns between men and women (Valsta et al., 2022). The distribution of continuous variables was assessed for normality. Parametric tests were applied to normally distributed variables, and non-parametric tests (Spearman's rho) were used otherwise. Sex differences were tested using t-tests for continuous variables (age, BMI, blood pressure, dietary factors, sodium) and χ2 test for categorical variables (education level, BMI, lifestyle-factors). Finally, multinomial logistic regression was performed to evaluate the associations between dietary sodium intake and urine sodium concentration with general obesity (BMI) and abdominal obesity (WC). The analyses were carried out independently for both the FFQ sample and the spot urine sample. Sodium intake and spot urine sodium concentration were used as categorical (quartile division) independent variables in regression models and as continuous variables in linear validity analyses. The lowest quartile (Q1) of sodium intake/spot urine concentration was used as the reference group. Regarding anthropometric outcome variables, underweight/normal weight category (BMI <25 kg/m2) and normal WC (<94 cm for men, <80 cm for women) were used as reference categories for the outcome variable in the multinomial logistic regression. Analyses were performed using three different models to separate the confounding effects of age, energy intake, and the most common lifestyle-related factors on the results. Model 1 was adjusted for age, Model 2 was adjusted for age and total energy intake, and Model 3 was adjusted for age, total energy intake, alcohol intake, educational level, smoking status and leisure-time physical activity.
To substantiate the validity of spot urine samples as an indicator of sodium intake in this study, we performed validity and agreement analyses using scatter plot, Spearman's correlation coefficient, and a frequency-based cross-classification comparison against 24-h urine samples among the same participants.
To assess robustness of the results, sensitivity analyses were performed for the analytical FFQ sample in Model 3 after excluding energy under-reporters from the data. Energy under-reporting was defined by using a Goldberg cut-off value of ≤1.14 for the ratio between reported energy intake and predicted basal metabolic rate (Goldberg et al., 1991). For women, sensitivity analyses were performed by repeating the same multinomial logistic regression analysis as in the primary analyses after removing energy under-reporters. As the proportion of energy under-reporters was high in men and most under-reporters were in the lowest or second lowest quartile of sodium intake, outcome variable groups were merged (underweight/normal weight vs. overweight/obesity). Therefore, for men, sensitivity analyses were performed by using binary logistic regression. All analyses were performed using IBM SPSS Statistics, version 29.0.2.0.
Results
Table 1 presents sex-specific descriptive characteristics of the study population. Mean dietary sodium intake and spot urine sodium concentration were higher among men than women, whereas women had a higher prevalence of high-risk abdominal obesity. The prevalence of general obesity was 25% in both sexes, while high-risk abdominal obesity was observed in 37% of men and 49% of women. Approximately 29% of participants had neither general nor abdominal obesity. Energy under-reporting was more common among men than women (41% vs. 36%). There were no statistically significant differences in mean age or educational level between men and women. BMI, waist circumference, and most dietary and lifestyle factors differed significantly by sex, with the exception of absolute dietary fiber intake. Women comprised 56% of the sample and men 44%.
Basic characteristics of participants by sex; means (SD) or percentages.
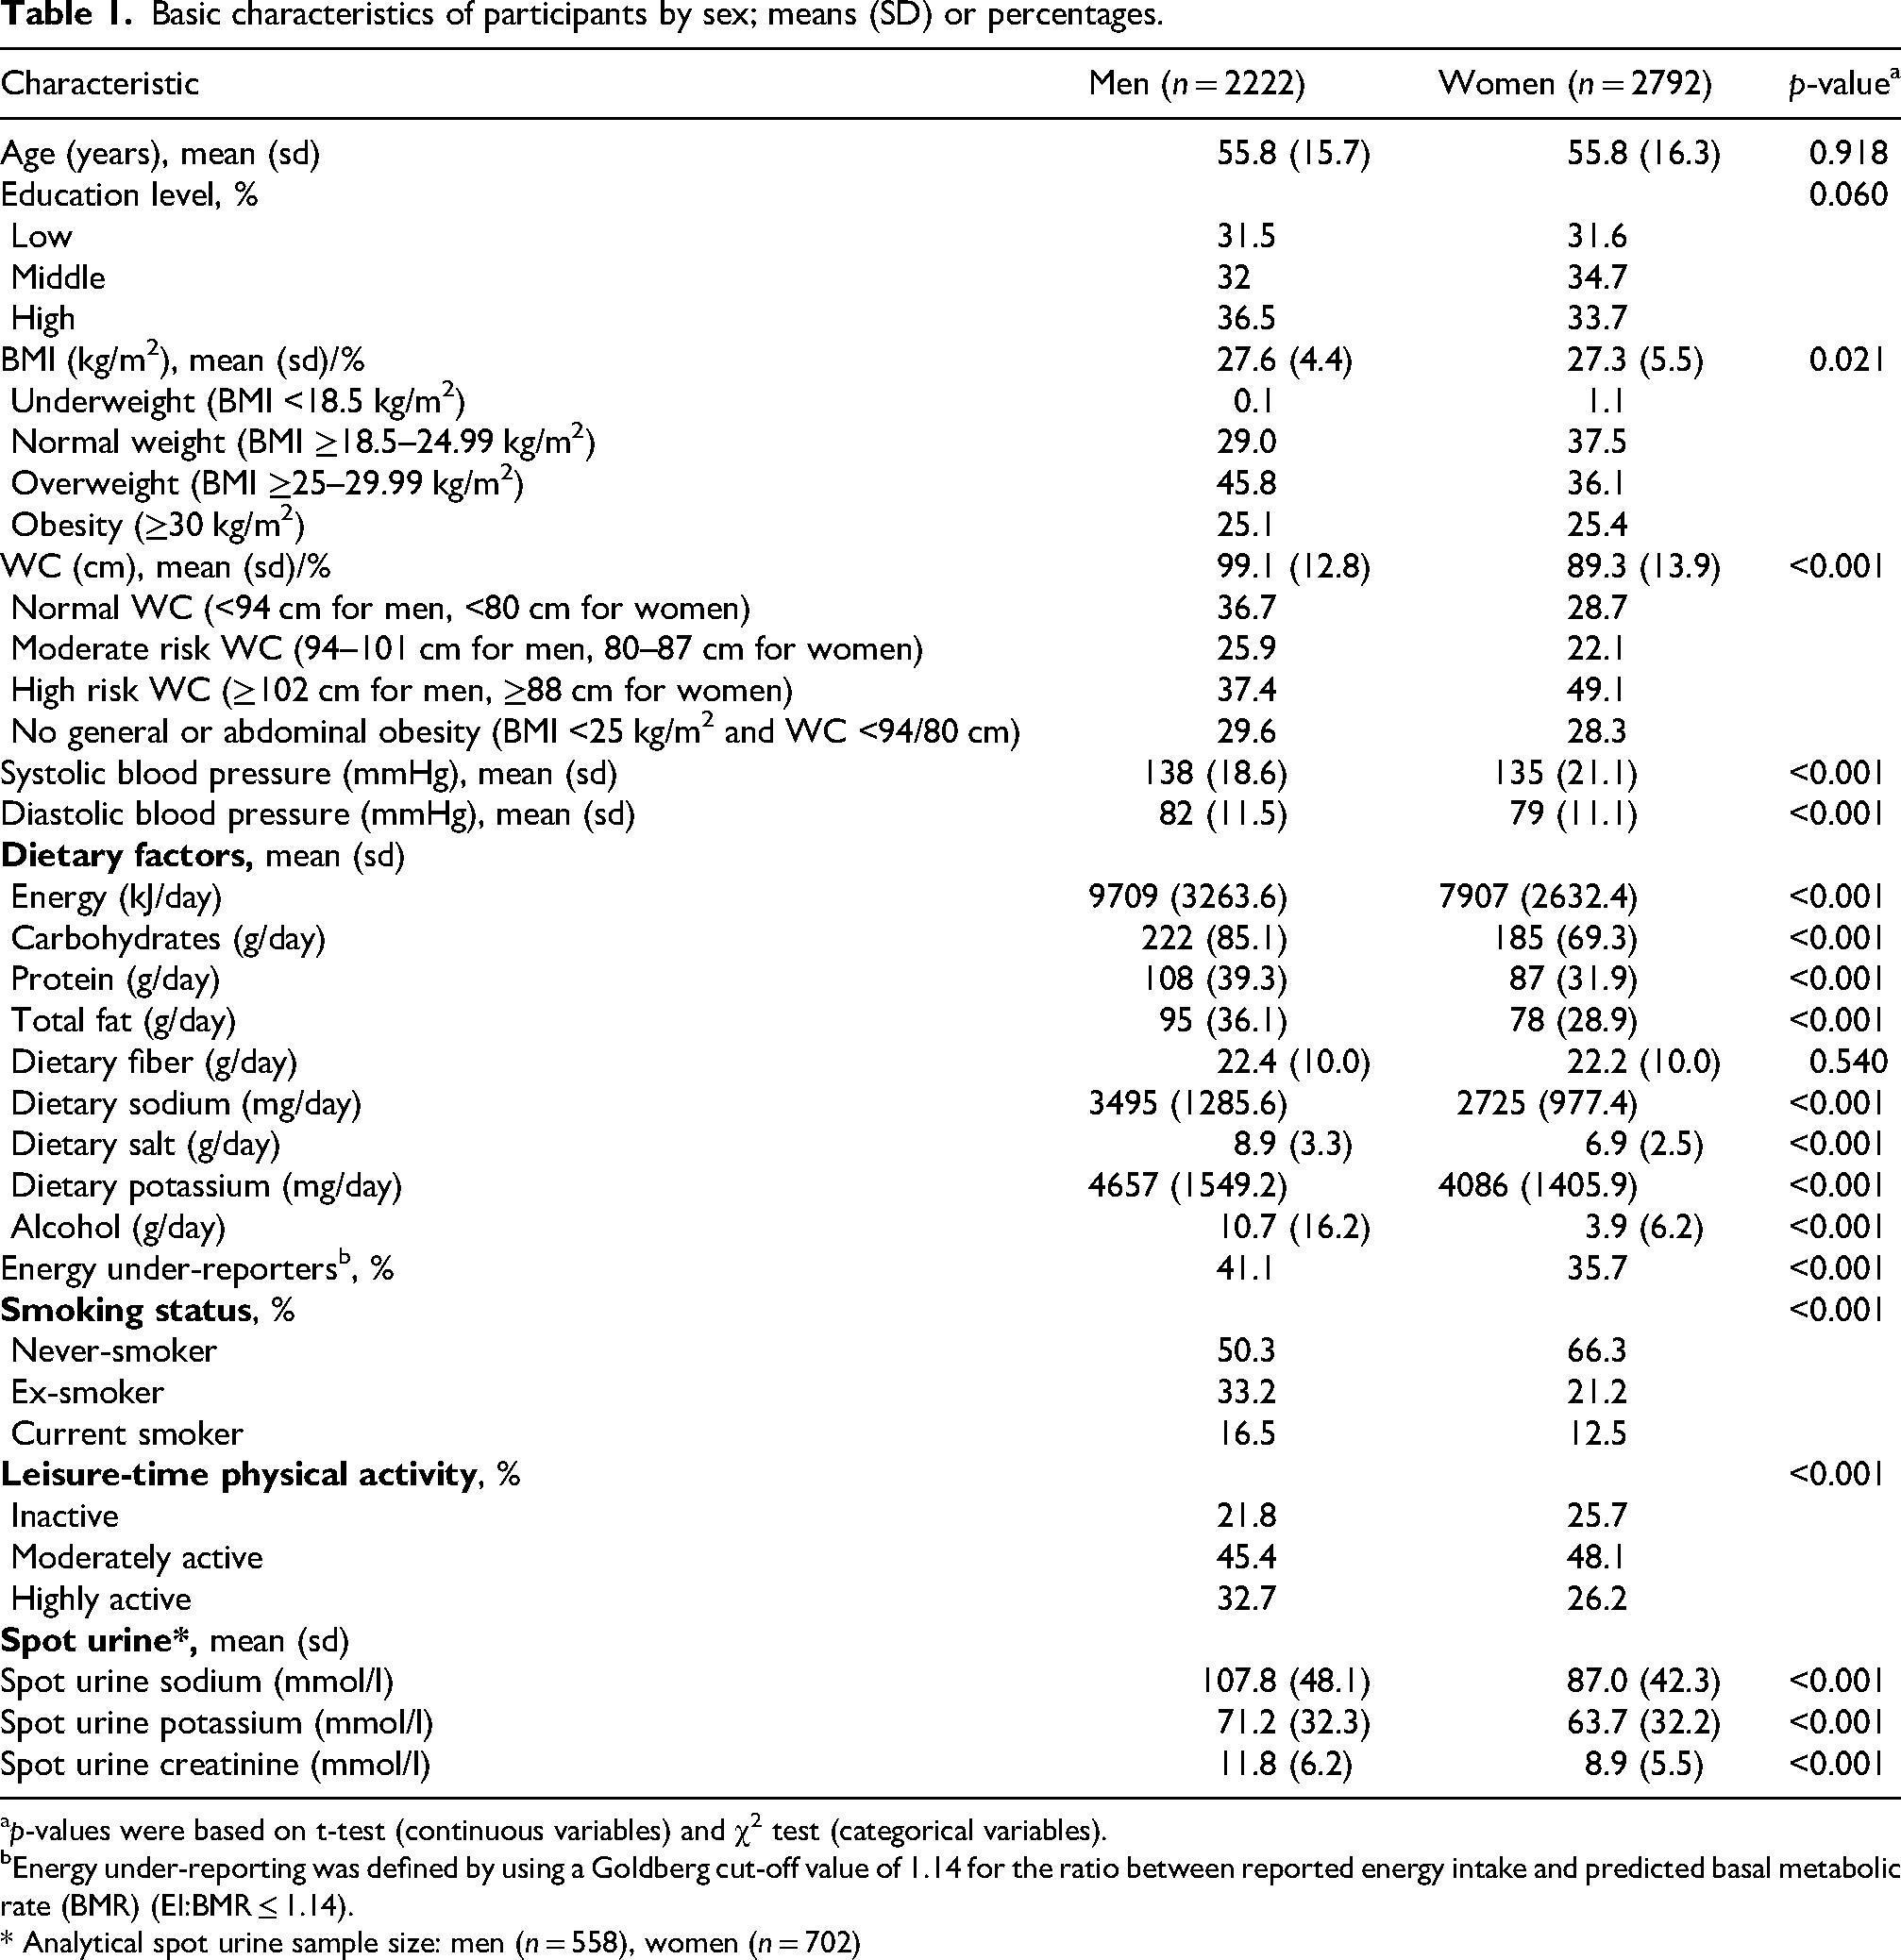
p-values were based on t-test (continuous variables) and χ2 test (categorical variables).
Energy under-reporting was defined by using a Goldberg cut-off value of 1.14 for the ratio between reported energy intake and predicted basal metabolic rate (BMR) (EI:BMR ≤ 1.14).
* Analytical spot urine sample size: men (n = 558), women (n = 702)
The mean sodium intake was 3495 mg/day in men and 2725 mg/day in women. The median difference in dietary sodium intake between the lowest and highest quartiles was approximately 2.3-fold in women and men. The quartile medians and ranges are reported in Tables 2 and 3.
Odds ratios (ORs) for having overweight (BMI 25.0–29.9 kg/m2) or obesity (BMI ≥30 kg/m2) according to dietary sodium intake and spot urine sodium concentration.
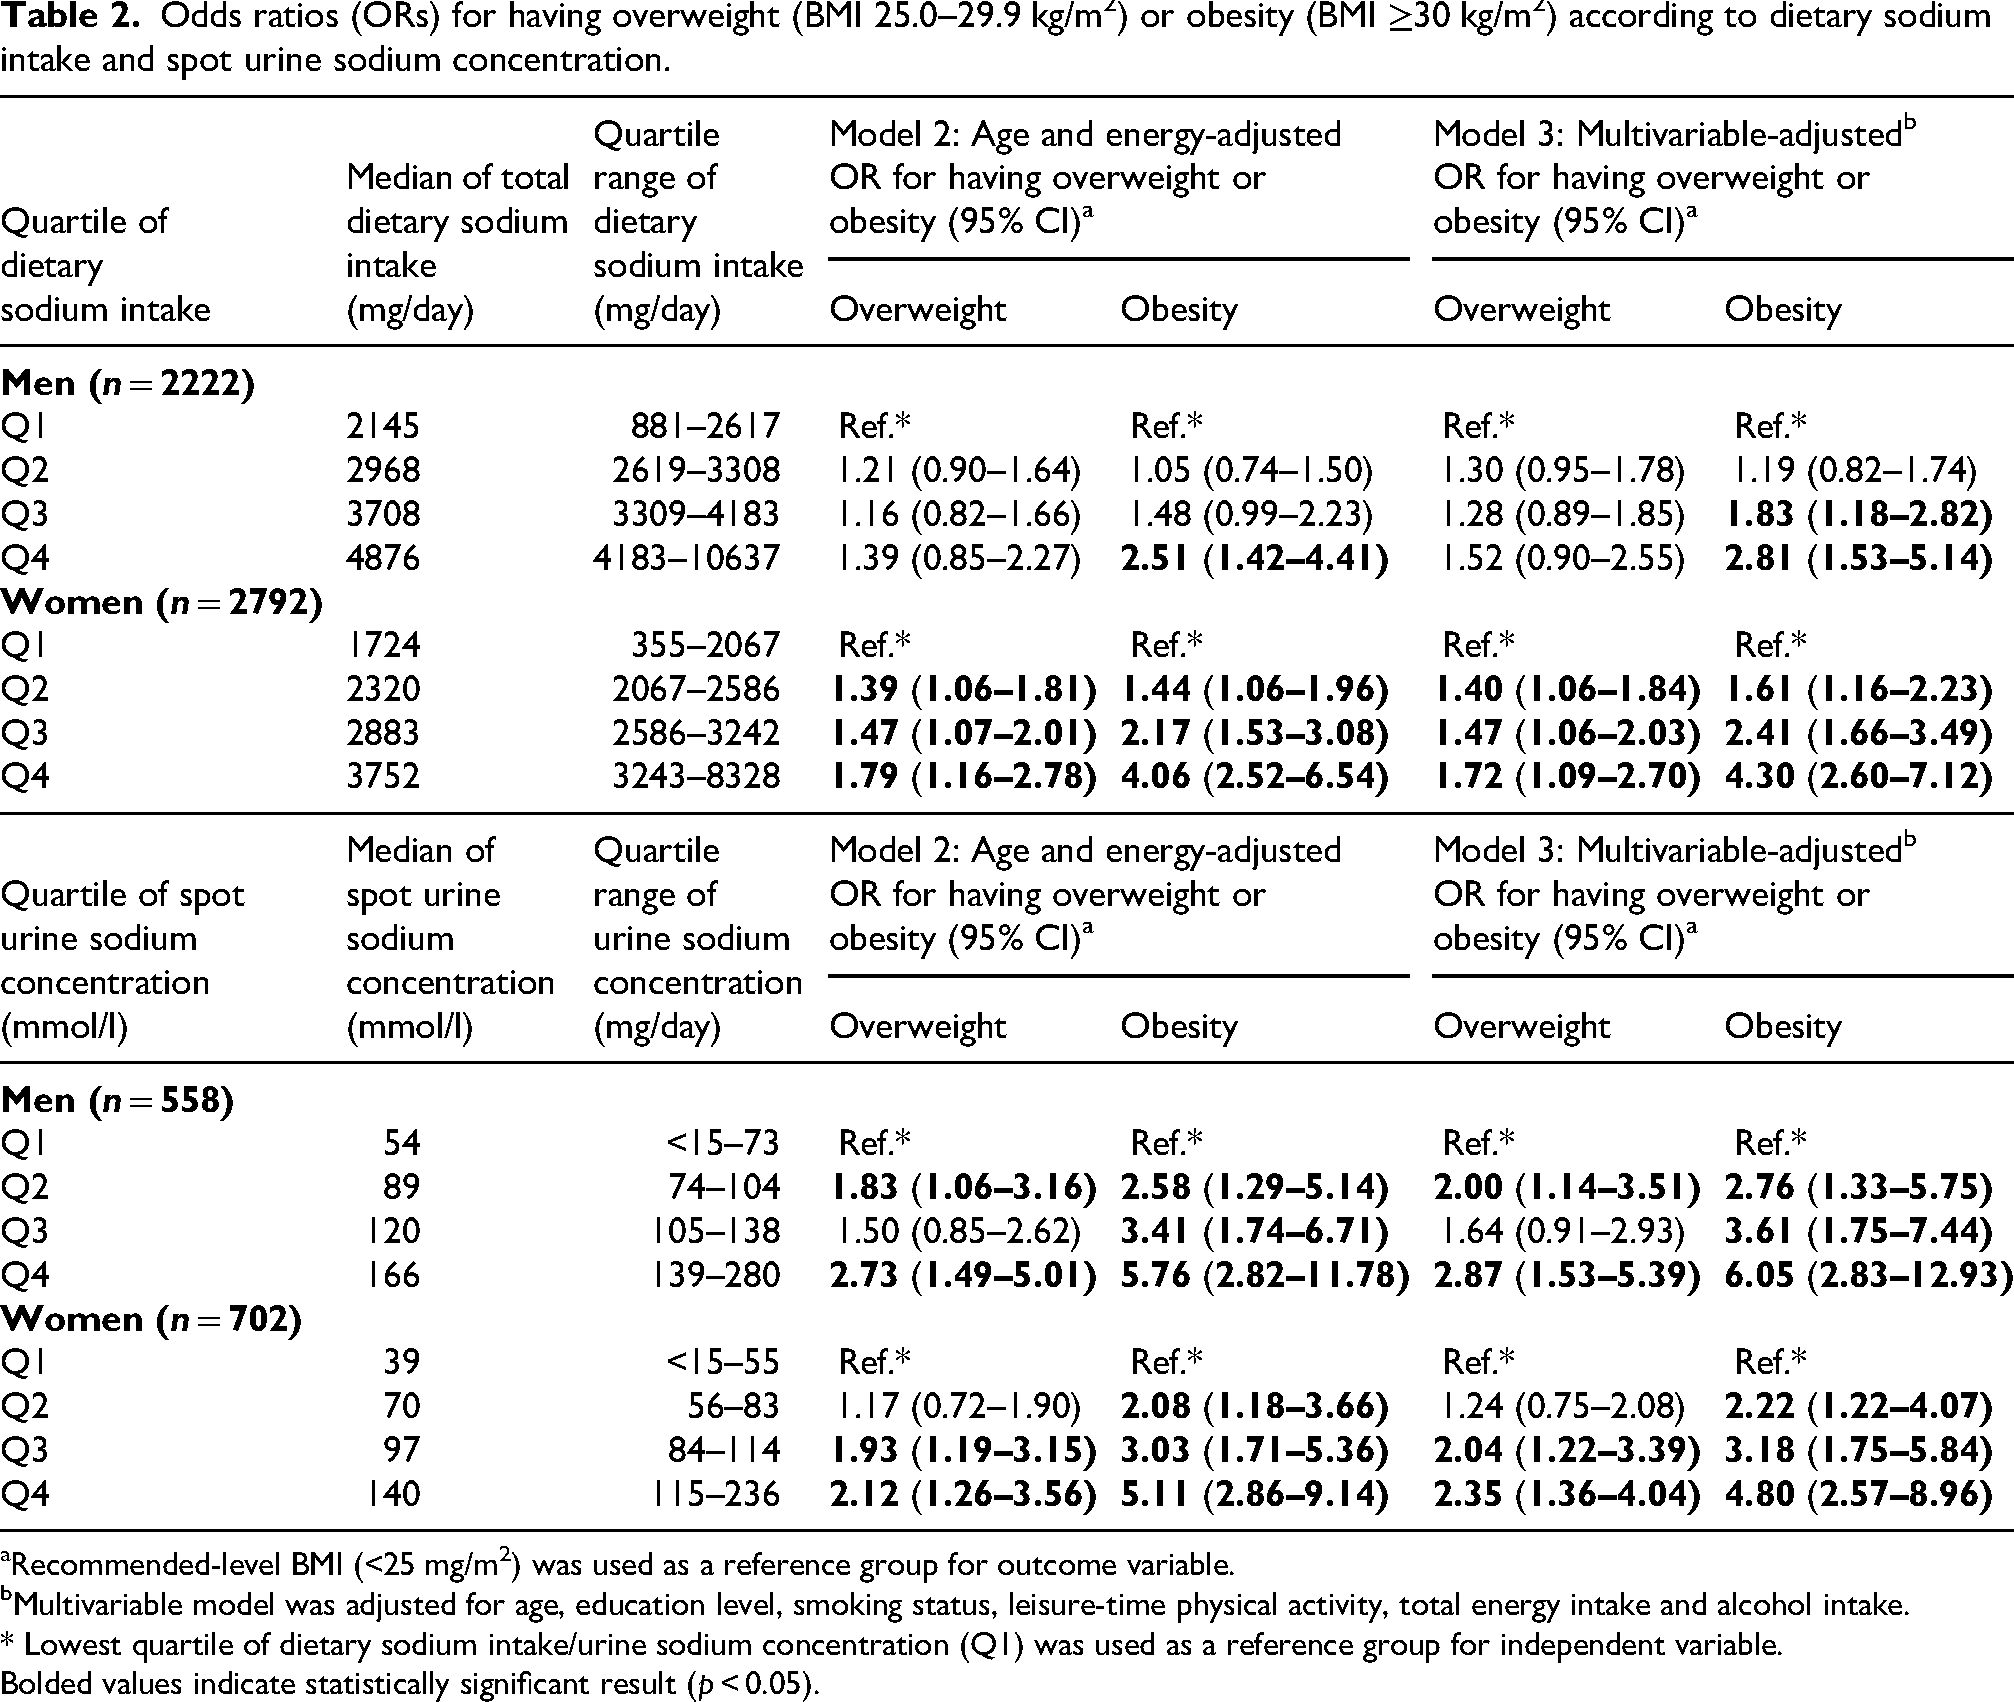
Recommended-level BMI (<25 mg/m2) was used as a reference group for outcome variable.
Multivariable model was adjusted for age, education level, smoking status, leisure-time physical activity, total energy intake and alcohol intake.
* Lowest quartile of dietary sodium intake/urine sodium concentration (Q1) was used as a reference group for independent variable.
Bolded values indicate statistically significant result (p < 0.05).
Odds ratios (ORs) for having moderate or high-risk abdominal obesity according to dietary sodium intake and spot urine sodium concentration.
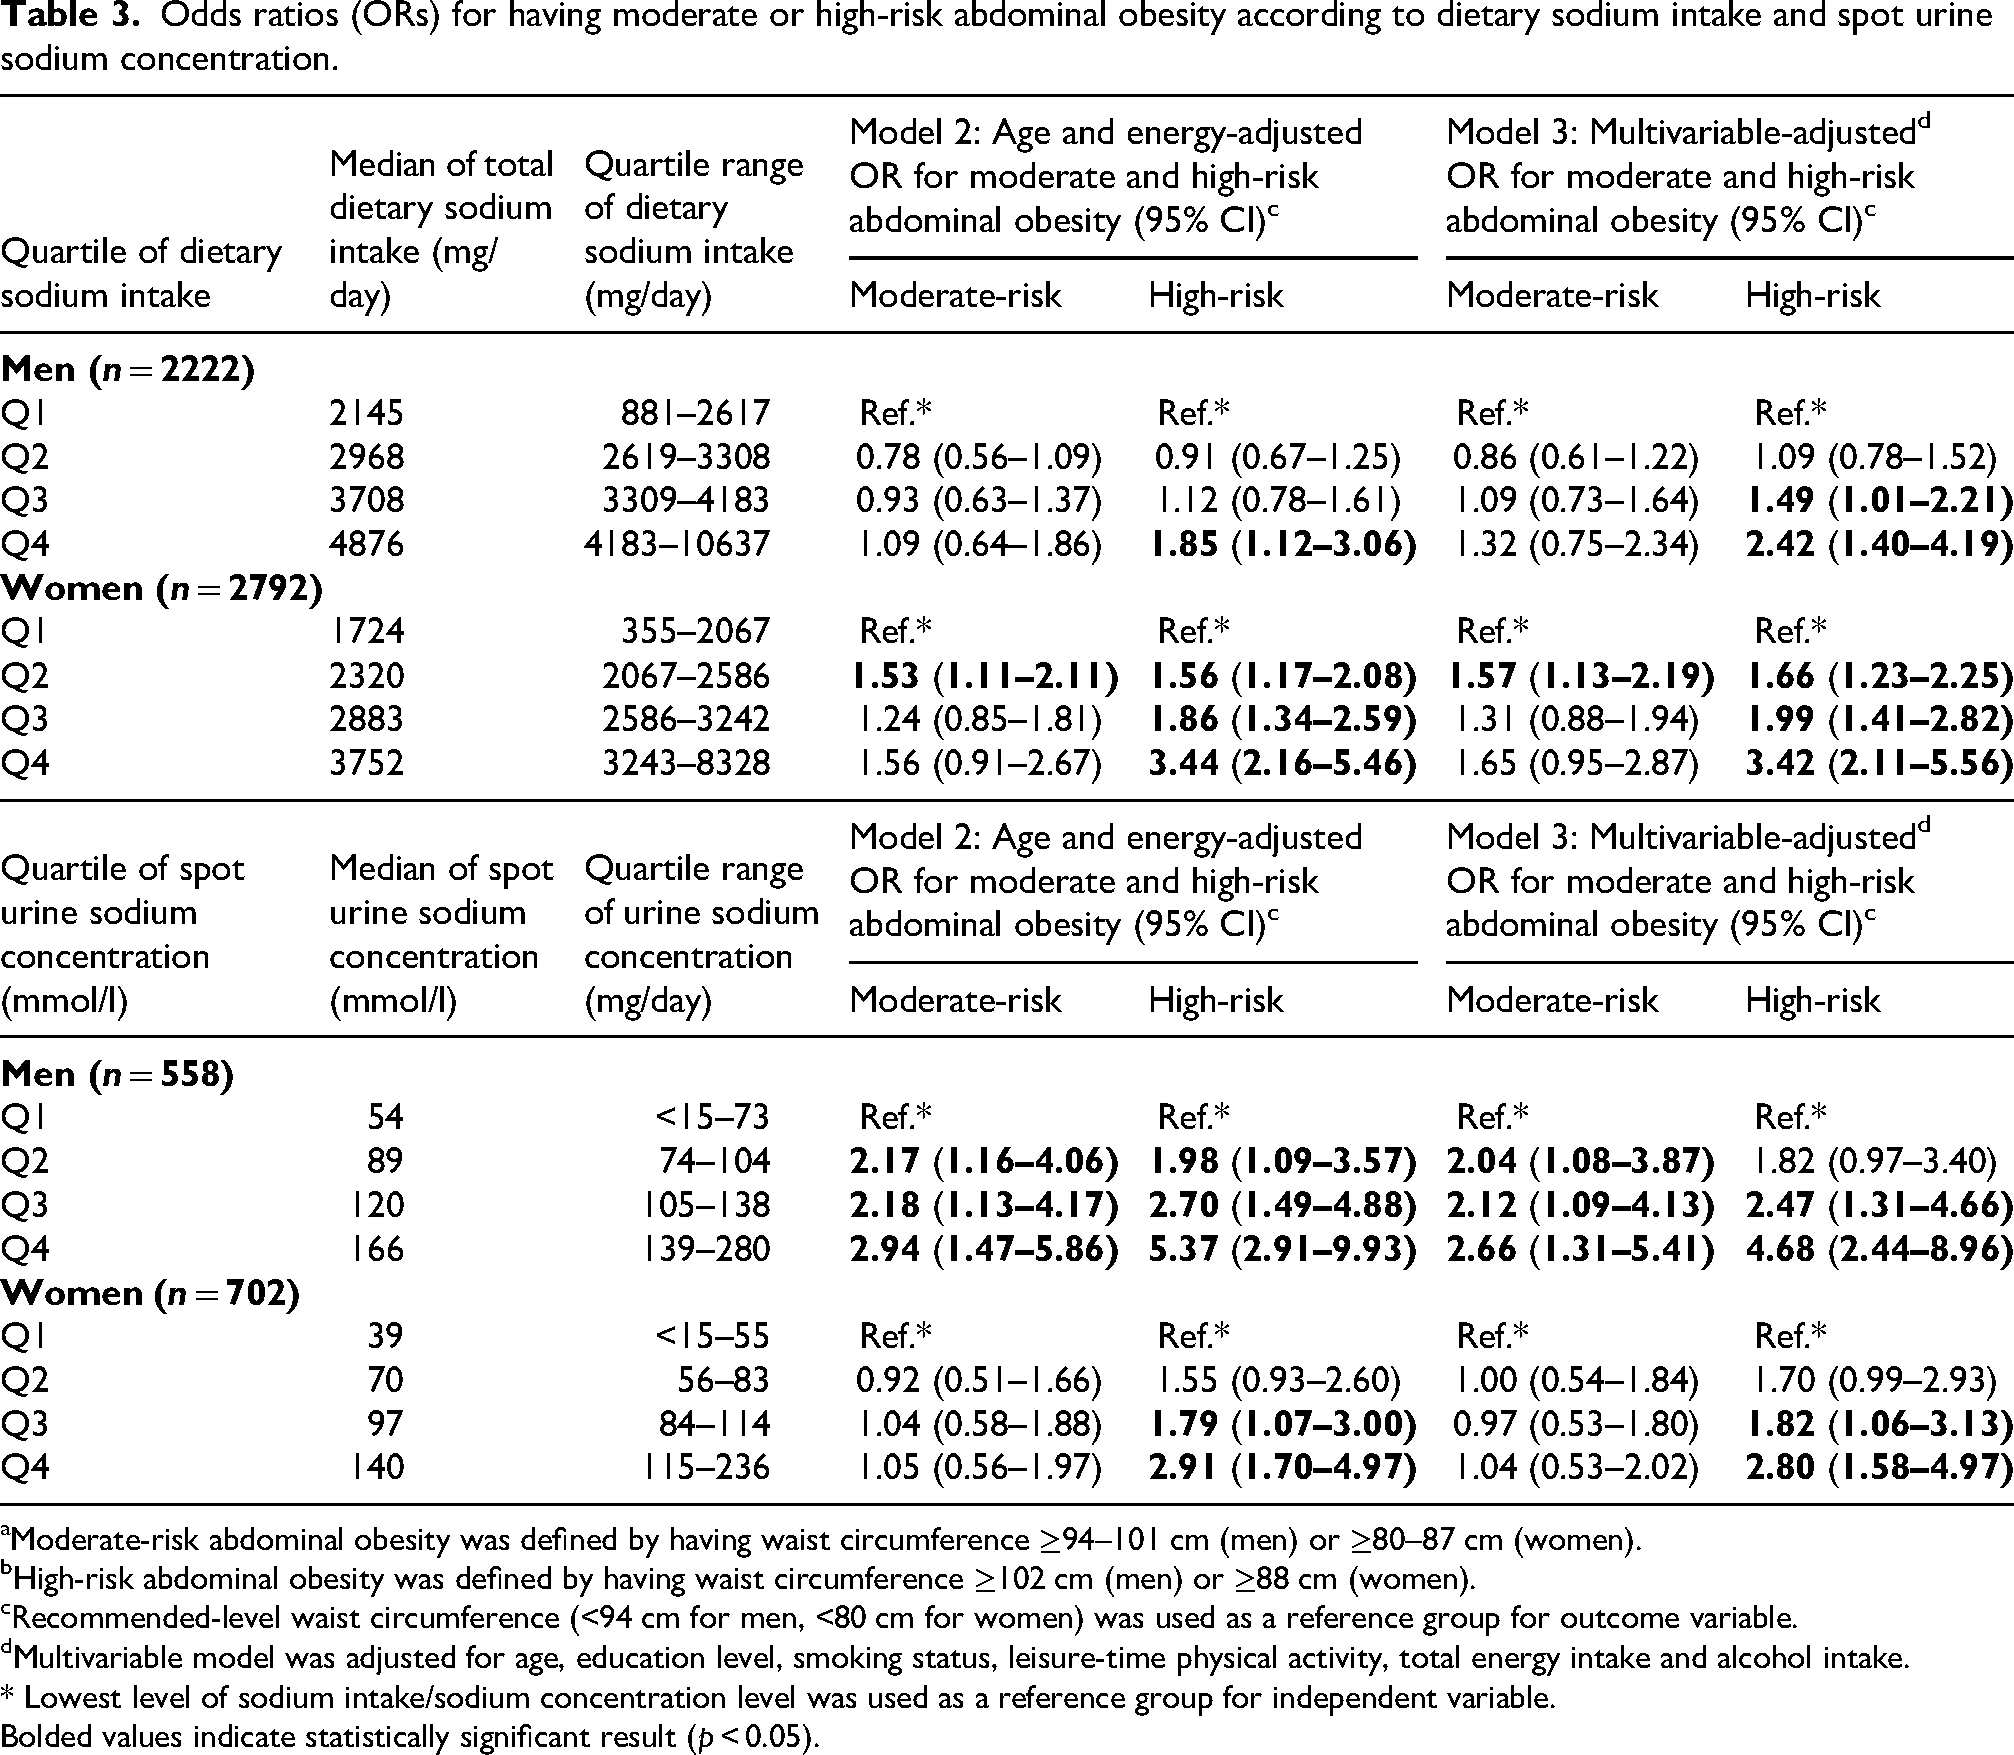
Moderate-risk abdominal obesity was defined by having waist circumference ≥94–101 cm (men) or ≥80–87 cm (women).
High-risk abdominal obesity was defined by having waist circumference ≥102 cm (men) or ≥88 cm (women).
Recommended-level waist circumference (<94 cm for men, <80 cm for women) was used as a reference group for outcome variable.
Multivariable model was adjusted for age, education level, smoking status, leisure-time physical activity, total energy intake and alcohol intake.
* Lowest level of sodium intake/sodium concentration level was used as a reference group for independent variable.
Bolded values indicate statistically significant result (p < 0.05).
Sodium intake and the odds of general and abdominal obesity
In the multinomial logistic regression models, the results of Model 1 were similar to those of Model 2 and are therefore not reported. The fully adjusted Model 3 is considered primary due to adjustment for relevant confounding factors.
Participants with high dietary sodium intake were more likely to have general or abdominal obesity. The association between sodium intake and general obesity was stronger in women (Table 2). In Model 3, female participants were four times more likely to have general obesity in the highest quartile of sodium intake (OR 4.30, 95% CI 2.60–7.12) compared with the lowest quartile. Respectively, general obesity was more common in men in the highest quartile of sodium intake (OR 2.81, 95% CI 1.53–5.14) compared to the lowest quartile.
Dietary sodium intake was associated with high-risk abdominal obesity, but not with moderate-risk abdominal obesity (Table 3). High-risk abdominal obesity was 2–3 times more common in the highest quartile of sodium intake compared to the lowest quartile in both men (OR 2.42, 95% CI 1.40–4.19) and women (OR 3.42, 95% CI 2.11–5.56) in Model 3.
Spot urine sodium concentration and the odds of general and abdominal obesity
When sodium intake was estimated based on spot urine samples, the association between sodium intake and general obesity was similar to the FFQ-based analyses. Also, the overweight outcome became statistically significant in men; the odds of both overweight (OR 2.87, 95% CI 1.53–5.39) and obesity (OR 6.05, 95% CI 2.83–12.93) were higher in the highest quartile of sodium concentration compared to reference group in Model 3. Among women, the direction of the association was similar for overweight (OR 2.35, 95% CI 1.36–4.04) and general obesity (OR 4.80, 95% CI 2.57–8.96). The association between the sodium concentration and the odds of high-risk abdominal obesity was strong both in men (OR 4.68, 95% CI 2.44–8.96) and in women (2.90, 95% CI 1.58–4.97) in Model 3.
Validity analyses
To assess agreement between spot urine and 24-h urine sodium concentrations, several methods were applied. The Spearman's correlation coefficient between the two sample types was 0.45 (p < 0.001), indicating a moderate association. A scatterplot (Figure 2) revealed a positive linear association with some outliers. According to cross-classification, 50% of participants were classified into the same tertile by both sample types.
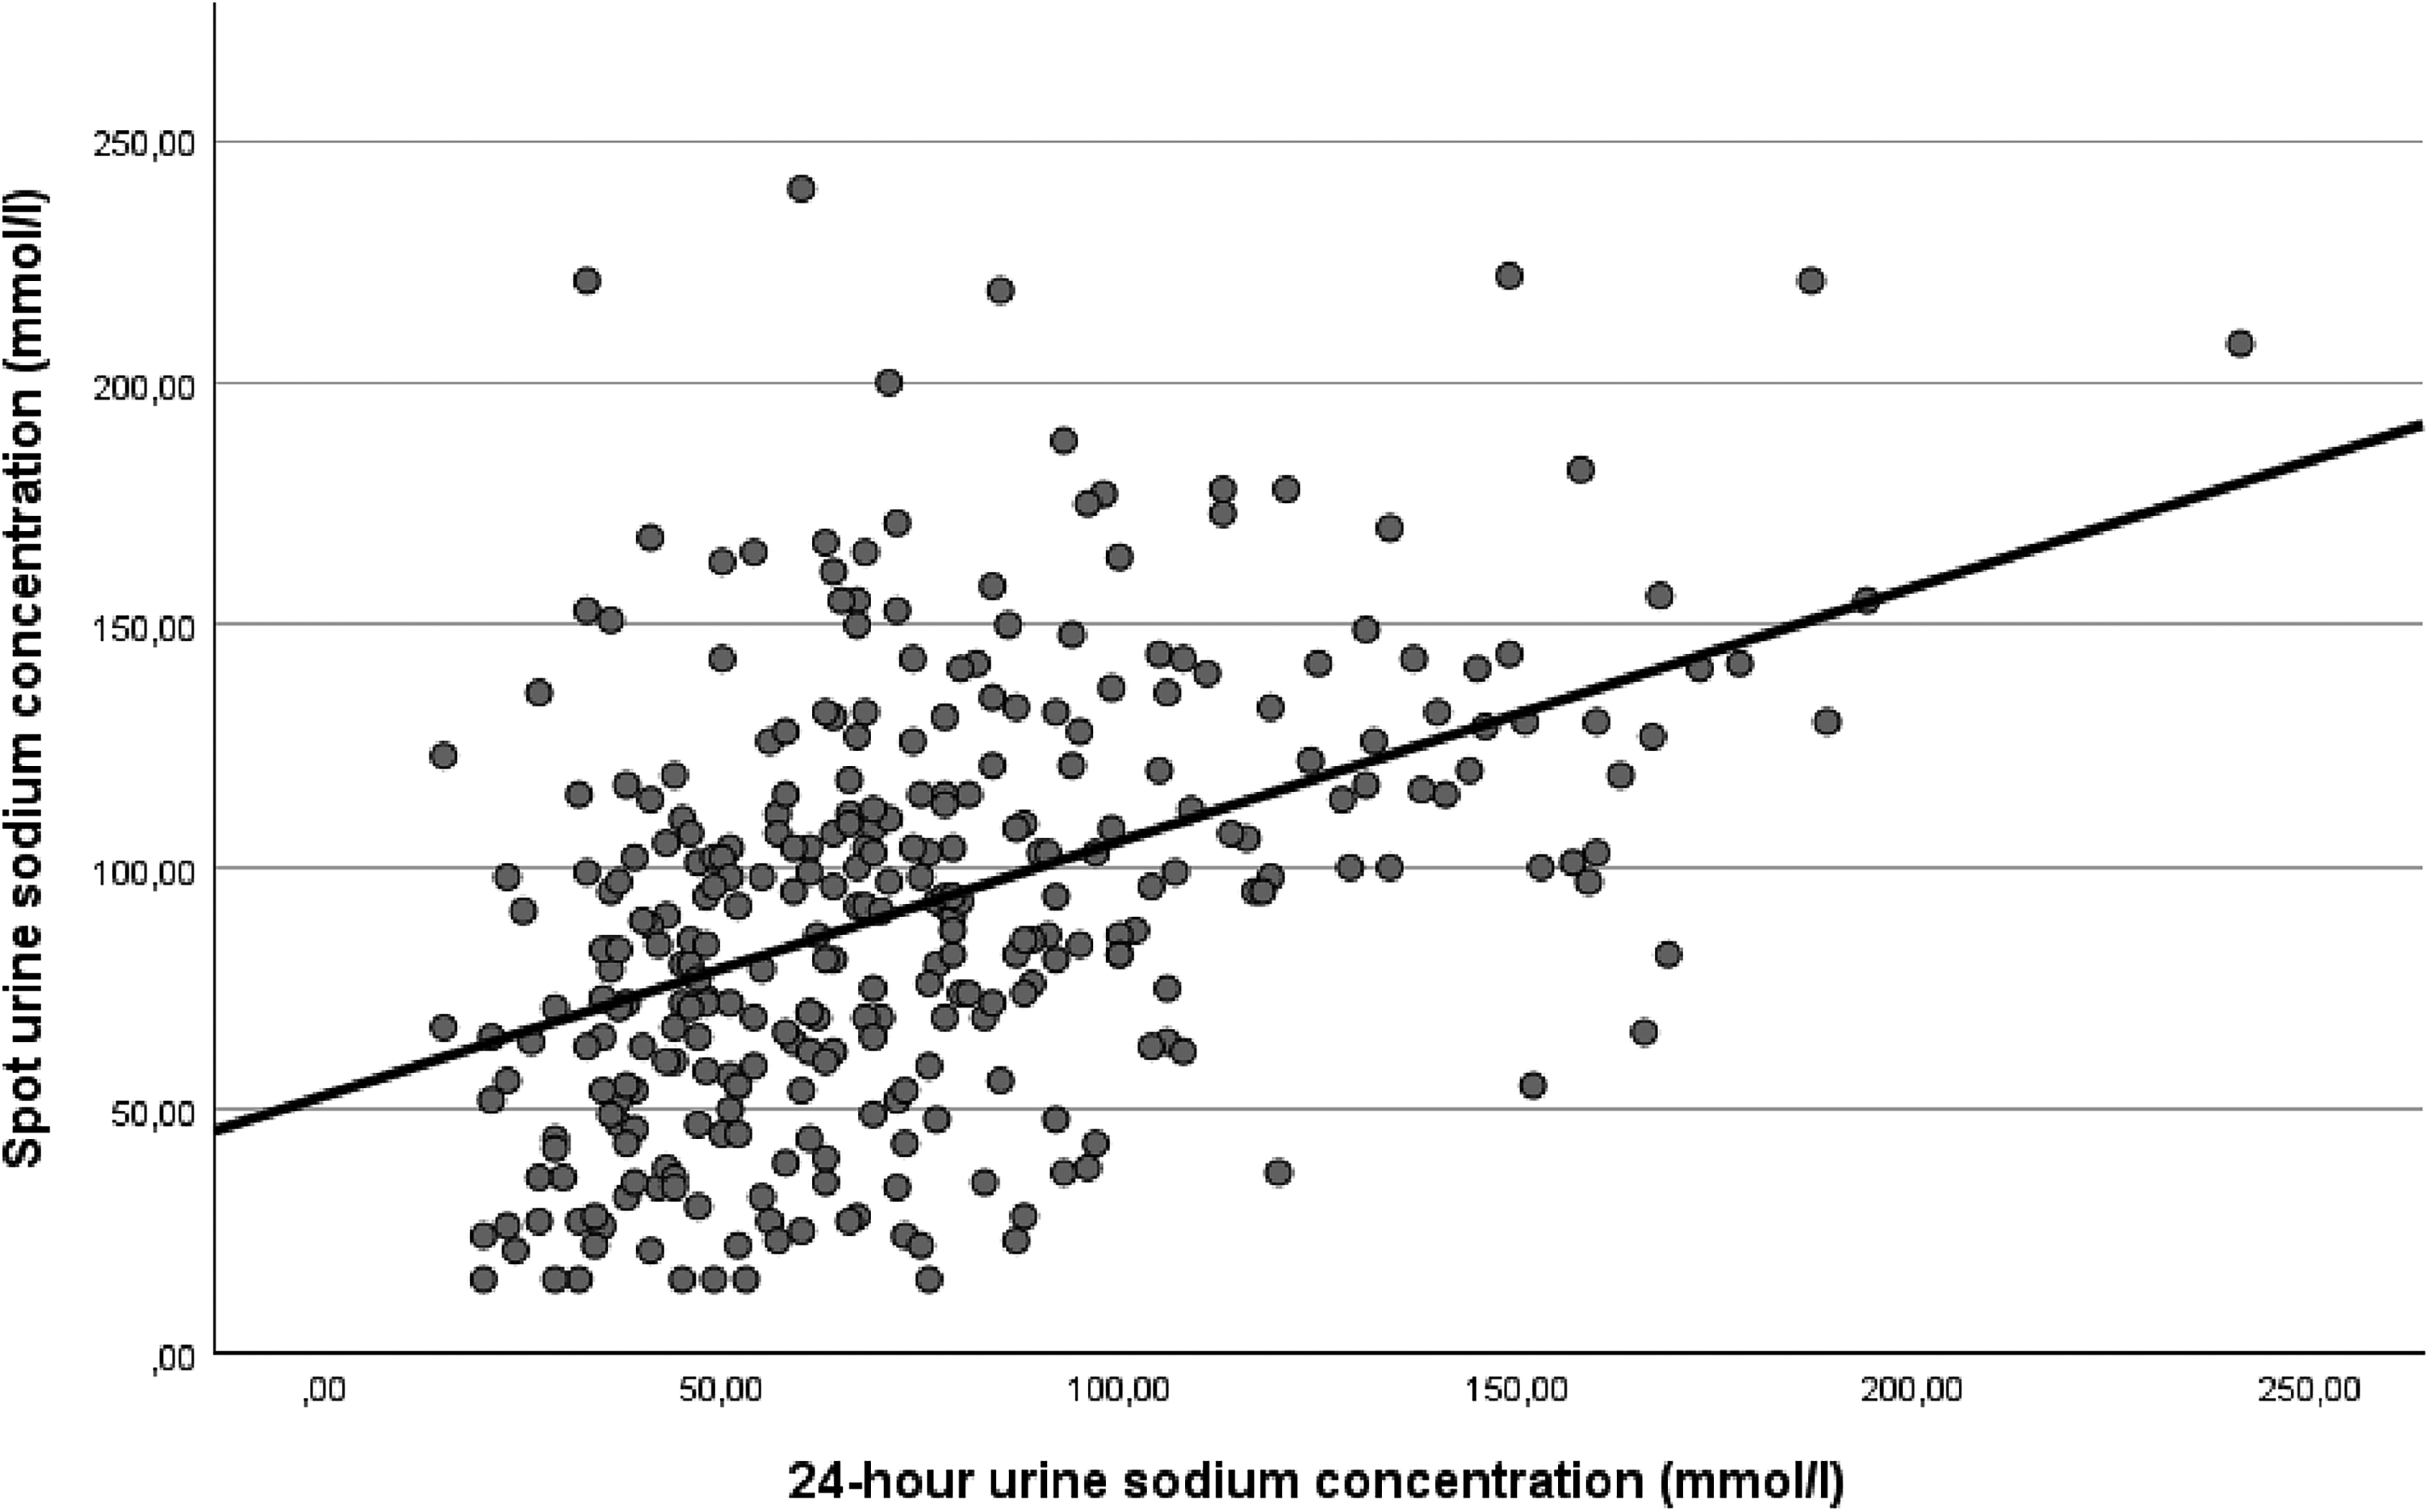
Scatterplot of the linear association between 24-h and spot urine samples in measuring sodium.
Sensitivity analyses
After excluding under-reporters from the FFQ sample in Model 3 the associations between sodium intake and general and abdominal obesity were also observed in both men and women. The associations detected by the sensitivity analyses were statistically significant and particularly strong in women for both outcomes (data not shown).
Discussion
This population-based study showed that individuals with high dietary sodium intake or urine sodium concentration were significantly more likely to have general or abdominal obesity. Associations differed by sex and measurement method: in men, spot urine sodium concentration showed stronger associations with obesity, whereas in women, FFQ-based sodium intake was more strongly associated. Sex differences may reflect a combination of methodological and biological factors. Some evidence suggests that self-reported dietary assessment methods, including FFQs, can differ in accuracy between men and women, with variations in how diet quality and intake components are classified (McKenzie et al., 2021; Procter-Gray et al., 2017). Biological differences in sodium handling, potentially influenced by sex hormones such as estrogen, may also contribute to differential associations (Drury et al., 2024). Consistent with previous cross-sectional studies, higher sodium intake was positively associated with obesity-related outcomes (Lee et al., 2023). Our findings align with earlier research showing that high sodium intake is associated with increased BMI, waist circumference, and body fat independently of total energy intake in both linear and logistic models (Grimes et al., 2021; Larsen et al., 2013; Navia et al., 2014; Yi et al., 2015; Zhao et al., 2019; Zhou et al., 2019).
The relationship between sodium intake and obesity is complex and requires careful consideration of exposure measurement error and contextual factors. Spot urine sodium excretion exhibits substantial intra-individual and diurnal variability due to circadian rhythms and fluctuations in blood pressure and blood volume (Ji et al., 2012), often resulting in lower sodium concentrations in first-morning void samples (Kimura et al., 2010; Selkurt, 1954). At the individual level, spot urine can overestimate sodium intake at lower levels and underestimate at higher levels compared with 24-h urine collections (Cogswell et al., 2015), a pattern also observed in our data (Figure 2). Because spot urine collection was only standardized by a minimum fasting period, additional interindividual variability unrelated to true sodium intake may have contributed to misclassification across quartiles. In the validation analysis, agreement between spot urine and 24-h urine was moderate (Spearman's rho 0.45; cross-classification of 50%), but the relatively small validation subsample (n = 315) limits statistical power and precision. FFQ-based sodium estimates are also subject to measurement error, including recall bias and under- or over-reporting, as illustrated by the higher prevalence of energy under-reporting among men (41.1% vs 35.7%) and extreme high sodium values in some men. Sensitivity analyses excluding under-reporters confirmed the main findings. Non-differential measurement error in both FFQ and spot urine is likely to attenuate associations, suggesting that the true relationship may be underestimated (Lee et al., 2023). The consistency in the direction of associations observed using both spot urine and FFQ-based sodium estimates nevertheless supports the robustness of the overall findings. As spot urine and FFQs are primarily suitable for population-level assessment (Cogswell et al., 2015; Conkle and Van der Haar, 2017; Judge et al., 2021), the findings should not be extrapolated to individual-level risk assessment. Residual confounding by overall diet quality, potassium intake, or other lifestyle factors cannot be excluded.
In Finland, sex differences in sodium intake largely reflect dietary patterns: men consume more high-sodium foods such as processed meat products, whereas women's diets more closely align with national recommendations, with higher intakes of dairy, vegetables, fruits, berries, and legumes (Valsta et al., 2018). Sodium intake may also serve as a proxy for overall diet quality, though evidence is mixed: some studies show higher sodium intake correlates with greater consumption of foods high in sugar, saturated fat, or protein, and lower intake of fruits and total carbohydrates (Carbonneau et al., 2021; Mercado et al., 2017). These dietary differences may interact with sex-specific fluid intake and hydration patterns, as men generally consume more fluids relative to body weight, which can increase urine volume and dilute solutes (Malisova et al., 2016; Perrier et al., 2013). Such dilution may lower sodium concentrations in 24-h urine, but its impact on spot urine is less consistent. In our study, however, urinary sodium concentrations were higher in men than in women, suggesting that in spot samples, dietary sodium and acute behavioral factors may dominate over dilution effects.
Mechanistic evidence supports a biological relationship between sodium intake and obesity. Animal studies show that high sodium intake can increase hepatic fructose production, induce oxidative stress, and elevate leptin, promoting appetite, insulin resistance, and fatty liver (Dobrian et al., 2003; Lanaspa et al., 2018). Human studies indicate that high-sodium diets can increase ghrelin levels and reduce diet-induced thermogenesis (Mähler et al., 2022; Zhang et al., 2016), potentially leading to fat accumulation and reduced energy expenditure. However, it remains unclear whether these metabolic changes directly affect body weight or are mediated by dietary patterns. Reverse causality is unlikely: experimental studies in non-obese humans and rodents demonstrate that high sodium intake induces metabolic alterations in the absence of obesity (Dobrian et al., 2003; Lanaspa et al., 2018; Mähler et al., 2022; Zhang et al., 2016). Moreover, long-term population data from Finland suggest that sodium intake trends do not mirror obesity trends inversely (Borodulin et al., 2015). Clarifying causal mechanisms will require high-quality longitudinal studies, repeated assessments of diet and anthropometry, and intervention or Mendelian randomization approaches.
Globally, efforts to reduce population sodium intake have lagged behind the public health burden, with the WHO 30% reduction target repeatedly postponed. In Finland, national initiatives were successful in lowering mean intake in the 1970s–2000s, but reductions have plateaued as efforts have waned (Kaartinen et al., 2021; Laatikainen et al., 2016). Comparing diets across European countries is challenging due to differences in dietary assessment methods and reporting (Rippin et al., 2017). Nevertheless, Finnish obesity trends broadly reflect those seen in other Western populations (Phelps et al., 2024), and occur alongside similarly high mean population sodium intakes across Europe (WHO, 2022), suggesting that insights from Finland may be applicable across the region. Strong governmental leadership and mandatory multicomponent policies are needed, as voluntary measures by the food industry alone are insufficient (Campbell et al., 2023; WHO, 2023). While high sodium intake alone does not explain the global obesity epidemic, addressing the issue is important to develop more effective prevention strategies and reducing obesity and CVD-related mortality and morbidity at both individual and population levels.
Strengths of this study include a large population-based sample, the use of two complementary methods for measuring both relative sodium intake and obesity (BMI and WC), validated protocols, and sensitivity analyses to assess robustness. Limitations include the cross-sectional design, the small spot urine validation subsample, potential residual confounding, and inherent measurement error in both sodium assessment methods. For example, FFQ's do not capture discretionary salt added at the table and salt intake estimated are dependent on the accuracy of the food composition database used. Furthermore, FFQ sodium estimates have not been directly validated against 24-h urine in Finland, which reinforces the value of including biomarker-based assessment.
Conclusions
In this cross-sectional study, higher sodium intake was associated with increased odds of general and abdominal obesity, with notable sex-specific patterns. These findings highlight the need for future research using longitudinal, intervention, or Mendelian randomization approaches to clarify causality, mechanisms, and potential sex-specific effects. In addition, strong governmental commitment and mandatory policy approaches are needed to ensure that the global goal of reducing salt intake is not pushed further into the future.
Footnotes
Acknowledgments
Special thanks to colleagues Valtteri Pohjola (THL) and Jouni Lahti (THL) for vitally important comments and support in the data analysis.
Ethical statement
The FinHealth 2017 Study has undergone an ethical review and approval by the Coordinating Ethics Committee at the Hospital District of Helsinki and Uusimaa (Reference 37/13/03/00/2016). The participants had given their signed informed consent to participate in the study, which also included consent to the subsequent public health-related research use of the data. This study followed good scientific practice according to the principles of the Declaration of Helsinki. The research material was pseudonymized, and individual participants could not be identified from the research material.
Consent for publication
All authors have read the manuscript and accepted its submission.
Authors’ contributions
AS, TIK and NEK were responsible for the planning and design of the study. AS carried out the pre-study literature search, data processing, statistical analysis, manuscript writing, editing, updating references, and final finishing stages of the manuscript. Interpretation of the results was carried out by AS, TIK and NEK. Commentary and feedback on the manuscript were provided by AS, TIK, NEK, HT and SM. Final version of the manuscript was approved by AS, TIK, NEK, HT and SM.
Funding
The authors disclosed receipt of the following financial support for the research, authorship, and/or publication of this article: This research was supported by the institutional resources and infrastructure provided by the Finnish Institute for Health and Welfare (AS, SM, HT and NEK) and University of Tampere (TIK). No external funding was used for the research.
Declaration of conflicting interests
The authors declared no potential conflicts of interest with respect to the research, authorship, and/or publication of this article.
Availability of data and materials
The data that support the findings of this study are available under a research permit from the THL Biobank (thl.fi/biobank), but restrictions apply to the availability of these data, which were used under license for the current study, and so are not publicly available. Data are however available from The Finnish Social and Health Data Permit Authority, Findata, which may grant permits in accordance with the act on the secondary use of social and health data in Finland (![]() ).
).