
Abstract
Keywords
Introduction
Nutrition science recognises that population-level guidelines cannot fully account for the substantial inter-individual variability in nutrient metabolism and disease susceptibility (Agrawal et al., 2024; Ordovas et al., 2018). This recognition has spurred the evolution of nutritional genomics, encompassing nutrigenetics and nutrigenomics, to investigate how genetic variation interacts with diet to shape better health outcomes. Propelled by the Human Genome Project, the field quickly institutionalised, marked by the founding of the International Society of Nutrigenetics/Nutrigenomics in 2005 and the launch of specialised journals (Marcum, 2020; Sikalidis, 2019). Recent consensus work now defines personalised nutrition as a data-driven integration of genetic, phenotypic and environmental information to optimise health (Bush et al., 2020), broadening the scope of nutritional genomics from non-communicable diseases like cardiometabolic health to cognitive and neuro-developmental domains (Dauncey, 2012). Parallel advances in high-throughput omics and analytics have deepened the understanding of classic gene-nutrient interactions. Variants in the fatty acid desaturase 1-fatty acid desaturase 2 (FADS1-FADS2) cluster influence long-chain omega-3/6 polyunsaturated fatty-acid synthesis, thereby altering inflammatory responses (Singar et al., 2024). Lactase-persistence alleles in lactase gene underpin pronounced ethnic differences in dairy tolerance, especially the low persistence observed in East Asian populations (Laland et al., 2010). On the other hand, cytochrome P450 1A2 (CYP1A2) polymorphisms modulate caffeine metabolism, altering cardiometabolic risk profiles (Guest et al., 2019), while fat mass and obesity-associated (FTO) risk alleles interact with physical activity and diet to modify obesity trajectories (Kilpeläinen et al., 2011; Reddon et al., 2016). Importantly, these relationships are rarely universal. Corella et al. (2018) posited that gender-specific differences in hormonal profiles and gene expression can lead to varied outcomes from the same diet. Allele frequencies and effect sizes often differ by geography, as demonstrated by the multi-ethnic GeNuIne collaboration (Vimaleswaran, 2021), and studies in Indonesian women linking vitamin B12-related single nucleotide polymorphisms (SNPs) with fibre intake (Surendran et al., 2019).
Moreover, public interest has grown alongside the proliferation of direct-to-consumer (DTC) genetic tests and app-based platforms offering DNA-tailored diet plans (Kanter and Desrosiers, 2019). Although personalised feedback has been shown to drive behaviour change in a person, demonstrated by the angiotensin-converting enzyme (ACE) genotype-based sodium-reduction trial (Nielsen and El-Sohemy, 2014) and Food4Me's web-based intervention (Celis-Morales et al., 2017), commercial tests often rely on single-variant interpretations and variable professional oversight, raising ethical and practical concerns (Hardie, 2011; Singar et al., 2024). Consequently, findings from DTC datasets should be interpreted cautiously, as they may not be representative of the general population. High-quality data from clinically derived cohorts are crucial for pinpointing which gene-diet associations can be translated into effective, actionable nutritional interventions. Intervention studies demonstrate that genetic information can refine dietary prescriptions. Polygenic risk scores explain up to 28% of body mass index loss variance under energy-restricted diets (Ramos-Lopez et al., 2020), while large prospective cohorts show that favourable lifestyles halve coronary disease and stroke risk even in individuals with high inherited risk (Khera et al., 2016; Rutten-Jacobs et al., 2018). Likewise, machine-learning and cluster-analytic methods increasingly integrate genomic, epigenomic and microbiome data to stratify individuals beyond single-gene effects (Dietrich et al., 2019).
Despite the advances in this field, the demographic modulation of genetic trait distributions remains under-explored. Sex-specific differences in fatty-acid metabolism and regional variation in traits such as lactose intolerance suggest that demographic context may shape allele frequencies. Furthermore, grouping correlated traits into functional domains may help clarify the systems-level patterns present in gene-test reports. This study analyses over 500 anonymised in gene-test reports from a DTC gene-testing program, covering 41 diet and lifestyle related genetic components. We describe gender- and region-specific patterns in allele frequency distributions and apply hierarchical clustering and principal component analysis (PCA) as exploratory tools to visualise trait groupings. The aim is to generate hypotheses about demographic variation and trait clustering within a DTC dataset, while acknowledging that outcome data and biomarker validation are required before any clinical or prescriptive conclusions can be drawn. Throughout the manuscript, references to prior studies describing associations between specific SNPs and nutritional or health-related traits are included to provide background context and illustrate reported findings in the literature and should not be interpreted as direct support for the analyses conducted in this study.
Method
Data source
Our dataset comprises 503 anonymised gene-test reports obtained from clients of a clinic in New Zealand that focuses on personalised healthcare, as well as demographic information such as gender and country of origin. These reports, in the form of proper document format (PDF), were generated by the commercially curated Dermatogenomix® program.1 This direct-to-consumer (DTC) genetic test provides categorical classifications (e.g., Typical, Elevated, Enhanced, Ultra) across 41 nutrition- and lifestyle-related genetic components. Each report comprises a summary table listing components tested (e.g., caffeine metabolism, lactose intolerance, omega fatty acid balance), a categorical risk assessment (e.g., Typical, Elevated, Enhanced, Ultra), and corresponding health or nutrition recommendations based on the genetic result. The underlying single nucleotide polymorphisms (SNPs) assessed in this panel are listed in Supplementary Table S1, together with rsIDs (reference SNP identifier), associated genes, and functional references. It is important to note that such reports provide probabilistic rather than deterministic information, with variable evidence strength across included variants. As a self-selected, health-conscious clientele, this cohort is not representative of the general population. All data were irreversibly anonymised prior to analysis, and the Auckland University of Technology institutional committee determined that formal ethics approval was not required for this study.
Data extraction and pre-processing
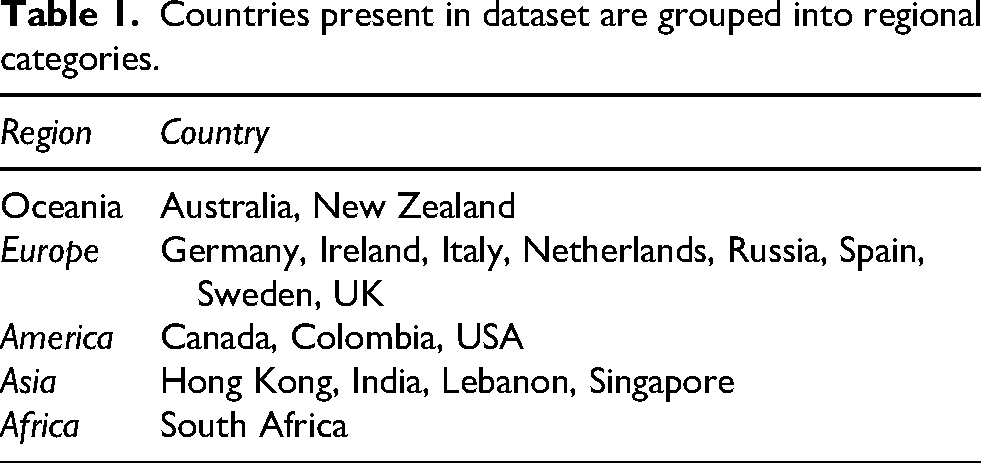
Summary tables embedded in the PDF reports were extracted, imported and merged into a consolidated dataset. During pre-processing, component names were cleaned and standardised to ensure consistency (e.g., different formatting for ‘Achilles Tendon Injury’ was unified under a single label). Components that appeared under related labels, such as variants of caffeine metabolism or fat sensitivity, were grouped under umbrella terms to facilitate analysis. Country names were also standardised, and mixed-format entries (e.g., ‘NZ/Indian’) were separated into distinct variables for country and ethnicity where possible. Countries were then grouped into regional categories: Oceania, Europe, America, Asia, and Africa, to enable descriptive comparisons (see Table 1). Finally, the risk categories, typically reported as ‘typical’, ‘elevated’, ‘enhanced’, ‘ultra’ etc., were encoded ordinally using a numeric scale ranging from 0 (Unknown) to 10 (Ultra), allowing for statistical handling.
Countries present in dataset are grouped into regional categories.
Data cleaning
Reports with missing or ambiguous gender data (n = 9) and those based on a non-standard testing panel (e.g., Covid-19 susceptibility) were excluded, resulting in a final sample of 503 complete records. During exploratory attempts to assign individuals to clusters using the random forest classifier, a machine learning technique, records that lacked any component data for the clusters were dropped. Although essential for reliable cluster assignment, this cleaning step ultimately precluded the derivation of a predictive target variable for modelling. This limitation underscores that the present dataset is descriptive in nature and not suitable for predictive modelling.
Statistical analysis
As a first step, we explored general patterns in the dataset, including distributions of categorical classifications across individuals and components. To assess whether these classifications varied by gender or region, chi-square tests were applied to each component. For descriptive comparison, categories were grouped into ‘high-risk’ (elevated, enhanced, ultra) and ‘typical/low-risk’ (typical, diminished, low). These categories represent predefined, evidence-based outputs from a commercial gene-test panel rather than validated clinical risk measures.
Furthermore, to explore interrelationships between components, pairwise chi-square tests were conducted for all component combinations. The resulting p-values were transformed using -log10, and a Euclidean distance matrix was constructed from these values. Hierarchical cluster analysis using Ward's method was then applied as an exploratory tool to visualise patterns of co-occurrence. The dendrogram was cut at height 50, where the tree shows a natural break (Figure 1). Below this threshold, many fine branches emerge whose members share very low p-values, indicating strong internal cohesion. Selecting this cut-off therefore preserves those cohesive groups while yielding 14 clusters, enough to support meaningful analysis without becoming unwieldy. Sensitivity analyses at cut-heights 40 and 60 produced broadly similar structures (Supplementary Figures). Based on the strength of the associations and biological plausibility, the top three clusters were selected for further analysis. These were labelled descriptively as Nutrient Metabolism, Digestive and Absorption, and Immunity and Antioxidants. Principal component analysis (PCA) was then performed separately on each of these three clusters to reduce dimensionality, visualise patterns of variance and identify components contributing most strongly to overall variability. These analyses are exploratory and do not imply causal or functional relationships.
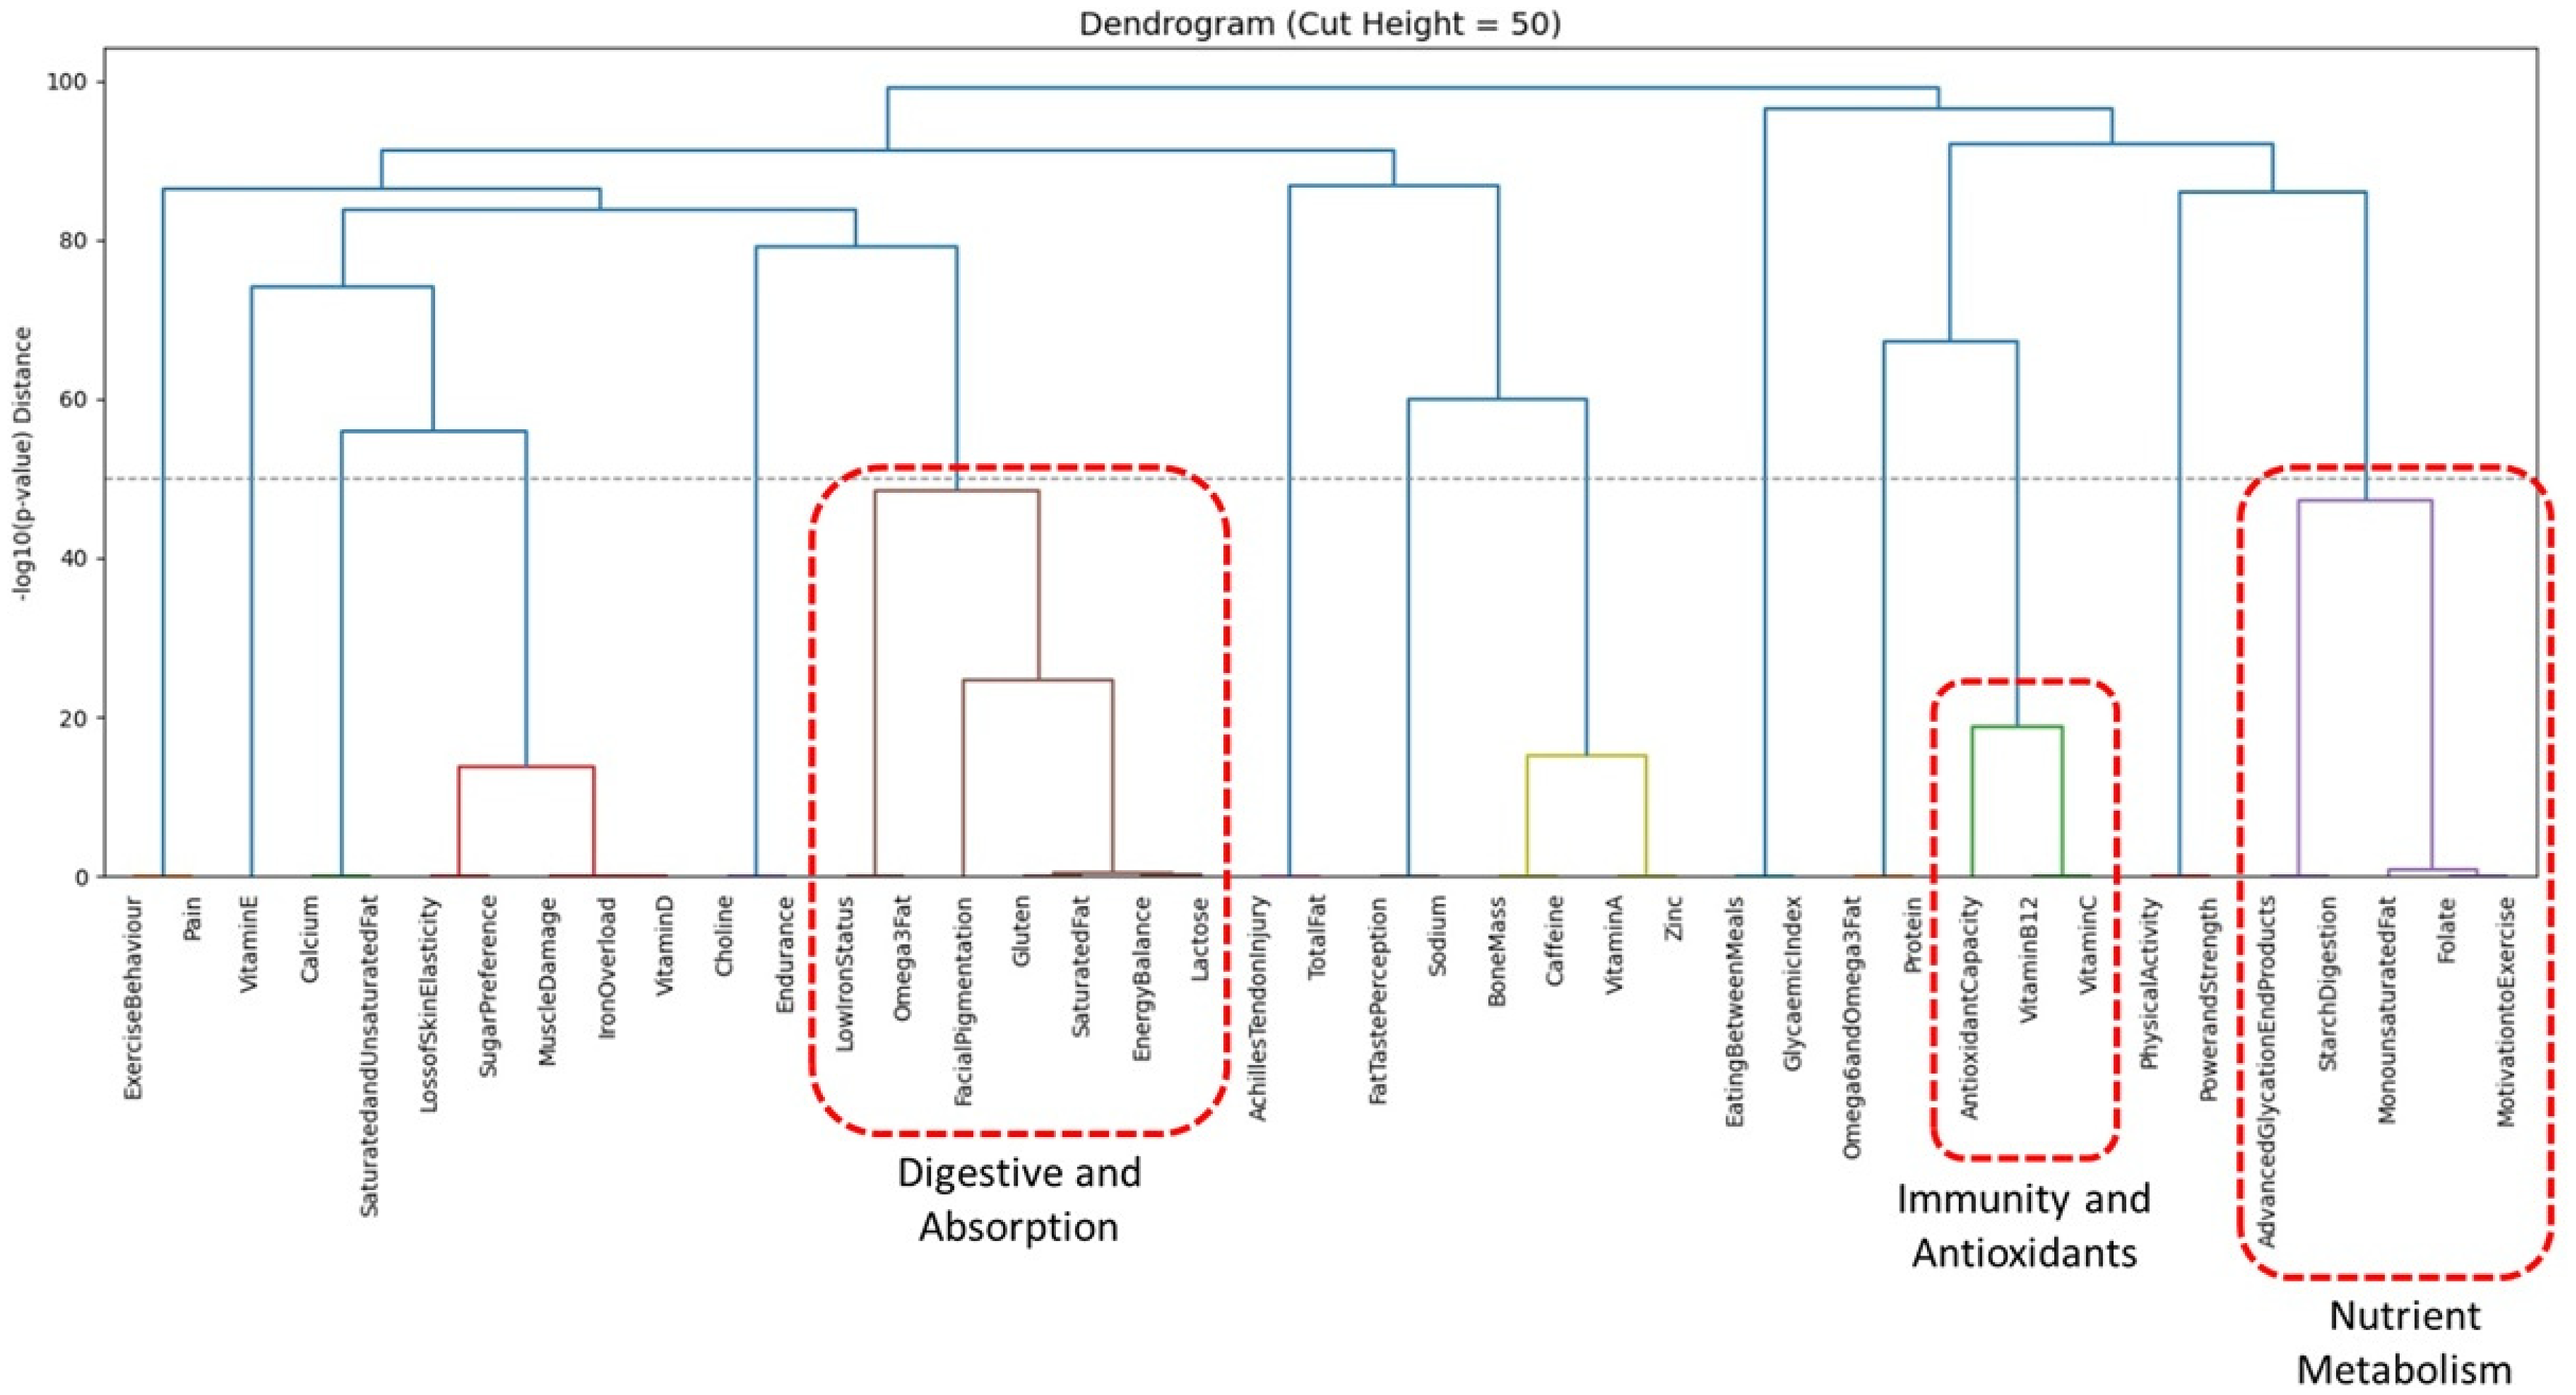
Hierarchical cluster analysis reveals 14 clusters at cut-height 50. Top three clusters are Nutrient Metabolism, Digestive and Absorption and Immunity and Antioxidants.
Drawing on the observed demographic disparities and the clustering of components, exploratory attempts were also made to evaluate whether demographic variables could predict cluster membership. For each participant, the mean risk score was calculated within every cluster, and the cluster with the highest average was assigned as that person's ‘TopCluster’. This classification task was modelled using both a class-weighted random forest classifier and a multinomial logistic regression, both using one-hot-encoded gender and region as predictors. The random forest pipeline imposed complete-case filtering on the 41 component scores, eliminating every record, whereas the multinomial model, which can tolerate missing predictors, proceeded on the rows that retained a valid ‘TopCluster’. The data did not support reliable prediction due to substantial missingness and pronounced class imbalance. As a result, predictive modelling was not feasible.
Results
Most individuals in the study were categorised as having a ‘typical’ profile for most genetic components, indicating that their gene-test reports generally reflect common classifications. However, certain components deviated from this pattern. For example, components such as achilles tendon injury and gluten sensitivity exhibited a higher proportion of ‘Elevated’ or ‘Enhanced’ classifications, suggesting that while the overall distribution is moderate, some components show greater variability across individuals. When components classified as ‘high,’ ‘elevated,’ ‘enhanced,’ or ‘ultra’ were considered, their distribution across individuals followed a bell-shaped curve (Figure 2). Most individuals had between 35% and 50% of their assessed components flagged as higher than typical.
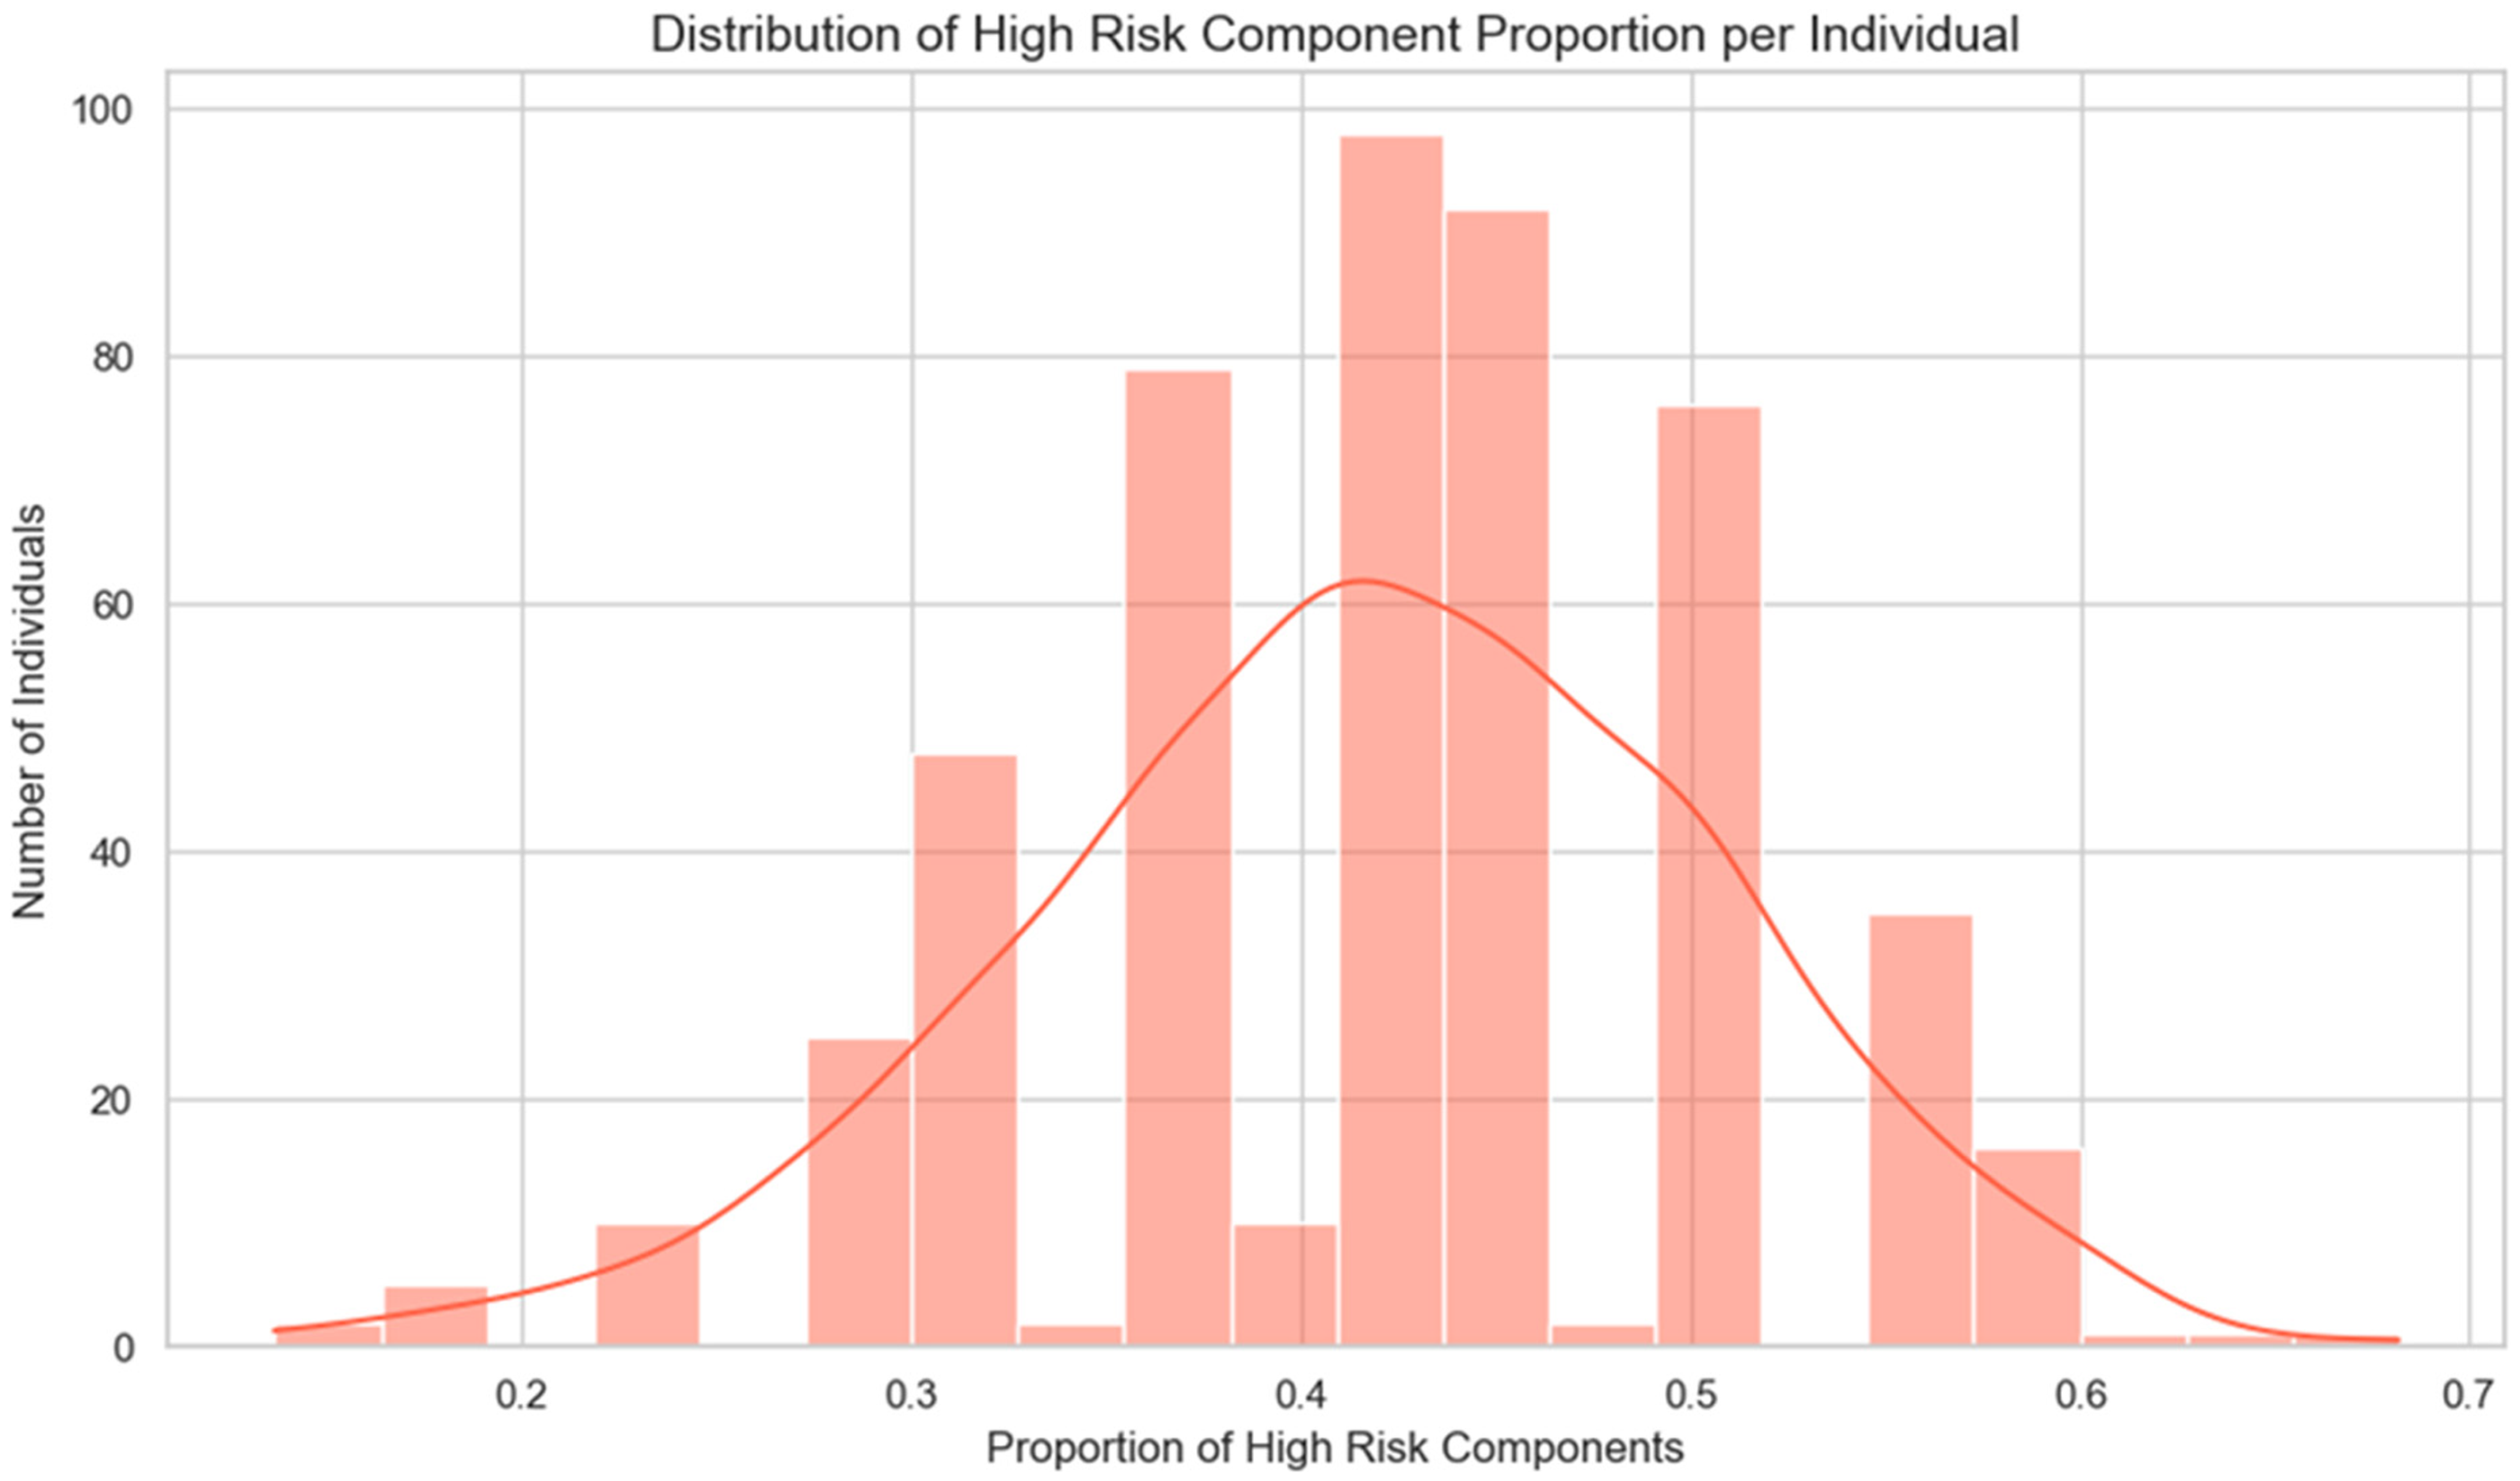
High-risk components’ distribution across individuals followed a bell-shaped curve.
In gender-based analysis, omega-6 and omega-3 fatty acid metabolism showed a statistically significant difference (p = 0.0378), with females more frequently classified in high or above categories. This may be explained by the influence of sex hormones, particularly oestrogen, on the metabolic pathways involved in fatty acid processing (Simopoulos, 2016). Oestrogen is known to upregulate the activity of key enzymes, such as delta-6 desaturase and elongase, which are responsible for converting essential fatty acids into their long-chain, bioactive forms. This hormonal modulation may lead to differences in the efficiency of fatty acid metabolism between females and males. Additionally, genetic factors that regulate these enzymes may interact with hormonal influences, further amplifying the differences in omega-6 and omega-3 processing. Consequently, these combined biological processes could result in a higher propensity for females to exhibit profiles associated with these fatty acid pathways. Other components such as muscle damage and bone mass displayed trends towards gender differentiation, though these did not reach statistical significance.
Regionally, six components demonstrated significant differences: lactose intolerance (p < 0.00001), vitamin D deficiency (p = 0.0137), omega-3 fatty acid metabolism (p = 0.0215), pain tolerance (p = 0.0279), saturated and unsaturated fat risk (p = 0.0406), and gluten sensitivity (p = 0.0411). Notably, Asian individuals were more frequently classified in higher categories for lactose intolerance, which is consistent with historical dietary practices involving low dairy consumption and the corresponding low prevalence of lactase persistence. Regional differences, particularly for Asia, were also observed for vitamin D status, omega-3 metabolism, and gluten sensitivity. This observation may suggest genetic predispositions, skin type and cultural practices that limit sun exposure, in addition to environmental factors such as lower UV radiation levels (Akhtar, 2016; Oktaria et al., 2022), regional dietary habits, such as a higher reliance on fish and unique genetic adaptations that may influence fatty acid processing (Schuchardt et al., 2022), as well as gluten sensitivity potentially arising from both genetic predispositions and the cultural prominence of wheat-based products in the diet (Ashtari et al., 2019), which was corroborated by studies in India that demonstrated higher gluten intolerance for wheat-eating North Indians compared to rice-eating South Indians (Paul, 2017). American individuals demonstrated heightened pain tolerance, in the presence of catechol-O-methyltransferase (COMT) gene variants, which modulate the degradation of catecholamines and thereby reduce pain perception, resulting in an elevated pain tolerance (Korczeniewska et al., 2021). Classifications related to saturated and unsaturated fat metabolism were elevated across regions, with a modestly higher frequency observed in Europe. This may suggest dietary patterns rich in specific types of fats (Eilander et al., 2015) and the influence of genetic variants that affect fat metabolism. Together, these regional disparities point to the complex interplay of historical, cultural, and biological factors in shaping observed genetic patterns, suggesting hypotheses for future outcome-based research.
Hierarchical cluster analysis derived 14 clusters when the dendrogram was cut at height 50 (Figure 1). The top three clusters were examined further to illustrate variance structure. The first cluster, labelled the Nutrient Metabolism cluster, comprised Advanced GlycatioEndProducts, Folate, MonounsaturatedFat, MotivationtoExercise, and StarchDigestion. The second, the Digestive and Absorption cluster, included EnergyBalance, FacialPigmentation, Gluten, Lactose, LowIronStatus, Omega3Fat, and SaturatedFat. The third cluster, the Immunity and Antioxidants cluster, was formed by AntioxidantCapacity, VitaminB12, and VitaminC.
PCA was then performed separately on each of these clusters to pinpoint the primary contributors to the variability. In the Nutrient Metabolism cluster, the first principal component (PC1) explained approximately 47% of the variance. The loadings on PC1 revealed that MonounsaturatedFat and StarchDigestion were the dominant contributors, indicating that variations in lipid metabolism and carbohydrate processing were key in this group (Figure 3(a)). For the Digestive and Absorption cluster, PC1 accounted for around 44% of the variance, with Gluten and Omega3Fat emerging as the most influential variables (Figure 3(b)). In the Immunity and Antioxidants cluster, PC1 captured over 80% of the variance, with VitaminB12 contributing overwhelmingly to this group (Figure 3(c)). These analyses are exploratory and illustrate associations rather than causal relationships.
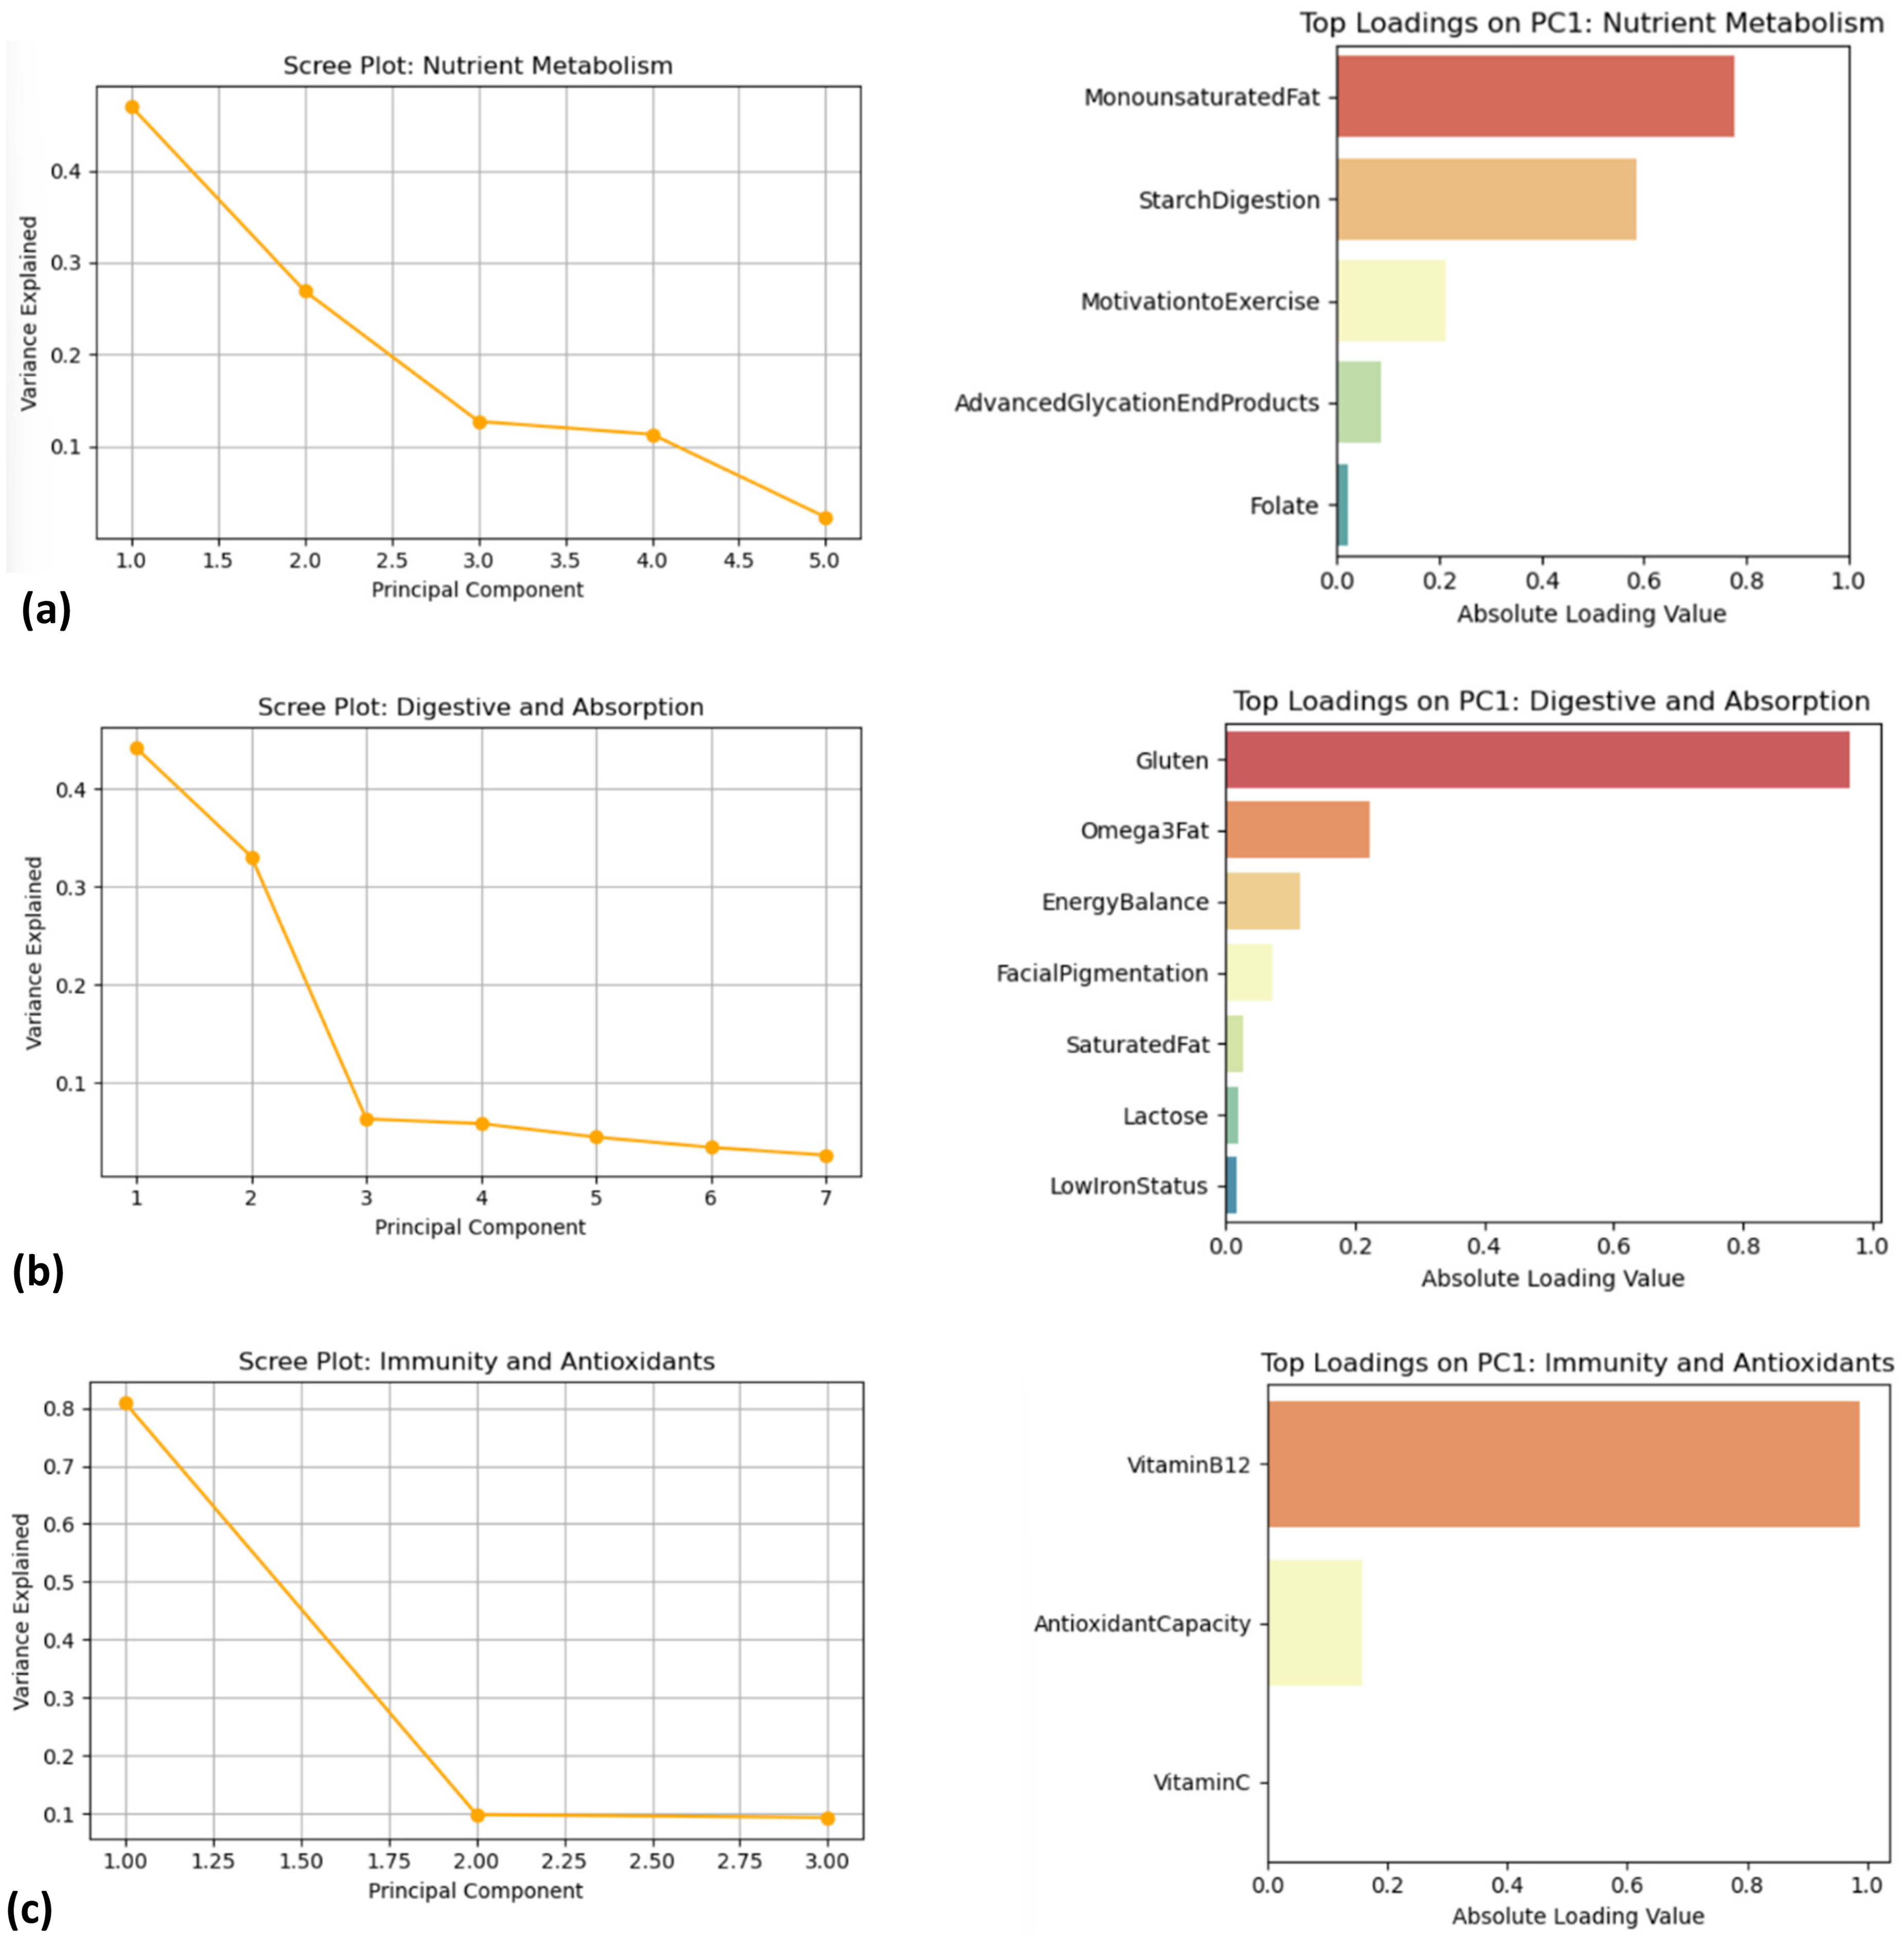
(a) Plots showing variance contribution and top loadings for the nutrient metabolism cluster. (b) Plots showing variance contribution and top loadings for the Digestive and Absorption cluster. (c) Plots showing variance contribution and top loadings for the Immunity and Antioxidants cluster.
Overlaying the PCA biplots with both gender and regional labels provided descriptive visualisations of how demographic factors intersect with variance structure. In the Nutrient Metabolism cluster, the PCA biplot overlaid with gender showed that female participants tended to cluster in areas associated with higher loadings of MonounsaturatedFat and StarchDigestion (Figure 4(a)). This suggests that women in the dataset were more frequently classified in categories related to fat and carbohydrate processing, though the functional significance of this difference cannot be determined from the present dataset. The regional overlay further revealed that, while the majority of individuals from Oceania and Europe clustered around the central ‘Typical’ area, a subset of Asian individuals appeared to diverge slightly, indicating variation in classifications that may warrant further investigation (Figure 4(b)). For the Digestive and Absorption cluster, the PCA biplot indicated that components such as Gluten, Lactose, and Omega3Fat are key contributors to variability. When gender was considered, both male and female participants largely overlapped; however, subtle differences in classification patterns were observed (Figure 4(c)). The regional overlay was more striking in this cluster. Asian individuals more frequently appeared in areas corresponding to higher classifications for Gluten and Lactose intolerance, which aligns with known historical dietary patterns and lower lactase persistence in these populations. In contrast, participants from America and Europe tended to display more moderate or ‘Typical’ classifications for these components (Figure 4(d)). In the Immunity and Antioxidants cluster, the gender overlay showed a relatively uniform distribution between males and females, though there was a slight tendency for one group to align with higher VitaminB12 loadings (Figure 4(e)). Regionally, the biplot indicated that while individuals from Oceania and Europe clustered towards higher antioxidant capacity, Asian subjects showed a modest shift in classification patterns (Figure 4(f)). These demographic overlays are descriptive and exploratory, and their functional or clinical significance cannot be determined from the present dataset.
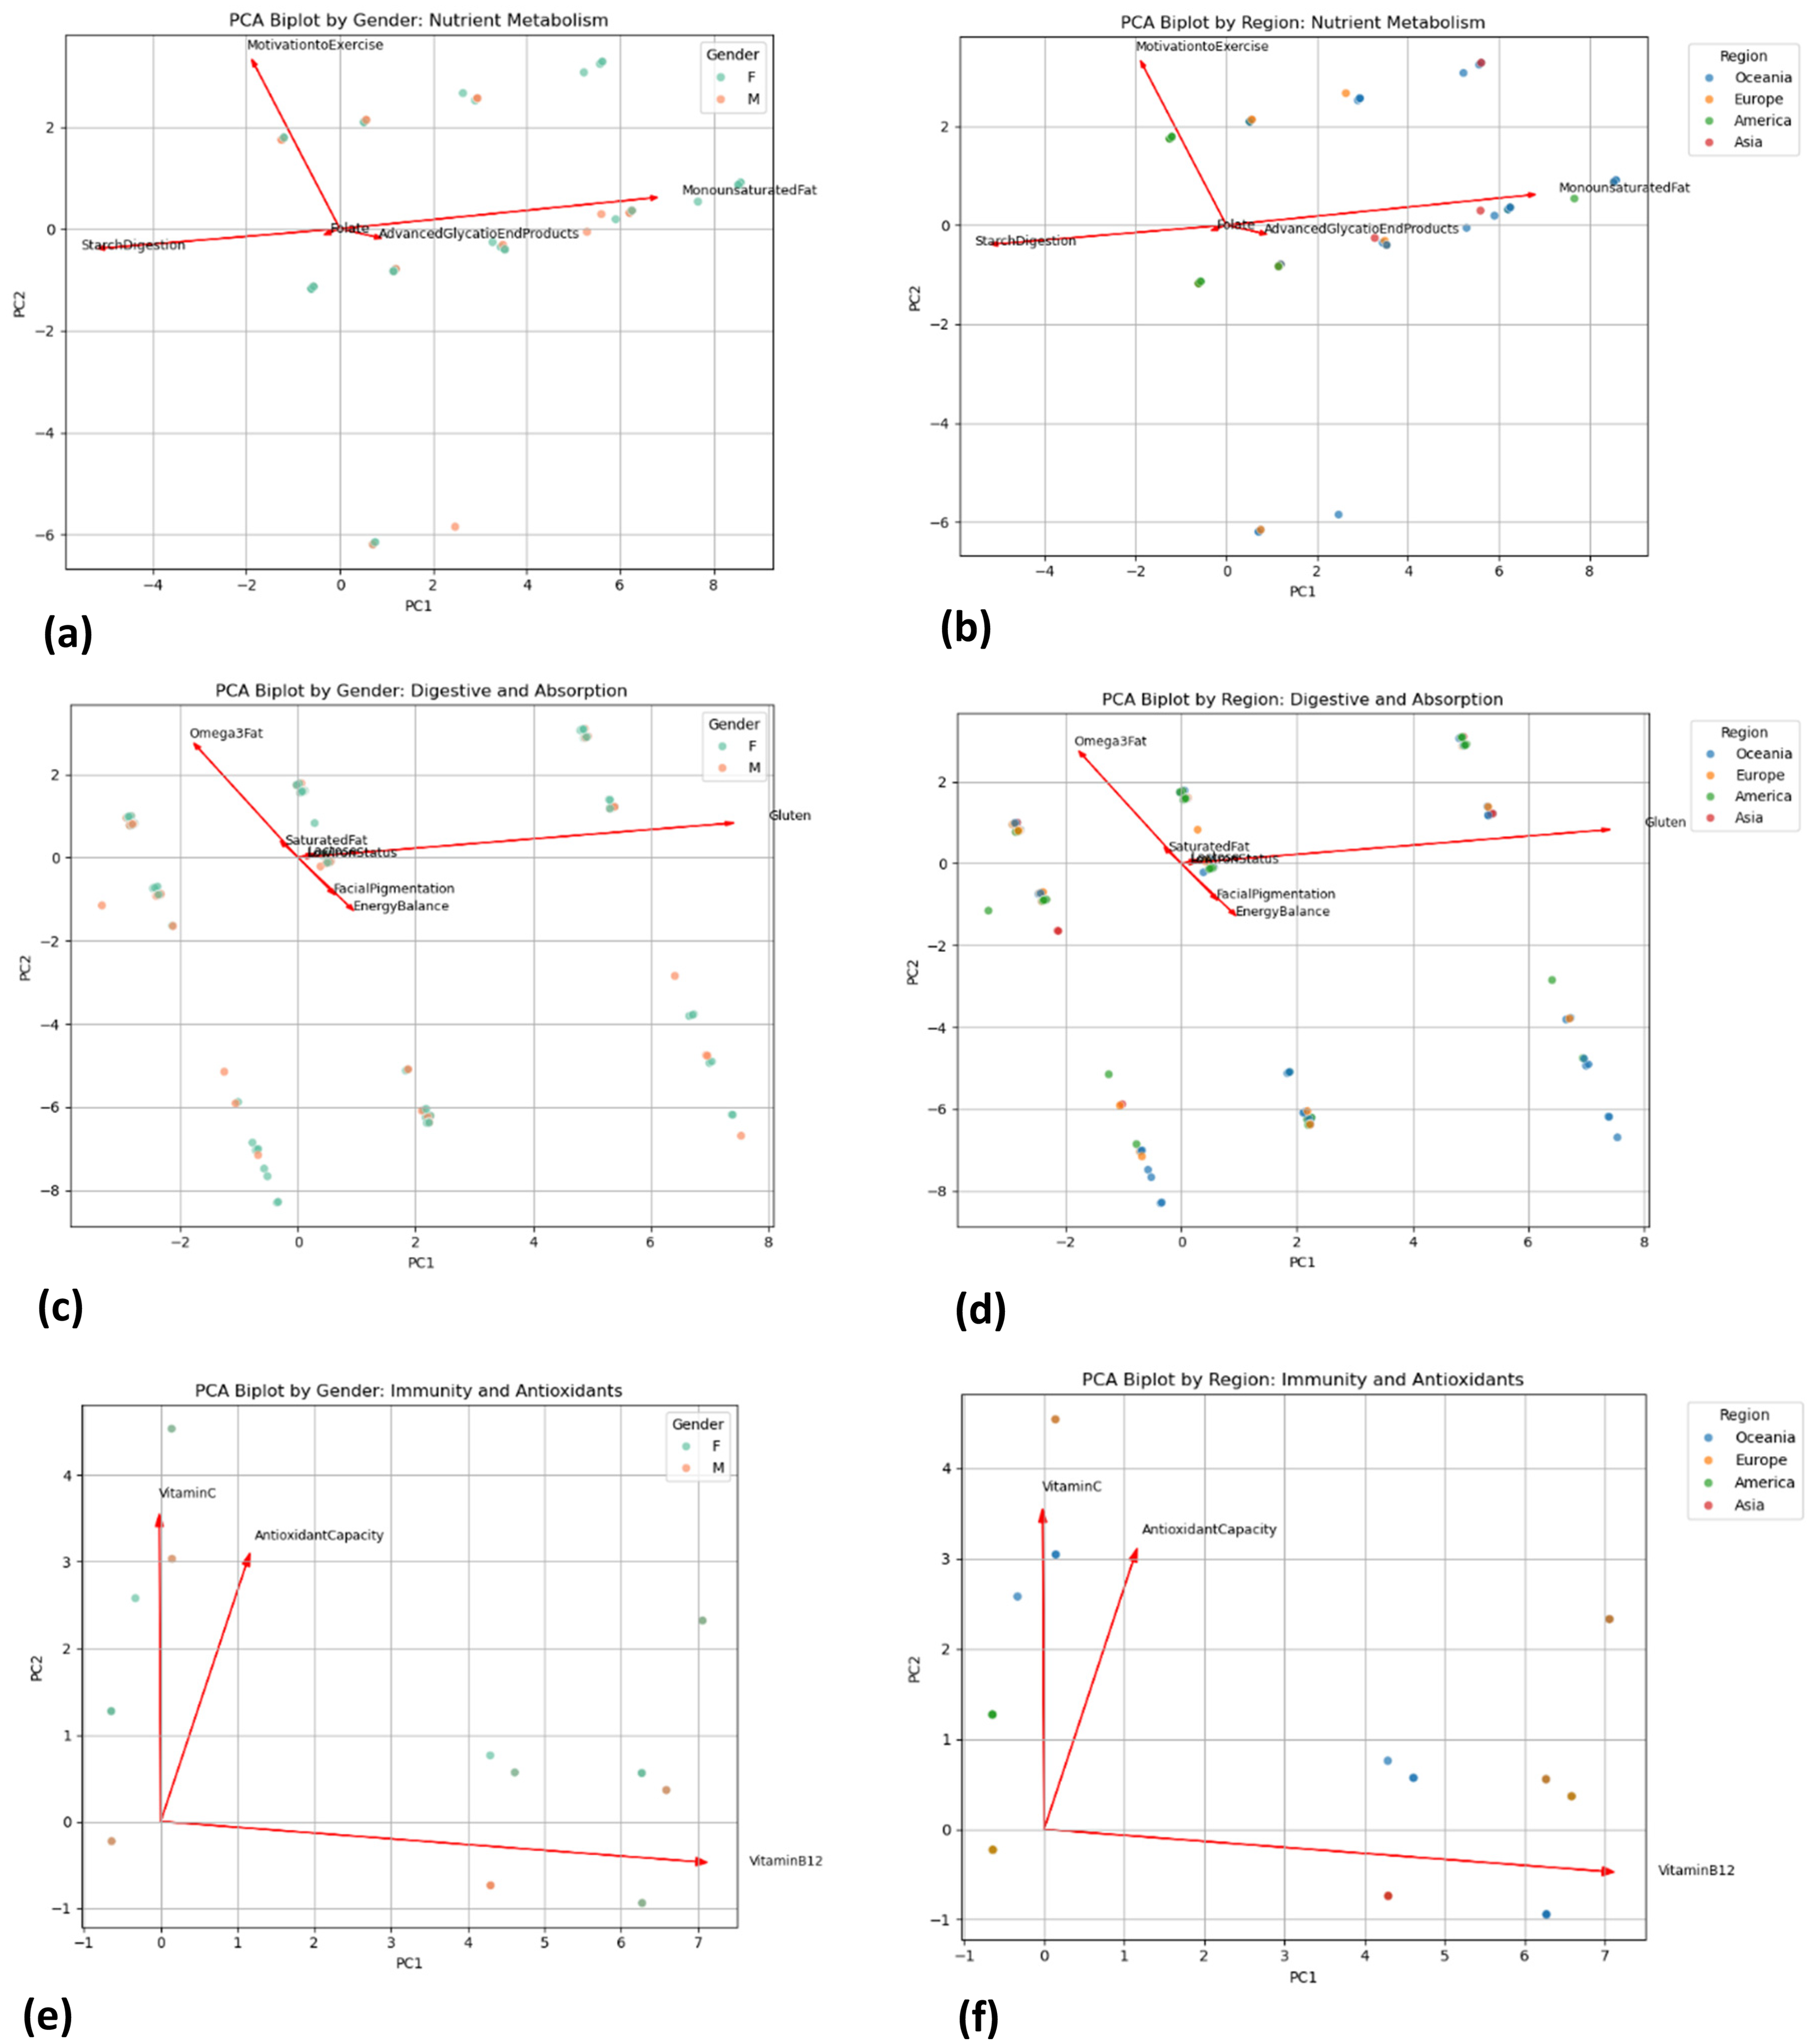
(a) Biplots by gender for nutrient metabolism cluster. (b) Biplots by region for nutrient metabolism cluster. (c) Biplots by gender for digestive and absorption cluster. (d) Biplots by region for digestive and absorption cluster. (e) Biplots by gender for immunity and antioxidants cluster. (f) Biplots by region for immunity and antioxidants cluster.
Although predictive modelling was initially considered, with the aim of using demographic variables (gender and region) to predict an individual's dominant cluster, the modelling approach was ultimately not pursued. This was because complete-observation cleaning in the case of the random forest classifier removed all 503 observations, preventing estimation of this model. The multinomial regression converged. However, because the largest cluster comprised 64% of participants, the model defaulted to predicting the majority class for every individual, producing an overall accuracy of 0.66 with zero precision and recall for all other clusters. Consequently, attempting to model outcomes under such conditions of extensive missingness and class imbalance compromised reliability and generalisability, underscoring that predictive modelling is not viable with the descriptive nature of the dataset.
Discussion
This study contributes to the growing body of work examining how genomic information may inform personalised nutrition research, particularly when demographic context is considered. In our dataset, females were more frequently classified in higher categories for omega-3/6 fatty-acid metabolism, consistent with prior reports of sex-specific variability in nutritional genomics. Corella et al. (2018) noted that ignoring sex can obscure such effects while recent trials by Di Renzo et al. (2023) confirm divergent male–female responses to identical Mediterranean diets. These findings suggest that sex-linked differences remain an important consideration in nutrigenomic research.
Regional patterns were equally evident. Elevated lactose-intolerance classifications among Asian participants reflect the low historical prevalence of lactase-persistence alleles in East Asia, in contrast to their higher frequency in Northern Europeans (Laland et al., 2010). Vitamin D insufficiency signals were also strongest in Asian groups, consistent with previous work suggesting interactions between tropical ancestry and UV exposure in temperate settings. Differences in fatty-acid desaturase genes and HLA alleles may contribute to regional variability in omega-3 metabolism and gluten sensitivity, respectively. Multi-ethnic consortia such as GeNuIne have confirmed that gene-diet associations often diverge by ancestry (Vimaleswaran, 2021), reinforcing the importance of considering population context in nutrigenomic studies (Ordovas et al., 2018).
Beyond individual traits, our clustering revealed domains spanning nutrient metabolism, digestion/absorption, and antioxidant-immune processes. Such groupings are consistent with evidence that metabolic and inflammatory pathways are genetically intertwined (Ducheix et al., 2013; Farras et al., 2013). A cluster linking exercise motivation with metabolic traits may reflect shared pathways. Reddon et al. (2016) provide evidence for such interplay, showing that physical activity can modulate the effect of genetic obesity risk. These networks highlight the potential value of examining sets of related traits rather than isolated variants, for example, combining antioxidant-rich diets with anti-inflammatory strategies for individuals exhibiting coupled oxidative and inflammatory classification categories.
In conclusion, this exploratory study indicates that:
Gender-linked differences are detectable in omega-3/6 fatty-acid metabolism. Ancestry-linked variation is apparent in lactose tolerance, vitamin D biology and gluten sensitivity. Nutrition-related genetic traits can be grouped into broader physiological domains, offering a system-level perspective on trait organisation.
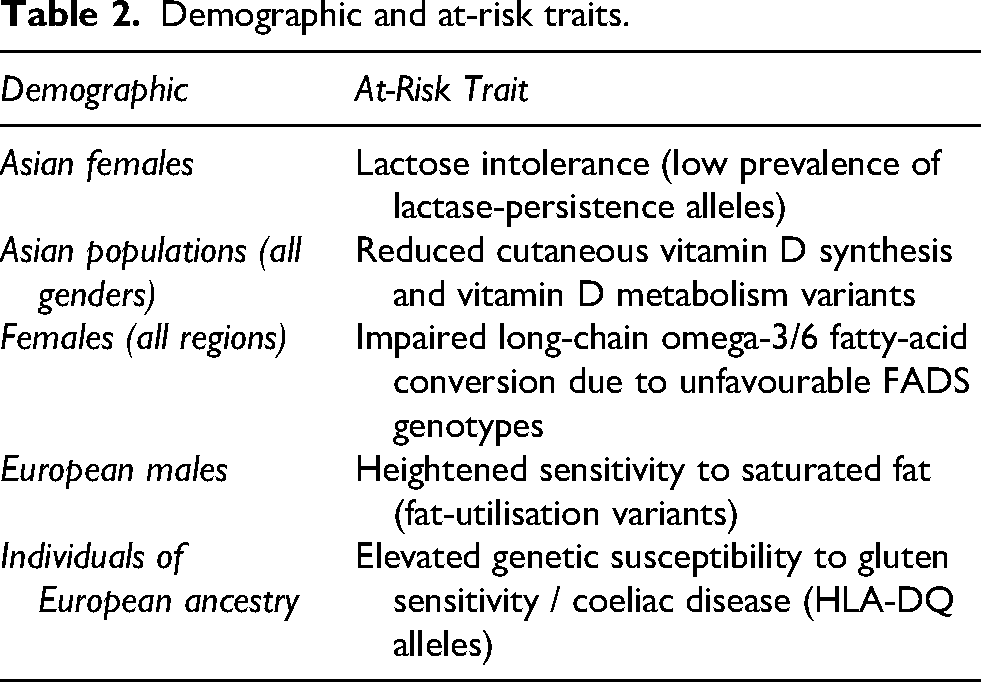
Table 2 presents the summary of demographic domains and their observed at-risk traits. These findings should be interpreted as descriptive signals rather than prescriptive guidance, and the observed patterns suggest hypotheses regarding demographic variation and trait clustering that warrant further investigation.
Demographic and at-risk traits.
Limitations
Several limitations should be acknowledged, which, however, do not diminish the overall significance of the findings. The cohort was drawn from a single commercial gene-testing program, and clinical outcomes were not tracked, preventing direct assessment of intervention benefit. Missing data posed a major obstacle: clients completed one of two panels, leaving many traits unmeasured per individual. The requirement for complete observations eliminated all records from the random forest classifier, while class imbalance skewed multinomial regression toward the majority cluster, illustrating the practical difficulty of multivariate modelling with sparse matrices. Such data gaps are common in nutrigenomics (Ordovas et al., 2018), and underline the logistical challenges of assembling comprehensive, multi-layer datasets. The hierarchical clustering process itself relies on a subjective choice of dendrogram cut height, meaning that raising or lowering this threshold would merge or split clusters differently and could alter downstream PCA and interpretation. Small subsamples in certain demographics (e.g., small number of observations from Asia) further limited power to detect subtler gene-diet interactions. Finally, direct-to-consumer classifications convey probabilistic, not deterministic, information, and unmeasured gene-gene and gene-environment interactions could attenuate or amplify the profiles reported here. Additional considerations also apply. The dataset reflects a self-selected, health-conscious clientele from a single New Zealand clinic and is therefore not representative of the general population. This self-selection may bias observed allele-frequency patterns, as individuals seeking direct-to-consumer testing may differ systematically from the general population in variant frequencies or health behaviours, thereby limiting extrapolation beyond such user groups. The commercial panel used is curated by the provider, and the strength of evidence supporting individual variants varies. To improve transparency, the specific SNPs corresponding to each component are listed in Supplementary Table S1. However, the absence of phenotypic, biomarker, and outcome data means that the functional and clinical significance of these classifications cannot be determined. Moreover, observed allele-frequency differences do not necessarily imply functional or physiological effects, as variant penetrance, gene-gene interactions, and environmental influences were not evaluated.
Taken together, these limitations may directly constrain the interpretation of the findings. The probabilistic nature of direct-to-consumer classifications, sparse and uneven SNP coverage, potential misclassification, and a self-selected, non-representative user base may limit biological inference and generalisability. As a result, the observed demographic patterns and trait clusters should be interpreted as descriptive and exploratory, reflecting tendencies within this dataset rather than supporting predictive, causal, or clinically actionable conclusions.
Despite these constraints, the study offers a useful exploratory snapshot of how sex and ancestry may shape genetic classifications and how those classifications can coalesce into broader clusters. Larger, prospective investigations that integrate dietary intake, biomarkers and longitudinal outcomes, are needed to test whether these descriptive patterns hold in more diverse populations.
The translational potential remains a subject for future evaluation. Trials such as Food4Me already show that personalised feedback can increase dietary adherence (Celis-Morales et al., 2017), and emerging machine-learning work suggests that polygenic scoring can explain up to 28% of weight-loss variability (Ramos-Lopez et al., 2020). Nevertheless, larger multi-ethnic cohorts and controlled intervention studies remain essential to determine whether gene-tailored approaches confer clinically significant advantages over standard guidelines. As the field matures, integrating rigorous genetic testing, culturally contextualised counselling and robust longitudinal evaluation will be critical for assessing whether personalised nutrition can move from proof-of-concept into routine practice.
Supplemental Material
sj-docx-1-nah-10.1177_02601060251415144 - Supplemental material for Personalising nutrition and lifestyle recommendations: Analysis of gene-test reports by individual and geographic differences
Supplemental material, sj-docx-1-nah-10.1177_02601060251415144 for Personalising nutrition and lifestyle recommendations: Analysis of gene-test reports by individual and geographic differences by Serene Chua, Mahsa Mohaghegh, Sharad P Paul and Victor Miranda in Nutrition and Health
Footnotes
Acknowledgements
We thank Dr Sharad P Paul for his contribution and sharing of gene-test reports for the analysis in this study.
Ethical approval
The institutional committee decided that no ethical approval was required for this study, as the analysis was based on anonymised gene-test reports obtained from a commercially available direct-to-consumer gene-test program. As this study only retrospectively involved already deidentified and depersonalised data, with no access to direct or indirect personal identifiers, formal ethics approval was considered not applicable. Approval from the data owner, Dermatogenomix®, was obtained and non-disclosure agreement was signed prior to the start of the study.
Consent for publication
We confirm that the manuscript has been read and approved by all named authors and that there are no other persons who satisfied the criteria for authorship but are not listed. We further confirm that the order of authors listed in the manuscript has been approved by all of us.
Authors’ contributions
Conceptualization by Sharad P Paul. Project administration by Victor Miranda. Project supervision by Sharad P Paul, Mahsa Mohaghegh and Victor Miranda. Formal analysis and writing for draft preparation by Serene Chua. Review and editing of writing by Sharad P Paul, Mahsa Mohaghegh and Victor Miranda. All authors have read and agreed to the published version of the manuscript.
Funding
The authors received no financial support for the research, authorship, and/or publication of this article.
Declaration of conflicting interests
The authors declared no potential conflicts of interest with respect to the research, authorship, and/or publication of this article.
Availability of data and materials
Data for this study are available upon request and subject to consideration and approval from Sharad P Paul.
Supplemental material
Supplemental material for this article is available online.