
Abstract
Background
There is a paucity of research on the characteristics of this ever-growing market in Türkiye, where consumer demand has been rapidly increasing. Also, the environmental impact of the packaging materials is another current issue that needs to be focused on for these disposable products.
Aim
This study aims to analyze and reveal the nutritional contents, costs, and some other characteristics, such as allergenic contents and packaging materials, of the ready-to-eat meals (RTEs) sold in supermarkets in Türkiye.
Methods
The label information of 245 products was noted, and these products were categorized as main dishes, side dishes, and soups; subsequently, their 100 g and portion-based nutritional contents were compared with recommendations.
Summary
Main dishes contain higher energy, fat, saturated fat, and proteins when compared to side dishes and soups (p < 0.001). In the side dishes, the amount of fat and protein increases directly with the price. The amount of energy, saturated fat, and protein decreases as the portion weight increases (p < 0.05). The amount of salt in the main and side dish categories is above the limits (+0.3 g and +0.14 g, respectively). Wheat-based gluten was the most common allergen and plastic was found the most commonly used packaging material. The energy contents of the RTEs were found within the recommendations. It is also noteworthy that these products contain higher amounts of salt, and they also contain at least one food allergen.
Introduction
Even though the COVID-19 pandemic is almost over, the significant impacts of obesity, which can be considered a more common and chronic disease for humans, still continue. According to Organisation for Economic Co-operation and Development (OECD) reports, 64.4% of adults in Türkiye were struggling with excessive weight and obesity in 2017 (Organisation for Economic Cooperation and Development Data, 2021). According to the 2022 report of World Obesity Atlas, by the year 2030, with 42.1% of its entire population struggling with obesity, Türkiye is presumed to overtop countries (Barata Cavalcanti et al., 2022).
Türkiye is among the top 10 countries to budget for obesity-based diseases between 2020 and 2050. The country is also presumed to allocate 12% of its healthcare budget to obesity-based diseases (Sassi, 2010). The healthcare expenditures of OECD countries for obesity and other related diseases between 2020 and 2050 are presumed to be 8.4% (Obesity Policy Engagement Network (OPEN)-EU, 2020). It is emphasized that unhealthy dietary practices play a significant role, and approximately 4.1 million deaths worldwide are caused by excessive consumption of salt/sodium (World Health Organization (WHO), 2022). The most important problem caused by unhealthy dietary habits is unbalanced energy intake, and consuming food products that are rich in energy brings the consumption of higher saturated fat, carbohydrates, and salt. Along with the technological advancements in food production, the production of easily-consumed high-energy food products has become increasingly common (Swinburn et al., 2011).
The concept of ready-to-eat meals (RTEs) refers to precooked and ready-to-eat products that require minimum or no time to heat and are consumed without requiring extra treatments (Howard et al., 2012). Although there are no sharp limits that distinguish convenience food products from RTE meals, they are conceptually very close to each other, and RTE meals look like a part of convenience food products. One of the most precise definitions of RTEs is that these products can be consumed without any additional processes and cooking unless the consumer wishes to do otherwise. These products can be sold in various packaging materials in retail stores, supermarkets, and online shops (Euromonitor International, 2020; Verriet, 2013). The European food industry association reported that the RTEs industry is the third most innovative industry worldwide (Food Drink Europe, 2020). According to the data from a research company, the RTE market is expected to grow 4.62% from 2022 to 2027. While Europe is currently the largest market, Türkiye is among the countries with a lower market share despite its geographical advantage (Mordor Intelligence Analysis, 2021). The total income in the RTEs market was $4.9 billion in 2022. This market is expected to grow by 12.45% annually (Statistics portal for market data, 2021). According to the 2019 Household Consumption Expenditure statistics of the Turkish Statistical Institute, before the pandemic, food and nonalcoholic beverage expenditures were ranked second with 20.8% among all consumption expenditures (Turkish Statistical Institute, 2020). Although consumption of RTEs is still traditionally linked to reasons such as saving time and requiring no additional effort to cook meals, there are now also other factors, such as extended shelf life, sterility, and forming another version of dining out by purchasing food products that cannot be cooked at home (Scholliers, 2015).
The effects of this rapidly increasing form of eating on individuals’ diets are definitely important. Recently, cooking at home has been dropping off the map, and these product types are becoming significant parts of diets in preventing diet-related, particularly obesity-related, chronic diseases and maintaining and supporting healthy diets (van der Horst et al., 2011). The contents of RTEs have been studied in the United Kingdom (UK), Hungary, Greece, Australia, and some other countries in accordance with the food product types in their local supermarkets (AlOudat et al., 2021; Giazitzi et al., 2021; Howard et al., 2012; Wooldridge et al., 2021). However, there are no studies regarding the variety, contents, and other characteristics of this ever-growing market in Türkiye, where consumer demand has been rapidly increasing.
This study aims to analyze and reveal the nutritional contents, costs, and some other characteristics, such as allergenic contents and packaging materials, of the RTEs sold in supermarkets in Türkiye. In accordance with this purpose, the RTE meals sold in supermarkets were noted, their nutritional contents were analyzed according to their label information, and the costs, packaging materials, and product varieties were examined.
Materials and methods
Product selection and data collection
This cross-sectional study analyzes the nutritional contents, prices, allergenic contents, and packaging information of 245 RTEs sold in supermarkets in Eskişehir, Türkiye. The relevant data were collected from 48 different brands from the six different supermarkets belonged to the largest supermarket chain between September 2021 and June 2022. The data were collected from the largest supermarket chains with many stores across Türkiye, not from local or regional supermarkets. Data were collected for all available RTEs, not just a selected number of brands.
The product selection criteria within the scope of the definition of RTEs were determined as follows: precooked meals, meals that require minimum (5 min or less) or no time to heat to consume, the meals that belong to main or side dish categories, and consumed without requiring any additional treatments. Frozen (n = 19), chilled (n = 97), and shelf-stable (n = 129) products were included in this study among all products that are sold within this context. Desserts and products labeled according to special diet conditions (vegan, lactose-free, fat-free, etc.) were excluded. Two products were selected from supermarket-owned brands; others were produced and packed by a manufacturer and sold at these supermarkets. Our study does not include products manufactured by households. However, products with unexpired use-by dates from retail brands with large-scale production and distribution networks have been included. Furthermore, products with use-by dates close to expiry that have been discounted have been excluded from the study.
The researchers first informed the supermarkets about the purpose and contents of this study through e-mail. Then two researchers went to the supermarkets and reviewed the products on different dates, took photographs of the front and back of the product packages, and noted this information in the data record form. Then, the researchers worked together to evaluate each product they noted and included only the products they 100% agreed on in line with the inclusion criteria of this study. The data includes the following: the full name of the product, the manufacturer, the packaging material, the weight of the product, portion amount, price, nutritional informations per 100 g in nutritional ingredients chart on the product label such as energy, carbohydrates, sugar, fibers, protein, fat, saturated fat, salt, and allergen information. When founded missing or different information, the researchers returned to the supermarkets and eliminated any incomplete or incorrect information. For example, if there is any price difference, the prices are averaged and the resulting price is included in the analysis.
In Türkiye, the Food Labelling and Customer Notification Regulation of Turkish Food Codex dated 26.01.2017 no: 29960 requires food product labels and ingredients list to clearly show allergen information. Therefore, within the scope of this statement, these allergenic ingredients that should legally be specified on the label are gluten-containing wheat, dairy products, crustaceans, egg, fish, peanut, soybean, nuts, celery, mustard, sesame, lupine, mollusks, and their derivatives and sulfur dioxide and sulfides (Turkısh Ministry of Food and Agriculture, 2017). Therefore, the allergens and the allergenic ingredients in products included in this study were evaluated within this frame.
The products regarded as main dishes were particularly selected to include an amount equal to at least one portion of animal protein, such as red meat, white meat, fish, egg, or cheese (Turkish Ministry of Health, 2022). On the other hand, salads, bowls, rice, appetizers, meatless legume meals, etc., were included in the side dishes category. Even though the soups are within the side dishes category, the researchers preferred to consider soups as a separate category since there is a great variety of soups, these are offered separately from the side dishes on menus, and the people in Türkiye are accustomed to consuming soups as a single dish in a meal (Flood and Rolls, 2007).
The prices were analyzed in TL (₺) and Euro (€) based on September 2022 exchange rates and food prices. The prices were analyzed in Euro because a great deal of businesses carry out their transactions in this currency, and the results of this study can be compared with other currencies (Blanco, 2001; Šimáková et al., 2019). On 15 September 2022, the Central Bank Euro purchase price was 18.24 Turkish Liras.
Evaluation of nutritional information
The energy (kcal), fat (g), saturated fat (g), carbohydrates (g), sugar (g), dietary fiber (g), protein (g), and salt (g) amounts per 100 g were noted from the nutritional information chart on the product labels. The amounts per edible portion were also calculated by using total product weight in accordance with the label information, and the standard portion amounts of food groups specified in the Turkish Nutritional Guide (TUBER) were used when the portion amounts were not specified (Turkısh Ministry of Health, 2015).
Since there are still no conclusive suggestions regarding the amount of energy and macronutrients per portion, the daily energy intake recommendations of WHO and the principle of sufficient and balanced compensation through the homogenized distribution of energy intake among main meals were acknowledged in similar studies. Based on the fact that usually about 30–35% of energy is taken during lunch or dinner, it may be concluded that the recommendation of WHO of 2000kcal daily energy intake for adults may be met by taking 600–700 kcal energy during lunch or dinner (AlOudat et al., 2021; EU, 2011). Accordingly, the cut-off points for nutritionally balanced meals values used by Giazitzi et al. (2021) based on the recommendations of WHO and United Kingdom public healthcare services were taken recommended intakes (RIs) as references for macronutrients and salt intake (Giazitzi et al., 2021). Here, the cut-off points were taken as 600 kcal for energy (<30% of RI), 21 g for fats (<30% of RI), 78 g for carbohydrates (<30% of RI), 1.8 g for salt (<30% of RI), 6 g for saturated fats (<10% of energy cut-off point), and 15 g for sugar (<10% of energy cut-off point) for main dishes; 250 kcal for energy (<12.5% of RI), 9 g for fats (<12.5% of RI), 32.5 g for carbohydrates (<12.5% of RI), 0.75 g for salt (<12.5% of RI), 2.8 g for saturated fats (<10% of energy cut-off point), and 6.2 g for sugar (<10% of energy cut-off point) for side dishes. For dietary fibers, the cut-off points were taken as 30% of 25 g, TUBER's recommendation of daily intake for adults in main dishes, and 15% of 3.75 g in side dishes.
Statistical analyses
In this study, the Shapiro–Wilk test was used to test whether the continuous variables suited the normal distribution. The descriptive statistics for variables were specified as average ± standard deviation, median (minimum-maximum), and quartiles. The nutritional values and cut-off points were compared via a one-sample t-test. The Kruskal–Wallis test was used for independent intergroup comparisons. The Dunn–Bonferroni test was used for post-hoc comparisons. The Spearman correlation test was used for two continuous variable comparisons. Statistical Product and Service Solutions (SPSS) (IBM Corp. Released 2012. IBM SPSS Statistics for Windows, Version 21.0. Armonk, NY: IBM Corp.) and R program were used for statistical analyses, and p < 0.05 was considered statistically significant.
Results
Table 1 shows the descriptive information regarding the energy and nutritional ingredients in these products per 100 g and per portion. Accordingly, the energy content per portion is 266.0 kcal on median and 294.90 ± 193.42 kcal on average. The total carbohydrate content is 12.89 ± 11.61 g per 100 g and 17.63 g on median per portion. The highest amount of sugar, fat, saturated fat, and fiber per portion was found 31.51 g, 53.75 g, 24.0 g, and 20.75 g, respectively. The protein content is 8.08 ± 6.38 per 100 g and 10.82 g on median per portion. The salt content ranges between zero and 18 g, which is found to be 1.76 g on median.
Nutritional content of the products per 100 g and per portion.
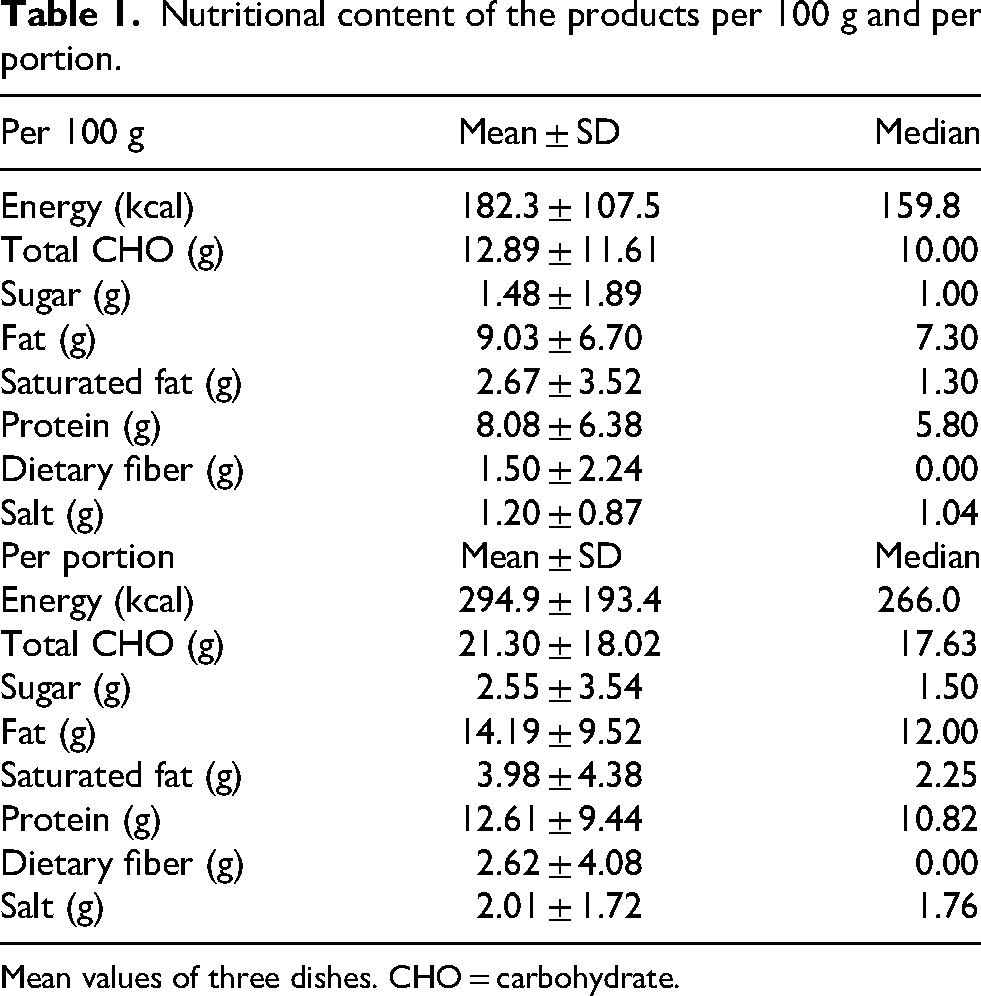
Mean values of three dishes. CHO = carbohydrate.
Table 2 shows product weights and prices and compares the products’ energy and nutritional values in accordance with three different categorizations. Accordingly, the main dish products have statistically significant and larger portion weights than those in the side dish and soup categories (p < 0.001). In addition, the main dishes are more expensive than the side dishes and soups, both per portion and 100 g. While the main dishes were found as 1.23 € on median per portion (IQR 0.82–1.43), side dishes and soups were found as 0.69 € and 0.71 € on median per portion, respectively. Accordingly, the energy, total CHO, sugar, fat, saturated fat, protein, and dietary fibers showed differences between categories (p < 0.05). Main dishes contain higher energy, fat, saturated fat, and protein than the side dishes and soups (p < 0.001). On the other hand, the side dishes contain more carbohydrates, sugar, and fibers than the main dishes and soups (p < 0.001). No significant differences were found among the main dishes, side dishes, and soups regarding salt contents (p = 0.735).
Portion weight (g) and price (EURO) evaluation and median and interquartile ranges of energy and nutrients according to categories
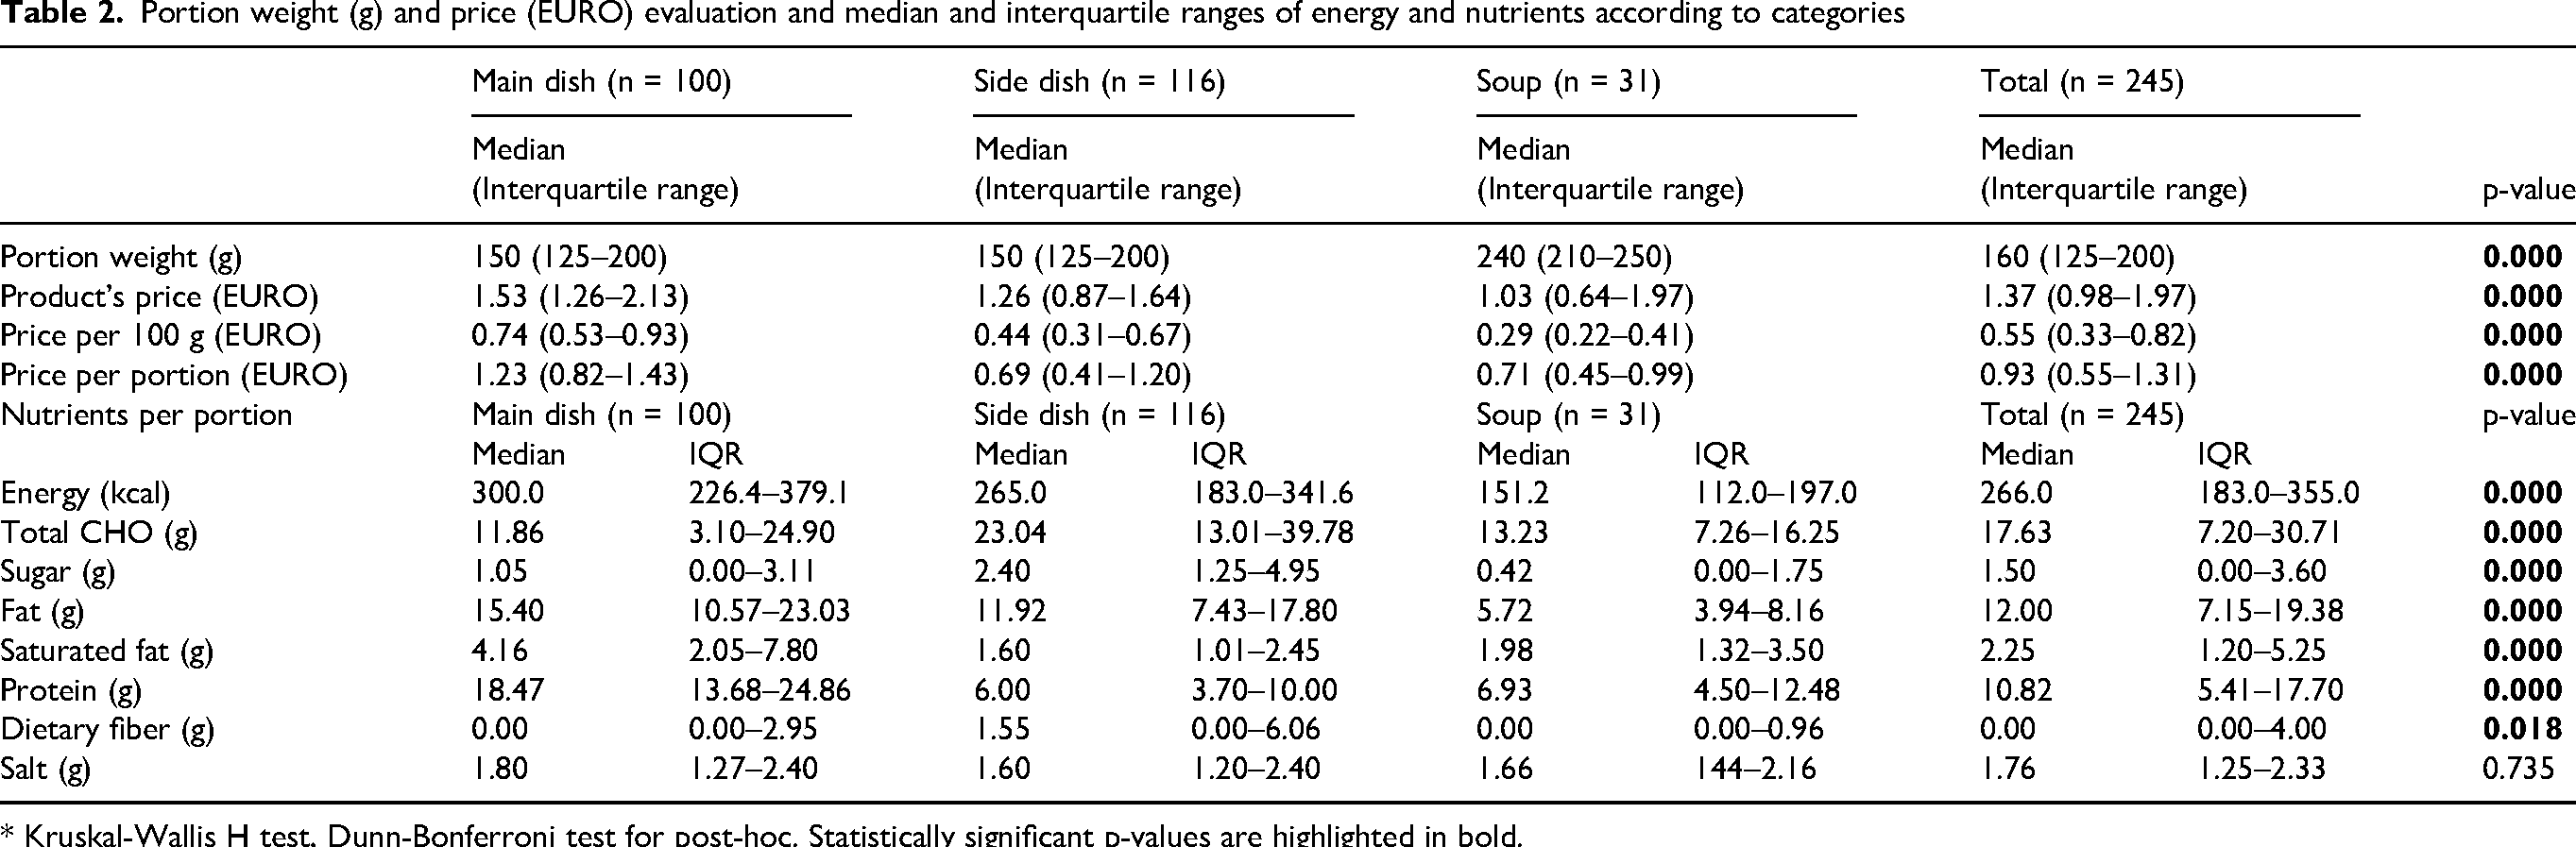
* Kruskal-Wallis H test, Dunn-Bonferroni test for post-hoc. Statistically significant p-values are highlighted in bold.
Table 3 shows the Spearman correlation test results for the nutritional ingredients evaluation of portion price and weight. Accordingly, the energy, fat, and saturated fat elements in the main dish category were found to be correlative with the price per portion (p < 0.05). The energy, fat, and saturated fat amounts decrease as the price per portion increases. Weight per portion, on the other hand, was found to be correlated with energy, carbohydrates, sugar, fat, saturated fat, protein, and fibers (p < 0.05). The energy, fat, saturated fat, and protein amounts decrease, and the carbohydrates, sugar, and fibers increase as the portion weight increases. In the side dish category, fats and proteins were found to be correlated with the price per portion; energy, saturated fat, and protein were found to be correlated with the weight per portion (p < 0.05). The amount of fats and proteins increases as the price per portion increases. Energy, saturated fat, and protein amounts decrease as the weight per portion increases. In the soups category, the protein increases as the weight per portion increases, and fiber decreases as the weight per portion increases.
The correlation of price and weight per portion with the energy and nutrients in the main dish, side dish, and soup categories.
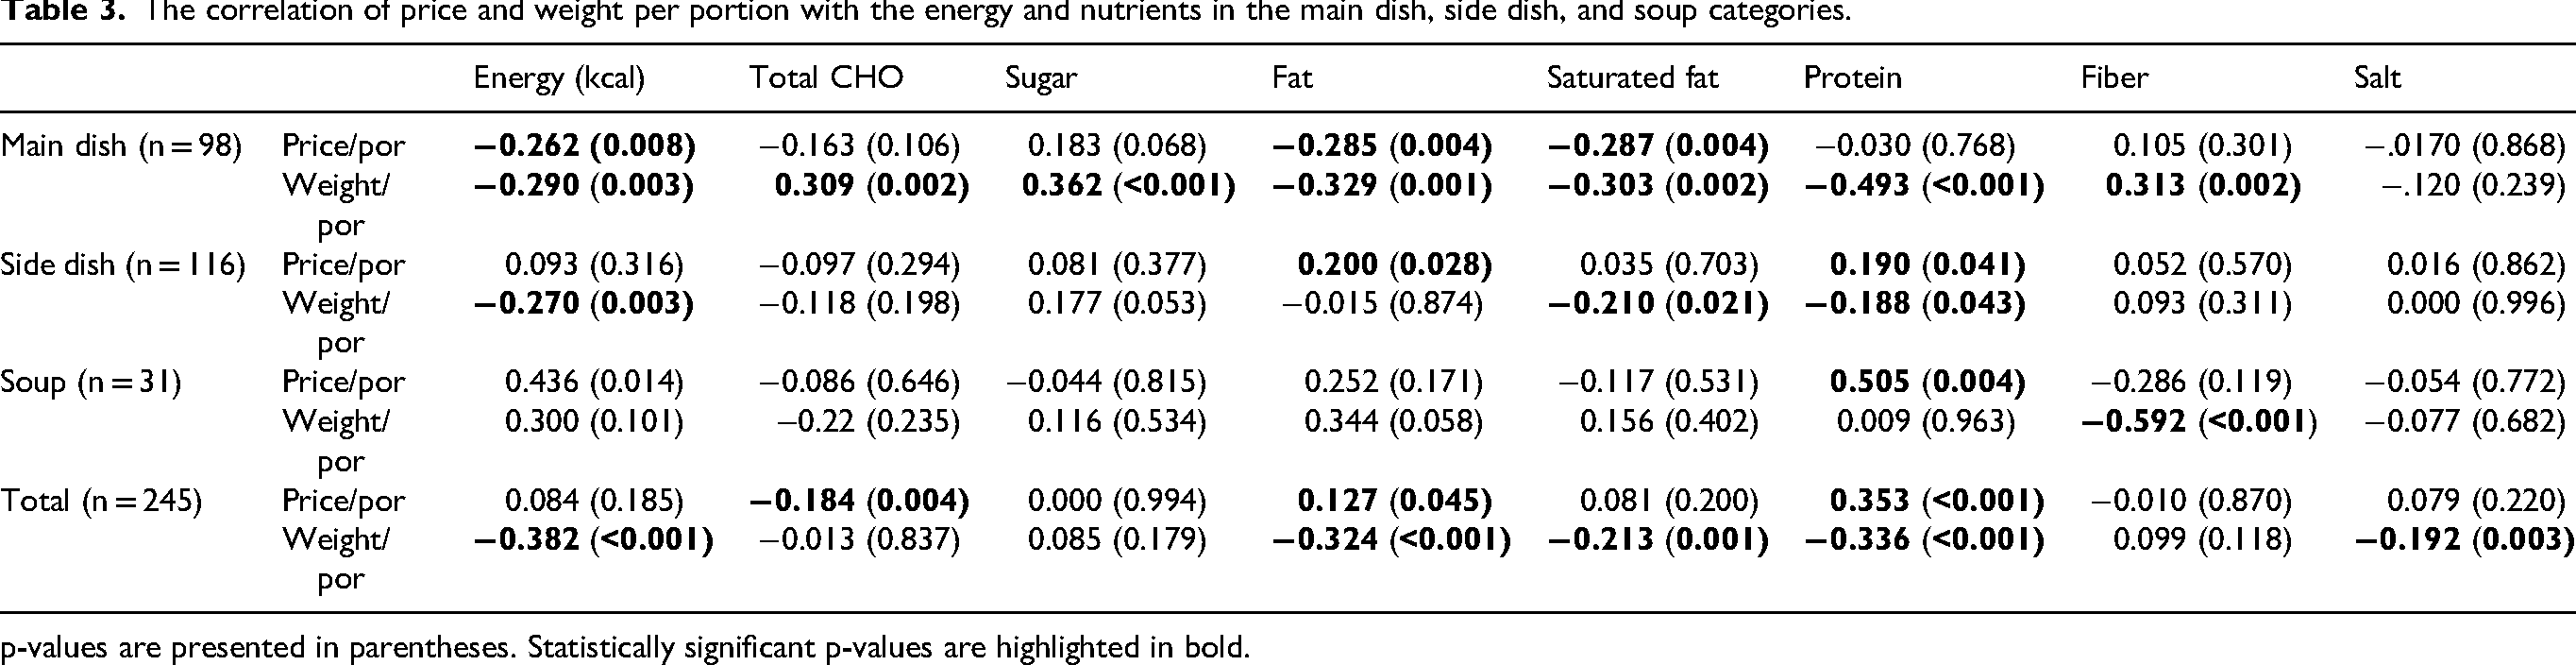
p-values are presented in parentheses. Statistically significant p-values are highlighted in bold.
Table 4 shows whether these products meet the energy and nutrients in accordance with the reference cut-off points. The positive percentage increase in salt content (17.5% and 18.8%, respectively for main and side dishes) indicates an increase rather than a decrease. All other values (energy, carbohydrates, sugars, fats, saturated fats and salt in side dishes and soups) show a decrease. All nutrients except salt were below the references in the main and side dish categories. However, the amount of salt was found to be above the limits in the main and side dishes (+0.3 g and +0.14 g, respectively). In the main dish category, carbohydrates (%−79.6), sugar (%−88.9), and fat (%−16.0) were found to be statistically low (p < 0.05). As a result, both the main and side dish categories have energy contents below the energy cut-off points (%−47.0 and %−49.7, respectively). On the other hand, the soups were found to be below all reference cut-off points in all nutrients.
Percent mean deviation per portion between the nutritional value of main dishes, side dishes, and soups.
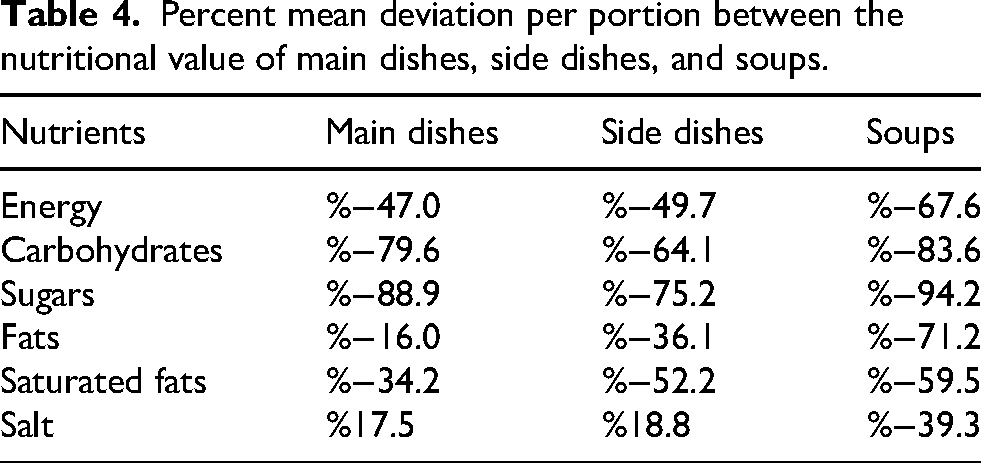
Figure 1A shows the allergenic contents of the products. Approximately three-fourths of all products (72.1%) contain at least one food allergen. Wheat-based gluten was the most common allergen found in these products (32%). Wheat-based gluten was followed by milk and dairy products (24.2%) and eggs (12.7%). The percentage of other allergens was 10% or lower in these products. Figure 1B shows the packacing materials of the products. Plastic boxes (35.1%), tin can (21.5%), and plastic bags (17.1%) are the most commonly used packaging materials. The usage rate of other packaging materials is less than 10%.
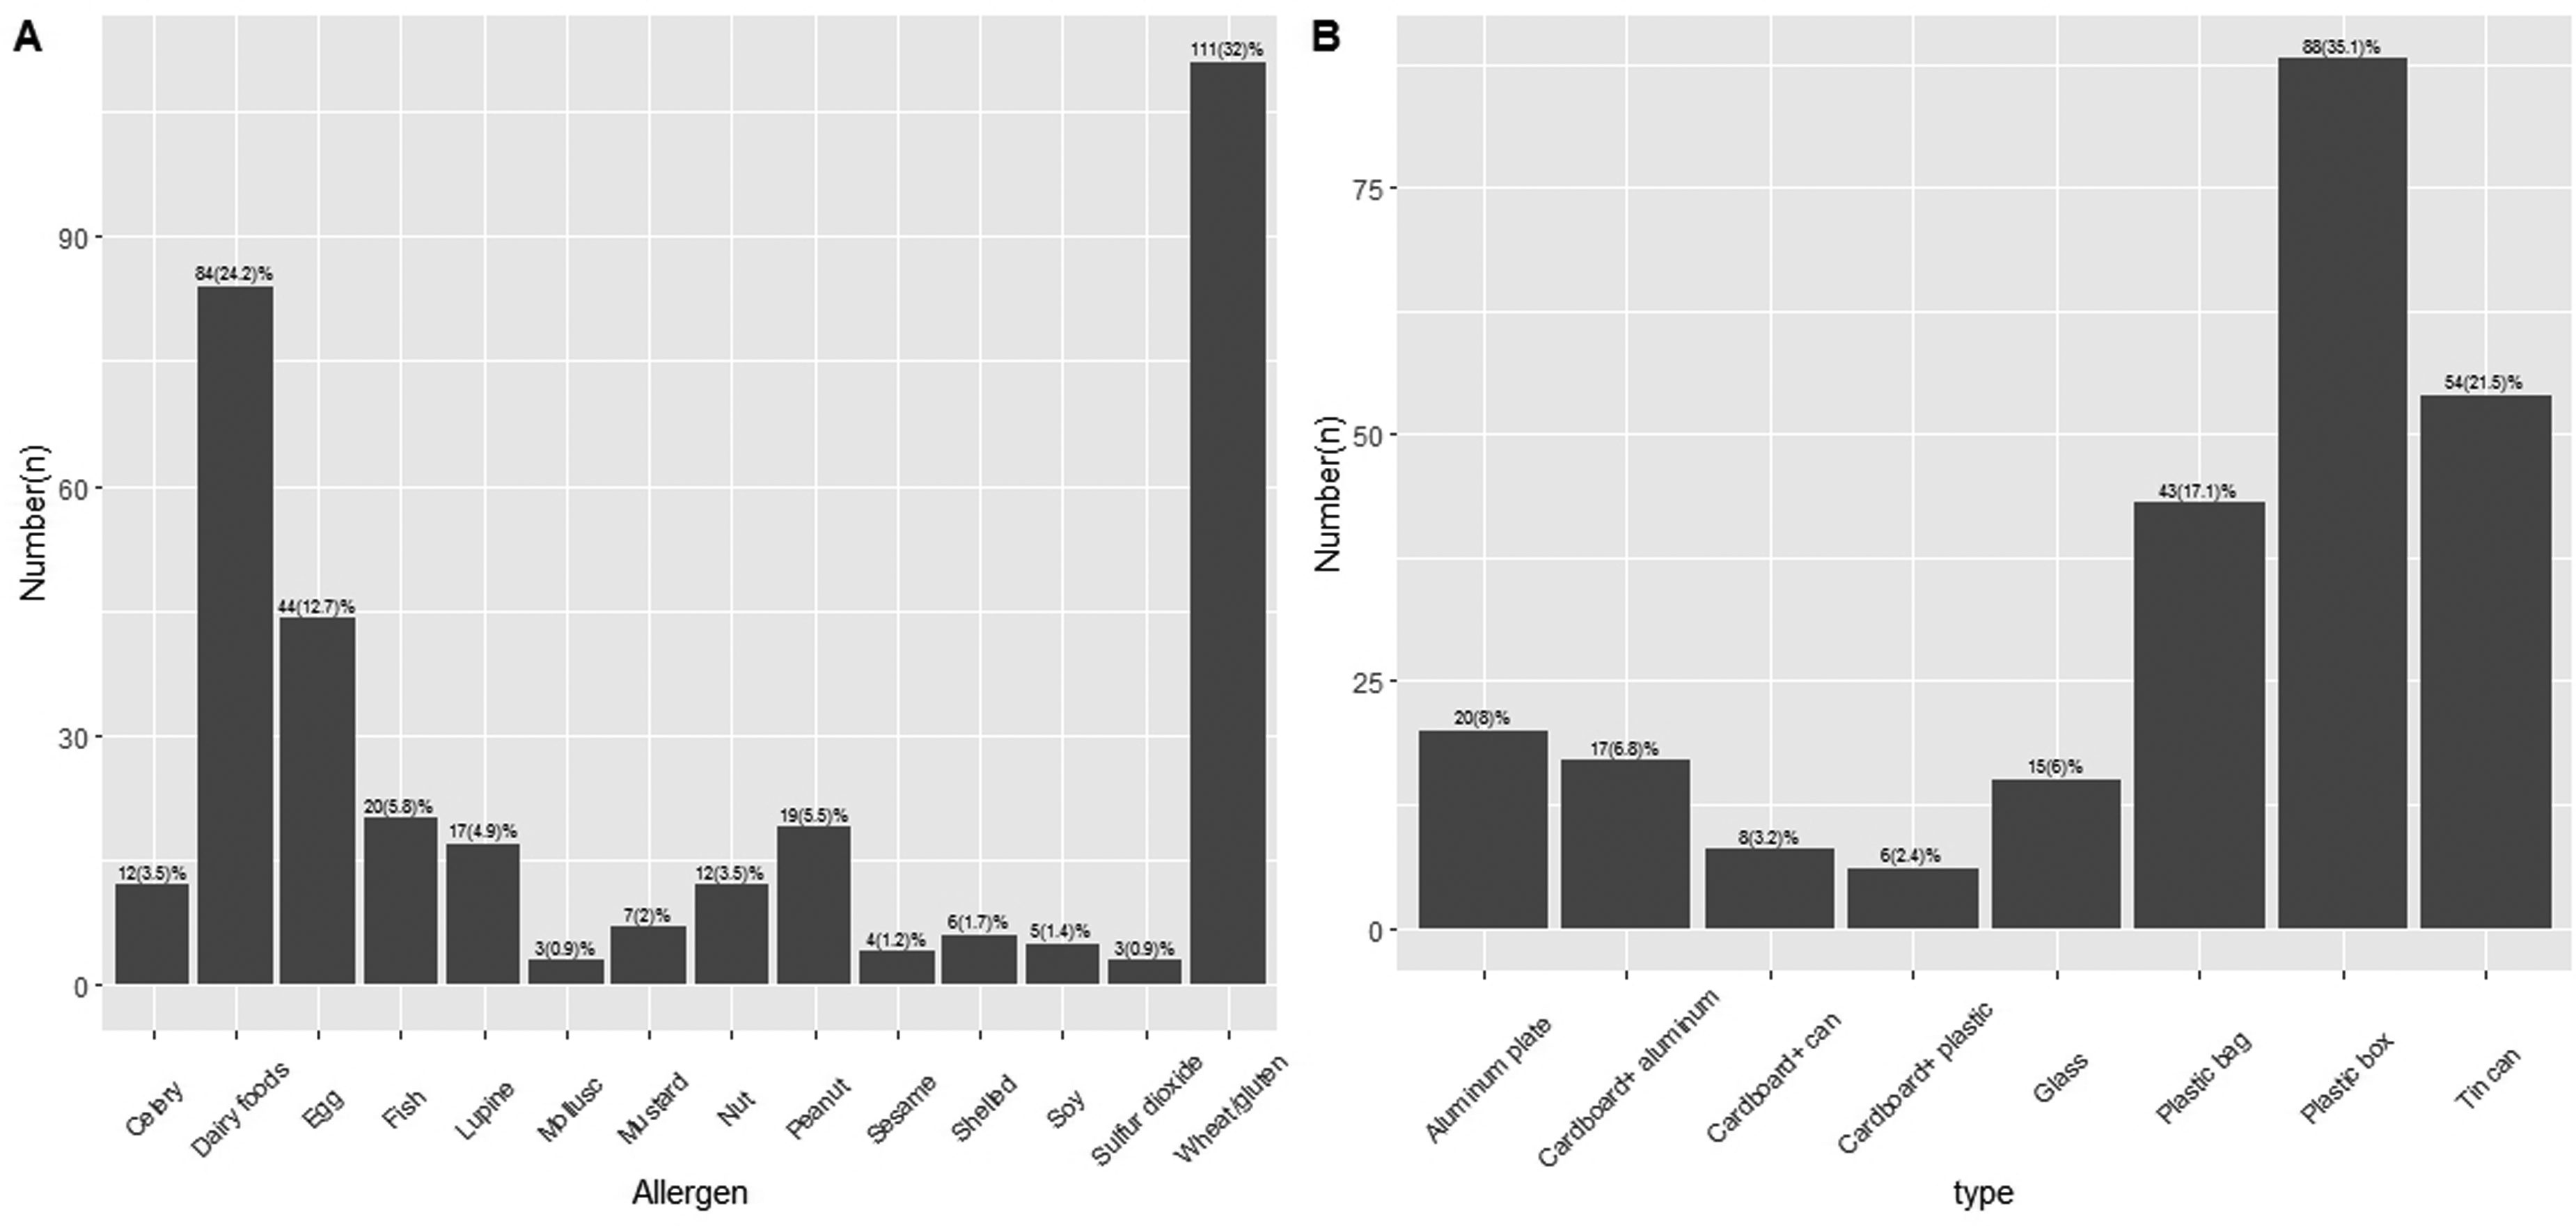
The frequency of allergens in RTE's and the types of packaging materials. Figure 1A shows that the most found allergen type is wheat-based gluten. Figure 1B indicates that the most frequently used packaging material is plastic box. Categories are given as numbers out of a total of 245 products. RTE: ready-to-eat meals.
Discussion
Adequate and balanced nutrition still remains among the most significant manageable risk factors for preventing obesity in the latest suggestions (World Health Organization (WHO), 2022). On the other hand, the demand for practical applications and products in today's busy living pace has also been increasing in the food industry. Therefore, the nutritional values and ingredients of RTEs become crucial in determining their position within a healthy nutritional pattern.
Food labels may be regarded as a way of communication between the consumer and the manufacturer/retailer. Food composition and labeling policies can potentially encourage the consumption of healthier food products and food reformulation by the food industry (Ducrot et al., 2015). In their study conducted in Hungary by AlOudat et al. (2021) examined the nutritional contents per portion of 177 products and compared them by traditionally or innovatively. This study found that the RTEs contained 432 kcal energy on average, and it was also found that the traditional meals contained lower energy than the innovative meals (AlOudat et al., 2021). A study conducted in Greece by Giazitzi and colleagues (2021) reported that 228 RTE products contained 467 kcal energy on average, mostly from fats and carbohydrates. They also found that the energy content per portion was higher in the main dishes than in the appetizers and salads since they contained higher amounts of carbohydrates and protein (Giazitzi et al., 2021). In our study, the energy per portion was 294.90 ± 193.42 kcal and 266 kcal on median. The products in Türkiye contain lower energy when compared to the products in Greece or Hungary, and the energy content, particularly in main dishes, in Türkiye mainly comes from fats and proteins. The total CHO, sugar, and fiber contents of the side dishes in Türkiye are higher than the other two categories. The reason may be that the products used in side dishes usually do not contain meat and other animal proteins, and they are meals that contain more vegetable proteins and are suitable for consumption at room temperature.
RTEs are usually considered unhealthy. Cooking at home more often is recommended since they contain more fat and sugar and fewer vegetables and fruits (Government of Canada, n.d.; National Health Services UK, 2022). However, a study conducted in Europe found that RTEs may be a healthier choice with their smaller portion sizes compared to fast food products and some homemade meals. Still, their nutrient composition varies greatly among these products (Blackham et al., 2012). Excessive diet sodium is related to increased blood pressure and risk of chronic diseases. The WHO recommends consuming less than 5 g of salt daily for adults (World Health Organization (WHO), 2020). In their study, Remnant and Adams also found that the RTEs sold in supermarkets did not show a healthy nutritional profile. This study found that the products contained higher saturated fat and sodium; however, they contained lower sugar (Remnant and Adams, 2015). In a study which conducted by Howard et al. (2012) found that neither RTEs nor the recipes given on food shows on TV met the recommendations of WHO, and the RTEs even contained very high amounts of salt (Howard et al., 2012). In their study, AlOudat et al. found that any of the products fully met the WHO standards, and these RTEs contained higher amounts of fat, saturated fat, protein, and sodium (AlOudat et al., 2021). Similarly, Giazitzi et al. found higher amounts of fat and salt in RTEs, and they should be reformulated (Giazitzi et al., 2021). We also found similar results, and the salt content of the main and side dishes, according to reference nutritional values, was 17.5–18.8% higher. The salt content in soups was found to be lower, which may be considered a positive finding because many people only have soup for a meal. In that case, the salt intake of these individuals may not be negatively affected, particularly because of soups. It may be good for companies to work on the ingredients of main and side dishes in terms of salt content, and the labels should include warnings and relevant information.
It is reported that the prevalence of food allergens ranges between 0.6–10.5% in children and 3–10% in adults, and these rates have been increasing worldwide. Since these individuals should be extra careful about their diets, the allergenic contents of the RTEs they consume become crucial. Therefore, food labels are of vital importance (Ontiveros et al., 2020). In a study conducted in Serbia, the ingredients of 1404 packed products were analyzed, and at least one allergen was found on the labels of 33.9% of these products. At least one-fourth of the participants of that study stated that they did not trust the allergen statement on the labels (Davidović et al., 2022). Our study found that 72.1% of all products contained at least one allergen, and the most common ones were found as wheat/gluten, dairy products, and eggs, respectively.
The packaging material is one of the most important processes in product formulation to protect the product's quality during transportation, storage, sales, and use (Verma et al., 2021). On the other hand, the risk of transmitting harmful substances from the packaging materials to the food products is an increasing concern due to consumers’ increasing awareness about healthcare (Alamri et al., 2021). In their study about the packaging materials of RTE products, Aloudat et al. reported that 34% used plastic trays, 11% used paper boxes, 6% used glass, and 49% used tin cans (AlOudat et al., 2021). In our study, however, it was observed that plastic packaging materials were mostly used in these products (35.1% plastic boxes and 17.1% plastic bags). This constitutes more than half of the products in total. The use of tin can as a packaging material is almost a quarter of the products (21.5%). Additional regulations may be required for the environmental impacts of these single-serve food products, which are usually packed in disposable packages.
While one of the primary advantages of preferring RTEs is that it allows consumers to save time, their costs may be considered a disadvantage. Along with nutritional values, healthiness, and taste, the cost is another significant factor in the complex process of selecting what to consume (Drenowski and Monsivais, 2020). A study in Australia by Woolridge and colleagues (2021) reported that the costs for RTEs, pizzas, and salads were 1.79 dollars/100 g in 2020 (Wooldridge et al., 2021). A study by Remnant and Adams in the UK reported that the median cost was £2.20 in 2015 (Remnant and Adams, 2015). The median cost per portion in Türkiye was 0.93 € (IQR 0.55–1.31) in 2022. While the main dishes were found to have the highest cost with 0.74 €on the median, the soups cost less than half of this (0.29 € on the median). This results from higher energy and protein content. It should definitely be noted that the cost will impact food choices when the consumers choose to eat a single type of food in a meal, and it may even become a factor more significant than nutritiveness.
One of the limitations of this study is that there may be new products that were not sold in grocery stores during the data collection period or that may have been launched after that period. Another significant point is that the prices are unstable in Türkiye due to high inflation, which may have gone up after the data collection period. In addition, the data were based on the statements on the labels, and the information provided by the companies may also be supported with additional analyses in the laboratory.
Conclusion
The energy content of the RTEs sold in supermarkets in Türkiye was found to be within the reference ranges, and the higher amount of salt stood out among all the nutrients. Individuals consuming RTEs should be aware of this fact due to hypertension and other relevant complications. In addition, the companies should review their formulations in order to increase fiber content within these RTEs because of their positive impact on health. Nearly three out of four RTEs contain at least one food allergen. Although the manufacturers comply with the mandatory package information rules in Türkiye, there are no package labeling systems like the traffic lights available in the UK or other European countries, which facilitate consumer preferences and ensure that the consumers can easily understand the contents. The environmental impact of the use of disposable and plastic packaging materials in the majority of products is another important point we recommend to consider.
Footnotes
Acknowledgment
The authors would like to thank Anadolu University for Publication and Research Incentive Project Support. Also, the authors would like to acknowledge Dr Robab Ahmadian Tetik for her support in statistical analyses.
Research ethics
Ethical permission was not required for this study as it did not include any human or animal participants.
Consent for publication
Not applicable.
Author contribution
HHG and OG conceptualized the study, collected and analyzed the data. HHG drafted the manuscript and all authors critically revised the paper for important intellectual content. All authors agree to the accountable for all aspects of this study and approve the final manuscript.
Funding
The authors disclosed receipt of the following financial support for the research, authorship, and/or publication of this article: This study was supported by Anadolu University Scientific Research Projects Unit with the grant number 2107E061.
Conflict of interest
The authors report there are no competing interests to declare.
Data availability statement
The data that support the findings of this study are available from the corresponding author, [HHG], upon reasonable request.