
Abstract
Introduction
Globalisation of Western diet (increased red meat intake, foods high in fat and refined sugars) is associated with overweight and obesity leading to the emergence of noncommunicable diseases such as diabetes, cancers and cardiovascular diseases (Fedacko et al., 2019) and the prevalence of these diseases is higher for men due to consumption of a poor diet (Bianchini et al., 2022; Flegal et al., 2016). The increasing levels of obesity have influenced the health of Australian individuals and communities (Sturgiss et al., 2017). The widespread obesity levels are partially caused by a number of socio-ecological components however, many of these components can be adjusted via interventions (Brownell and Walsh, 2017). The socio-ecological model takes into account the intricate dynamic between intrapersonal (outcome expectations, values, self-efficacy), interpersonal (social support, social norms), and components in the surrounding environment (physical environment related to accessibility and availability of physical activities, and food). Furthermore, the socio-ecological model acts as a visual representation of the ecological theory of a particular outcome or behaviour (Brownell and Walsh, 2017; Martin-Biggers et al., 2016; Quick et al., 2017). The model demonstrates how an individual's health and wellbeing is specified by several effects that interconnect at both micro- and macro-level environments (Story et al., 2008). Individual's behaviour is more directly influenced by micro-level factors, as in, personal factors (i.e., intrapersonal level) and social and physical environment (i.e., interpersonal level) whereas factors at macro-level as in advertising, economic policies and social norms influence behaviours more indirectly. The socio-ecological theory is formed around the idea that components within several levels have an impact on behaviour. These levels include the characteristics of the individual and family, and home, community, and region characteristics (Hawkins et al., 2009). Lack of support for healthier dietary behaviours from within the environment (e.g., access to healthy food outlets) makes it challenging for individuals to prevent or limit weight gain, or to lose weight (Quick et al., 2017).
Food preferences are influenced by a variety of factors, such as, culture, age and gender. Often, healthy eating is not a priority, because barriers such as, lack of time, work demands, cost, and lack of environmental support outweigh enablers of healthy eating (Antwi et al., 2024; Oliver et al., 2020; Vidal et al., 2024). Price and household income are significant contributors to dietary choices (Lee et al., 2021a). Price of healthy foods is influencing consumer food choice (Gibson et al., 2022; Scalco et al., 2019) and has found to be a barrier to improve diets (Lee et al., 2021a).
Research shows that gender has a significant impact on dietary choices and eating habits (Egele and Stark, 2023; Razaz et al., 2022; Spinelli et al., 2020) with women opting for healthier foods (Razaz et al., 2022) and regular meals while men prefer particular tastes and behaviours related to meals (Brunner et al., 2021). Women consume health-protective foods such as fresh produce (Song et al., 2021) or meat alternatives (Modlinska et al., 2020) more commonly, whereas men's overall diet quality is lower (Black and Billette, 2015; Song et al., 2021) with preference to red and processed meats, and meals high in fat on a considerably higher consumption rates compared to women (Feraco et al., 2024). These differences have been linked with an increased risk of chronic disease development in men compared to women (Crimmins et al., 2019; Keller et al., 2019). The differences in eating behaviours are not only influenced by biological factors such as genetics that influence hunger disinhibition contributing to dietary choices (Brunner et al., 2021), but also by cultural and societal norms (Feraco et al., 2024) self-efficacy and attitudes (Razaz et al., 2022; Stephens et al., 2017). Research shows that women are more responsive to health interventions being able to choose meals with lower-calorie contents (Mohr et al., 2019) and men had a higher daily consumption of salt (Stephens et al., 2017). Therefore, understanding factors related to healthy eating behaviour among men is vital to designing health interventions especially since women are more likely to participate in healthy eating research (Bärebring et al., 2020; Oliveira et al., 2024).
Furthermore, psychological factors such as, awareness, knowledge and self-regulation skills along with social and environmental support influence dietary choices (Antwi et al., 2024; Louey et al., 2024; Scalvedi et al., 2021). Social support can provide individuals with the support needed to break unhealthy habits as social approaches and practices are strongly linked with eating behaviour (Ferrão et al., 2019). There is a significant link between social influences, which includes partners, family members and friends, and food choices and healthy eating (Rosas et al., 2020). Research shows that social aspects such as family status e.g., marriage and parenthood are associated with longevity and good health (Martínez et al., 2019). Other social factors known to influence dietary choices include mass and social media consumption (Carrillo-Álvarez et al., 2019).
Evidence shows that food environments influence eating habits (Cochrane et al., 2019; Parkinson et al., 2017; Sallis et al., 2012). The food environment is considered as the physical, economic, political, and sociocultural context in which consumers engage with the food system to make their decisions about purchasing, preparing and consuming food (Schönfeldt and Pretorius, 2018). The key elements of the food environment influencing food choices, acceptability, and diets are physical and economic access to food (proximity and affordability), information and promotion, and quality and safety of food (Bogard et al., 2021; Downs et al., 2022; Turner et al., 2020). Access to healthy foods might be limited for individuals from low socio-economic backgrounds consequently making healthy food choices more difficult due to a lack of opportunities (Yu et al., 2020), when compared to individuals from higher socio-economic backgrounds. When compared to individuals living in socio-economically advantaged areas, individuals who live in low socio-economic areas tend to have poor eating habits potentially due to limited healthy food options available and fast food outlets located in close proximity (Storr et al., 2019). Promoting sustainable healthy diets can be achieved by altering the physical, economic and policy factors of the food environment. Physical environment modifications can improve supply of healthy food outlets in low socio-economic areas potentially contributing to dietary choices (Drewnowski et al., 2020). Food affordability can be improved by providing supplements to low-income households (Balagamwala et al., 2024), providing market subsidies to retailers who can pass it to consumers by lowering prices (Nutrition North Canada, 2022) and providing vouchers for healthy options such as fruit and vegetables. Furthermore, holistic marketing restrictions and easy-to-understand nutrition labels placed at the front of the package can further contribute to dietary habits (Drewnowski et al., 2020).
Understanding the diverse enablers and barriers of healthy eating is essential to understand how programs can be delivered to increase healthy eating. Programs that are tailored to individuals (Munt et al., 2017) offer one means to enhance engagement rates and, in turn, optimise outcomes. To date, healthy eating programs have targeted people in general applying a one-size-fits-all approach where everyone receives the same healthy eating program overlooking known socio-ecological factors (Botvin and Griffin, 2007). Program effectiveness is being limited by using such approaches (Whatnall et al., 2019) given that a one-size-fits-all approach leaves many people disgruntled, disinterested, or not challenged (Snyder et al., 2004).
An alternative approach to targeting people in general with one program is identifying if the larger target audience consists of smaller groups with comparable characteristics within those groups. This approach is known as segmentation. Segmentation can add value to programs aiming to change individual's behaviour (French and Gordon, 2015) by identifying individuals or groups most able or willing to (Doner Lotenberg et al., 2011) or most in need of changing their behaviour (Donovan and Henley, 2010). By grouping sets of individuals together who are similar in some ways but different from other groups program design can be more nuanced, capturing more people's attention. More effective programs can be designed that best serve the identified groups by understanding the differences between segments (Kubacki et al., 2017). This is illustrated in a study conducted by Purdy (2011) where two segments were identified and products were branded and priced to cater for the different segment needs.
The benefits of segmentation have been clearly outlined however, segmentation use remains limited. This is evidenced by Kubacki et al. (2017) who demonstrated that only 16% of studies aiming to improve health behaviour used segmentation. A few recent studies have successfully utilised segmentation to better understand population needs and behaviours (Brennan et al., 2020; Dix et al., 2021; Lee et al., 2021b; Stalgaitis et al., 2020). Lee et al. (2021b) examined flu and COVID vaccines identifying four segments that differ from each other in terms of their seasonal influenza vaccine uptake during the past influenza period, level of involvement in making a decision regarding an influenza vaccine, searching for information, and paying attention to news regarding influenza. Six segments related to ‘Living and Eating for Health’ were identified by Dix et al. (2021) and a survey was developed to allocate individuals into the six segments. These studies provide evidence that segments can be identified from various social contexts. Research shows that when assessed at a group level, segments produce different reactions to behaviour change programs (Dietrich et al., 2015b), and indicate different design preferences for strategies to improve programs (see Dietrich et al., 2016).
Theory use is reported infrequently in social marketing studies that encourage healthy eating and utilise segmentation, and the studies that report theory use fail to clearly report how theory was used (Jenkins et al., 2021). A study aiming to encourage young adult's healthy eating behaviour highlighted the significance of behavioural theories being included in segmentation and used the motivation, opportunity and ability framework to discern segments (Kitunen et al., 2019). A recent literature review identified that 9 from 30 healthy eating segmentation studies were theoretically underpinned, and most of these studies utilised a singular theory including Means-End Chain Theory, the Theory of Planned Behaviour, Self-Determination Theory and Hierarchy of Food Needs Model drawn from Hierarchy of Needs by Maslow (Jenkins et al., 2021). The most often applied theories were the Transtheoretical model and the Theory of Planned Behaviour (Jenkins et al., 2021), both of which focus on individual behaviour change and fail to recognise the environmental influence (Ashton et al., 2019).
Healthy eating programs that target segment differences and accommodate a broader theory-based socio-ecological view are needed to effectively engage with a cross section of adults (Kitunen et al., 2023). The Capability, Opportunity, Motivation and Behaviour (COM-B) model (Michie et al., 2011) has been recognised as a comprehensive model for explaining eating behaviours by integrating capability, opportunity and motivation to understand and predict eating behaviours (Willmott et al., 2021). The COM-B model sees behaviour as a part of a system where different factors are integrated (Michie et al., 2011) and proposes that motivation to perform a behaviour is influenced by individuals’ capability and opportunity to perform the behaviour (Michie et al., 2014). The COM-B model has been previously used to explain eating behaviours including studies revealing the usefulness of a digital weight management intervention (Shoneye et al., 2020) and that environmental determinants of diet quality should be prioritised among adolescents with a lower socio-economic position (Livingstone et al., 2023). This suggests that the COM-B model is suitable for changing eating behaviours. The current study utilises the COM-B model to explain eating behaviours ensuring that understanding moves beyond internal factors and that the role of environment in healthy eating behaviour is considered.
A need for more research in this field is emphasised by the restricted examination and use of segmentation, particularly when improving individuals’ health is concerned. Furthermore, the limited application of theories addressing the role of the surrounding environment in relation to behaviour change provides an opportunity for further research. Therefore, more studies are needed to incorporate a wider theory-grounded socio-ecological viewpoint to ensure that structural and social determinants of overweight and obesity are accounted for in program planning. The study contributions are twofold. First, this study aims to ensure the consideration of environmental support for healthy eating by widening research focus beyond individually focused strategies for change, by utilising the COM-B model that moves beyond internal factors by considering the impact of surrounding the environment on behaviour. Second, this study provides the foundation for the development of tailored strategies meet the needs of segment groups by applying the socio-economical lens to investigate if different healthy eating segments can be identified from a male-dominated Australian adult sample, addressing previously reported concerns that men's nutrition and healthy eating is under-researched (Rowlands and Gough, 2017).
Materials and methods
Research design
This study was conducted as a part of a larger research project supporting healthy eating within the Australian Defence Force (ADF) and a sample similar in age and gender was acquired to enable comparability. The larger research project seeks to generate an in-depth understanding of military personnel's eating behaviours and, using this understanding, develop and test programs to improve eating behaviour to support personnel's health and performance. This study follows a cross-sectional research design. A sample of Australians aged 18–40 years with a gender profile of 80% male was obtained as this closely matches the personnel demographics in ADF. Data was collected by CINT, an online market research panel provider. The panel provider contacted potential participants via email that included the invitation to participate in the study and the link to the online survey. The front page of the survey included the purpose of the research, approximate duration of the survey, notification of the voluntary nature of participation, and a link to the full information sheet. By clicking continue, participants consented to their participation. The completion time for the online survey was about 10 min, participation was voluntary and completely anonymous. Consent to participate in the online survey was indicated by the completion of the survey and the survey invitation was opened by a total of 3044 participants. The Human Research Ethics Committee provided ethical approval for the study (approval no. 2021/487).
Socio-economic indexes are often calculated at an area level. For example, the Australian Bureau of Statistics (ABS) calculates the Socio-Economic Indexes for Areas (SEIFA) at a small area level such as postcode, to identify areas that are relatively more or less disadvantaged. These are often used to indicate an individual's level of advantage, but they are not individual measures, and within each small area, there may be individuals who are more or less advantaged than the area index implies. The Australian Bureau of Statistics has developed an individual index (the SEIFI – Socio-Economic Index For Individuals) based on the same methods and approach as the area index (Baker and Adhikari, 2007). The survey used in this research included demographic questions (family composition, housing, education, occupation, employment and income) corresponding to the ABS SEIFI measures to enable the calculation of a SEIFI.
The survey was designed to measure the everyday eating choices of Australian adults and was informed by the COM-B model (see Appendix A). The first section assessed eating behaviour related to fruit and vegetable consumption on a daily basis, weekly intake of soft drinks and fast food, the frequency of consuming biscuits, cakes, chocolate, lollies, ice cream or crisps, the usual choice of types of bread, rice, pasta, noodles, milk and fish, weekly consumption of red meat and different meat products, and the frequency of adding salt to food during or after it is cooked (Haapasalo et al., 2018). The second section measured psychological capability via nutrition knowledge with a 7-point Likert scale from strongly disagree to strongly agree options and with eight statements on a true or false scale. An overall nutrition knowledge score ranging from 0 to 8 was generated for every participant following procedures outlined in Dickson-Spillmann et al. (2011). Furthermore, physical capability was measured with perceived competence (skills) with a 7-point Likert scale (strongly disagree to strongly agree).
In total 72 psychographic questions (see Table 1) were asked to determine participants’ relationship with food using 7-point Likert scales anchored with strongly disagree to strongly agree options with the exception of action planning (very untrue to very true), self-efficacy (very unconfident to very confident, very difficult to very easy, very untrue to very true), perceived behavioural control (no control to complete control, completely beyond my control to very much within my control) and attitudes (good to bad, harmful to beneficial, foolish to wise, unenjoyable to enjoyable, unpleasant to pleasant, stressful to relaxing). The psychographic questions included items such as habits referring to repetition and automaticity with lack of control or awareness (Verplanken and Orbell, 2003). Habits were used to measure automatic motivation. Intentions were used to measure reflective motivation with a 7-point Likert scale (strongly disagree to strongly agree). Other psychographic questions included action control which refers to a person's competence to stay in control of their actions and act according to the standards they set for themselves in relation to the desired behaviour (e.g., healthy eating) (Luszczynska and Schwarzer, 2003) and action planning that is the effort consumed in commencing and upholding the behaviour (Sniehotta et al., 2005). Social norms were used to measure social opportunity and were divided into injunctive and descriptive norms. Injunctive norms are behaviours that a person is expected to follow and expects other people to follow. In contrast, descriptive norms refer to the perceptions of the most common actions that people do (Conner et al., 2002; Rhodes and Courneya, 2003). Physical opportunity was measured with perceived environment using a 7-point Likert scale from strongly disagree to strongly agree options. The final section of the survey consisted of demographic questions including questions that enable calculation of SEIFI.
Psychographic questions.
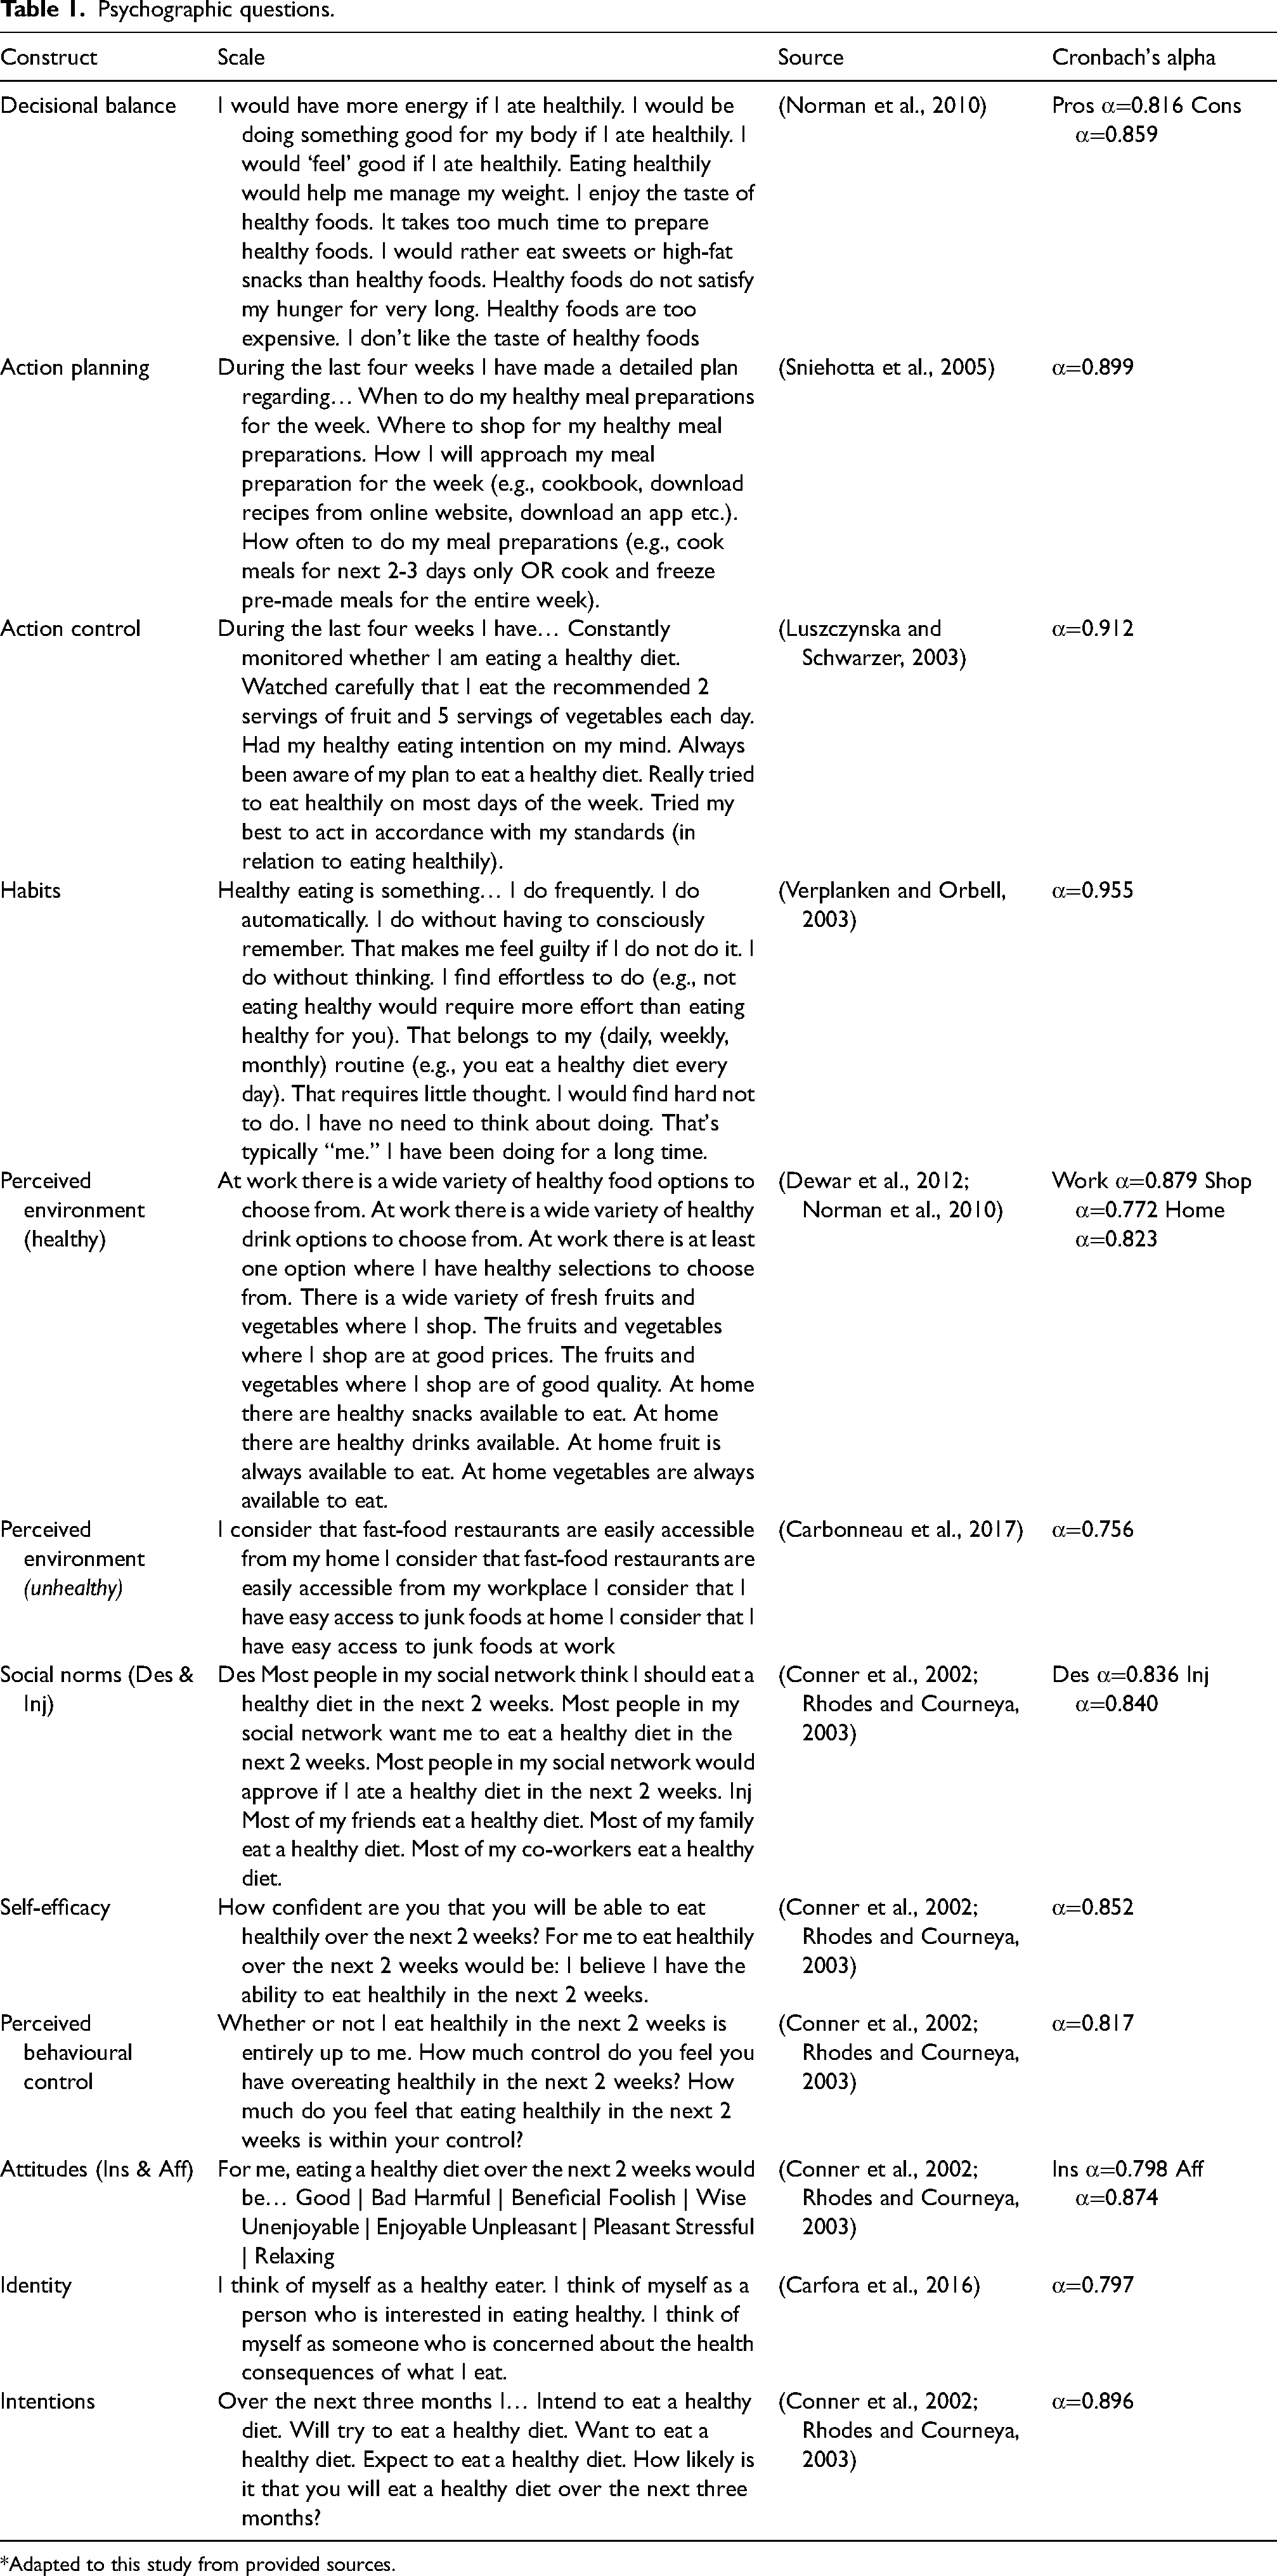
*Adapted to this study from provided sources.
Data analysis
Cronbach's alpha was used to determine reliability by comparing the amount of variance among the items measuring each construct. A benchmark of 0.7 and above was considered as acceptable internal consistency (0.7 good, 0.8 better and 0.9 best), which supported the use of composite measures. All measures were above the recommended levels for Cronbach's alphas with high internal consistency (see Table 1). As recommended by Dolnicar and Grün (2017) variables used in segmentation analysis should not be correlated. Spearman's correlation analysis was performed to understand which measures exhibited zero to low correlations and those variables were included in the segmentation analysis (Norušis, 2012).
Two-step cluster analysis was used to identify segments from the target audience. Two-step cluster analysis determines an importance level for each variable used in the analysis. The importance levels indicate the importance of a variable to segment formation. Importance levels between 1.0 and 0.8 indicate that a variable is highly important, levels between 0.7 and 0.3 indicate that a variable is moderately important while importance levels between 0.2 and 0.0 indicates the variable was less important (Norušis, 2012). Log-likelihood distance was used to group the responses into pre-clusters (Okazaki, 2007). The pre-clusters were further reduced to the best number of clusters based on Schwartz's Bayesian information criterion (BIC) (Norušis, 2012). Segments were validated by splitting the sample in half and repeating the analysis in a half-sized sample to ensure the consistency of segment formation. The differences between the segments were investigated with One-way analysis of variance (ANOVA) and Chi-square tests and statistically significant differences were identified by using a threshold of p < 0.05.
Results
Participants
The survey was attempted by a total of 3044 participants, 2025 usable responses remained after incomplete responses and responses that failed the attention check questions were removed. The sample comprised mainly of bachelor's degree educated (36%) men (71.8%). Most of the respondents were 36-year-olds (13.4%) followed by 40-year-olds (7.2%) and 35-year-olds (6.6%). Most of the respondents were Caucasian (72.2%) and working full-time (66.7%) in a manager/professional position (50.7%). Approximately half of the respondents were married (56%) reporting that they currently lived in a dwelling that they own outright (45.5%). Most of the respondents indicated that their annual household income was between $100 000 and $150 000 (26.8%).
Approximately a third of the sample reported that they eat two serves of vegetables (30.1%) and fruit (28.2%) daily. A fifth of the respondents reported consuming soft drinks (21.1%) less than once a week while nearly a third of the respondents reported consuming fast food (31.2%) less than once a week, however a fifth of the respondents reported consuming biscuits, cakes, chocolate, lollies, ice cream or crisps (20.8%) once a week. The type of bread usually consumed by respondents was white (27.5%), similarly the type of rice, pasta or noodles respondents mainly chose was White (52.1%). The type of milk mainly chosen by respondents was full cream including lactose-free milk (45.7%). More than half of the respondents indicated usually choosing to eat white fish (52%). On average a fifth of the respondents indicated eating red meat (20.6%) twice a week, and other meat products such as sausages, frankfurts, Devon, fritz, salami, meat pies, bacon, or ham once a week (21.7%). A third of the respondents indicated sometimes adding salt to their food during or after cooking (34.4%).
Segments
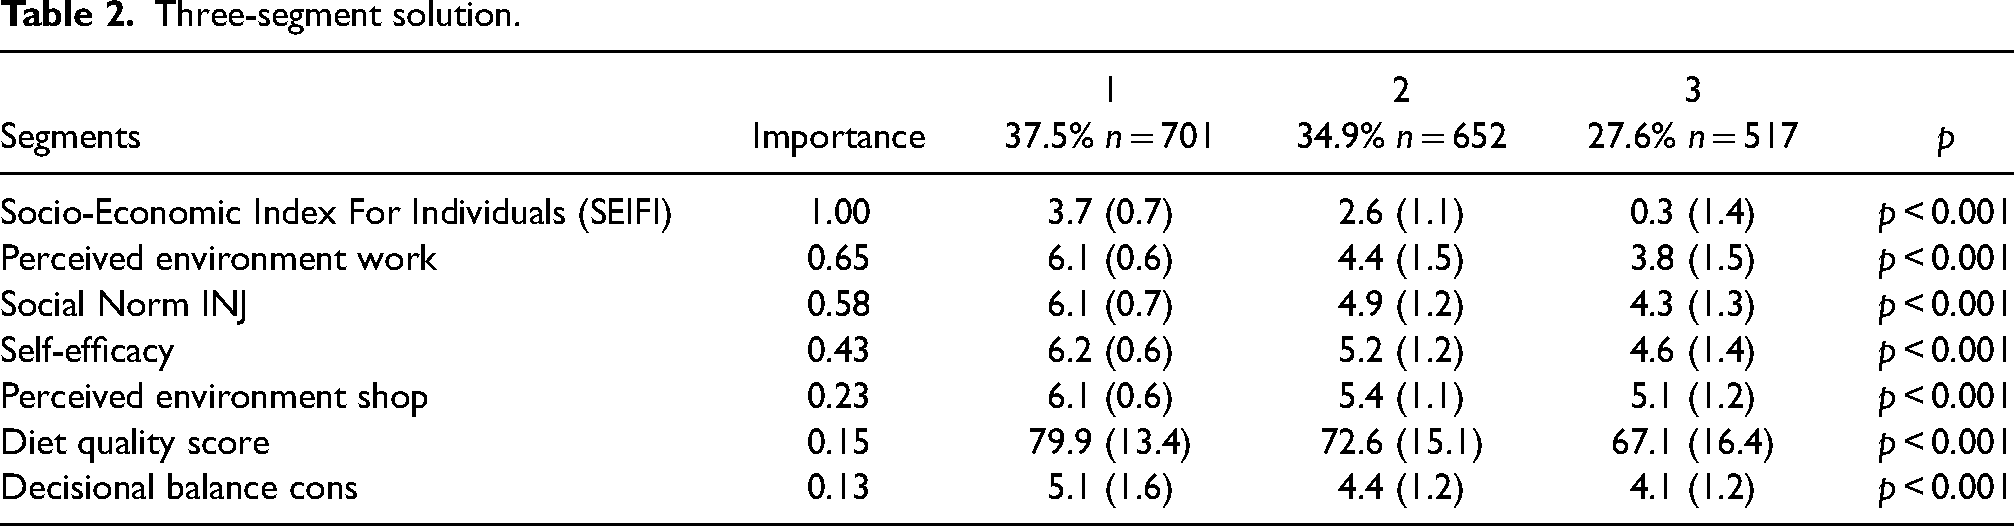
From the 17 composite variables measured, only seven were important drivers of segment formation. The input importance levels of every variable used to form the segments were higher than 0.0, meaning that some variations within segments were explained by each variable. Three segments from the target audience were identified by two-step cluster analysis. Input importance levels of all variables were above 0.0, thus, indicating that each variable contributed to some variation within segments. SEIFI was the most important variable in segment formation followed by perceived environment at work, social norms (injunctive), self-efficacy, perceived environment at shops, diet quality score, and decisional balance (cons) (see Table 2). One-way ANOVA and Chi-square tests confirmed significant differences across the seven segmentation variables between the segments. The same BIC measure and number of clusters were determined when the dataset was split in half for further validation of the segment solution.
Three-segment solution.
Segment 1: Sneaky snackers
The SEIFI score (M = 3.7, SD = 0.7) for the respondents in segment 1 was the highest indicating the respondents are the most socio-economically advantaged compared to the other segments. This segment perceived both their work environment (M = 6.1, SD = 0.6) and where they shop (M = 6.1, SD = 0.6) as the healthiest out of the three segments. Similarly, social norms (M = 6.1, SD = 0.7) and self-efficacy (M = 6.2, SD = 0.6) were the highest in this segment. This segment also scored the highest on the diet quality score (M = 79.7, SD = 13.4). However, the respondents in this segment had the highest levels of decisional balance cons (M = 5.1, SD = 1.6) indicating that preparing healthy food takes too much time, they would rather eat sweets and fast food for snacks than consume healthy options, healthy foods don’t satisfy their hunger for long, healthy foods are too expensive, and they don’t like the taste of healthy foods. Taken together, data suggests that while this segment has the highest levels of support and opportunity for healthy eating, they are easily tempted to take a convenient way out.
Segment 2: On the way up
The SEIFI score (M = 2.6, SD = 1.1) indicates the respondents are socio-economically less advantaged than segment 1, but more advantaged than segment 3. Segment 2 perceived both their work environment (M = 4.4, SD = 1.5) and where they shop (M = 5.4, SD = 1.1) as less healthy than segment 1, but healthier than the third segment rated their own environment. Similarly, social norms (M = 4.9, SD = 1.2) and self-efficacy (M = 5.2, SD = 1.2) for segment 2 were between segments 1 and 3. This segment scored the second highest on the diet quality score (M = 72.6, SD = 15.1) as well as second highest levels for decisional balance cons (M = 4.4, SD = 1.2) indicating that, like segment 1, preparing healthy food takes too much time, they would rather eat sweets and fast food for snacks than consume healthy options, healthy foods don’t satisfy their hunger for long, healthy foods are too expensive, and they don’t like the taste of healthy foods.
Segment 3: Give me a break
The SEIFI score (M = 0.3, SD = 1.4) of this segment was the lowest of the three segments indicating the respondents are socio-economically in a least advantageous position compared to the other segments. Segment 3 perceived both their work environment (M = 3.8, SD = 1.5) and where they shop (M = 5.1, SD = 1.2) being the least healthy out of the three segments. Similarly, social norms (M = 4.3, SD = 1.3) and self-efficacy (M = 4.6, SD = 1.4) were the lowest in this segment. This segment also scored the lowest on the diet quality score (M = 67.1, SD = 16.4). However, the level of decisional balance cons (M = 4.1, SD = 1.2) was the lowest in this segment indicating that this segment considers that healthy food preparation wasn’t onerous, and that healthy foods are satisfying, inexpensive and tasty.
In addition to the segment differences across the seven variables that determined segment formation, there were demographic differences between segments. Table 3 provides the demographic breakdown of the segments. The first segment consisted of 37.5% of participants making it the largest segment. Participants in this segment were mainly bachelor's degree level and above educated (50.8%) men (94.4%) aged on average 34.7 years. Nearly all the respondents in this segment were full-time employed (99.4%) working as a manager/professional (90.7%) and they reported having a household income of $100 001–$150 000 (37.2%). Most of the respondents were Caucasian (91.6%), married (94.7%) and own the dwelling outright where they currently live (94.6%).
Demographics.
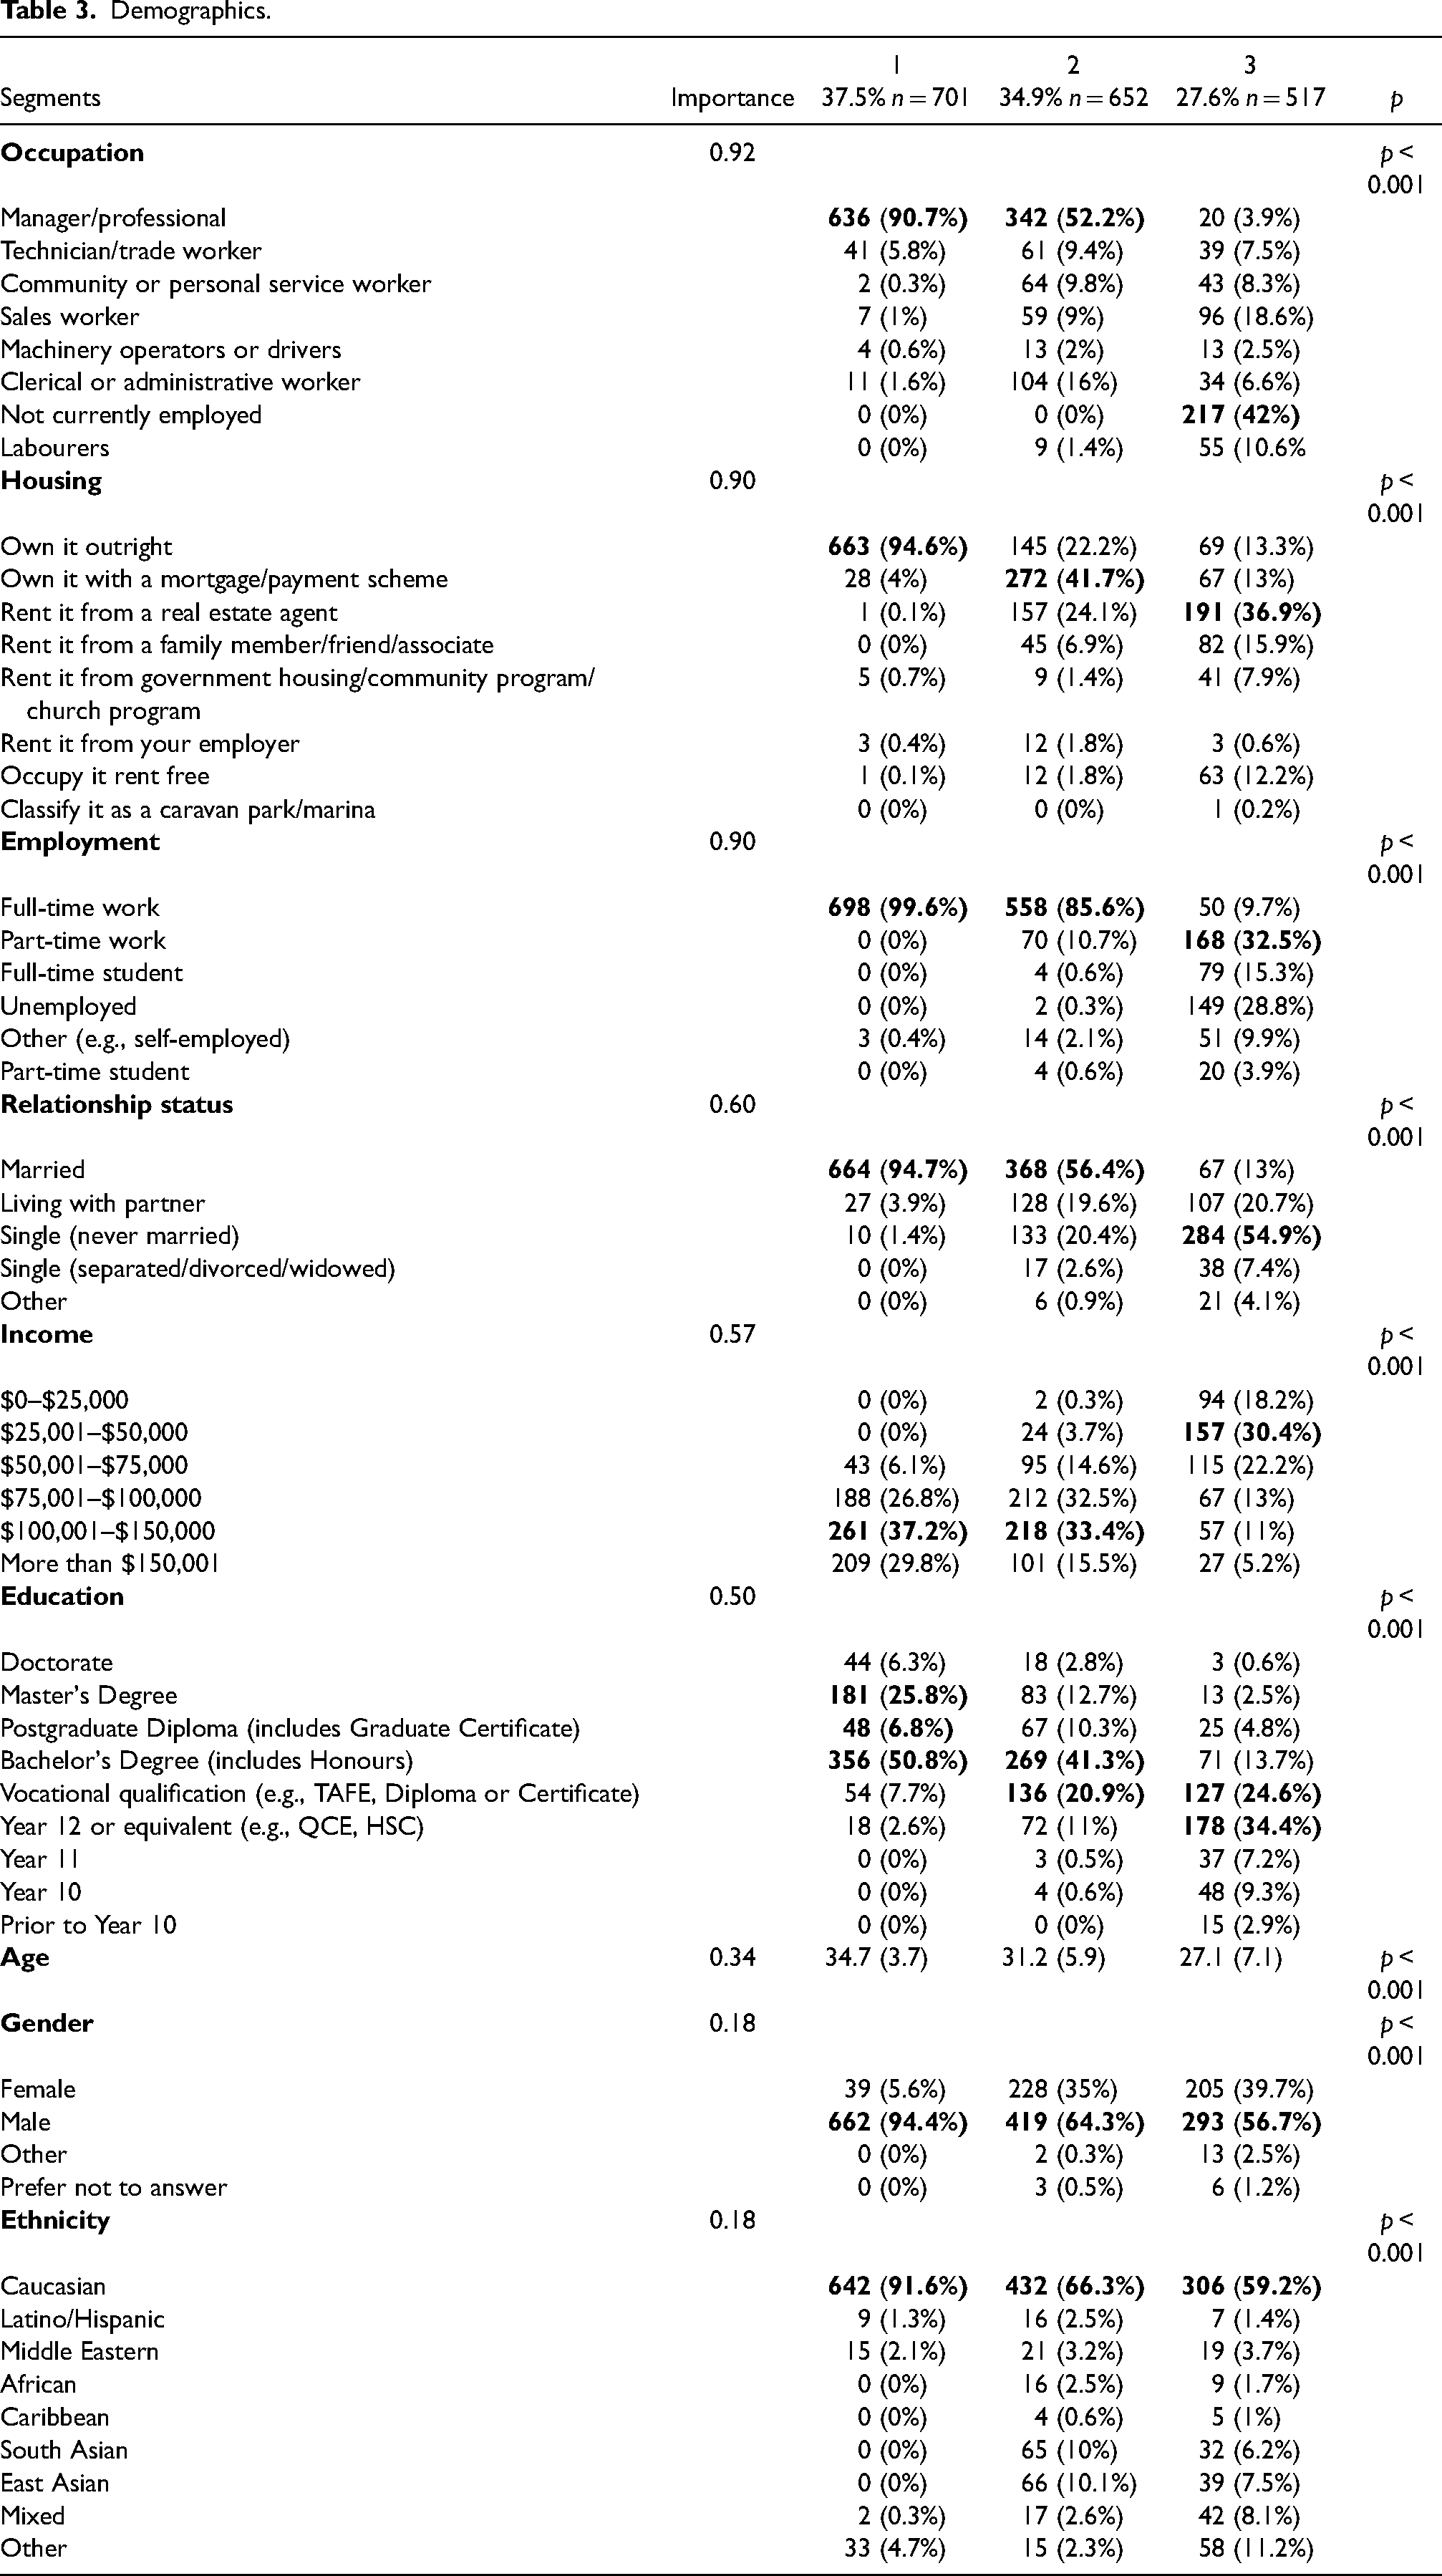
When compared to segment 1, segment 2 consists mainly of bachelor's degree or vocationally educated (41.3%) younger males (64.3%) who were aged on average 31.2 years. Most of the respondents in this segment were full-time employed (85.6%) and half of the respondents were working as manager/professional (52.2%) with a household income of $100 001–$150 000 (33.4%). More than half of the respondents were Caucasian (66.3%) and married (56.4%). Nearly half of the respondents in this segment own the dwelling where they live with a mortgage/payment scheme (41.7%).
The third segment was the smallest (27.6%) and a third of the respondents in this segment were Year 12 or equivalent level educated (34.4%). The respondents in this segment were mainly male (56.7%) aged on average 27.1 years. Compared to segments 1 and 2 a third of the respondents in this segment were employed part-time (32.5%) and nearly half of the respondents were currently not employed (42%) with a household income of $25,001–$50,000 (30.4%). More than half of the respondents were Caucasian (59.2%) and single (never married) (54.9%). Onethird of the respondents were renting the dwelling where they live from a real estate agent (36.9%).
Discussion
The aim of this study was to identify ways to increase healthy eating by accommodating a wider theory-based socio-ecological viewpoint for change. Additionally, the theory-based socio-ecological lens was applied to identify if segments can be revealed, enabling tailored strategies to be developed to better meet the needs of segments. This study utilised a COM-B-informed survey among Australian male-dominated sample including a social advantage indicator (SEIFI) to identify healthy eating segments. The contributions of this study are twofold. First, this study applied a socio-ecological lens to understand if a larger adult population can include healthy eating segments within it. Second, this study delivers insights indicating the need for ecological solutions focussed on redressing socio-economic imbalances.
The need for the behavioural theory base to be expanded, beyond a dominant focus on individuals, was outlined by Rundle-Thiele et al. (2019). In response, the current study ensured that understanding moves past individual components to take into account the role that the food environment and social aspects exert on an individual's healthy eating by applying the socio-ecological lens and identifying three healthy eating segments. Past healthy eating studies that utilised segmentation have used individually focused theories, such as the Theory of Reasoned Action (Gunden et al., 2020) and the Theory of Planned Behaviour (Burton et al., 2017). These studies show how theories focusing on the individual can be applied in healthy eating segmentation studies to inform program planning. This study furthers understanding by illustrating the worth of incorporating a theory that acknowledges social aspects and environmental support by applying the socio-ecological lens. The variance explained by ecological models has been proven to be superior compared to individually focused models drawn from the Theory of Planned Behaviour (Pang et al., 2017, 2018). In this study, less environmental support from both work and shops was reported by the Give me a break segment, who also reported the lowest diet quality score. These findings provide evidence that in order to improve eating behaviour, programs need to provide communication messages along with targeted healthy eating solutions that provide environmental support.
This study provides useful insights for program developers aiming to change eating behaviours. Sneaky snackers are the most confident in their abilities to consume a healthy diet, have the highest diet quality score and perceive that most people in their social network would want them to consume a healthy diet compared to both On the way up and Give me a break. However, they are prone to snacking and feel that the taste of unhealthy foods outperforms healthy foods, making healthy meals is a burden and that healthy foods cost too much. Based on the results, program developers could create interventions to instigate positive perceptions of buying and making healthy meals to increase healthy eating behaviour. It could be advantageous for interventions to focus on communicating how to make quick, easy and tasty healthy meals and snacks, given that taste and speed of eating are preferred by men (Feraco et al., 2024), and how to combine healthy protein, carbohydrates and fats to keep hunger away for longer. Additionally, communicating that snacks in moderation are fine would be beneficial to prevent them from feeling too restricted by consuming a healthy diet as they are easily tempted by unhealthy foods.
Taking an ecological stance: Balancing food environments
The importance of extending understanding beyond the individual has previously been highlighted (Brennan et al., 2016). Individually focussed approaches restrict understanding to an individual's characteristics, failing to take the bigger picture into account. The application of a socio-ecological lens in segmentation practice delivers a clear understanding of the social and structural factors impacting individuals. The current study advances understanding demonstrating the role that SEIFI (a social advantage indicator) has on diet and availability of healthy food in the surrounding environments. The need for intervention to occur at the environmental level to provide more supportive food environments has long been known (Bukhari et al., 2022; Sawyer et al., 2021), yet many stances continue to educate, inform, and persuade individuals to make healthy choices (Daniels et al., 2021; Kozioł-Kozakowska et al., 2024; Porri et al., 2024). Approaches focussed on changing individuals that don’t take socio-economic status into account fail to address the levels of support available to individuals that will support lasting change (Sawyer et al., 2021).
In line with previous research, preferences for certain foods and taste were crucial influences in dietary choices (Chan et al., 2022). Sneaky snackers exemplify this, preferring the taste of unhealthy foods over healthy foods. Additionally, attitudes, motivation, abilities and values towards foods (Caperon et al., 2019; Chan et al., 2022) were impacting their choices. Access to healthy foods is a significant influence on healthy eating (Caperon et al., 2019; Chan et al., 2022; Doegah and Acquah, 2022; Pineros-Leano et al., 2019). On the way up is socio-economically less advantaged than Sneaky snackers and perceptions of limited availability or access to healthy foods can act as a barrier to healthy eating. Furthermore, proximity to fast food outlets can provide access to unhealthy foods (Chan et al., 2022). Not only access to healthy foods but access to fresh produce can be challenging in regional or least socio-economically advantaged areas due to the longer distance to supermarkets (Chan et al., 2022; Doegah and Acquah, 2022; Pineros-Leano et al., 2019). Give me a break typifies this situation given they were the least socio-economically advantaged group, and their perception that their environment (work and shops) was the least healthy. Moreover, social support (family and friends) is considered to be one of the most influential determinants of eating behaviour (Caperon et al., 2019; Doegah and Acquah, 2022) and out of all the segments Give me a break indicated having the lowest level of social support.
Given the evidence demonstrating the value of environmental support, program developers should include it in programs to increase healthy eating. The current study highlights that healthy foods aren’t perceived to be tasty or filling. Identifying healthy and filling snack alternatives and making them readily available would support consumption of healthy foods. In addition to the approaches summarised for Sneaky snackers above, creating online support through QR codes placed in supermarkets linking consumers to recipes for easy-to-make, tasty, healthy meals using produce that's on sale would be beneficial. This would enable them to take advantage of aspects of their environment that already supports healthy habits. For On the way up, healthy eating could be facilitated by increasing the availability of healthy eating opportunities at work, such as providing refrigerators and other small appliances (e.g., blenders) so they can either bring a healthy lunch to work or quickly make one. Additionally, stalls at supermarkets giving samples and demonstrations followed by discount vouchers for healthy foods would increase healthy eating opportunities. Similar to On the way up, Give me a break would also benefit from supermarket vouchers and samples given they perceived they had the least environmental support for healthy eating. Taking advantage of lower prices for fruit and vegetables that are in season and shopping at farmers markets or fruit and vegetable shops instead of supermarkets would also be beneficial for this segment. In this study, socio-economic factors exerted the strongest influence on segment formation with SEIFI having an importance score of 1. Perceptions of healthy food offerings at work were highest for the most economically advantaged segment. A comparison between Sneaky snackers and Give me a break demonstrated that perceptions of support in the work environment for healthy eating were 46.5% higher for Sneaky snackers than Give me a break. Program developers could negotiate with workplaces to offer healthy eating initiatives including healthy snacks and food at work such as weekly fresh fruits or monthly healthy breakfast. Furthermore, policy interventions focussed on balancing food availability across the socio-economic divide are paramount to redress imbalances. This could include increasing the number of healthy food outlets around the area to ensure environmental support for healthy eating.
Limitations and future research
This study used a convenience, cross-sectional male dominated sample across Australia and thus, a caution should be exercised when making generalisations past this sample. Future studies should seek to collect more balanced data from both males and females, and from different socio-economic backgrounds beyond the current sample to make sure that the identified segments match the wider Australian population. For future research, a longitudinal research design is recommended examining the continuing impacts of healthy eating (e.g., decrease in the intake of foods that are unhealthy and growing fruit and vegetable intake) as this would aid in comprehending the replicability and utilisation of the segments over time.
The data was collected using a survey with self-reporting measures. Given participants might feel the need to respond according to social anticipations and could potentially not remember their past behaviour accurately this could lead to biased data. This could be avoided in future research by combining self-reported data with observational data measuring the actual eating behaviour (Bogomolova, 2017).
Even though it is recommended to use segmentation, and previous studies show that when presented with the same program the response from the segments to that program is different (Dietrich et al., 2015a, 2015b), there remains a lack of evidence demonstrating whether program effectiveness will be improved by segmentation. This could be resolved by a field experiment investigating if a segmented program providing tailored solutions is more effective than a program that offers the traditional one-size-fits-all solution.
Conclusion
This study aimed to ensure that environmental support for healthy eating is taken into account by widening the focus of the research past individually focused strategies for change. Furthermore, this study applied the socio-ecological lens utilising a COM-B model-informed survey with a social advantage indicator measure to examine if different healthy eating segments can be identified. The results revealed three distinct healthy eating segments. Respondents in these segments differed significantly in socio-economic backgrounds, social norms and self-efficacy around healthy eating, level of difficulty in perceiving eating healthy at work and finding healthy food at shops, and diet quality score. A longitudinal study is recommended to provide a wider understanding of the segments particularly to reveal if the segments are comprehensive and can be replicated in other populations and scenarios over time due to the limited degree of applicability of the study results to a broader context. The suitability and usefulness of theory-driven segmentation in changing eating behaviours of Australian adults are evidenced by this study. This study provides a significant contribution to the social marketing and healthy eating literature considering the increasing frequency of overweight and obesity among Australian adult population.
Author's contributions
JC, AK and SRT conceived the idea and designed the study. AK and JC analysed the data and AK drafted the initial manuscript. JC, AK and SRT revised the drafted manuscript and approved the final version. All authors read and approved the final manuscript.
Availability of data and materials
The data underlying this article will be shared on reasonable request to the corresponding author.
Supplemental Material
sj-docx-1-nah-10.1177_02601060251319181 - Supplemental material for A socio-ecological lens to segmenting adult's eating behaviour
Supplemental material, sj-docx-1-nah-10.1177_02601060251319181 for A socio-ecological lens to segmenting adult's eating behaviour by Anna Kitunen, Julia Carins and Sharyn Rundle-Thiele in Nutrition and Health
Supplemental Material
sj-docx-2-nah-10.1177_02601060251319181 - Supplemental material for A socio-ecological lens to segmenting adult's eating behaviour
Supplemental material, sj-docx-2-nah-10.1177_02601060251319181 for A socio-ecological lens to segmenting adult's eating behaviour by Anna Kitunen, Julia Carins and Sharyn Rundle-Thiele in Nutrition and Health
Footnotes
Declaration of conflicting interests
The authors declared no potential conflicts of interest with respect to the research, authorship, and/or publication of this article.
Ethical approval
The Human Research Ethics Committee provided ethical approval for the study (approval no. 2021/487).
Funding
The authors disclosed receipt of the following financial support for the research, authorship, and/or publication of this article: This research is supported by the Commonwealth of Australia as represented by the Defence Science and Technology Group of the Department of Defence.
Supplemental material
Supplemental material for this article is available online.
References
Supplementary Material
Please find the following supplemental material available below.
For Open Access articles published under a Creative Commons License, all supplemental material carries the same license as the article it is associated with.
For non-Open Access articles published, all supplemental material carries a non-exclusive license, and permission requests for re-use of supplemental material or any part of supplemental material shall be sent directly to the copyright owner as specified in the copyright notice associated with the article.