
Abstract
Introduction
The global consumption database estimates that people in low- and middle-income countries spend more than 2.3 trillion dollars on food and beverage. India, like other developing countries, has witnessed a significant increase in ‘eating out’ (EO) among dietary behaviours (Blick et al., 2018; Fiedler and Yadav, 2017; U.S. Department of Agriculture, 2022). U.S. Department of Agriculture reports that India spends 30% share of consumer expenditure equal to $6000. These changes are linked to evolving trends in work and leisure which in turn are governed by economic factors. The relationship between food and the economy is bidirectional. However, contradictory associations have been observed between food and the economy. For instance improvement in the gross domestic product (GDP) does not necessarily reflect in improved diet quality (Meenakshi, 2016), as observed in the association between consumer expenditure and overnutrition. Evidence suggests that energy consumption outside the home increases with increasing GDP or household incomes (Gaiha et al., 2013a; Gaiha et al., 2013b). Work by Kuchler and Stewart (2008) (Kuchler and Stewart, 2008) explains the impact of monetary factors on food behaviour. While prices of raw or unprepared or processed foods remained relatively stable, the availability of alternate processed foods at a comparable price offers the convenience of using the time for food preparation for other activities (Anekwe and Rahkovsky, 2013). The form and economic function of eating out have contributed to diversified diets (Peter Cullen, 1994). Thus, economic transition affects food behaviour and impacts health.
Growing economies are characterised by urbanisation and socio-demographic variations. India experienced rapid demographic and economic transition fuelled by the liberalisation of the economy in the 1990s. In such economies, empirical evidence on emerging dietary behaviours is few. In India, food expenditure surveys are limited to consumer behaviour or poverty assessment (Ali and Nath, 2013). On the contrary, existing dietary assessment measures lack an economic perspective and often fail to measure nutrition transition. Most studies measure the intake of specific foods such as ultra-processed foods as emerging dietary habits (Walls et al., 2018). EO in India has been explored on the premise of its magnitude and determinants, and from a consumer's stance (Ali and Nath, 2013; Gaiha et al., 2013b; Srinivasan and Ramprasad, 2021). However, understanding food behaviour from an economic standpoint is likely to provide a relative knowledge of the food systems and nutrition transition. In the absence of a measure for nutrition transition, food expenditure surveys need to be exploited to study emerging dietary behaviours.
Therefore, our work proposes to compare the macro-data on per capita income (PCI) and gross state domestic product (GSDP) from India with household expenditure on EO. Using the nationally representative India Human Development Survey (IHDS) II micro-data our work further aims to study the socio-demographic and economic determinants of household expenditure on eating out in India.
Methods
Data
The present study used data from the IHDS II conducted by the National Council of Applied Economic Research (NCAER) during 2011–2012 (Desai and Vanneman, 2018). The IHDS is a collaborative research program between researchers from the NCAER, New Delhi and the University of Maryland. It is a nationally representative multi-topic panel survey of households, conducted in 1503 villages and 971 urban neighbourhoods across India. The survey involved face-to-face interviews with members of 42,152 households. In IHDS I, two one-hour interviews in each household covered topics concerning health, education, employment, economic status, marriage, fertility, gender relations and social capital. IHDS II data were mostly re-interviews of households interviewed for IHDS I. The response rate was 85% for the total sample. Data regarding GSDP and PCI was obtained from the report published by Economic Statistical Organisation, Punjab and Central Statistical Organisation, New Delhi (Economic statistical Organisation Punjab and Central Statistical Organisation, New Delhi, 2021).
Measures
The present study employed expenditure on eating out as the main outcome variable. The survey elicited information on the total amount of money spent by the household on eating out 30 days prior to the date of the interview. The data on eating out expenditure was restricted to restaurants or other places outside the home, while online orders or home delivery of food was not included. The survey instrument also elicited information on the socio-demographic and economic characteristics of the participants. Our study included a list of theoretically pertinent socio-demographic and economic predictors in the analysis, such as religion (Hindu; Muslim; Christian; others), caste (General; SC; ST; OBC; others), place of residence (rural; urban), migration for work, household heads educational level, number of members in the household, main income source of the household, total annual household income, household consumption expenditure and poverty status as per Tendulkar scale (2012). The economic status was categorised into two, namely, below poverty line (BPL) and above poverty line (APL). Migration for work in the IHDS II was defined as any member of the household who migrated to find seasonal/short-term work in the last 5 years and returned to the place of residence.
Analytic approach
Analyses were based on weighted data to account for the complexity of the survey design. Associations were analysed using the Pearson chi-square test, and binary and multinomial logistic regression. Those variables that showed significant association using binary logistic regression (COR), were further subjected to multinomial regression (AOR). Associations with a p = <0.05 was considered as statistically significant. The analysis was done using the statistical package for the social sciences (SPSS) for Windows Version 23.0 (International Business Machines Corporation-IBM Corp., Armonk, New York). We focused on the socio-demographic and economic status of households that spent money on eating out. Eating out according to IHDS refers to meals or snacks served in restaurants, roadside eating places, tea and snack shops, and food vendors. Cross-tabulation was done between the dependent variable (expenditure on eating out) and all independent variables. Finally, binary and multinomial logistic regression models were fitted to assess the adjusted effects of socio-demographic and economic characteristics on the expenditure on eating out.
Results
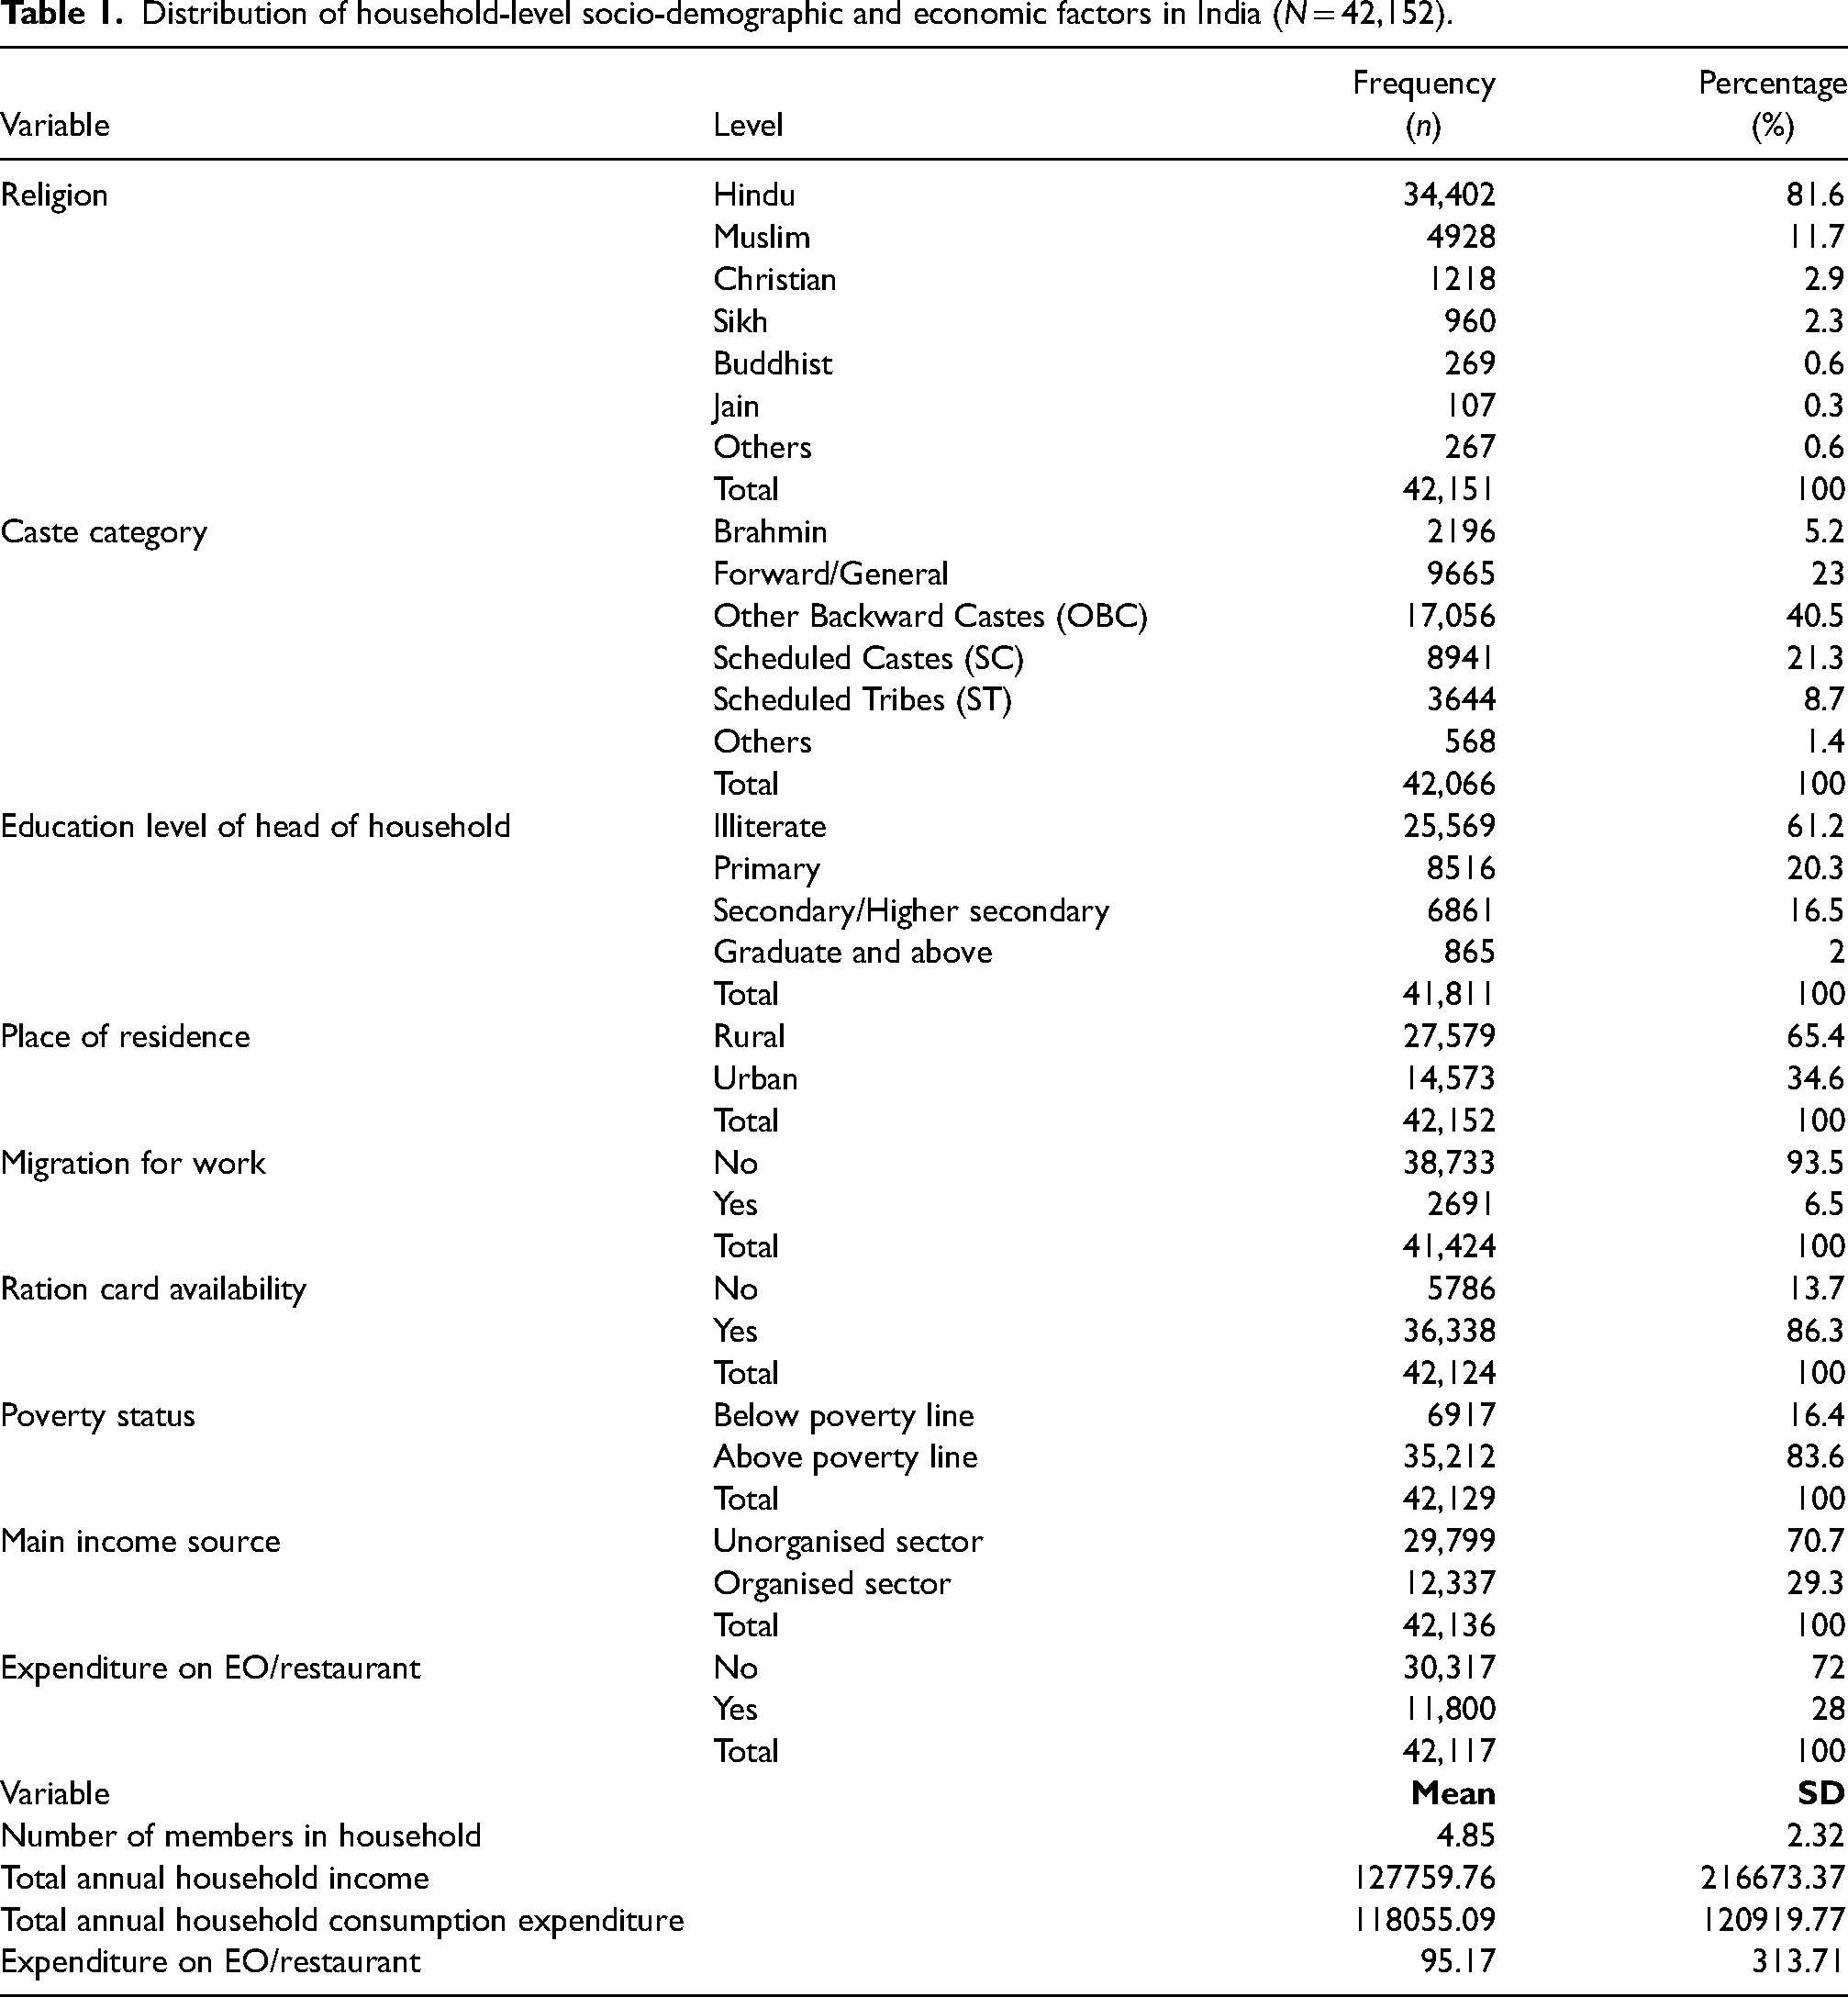
The distribution of socio-demographic and economic characteristics of the households in India is presented in Table 1. IHDS II collected data for 42,152 households throughout India. More than 80% of the sample belonged to the Hindu religion, followed by Muslim (12%) and Christian (3%). The majority, belonged to the other backward classes (OBC) category (40%), followed by forward/Brahmin (28%) and scheduled caste (SC) (21%). Almost, two-thirds of the sample was rural (65%). The majority of the sample had ration cards (86%) and were above poverty line (83%) as per the Tendulkar poverty scale (2012). About 70% of the sample had unorganised sectors (such as cultivation, agriculture wage labour, non-agriculture wage labour wage labour etc.) as the main source of household income. The mean annual income of the sample was Rs. 127,760 ± 216,673 (USD 1638), while the mean annual household consumption expenditure was Rs. 118,055 ± 120,920 (USD 1513). The mean expenditure prior to 30 days from the day of enquiry was Rs. 95 ± 314 which ranged from Rs. 0 to Rs. 20,000.
Distribution of household-level socio-demographic and economic factors in India (N = 42,152).
The distribution of state-wise household mean expenditure on EO and GSDP, and PCI of the selected Indian states/Union Territories are presented in Table 2. Households in Rajasthan spent the least money (Rs. 14) on EO followed by Daman & Diu (Rs. 20). While households in Chandigarh spent the most money (Rs. 325) on EO, Mizoram (Rs. 306) had the lowest GSDP (Rs. in crores 7259) among the states. Maharashtra had the highest GSDP of Rs. 1,280,369 (in crores), while Goa had the highest PCI of Rs. 259,444.
GSDP, PCI and state-wise household mean expenditure (in Rs.) on EO (N = 42,152).
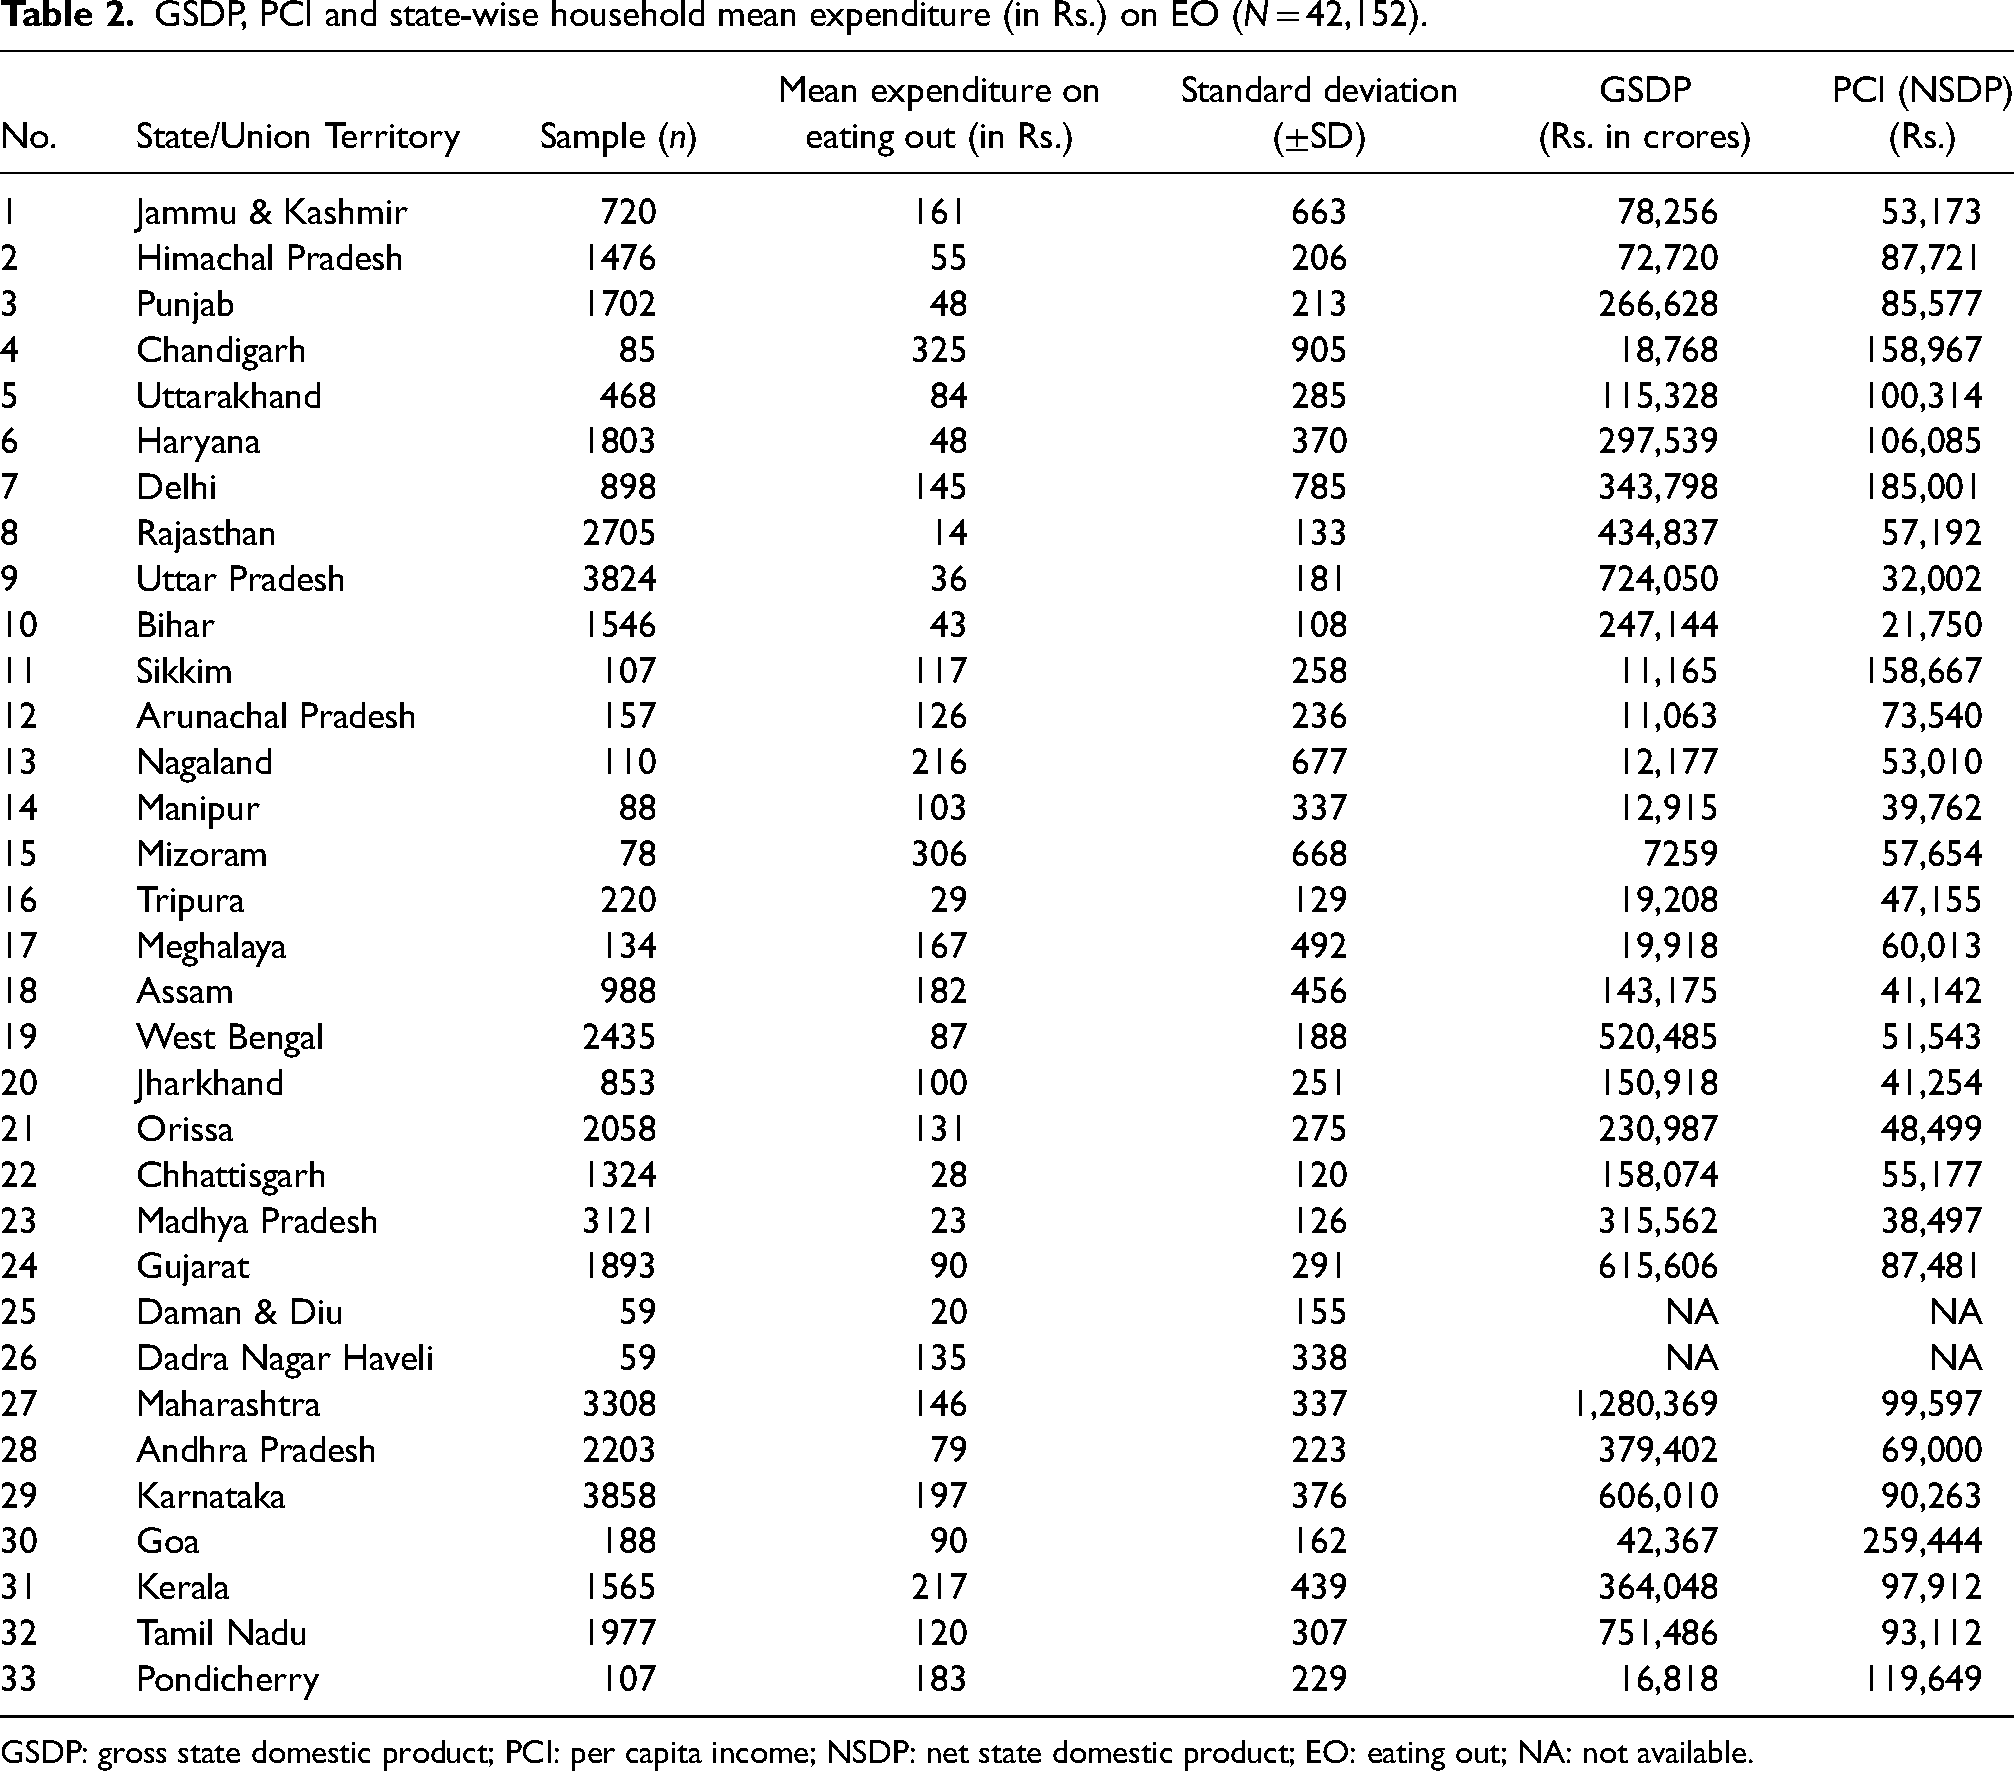
GSDP: gross state domestic product; PCI: per capita income; NSDP: net state domestic product; EO: eating out; NA: not available.
Figure 1 shows a combined chart of the expenditure on EO and GSDP of selected Indian states/Union Territories. Novel patterns emerged with such a comparison. Chandigarh, Mizoram and Nagaland which had the lowest GDP (< 2 lakh crores INR) reflected the highest mean expenditure in EO viz, Rs. 325, 306 and 216, respectively. And Maharashtra, with the highest GSDP, showed a lesser mean expenditure of Rs.146. Similar patterns of high GSDP and low expenditure on EO were observed in Tamil Nadu, Gujarat and Andhra Pradesh. On the contrary, Uttar Pradesh, Madhya Pradesh and Rajasthan, showed low expenditure despite high GSDP.
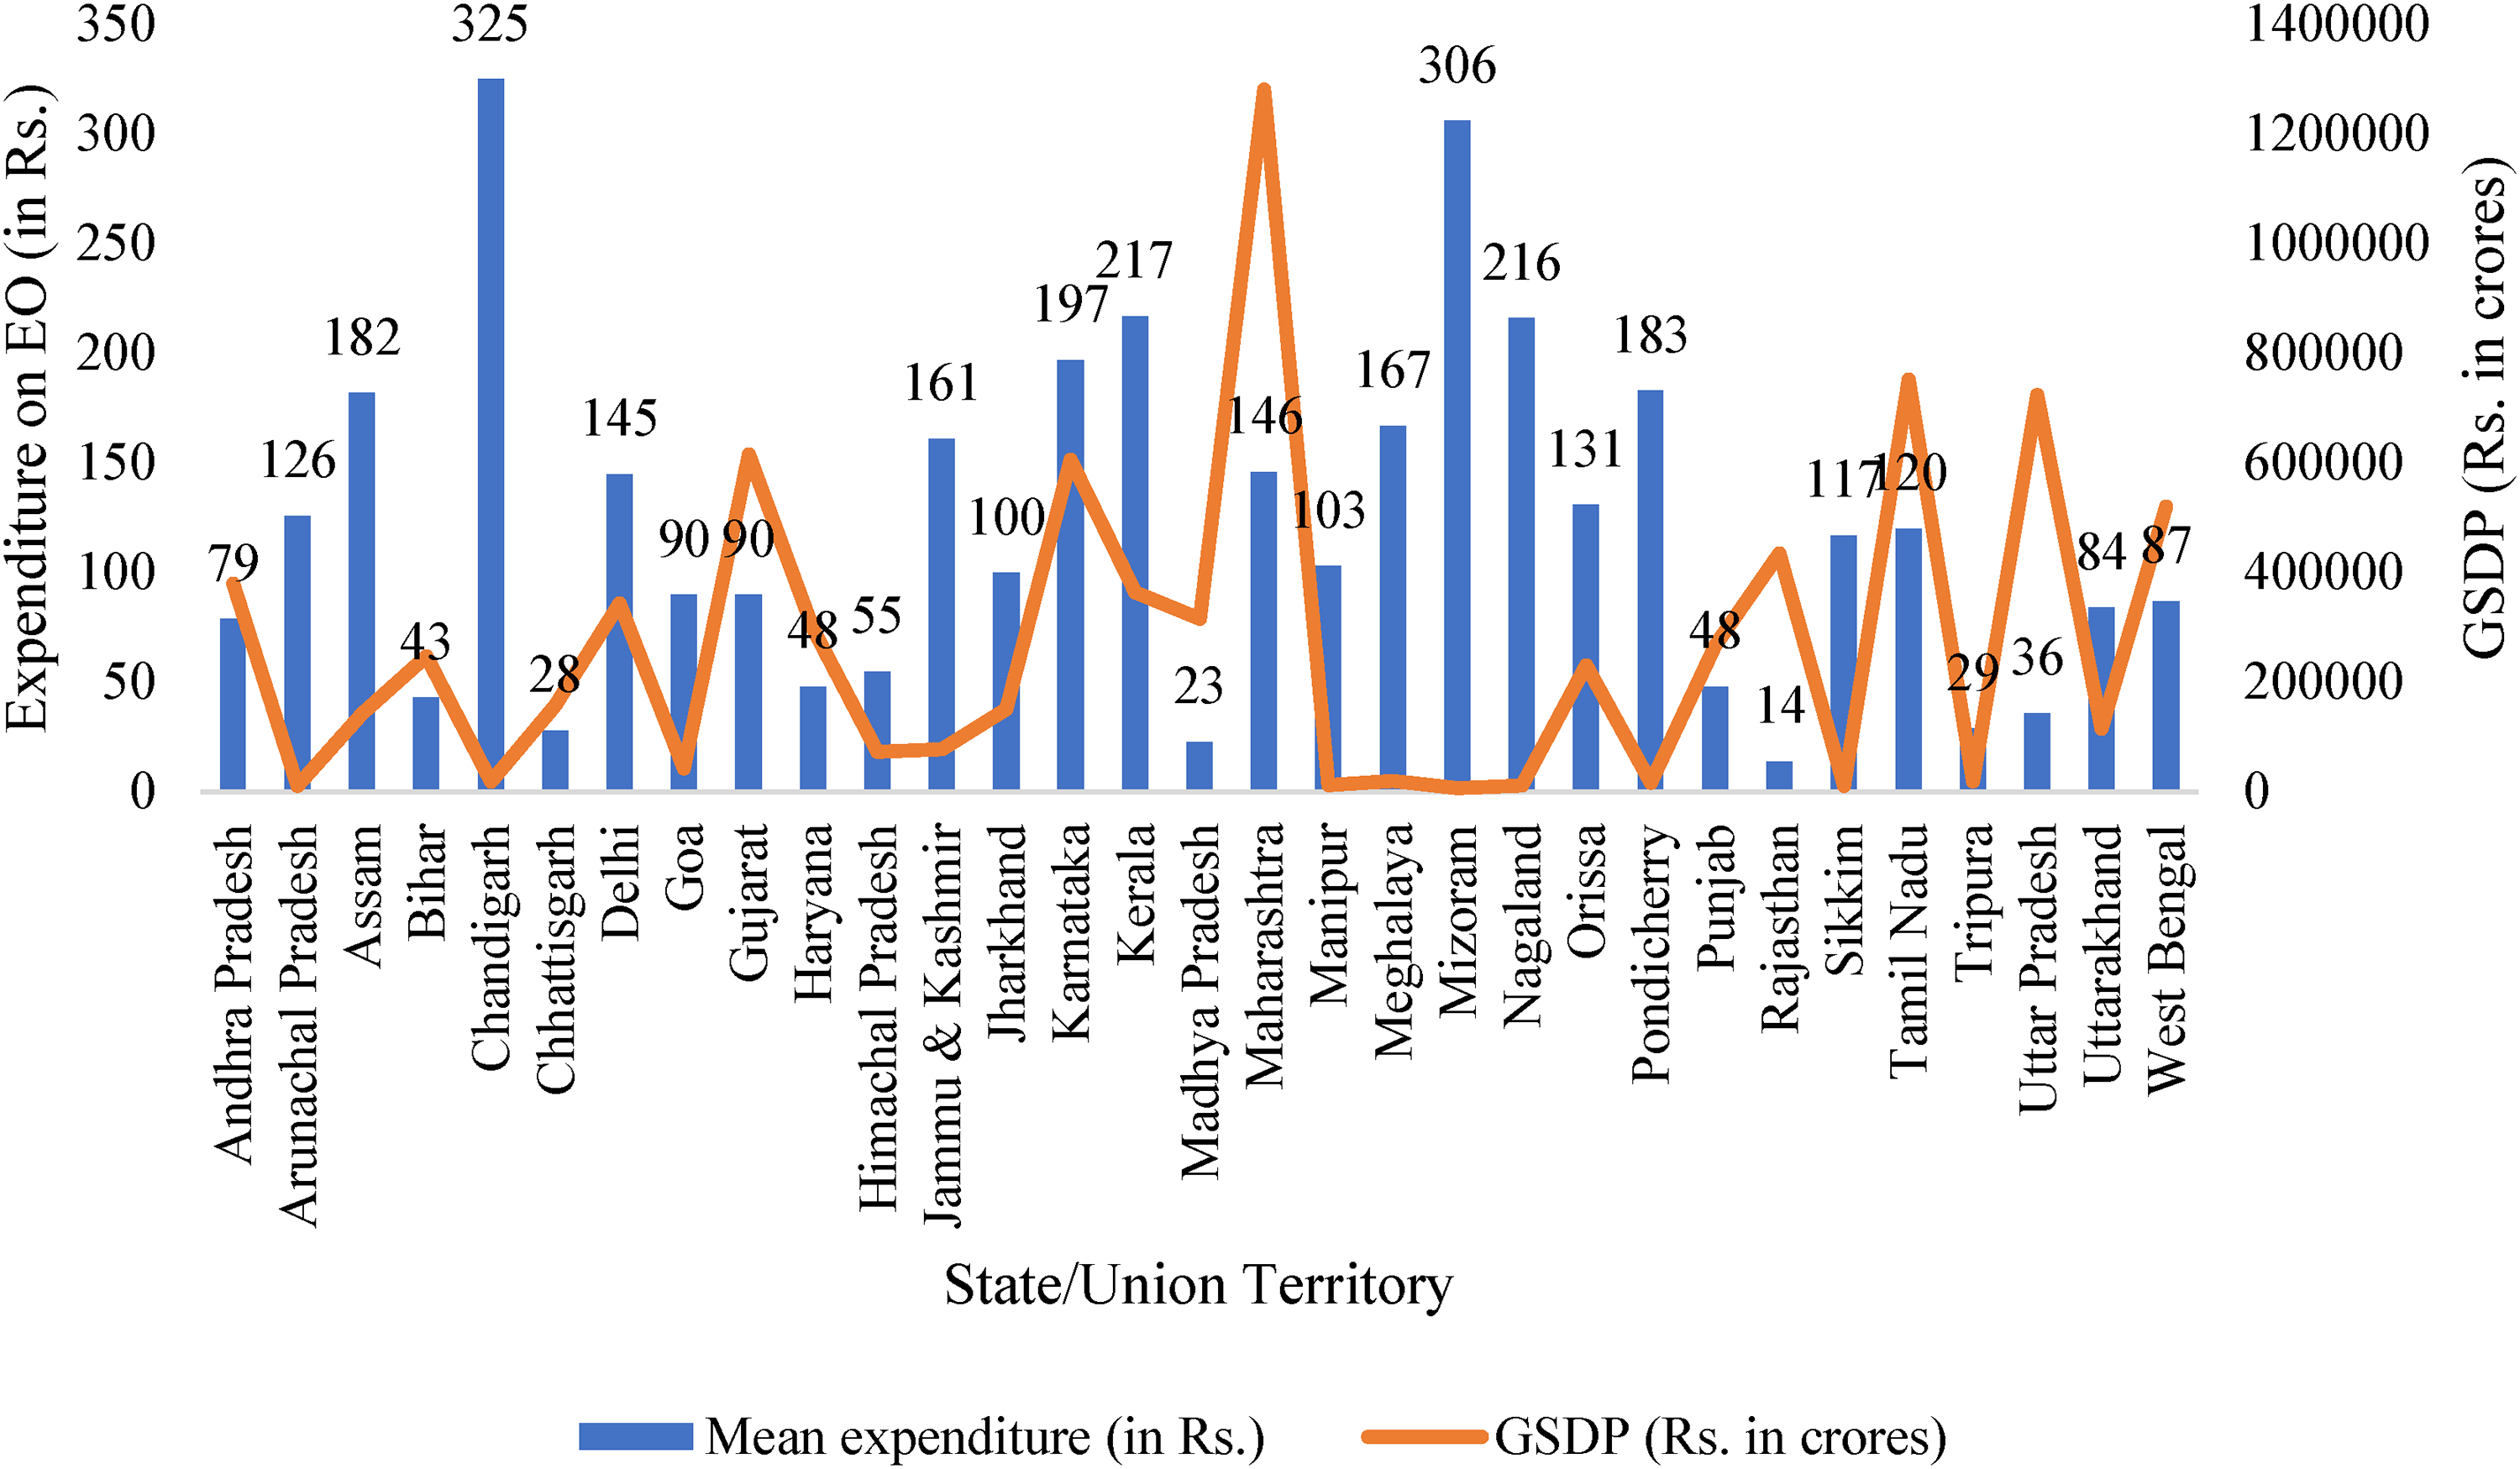
Expenditure on eating out (EO) and gross state domestic product (GSDP) of selected Indian states/Union Territories.
Figure 2 shows a combined chart of the expenditure on EO and PCI of selected Indian states/Union Territories. There is clear evidence that the states with low PCI such as Bihar, Madhya Pradesh and Uttar Pradesh spend less on eating out. Despite having a moderate PCI (Rs. 15,00,000), Chandigarh showed high expenditure in EO. In contrast, Delhi and Goa showed high PCI and correspondingly high expenditure in EO. Unlike GSDP, PCI in Maharashtra and Tamil Nadu were lesser compared to Delhi or Goa, and the expenditure for eating out ranged from Rs. 120 to 140.
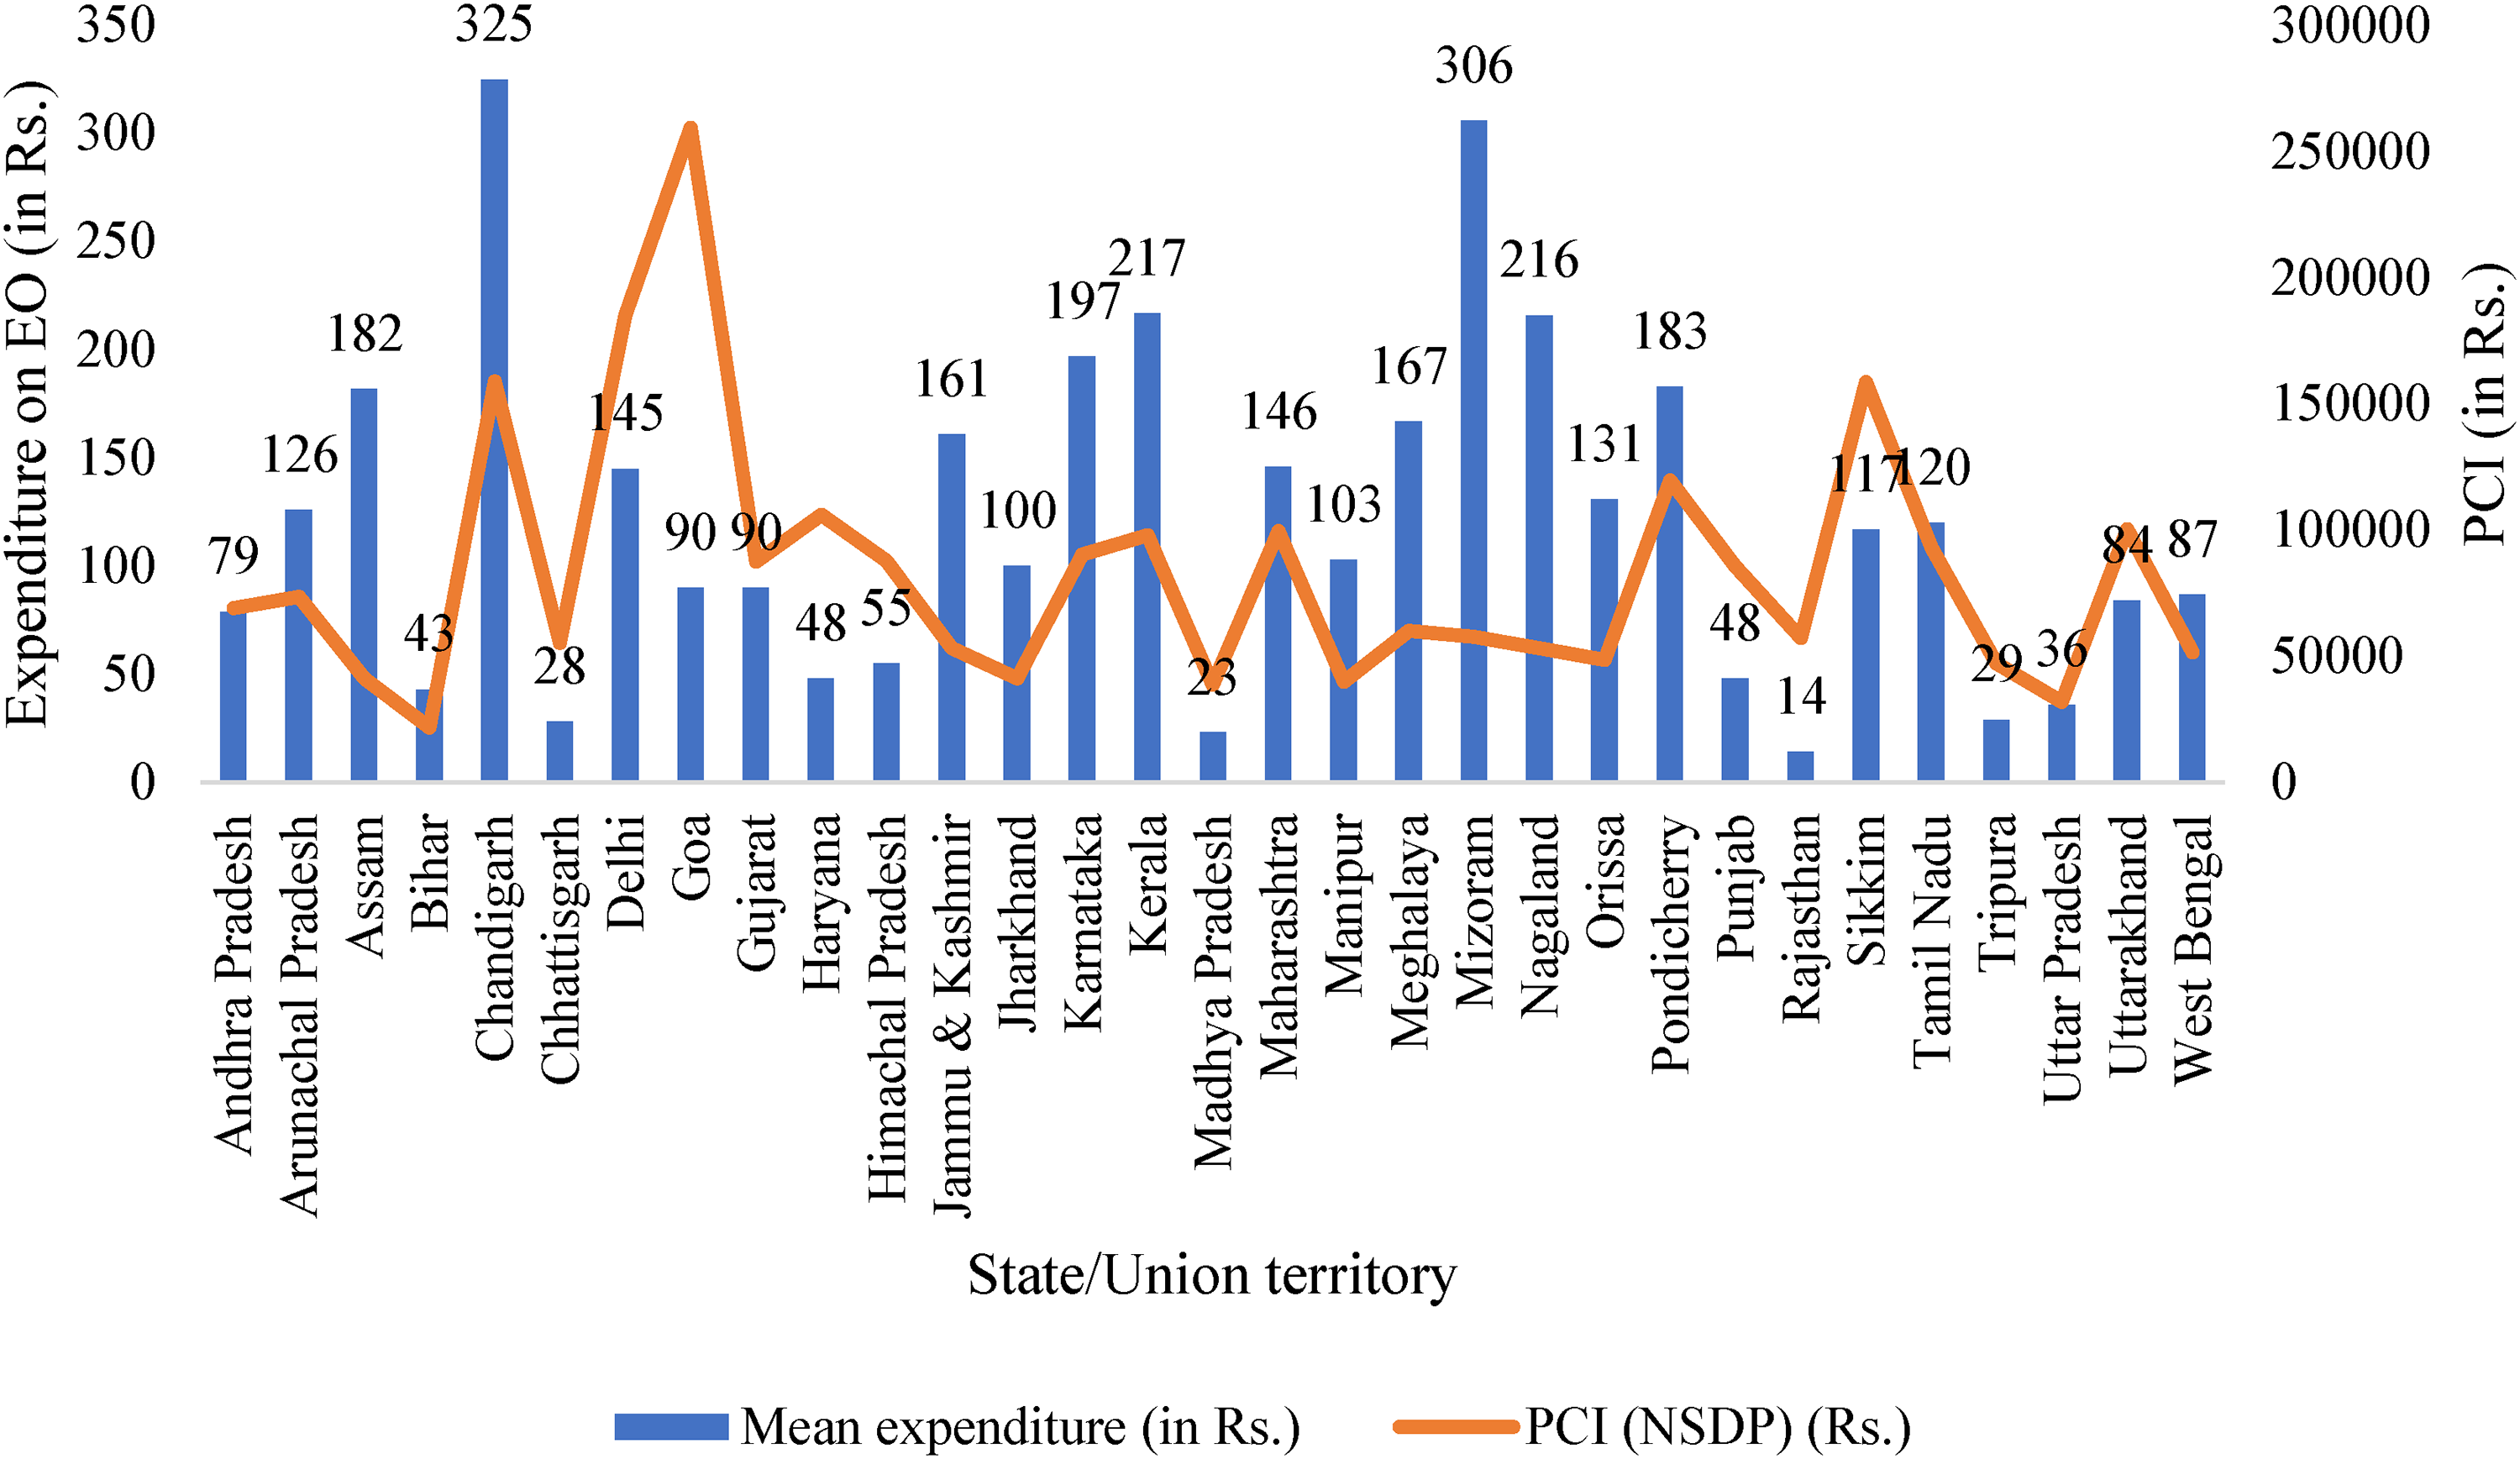
Expenditure on eating out (EO) and per capita income (PCI) of selected Indian states/Union Territories.
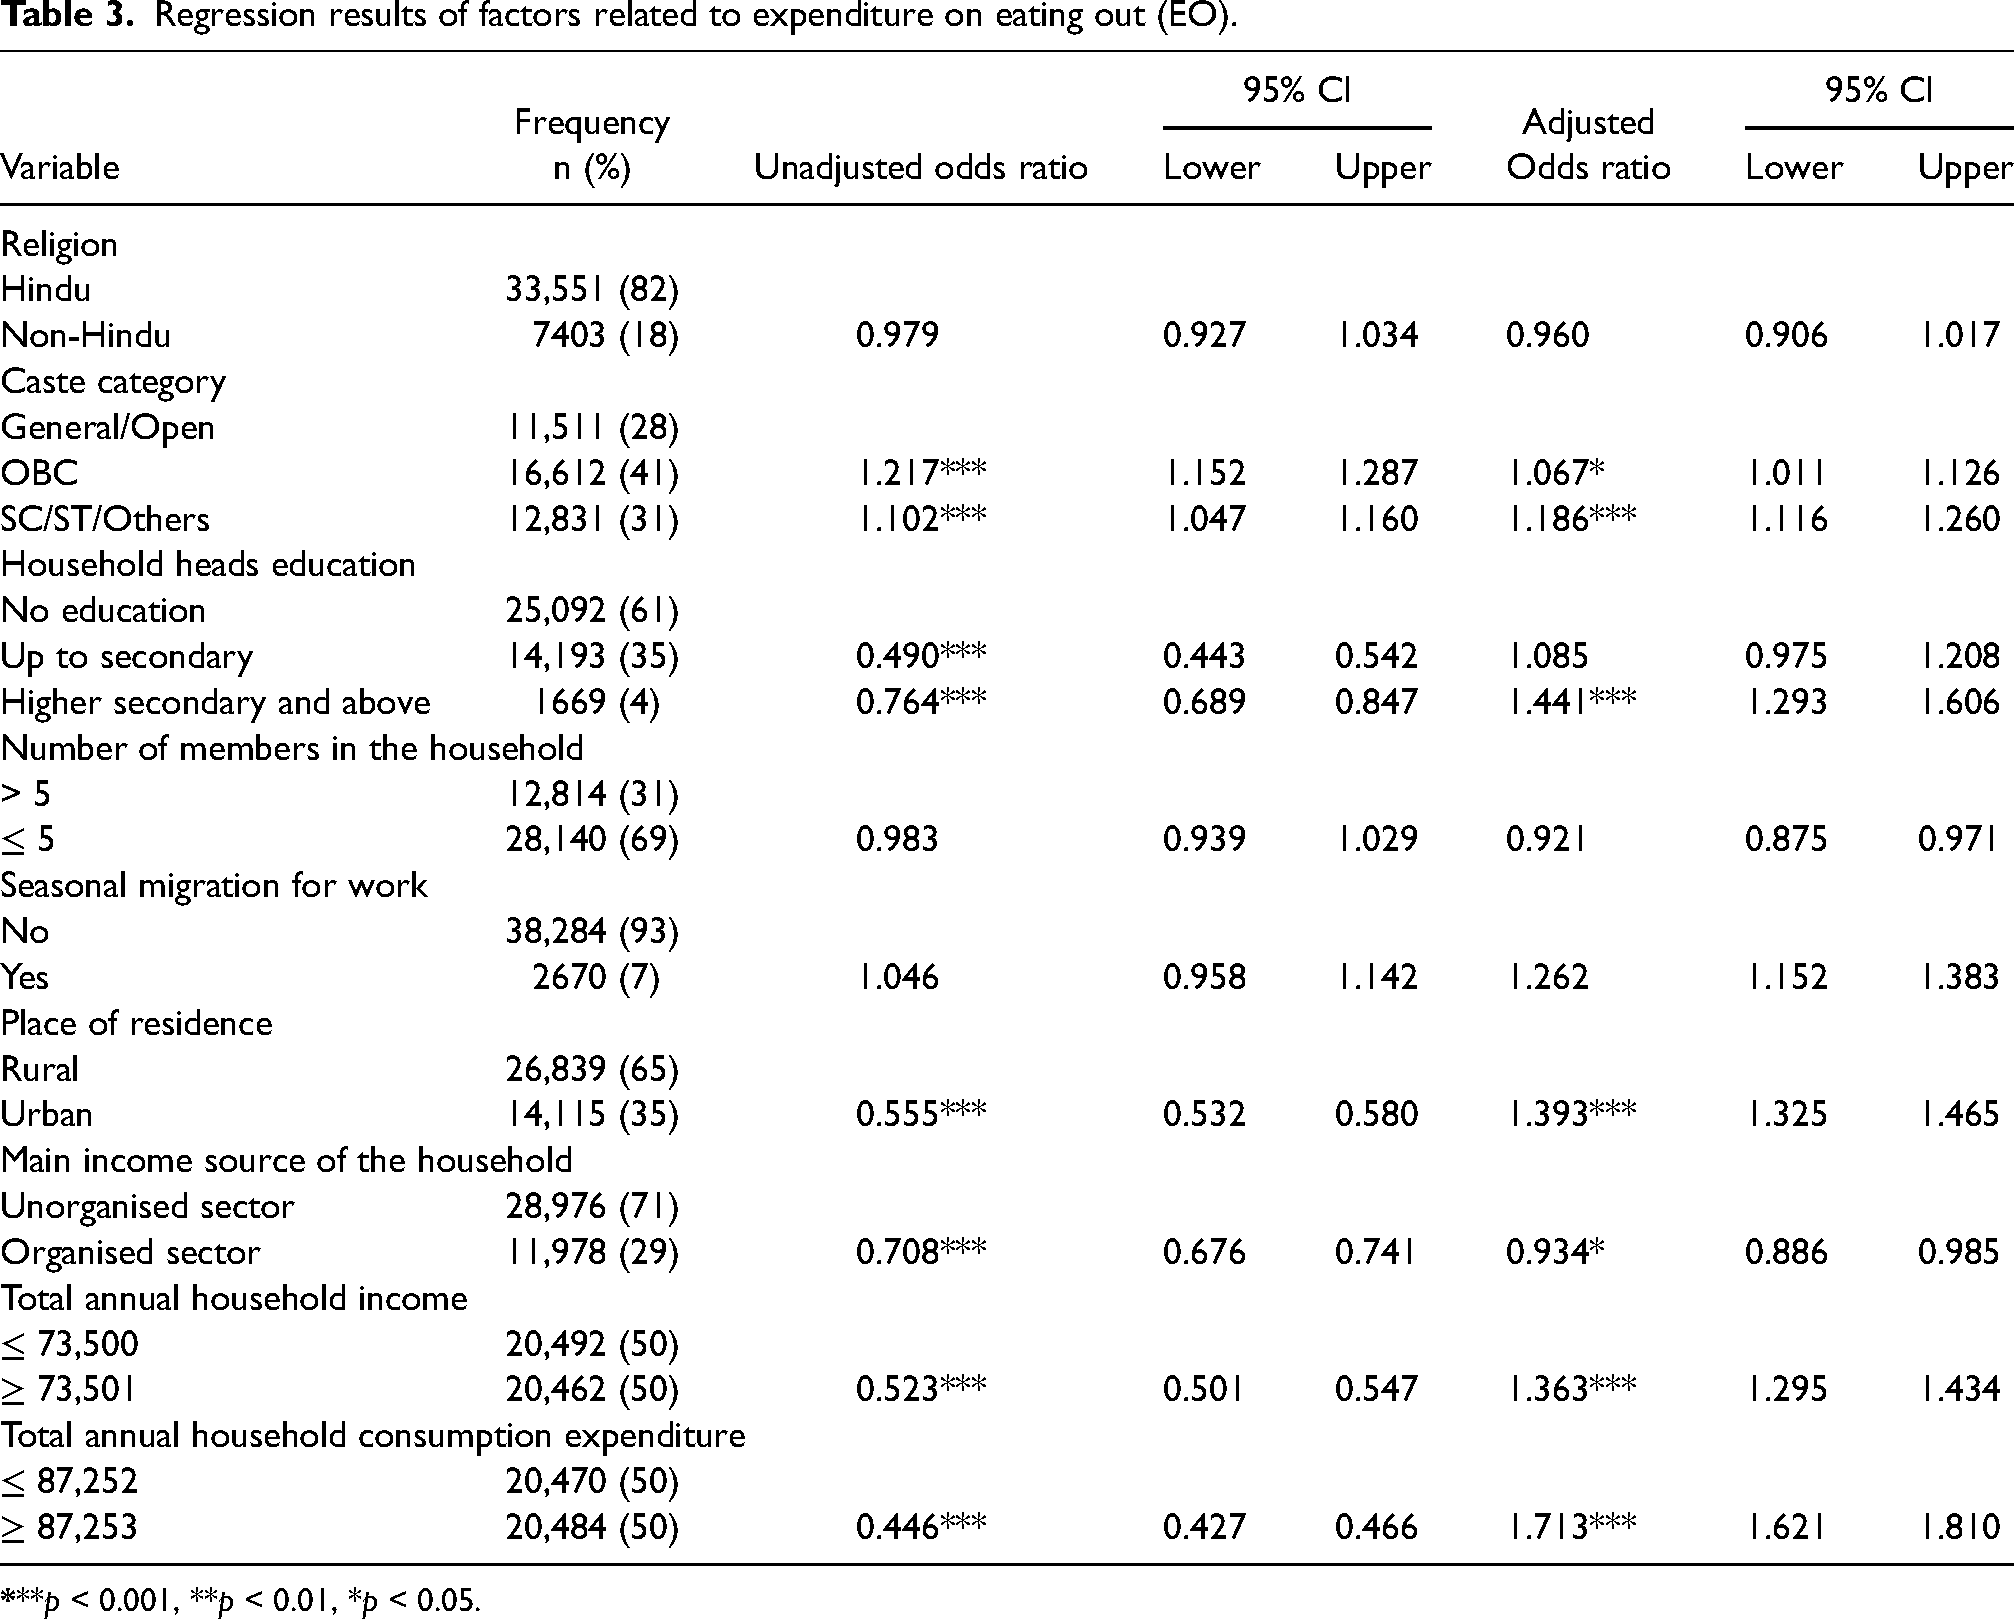
Table 3 shows the logistic regression results of factors related to expenditure on EO. Among all the variables tested for binary logistic regression, reserved caste categories like OBC [COR 1.2 (1.1–1.2)] and SC/ST/Others [COR 1.1 (1–1.1)], household heads education up to secondary [COR 0.4 (0.4–0.5)] and higher secondary and above [COR 0.7 (0.6–0.8)], urban place of residence [COR 0.55 (0.53–0.58)], organised sector [COR 0.7 (0.6–0.7)] as the main income source of the household, higher annual household income [COR 0.52 (0.50–0.54)], and higher annual household consumption expenditure [COR 0.44 (0.42–0.46)], were significantly associated. All these variables stayed significant in the multinominal regression model as well. In general, the expenditure on EO was higher among the households from reserved caste categories (such as OBC/SC/ST/Others) and among the urban residents. The expenditure on EO increased with increasing education, annual household income, and annual household consumption expenditure.
Regression results of factors related to expenditure on eating out (EO).
Discussion
In the absence of empirical evidence on the socio-demographic and economic determinants of household expenditure on eating out in India, our analysis utilised the nationally representative IDHS II data to derive the determinants. Although not many studies have performed such analyses, our results with specific economic indicators such as GSDP and PCI did not show consistent patterns. While GDP, an important macro-economic indicator has been shown to be associated with eating out (Enz, 2009), only a few Indian states (Maharashtra, Tamil Nadu and Gujarat) showed such trends. Scarce evidence is available about the association between GDP and EO. However, from an industry perspective research supports the positive association between GDP and sales at full-service restaurants and thus is volatile to economic changes (Lee and Ha, 2012). Few other states (Chandigarh, Mizoram and Meghalaya) despite having low GSDP showed high expenditure on EO. This could be attributed to tourism contributing to the economy and favouring food away from home (FAFH). Few other states with less input in the economy by tourism did not show such trends (Madhya Pradesh and Uttar Pradesh).
PCI another macro-economic indicator is known to impact FAFH. States with low PCI showed a clearly low percentage of expenditure to eat out. However, inverse trends with PCI and expenditure were seen in states such as Goa and Sikkim which have a strong tourism-based economy.
The analyses of IHDS II for economic determinants identified that the reserved caste categories spent higher on EO. The reserved castes in India majorly represent the poor sections of the population. Evidence from Nigeria suggests poorer households purchased low-cost unhealthy food options compared to families with higher incomes (French et al., 2019). Although the reserved castes in India may be unable to afford a full restaurant meal, cheaper options from street foods accessible between works could contribute to such observations. Even at country-level comparisons, such associations have been observed with expenditure on food (Stewart et al., 2004).
Our work identified an increase in food away from home (FAFH) consumption associated with higher education. Gäl and co-workers too identified similar associations with education and FAFH in Turkey (Gäl et al., 2007). They observed that the percentage consumption increased with increasing levels of education and the mother's education specifically influenced FAFH. Evidence from Nigeria contradicted our findings where the FAFH intake reduced with higher education, twice as much among richer compared to poorer households (Ogundari et al., 2015). The combined influence of education and income and other sociodemographic characteristics are likely to have contributed to such variations.
Contradictory associations are observed between urbanisation and EO. While evidence in India suggests urbanisation to contribute to increased consumption of FAFH (Bren d’Amour et al., 2020), another case study of evolving diets of an urbanized Indian society suggests multiple factors such as changing demography, infrastructure, market access and proportion of working women impact eating behaviour (Pandey et al., 2020). In a developing economy like India, the rural consumption growth was reported to be higher than the urban growth (9.6% vs. 8.6%, respectively) with raised incomes, improved literacy and evolved lifestyle. Thus, the differences in diet behaviour between these settings are likely to be minimised (Thukral, 2018). Among the evolving dietary trends, eating out reflects 38% of preferred choices in India (World Economic Forum, 2019).
The source of income mainly from the organised sector and higher annual household income were contributing factors for EO in our analyses. These observations are in consonance with existing literature. Households with multiple incomes that represented higher income groups showed a higher expenditure on FAFH (French et al., 2019). Country-wise data shows similar associations. In developed countries, modest growth in household income combined with demographic changes, is reflected in a 24% increase in EO expenditure (Nelson, 2019; Stewart et al., 2004). Percent expenditure for food also governs the expenditure on eating out. While developed countries report over one-fourth of a dollar being used for eating out (U.S. Department of Agriculture, 2022) such evidence is unavailable in developing countries.
The population above poverty line spent more on EO as per our findings. It is vital to note that in India, calorie intake is equated to poverty and is assessed indirectly through expenditure for food. This shows the prevailing inequality in a country experiencing transition. Studies on food expenditure that reflect a decline in calorie intake in India, need to be interpreted with care, as when compensated with expenditure for food away from home the intake calorie decline was compensated (Gaiha et al., 2013b; Oldiges, 2012). Thus, income and expenditure studies are equally important to study the evolving diet patterns.
The results of the study need to be carefully interpreted considering the following limitations. The macro-economic indicators reflect the proximal determinants of human behaviour that impact health and this work did not study GDP and PCI as determinants of expenditure for EO. However, ours is one of the first micro-economic analyses of EO using IDHS II to study its determinants. Although the use of nationally representative data allows for generalizability of the findings, categorisations in caste as ‘other’, a broad rural, urban division without cities or towns and economic classes as above and below poverty line limits analysis for the sub-categories or classes which are relevant for this analysis. The sample size for every variable studied varied due to the missing data which is an inherent limitation of national surveys. The non-availability of any national data that on EO expenditure, restricted us to use IHDS 2012. Round III of the IHDS is currently underway that would be compared in the subsequent analysis. As secondary data published in 2011 was used for this analysis, the likelihood of online orders or home deliveries was not significant during this period and therefore did not reflect in our work.
Conclusion
This analysis confirms the increase in household income along with other demographics, increases the probability of eating out. However, such trends remained inconsistent in macroeconomic assessments using GSDP and PCI. Those in the lower middle and lower socioeconomic classes are likely to adapt to this EO behaviour with the current demographic changes that characterize nutrition transition. The increased behaviour of EO in a developing country like India stresses the need for healthy EO environments viz. availability, accessibility, and affordability of healthy foods to prevent a further rise in non-communicable diseases (Centers for Disease Control and Prevention (CDC), 2020).
Footnotes
Authors’ contributions
SRG, AJ and HK contributed to the conceptualization, and writing the article, and critically reviewed the methodology. SRG analysed the data. All authors critically revised the manuscript and approved the final version of the paper.
Availability of data and materials
The data that support the findings of this study are available from the corresponding author (SRG) upon reasonable request.
Declaration of conflicting interests
The author(s) declared no potential conflicts of interest with respect to the research, authorship, and/or publication of this article.
Funding
The author(s) disclosed receipt of the following financial support for the research, authorship, and/or publication of this article: The corresponding author Mr Swapnil Godbharle is currently funded by the Fourth Industrial Revolution (4IR)/Global 316 Excellence and Stature Scholarships (GES) 4.0 doctoral fellowship award (202004683). DBT Wellcome Trust. Grant number – AAS/AIMF18/R.4/003.