
Abstract
Introduction
The epidemic of obesity is one of the most important public health problems facing the world today. According to the World Health Organisation (2016), there are around 2 billion adults overweight, of whom 650 million are considered to be affected by obesity. That equates to 39% of men and 40% of women who were overweight. The worldwide prevalence of obesity nearly tripled between 1975 and 2016. If current trends continue, it is estimated that 2.7 billion adults will be overweight, over 1 billion affected by obesity, and 177 million adults severely affected by obesity by 2025 (World Obesity Federation, 2019). Not surprisingly, India has one of the fastest growing obesity rates in the world. It is estimated that there are 135 million obese individuals in India (Pradeepa et al, 2015).
Obesity is associated with increased risk of comorbidities such as type 2 diabetes mellitus, dyslipidemia, hypertension, obstructive sleep apnoea, certain types of cancer, steatohepatitis, gastroesophageal reflux, arthritis, polycystic ovary syndrome and infertility (Haslam and James, 2005). Obesity is associated with an increased rate of death from all causes and from cardiovascular disease. The risk profile can be expressed as a J-shaped curve with progressively greater mortality as BMI increases >25 kg/m2. Excess body weight contributed to four million deaths globally in 2015 and more than 320,000 deaths in the United States in 2014 (Afshin et al, 2017).
Overnutrition is associated with the increased risk of mortality and co-morbidities (Bhattacharya and Sood, 2011 and Preston and Stokes, 2011). Over nutrition also increases the risk of diabetes. High BMI has a two times greater risk of developing type II diabetes compared to low BMI. The results showed that general obesity had a risk of 2.24 times while abdominal obesity had a risk of 2.44 times for the occurrence of diabetes (Susilawati, 2015). Evidence on the causal impact of over nutrition on diabetes is scarce for India. The likelihood of being both prediabetic and diabetic is higher among the overweight and obese individuals as compared to the non-overweight individuals (Gupta and Bansal, 2012).
Body Mass Index (BMI) is the most commonly used anthropometric method to categorize individuals based on their weight. BMI is more useful than Waist Hip Ratio (WHR) for predicting metabolic syndrome (MetS) and its components (Wang et al, 2009).
In type II diabetes patients, abnormalities of lipid metabolism can be found in the form of dyslipidemia. Dyslipidemia is a disorder of lipid metabolism characterised by an increase or decrease in lipid fraction in the plasma. The main lipid fraction abnormalities include increases in Total Cholesterol (TC), Triglycerides (TG), Low-Density Lipoprotein (LDL), and decreased High-Density Lipoprotein (HDL). Dyslipidemia caused by diabetes is secondary dyslipidemia.(Koampa et al, 2016 and Julianto et al, 2018). The pattern of dyslipidemia frequently observed in people with diabetes includes raised TG, decreased HDL and slightly raised or normal plasma concentrations of LDL Cholesterol (Schule et al, 2004).
Association of lipid profile is reported with lifestyle, intra-abdominal adiposity, obesity and BMI (Omotoye and Fadupin, 2016). But the South Asian population is found to have a higher abdominal obesity as compared to the population in the European regions; therefore, the susceptibility towards certain types of diseases, such as diabetes and so as the lipid abnormalities may vary across these regions even if the BMI values are comparable (Patel et al, 2001 and WHO, 2000).
Objectives
Based on the background described, the researcher was interested in examining the influence of BMI on the lipid profile of type II diabetes patients.
Where, the Null Hypothesis (
Subjects and Methodology
A considerably large sample of 500 type II diabetes patients who attended the outpatient department of Endocrinology wing of NIMS Medicity (NICER-Noorul Islam Centre for Endocrinology Research), Thiruvananthapuram, Kerala, India were selected to the macrosample pool following purposive non-random sampling method. A sample size of 500 for the survey was fixed based on the universal sample rule named 1/6th rule. This states that in cases where the population has more than 3000 and less than 5000 numbers, the maximum possible sample size is 3000/6 = 500. The fixed sample size was attained by selecting patients based on an eligibility criteria specifically designed for this study that is age 30-70 years, both male and female and those who are free from serious illness, fractures, post operative cases, antenatal, postnatal mothers, and those with food allergies and those who assure of attending the clinic during the period of study, coherent, alert and willing to participate in the study. The study duration was five years.
A brief description of the study, its objectives and the declaration of confidentiality were informed to the participants before administering the data collection instruments. Informed consent was taken from all the participants during the enrollment itself. Participants were also requested to be honest in their responses.
Details on various nutritional status indicators, namely socio economic profile, anthropometric, clinical status and dietary factors were collected from the patients using standard tools and through direct Interview method. The biochemical investigations of the patients such as fasting blood glucose (FBG). Postprandial blood glucose (PPBG), Glycosylated haemoglobin (HbA1C), lipid fractions such as TC, TG, HDL and LDL were drawn from their medical records following the secondary data collection method.
Height was measured up to the nearest millimeter using a stadiometer. The subjects were made to stand erect on a flat floor against a levelled wall with heels together and upper limbs hanging closely to the side. Weight was recorded to the nearest 100g using a bathroom weighing scale. The scale was placed on flat ground and zero error was adjusted.
BMI- The nutritional status of adults (men and women) was determined by computing BMI as suggested by WHO guidelines (WHO, 1995 and WHO Expert Consultation, 2004). The BMI (kg/sq.m), also known as the weight-height index, is derived by computation as the quotient of weight (kg) divided by height (meters) squared.

The approval was obtained from the Institutional Ethics Committee on 28/06/2014 and the Approval Number is 13/IEC/GTKA.
Statistical analysis
The hypothesized, the SEM developed was evaluated by several model fit indices such as the Goodness-of-Fit Index (GFI), the Adjusted Goodness-of-Fit Index (AGFI), the Normed Fit Index (NFI), the Comparative Fit Index (CFI), and the Root Mean Square Error of Estimation (RMSEA) along with the parameter estimates (IBM SPSS AMOS 22.0). Descriptive Statistics like frequencies and percentages, means and standard deviations, were also used to describe selected variables. In this study, the alpha level for all significance tests was set at the 0.05 level.
Results
Results of the study show the descriptive analysis details to describe the selected variables and finally the results of the SEM analysis in order to answer the research question of the study.
Demographic profile of the patients
The sample pool consisted of 283 male and 217 female patients, and more than half (52%) of the patients belonged to the age group of 45-60 years category. Overall, most of the patients (86.8%) were married. The educational background of the patients indicated that close to half of the patients (male patients 50.5% and female patients 51.0%) were educated till their tenth grade only. There were patients (8.6%) who had mere primary school level education, double to this (15.8%) were graduates, post graduates or other professional degree holders. The percentage distribution of the patient hinted that male patients were more conscious in attaining higher educational levels than female patients. Employment level of the patients, which has been speculated as a strong determinant of socioeconomic status were also studied and it was observed that 8.1 per cent of the male patients against 70.5 per cent of the female patients remained jobless. With reference to type of family, 63.6 percent of the patients belonged to nuclear type families whereas 35.4 percent of them hailed from an extended family and 7.4 per cent of the male patients and 5.4 per cent of the female patients only belonged to rural locations. It was also observed that more than half of the patients (53%) received a total monthly income less than Rs 15000, whereas only seven per cent of the patients enjoyed the comfort of income above Rs 30000 per month.
In order to ascertain the combined action of socio economic variables, an index named Physical Quality of Life Score (PQLS) was developed having three categories such as good (scores >20), satisfactory (scores 17-20) and poor (scores <17) and the patients were distributed under each head according to the scores obtained. Close to one fifth of the patients only (19.20%) were found graded as good, almost comparable in the case of both the genders.
BMI of the patients
The mean body weight and BMI of the diabetes patients showed that the higher values of BMI for male patients (38.9) stood in the obesity class II category (35-39.9), whereas that of female patients (44.7) came under the obesity class III category (>40). The observation was statistically significant too.
The mean weight of the male patients (70.54 Kg) exceeded by more or less 6 kg than the mean body weight of the female patients (64.58 Kg). The observation was statistically significant (Welch Robust tests of equality of means).
Biochemical profile of the patients
The mean biochemical parameters namely FBG, PPBG and HbA1C values of the patients when compared with the American Diabetes Association (ADA) (2014) recommendations ie, 80-130 mg/dl, <180 mg/dl and <7.0 per cent for FBG, PPBG and HbA1C respectively, found that the mean values of all the three parameters were extremely above the normal range for both males and females. FBG and PPBG values were found to be still higher in male patients, even though it was not statistically significant.
The lipid profile values of the patients were compared according to National Cholesterol Education Program (NCEP) (2001) ATP III classification and it was found that except serum LDL and HDL, the other two fractions were within the normal cut-off values. The serum LDL values showed statistically significant differences between male and female patients, higher in former when compared to latter. LDL is considered as an independent risk factor for the development of CVD. But serum HDL values were very much below the recommendations in both the genders.
The lipid profile was not drastically deranged in the patients. The lipid fraction most affected was HDL, i.e., for the male patients it was only 39.82 mg/dl and for the female patients, still lesser, i.e. 38.35mg/dl. The TG fraction of the female patients showed a slightly higher value to normal range (154.22 mg/dl). Lipid profile parameters (except HDL) were increased significantly in uncontrolled diabetics and moderately controlled diabetics when compared to controlled diabetics (Singh et al, 2013).
In this study, the hypothesized model of the study is a structural regression model that consists of both a measurement and a structural portion, which represents links among the Observed variables. The model examined the complex relationships between BMI and lipid profile values of the selected diabetes patients. The relationships proposed in the hypothesized “Structural Equation Model” are presented in Figure 1.
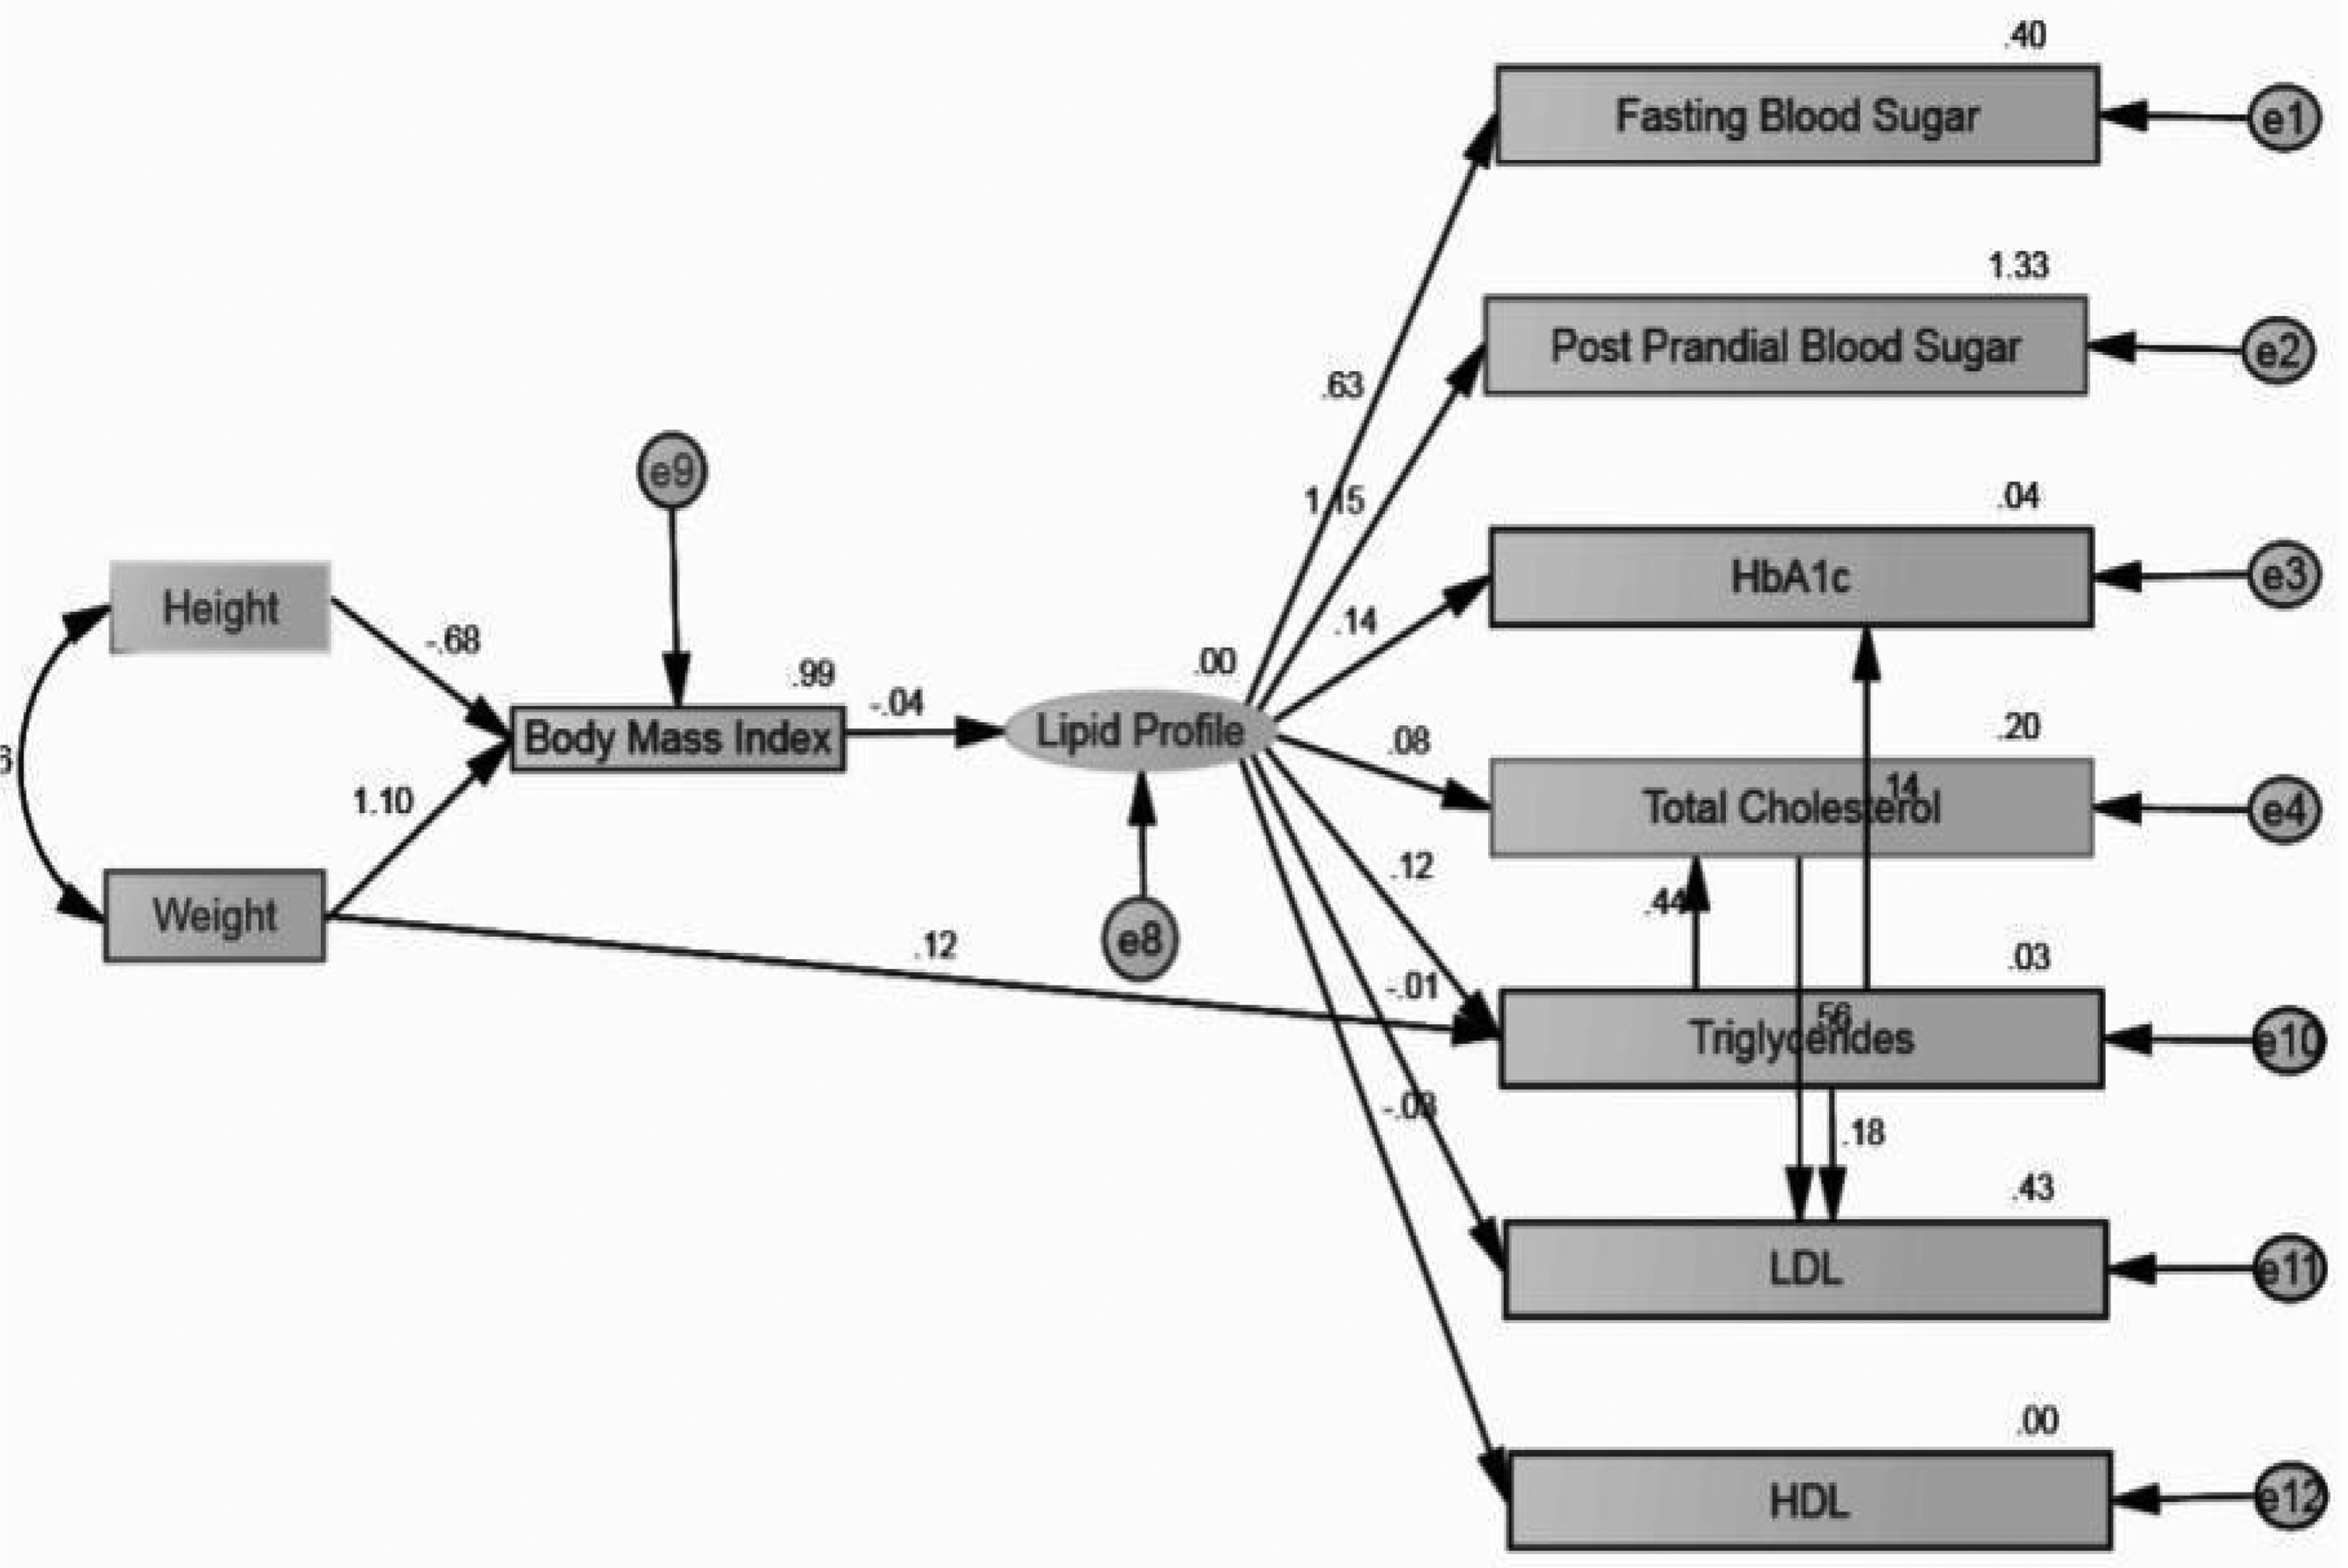
Structural Equation Model showing the influence of BMI on Lipid Profile of Type II Diabetes Patients
The model contains the following variables
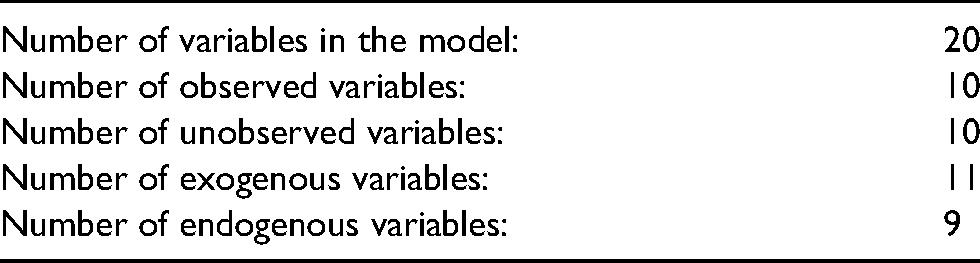
In this study, the observed, exogenous variables are Height and Weight and the observed, endogenous variables are Fasting Blood Sugar, Postprandial Blood Sugar, HbA1C, Total Cholesterol, BMI, Triglycerides, LDL, and HDL. Also the unobserved, endogenous variables are the lipid profile and the unobserved, exogenous variables (e) are e1, e2, e3, e4, e8, e9, e10, e11 and e12.
Observed variables are the variables that are measured to serve as indicators of the underlying construct that they are presumed to represent. Unobserved variables are the variables that cannot be observed directly (Byrne, 2010). Exogenous Observed variables are the variables that their causes are unknown and are not represented in the model. They are synonymous with independent variables; they cause fluctuations in the values of other latent variables in the model. Endogenous Observed variables are the variables that their presumed causes are explicitly represented in the model (Kline, 2012).
Thus, the Variable counts
Model Testing
In order to test the hypothesized structural regression model, the two-step rule was applied. The two-step rule suggests that in order to test a structural regression model firstly, the measurement portion of the model must be identified and, secondly, the structural portion of the model must be identified.
Estimates (Group number 1 - Default model)
Scalar Estimates (Group number 1 - Default model)
Maximum Likelihood Estimates
Table 1 expresses the relationship between BMI, weight, height and lipid profile. It suggests that when there is one degree of Standard Deviation change in weight, the chances of increasing BMI will be 1.102 times. That is, weight highly influences BMI.
Standardized Regression Weights: (Group number 1 - Default model).
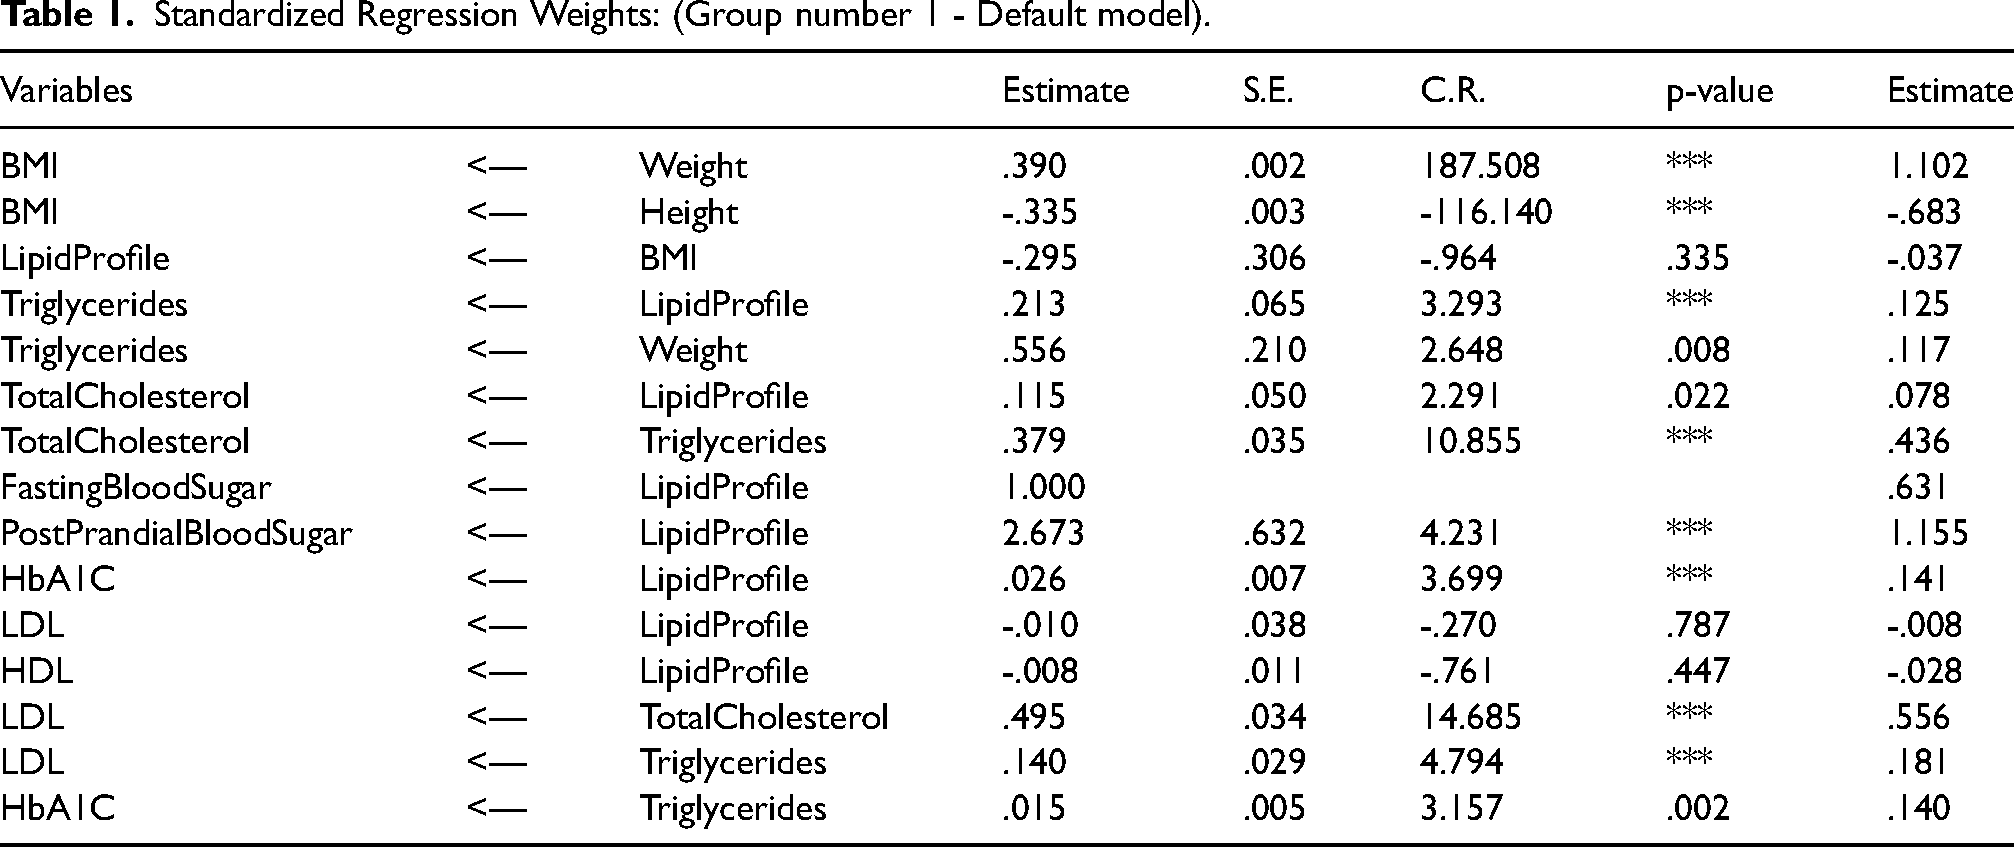
Also, when there is one degree of Standard Deviation change in height, the BMI will be reduced to a Standard Deviation change of 68.3 per cent. BMI is not related to lipid profile as shown by the p value greater than 0.05, which is not significant.
Table 2 states that all variances, that is the square of Standard Deviation are statistically significant except the error variable e2 in this study
Variances: (Group number 1 - Default model).
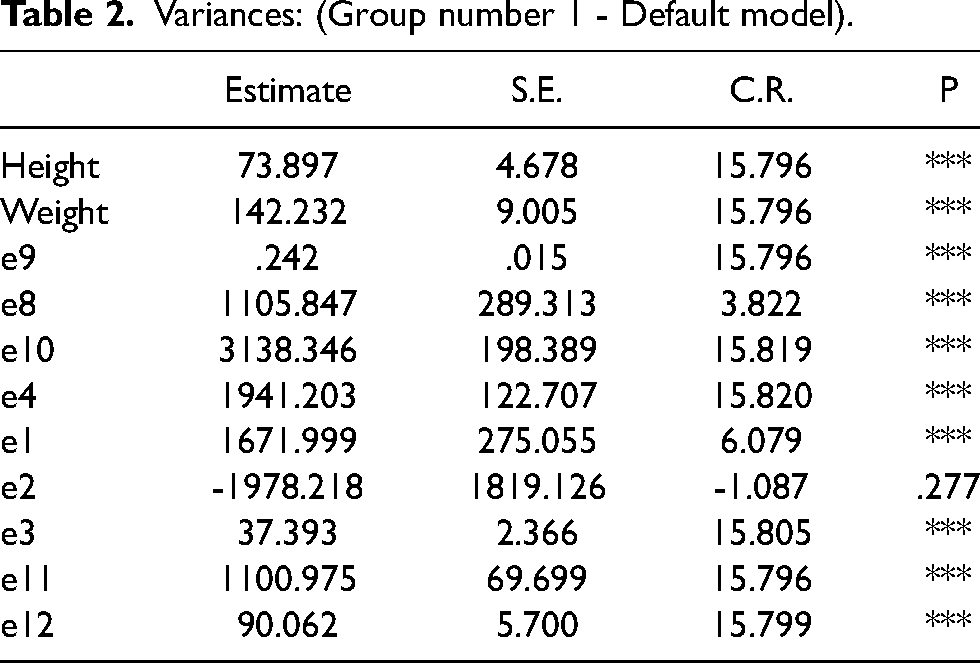
The covariance between height and weight was also statistically significant, that is they are interrelated and the relationship is to the extent of 46.1 per cent.
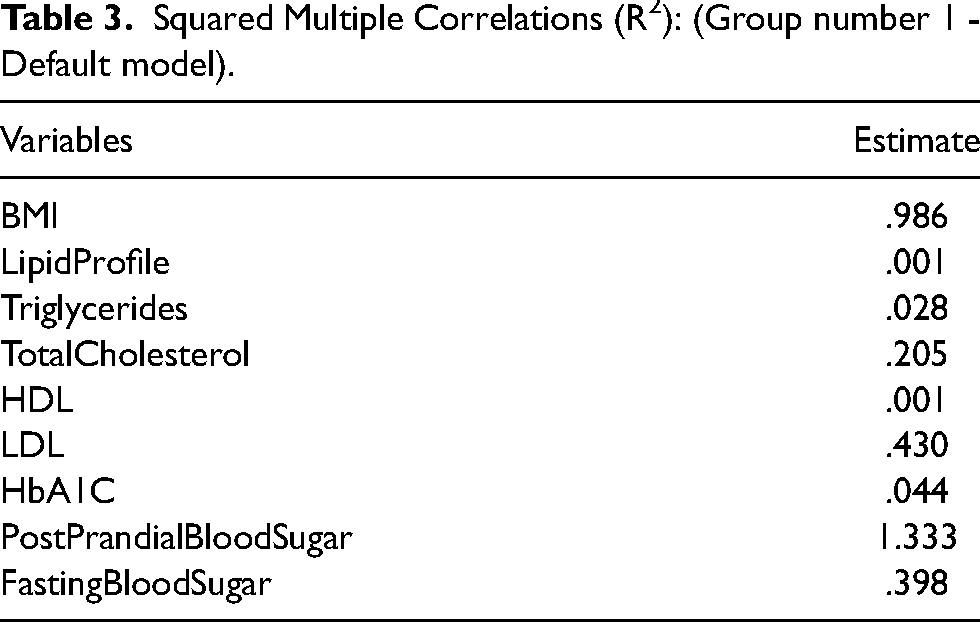
All the variables given in Table 3 are dependent variables and the R2 values show the model fit. The above table suggests that the model fit for BMI is 98.6 percent true, that is all relation models expressed in this study in case of BMI is 98.6 percent fit. Similarly the postprandial blood sugar prediction accuracy is 133.3 percent true that is the factors influencing PPBS in this study are 1.33 times accurate.
Squared Multiple Correlations (R2): (Group number 1 - Default model).
Model Fit Summary
Model fit determines the degree to which the sample variance–covariance data fit the structural equation model. Model-fit criteria commonly used are chi-square value (CMIN), the Goodness-of-Fit Index (GFI), the Adjusted Goodness-of-Fit Index (AGFI), the Normed Fit Index (NFI), the Comparative Fit Index (CFI), and and the Root Mean Square Error of Estimation (RMSEA). These criteria are based on differences between the observed (original) and model-implied (reproduced) variance– covariance matrices.
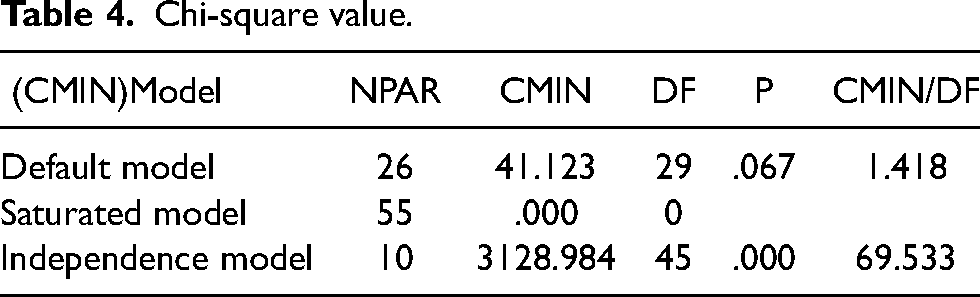
Here in Table 4, the p-value is 0.067, which is greater than 5 per cent; therefore there is goodness of fit of the model that is we are accepting the null hypothesis. Also CMIN/DF coefficient is less than 5, suggesting that the model is good for making relationships between independent and dependent variables.
Chi-square value.
Goodness of Fit Index (GFI) and Adjusted Goodness-of-Fit Index (AGFI) measure the comparative amount of variances and covariances accounted for by the model. Values equal to or greater than 0.90 indicate good model fit and here it is good fit as shown in Table 5.
RMR, GFI and Other Baseline Comparisons.
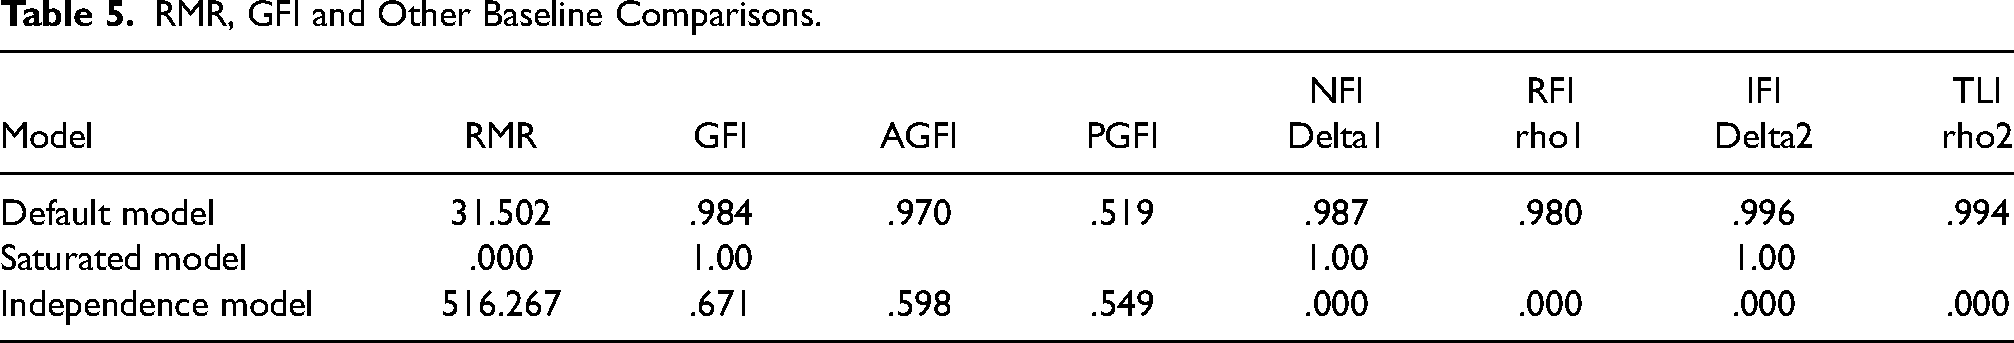
The NFI analyzes the difference between the chi-square values of the hypothesized and null models. The target value for the NFI is 0.95. Here it is greater than 0.95 and hence good fit. Also the Relative Fit Index (RFI), Incremental Index (IFI), Tucker-Lewis Index (TLI) values are also higher and greater than the threshold limit of 0.90 (above 90%), hence it is also perfect. CFI (Comparative Fit Index), compares the existing model with a null model. A value of 0.95 indicates a good fit. Here the values are greater than 0.95 and hence good fit.
The RMSEA is the square root of mean differences between the estimate and the true value, measures approximation error between the observed covariance and the covariance of the hypothesized model and it should be below 0.05. Here, in this SEM, the value is 0.029 which shows the goodness of fit of the model in this case.
Discussions
The PQLS computed based on the selected socio economic variables revealed that close to one fifth of the patients only were found to have good socio economic status, whereas 40 per cent each of the patients belonged to moderate and poor socio economic background.
The mean BMI values of both male and female patients depicted that they were in the overweight category according to WHO (2004) classification. Also the glucose and lipid profile of the patients were found to be deranged, which when coupled with the increased BMI may worsen the morbidity status.
Thus, the SEM hypothesis-testing procedures using IBM SPSS AMOS 22 has clearly indicated that among the selected patients body weight of the patients were found to have high influence on BMI at the same time the BMI is not found to be influencing lipid profile of these patients (an acceptable fit between the theoretical covariance matrix and the observed covariance matrix). The null hypothesis was therefore retained, that is there is no significant influence of BMI on lipid profile of type II diabetes patients, indicating empirical support for the theoretical model. To the knowledge of the researcher, this is the first study of this type from Southern India, Kerala that examined the influence of BMI on lipid profile of type II diabetes patients. Future research may be conducted and examine this relationship in detail for extrapolating this finding among the general population.
Conclusion
The salient findings of the study are height and weight highly influenced the BMI, among which weight influenced more than height, weight had a positive influence, whereas height had a negative influence. The model could not establish any relationship between BMI and Lipid profile. Thus it could be concluded that in diabetes patients increase in BMI alone does not lead to any alterations in their lipid profile.
The limitations of the study
The researcher used cross sectional data for this examination.
The sample size was also limited, for more reliable models a considerably large sample size would be more appreciated.
A longitudinal data set could allow much deeper analysis of the change in BMI over time and its effect on lipid profile.
This research was conducted in the research centre of local state hospitals and hence the findings from these studies cannot be generalised for the Indian population due to regional differences in their physiological body types and body fat distribution.
Footnotes
Funding
No funds were issued for the conduct of this study.
Availability of data and materials
The datasets generated and analysed during study are available from the Author on reasonable request.
Ethical approval
The approval was obtained from the Institutional Ethics Committee on 28/06/2014 and the Approval Number is 13/IEC/GTKA.
Authors’ contributions
Conceived the idea and designed the experiment, collected required data, analysed and interpreted data and drafted the paper.
Declaration of conflicting interests
The authors declared no potential conflicts of interest with respect to the research, authorship, and/or publication of this article.
Consent for publication
Not applicable as identifiable details of the samples such as name, address or photographs are not included in this article.