
Abstract
Among the plethora of literature on interlinkages in markets, more focus has been on peripheral factors. This study attempts to fill this gap by exploring volatility as driver for interlinkages between Bitcoin, Ethereum, Tether, USD-Coin, Binance Coin (BNB), and the crypto-volatility-index (CVI) from April 2019 to August 2022. Using various wavelet techniques, the study depicts significant interlinkages across short-term, medium-term, and long-term horizons, with relatively stronger interlinkages in the long term. The findings confirm that while CVI does not drive these interlinkages, Ethereum, Bitcoin, and CVI play dominant roles in the short, interim, and medium-term periods, respectively, offering new insights into the dynamism of cryptocurrency markets.
Executive Summary
The interlinkages in terms of timing and pace of information transmissions play a pivotal role in investment decisions. Despite the plethora of literature on market interlinkages, much of the focus has been on peripheral factors. This study aims to fill this lacuna by exploring implied volatility as a driver for interlinkages among high-market-cap cryptocurrencies (Bitcoin, Ethereum, Tether, USD-Coin, Binance Coin [BNB]) and investigating the magnitude of these interlinkages with the crypto volatility index (CVI) across various investment horizons from April 2019 to August 2022 using wavelet analysis. The estimates of biwavelet coherence confirm significant short-term, medium-term and long-term interlinkages between cryptocurrencies and the CVI. However, the partial wavelet coherence estimates show no significant change in the degree of interlinkages among cryptocurrencies when CVI is included as a covariate. This implies that the CVI does not significantly drive the interlinkages among cryptocurrencies, making it inept to serve as a hedging proxy for these cryptocurrencies when included in the same portfolio. The wavelet multiple correlation estimates confirm a relatively higher degree of interlinkages in the long term. Additionally, the wavelet-multiple-cross-correlation estimates identify Ethereum as the dominant variable with the potential to lead or lag other variables in the short term, Bitcoin to lead in the short to medium term and CVI to lag in the medium term. These findings will help investors, portfolio managers and regulators to comprehend the behaviour of the cryptocurrency market for effective asset allocation, portfolio rebalancing and price-gauging mitigation, respectively. In a nutshell, the study highlights the practicality of high-market-cap cryptocurrencies and CVI in diversification, hedging and asset allocation within portfolios, both under normal and extreme market conditions. These insights can enhance the understanding of attributed market dynamisms, improving diversification benefits and helping to avoid losses from speculative bubbles. They also provide a comprehensive view of market sentiment and volatility levels, enabling better risk anticipation and management in the dynamic cryptocurrency landscape.
The interlinkages of assets, markets and economies in terms of timing and pace of information transmissions regarding dynamics of returns and volatilities play a pivotal role in investment decisions (Assaf et al., 2022; Behera & Rath, 2021; Booth et al., 1997; Bose, 2007; Eun & Shim, 1989; Hung, 2020; Johnson & Soenen, 2002; Kawaller et al., 1987; Malladi & Dheeriya 2021; Natarajan et al., 2014; Wahab & Lashgari, 1993; Yin et al., 2017). This pivotality has drawn the attention of investors, portfolio managers and regulators to reconnoitre the direction and magnitude of interlinkages among assets, markets and economies, along with their underlying dynamisms. Notably, the dynamical analysis of interlinkages encompasses the comprehension of the spectrum pertaining to relationships and interactions among financial market participants (Kara et al., 2015) using co-movements, cointegration, causality and coherence. So, the estimation of these facets is crucial for comprehending the exact nature of interlinkages among cryptocurrencies and their market participants amidst the dicey environment of the cryptocurrency market. The virtuous inclination of prudent investors and portfolio managers in comprehending these facets of interlinkages helps them to enhance their returns through diversification and arbitrage dealings. Additionally, the comprehension of these facets also safeguards them from the adverse effects of temporal price volatility using hedge dealings. The exploration of volatility as a driver for interlinkages is also an important dynamical dimension that benefits these market players in analysing market dealings for exploring safe havens, arbitrage and hedging opportunities. It not only aids investors and portfolio managers in optimal portfolio allocation, but it also aids financial regulators in discerning financial contagions. That is why this knowledge of volatility as a driver for interlinkages is vital to enrich the holistic vision of investors, portfolio managers, as well as financial regulators.
Although recent studies by Yi et al. (2018), Bação et al. (2018), Liu and Serletis (2019), Zięba et al. (2019), Dahir et al. (2020), Qureshi et al. (2020), Hung (2020), Shahzad et al. (2021), Bouri et al. (2021), Malladi and Dheeriya (2021), Assaf et al. (2022), Agyei et al. (2022), Gupta and Chaudhary (2022), Shahzad et al. (2022), Bouri and Jalkh (2023), Zhang et al. (2023) and Dangi (2023) have extensively explored the interlinkages among cryptocurrencies, none have delved into the role of volatility as a driver for these interlinkages except Agyei et al. (2022). So, the present treatise is an attempt to contribute to investigating real-time market implied volatility as the driver for interlinkages between high-market-cap cryptocurrencies and investigating the magnitude of interlinkages among cryptocurrencies and the CVI across different investment horizons. This exploration of volatility as a driver for interlinkage in the present treatise highlights the practicality of cryptocurrencies and CVI in diversification, hedging proxy and asset allocation in portfolios during normal as well as extreme market conditions. The findings can help investors, portfolio managers and regulators comprehend the behaviour of cryptocurrency markets for effective asset allocation, portfolio rebalancing and the mitigation of price gauging, respectively.
The next part of this article presents the review of related literature, divided into two sections: first, a review of studies on interlinkages among cryptocurrencies, followed by a review of studies on subtleties of interlinkages between assets, markets and economies. After the literature review, the article presents the research gap, objectives, data description and methodology, followed by the results and discussion, implications, limitations, suggestions for further research and conclusion.
LITERATURE REVIEW
Interlinkages Among Cryptocurrencies
The pivotality of timing and pace of interlinkages regarding dynamics of returns and volatilities has drawn the attention of investors, portfolio managers and regulators to comprehend the direction and magnitude of causal relationships along with their attributed dynamisms for cryptocurrencies. Recently, several researchers have addressed these apprehensions by studying interlinkages among cryptocurrencies using advanced methodologies. For instance, Yi et al. (2018) examined the interconnectedness among cryptocurrencies with a spillover index approach by constructing a connectedness network linking 52 cryptocurrencies and found a tight interconnect with cyclical oscillation. Similarly, Bação et al. (2018) investigated the interlinkages between Bitcoin, Ripple, Litecoin, BitcoinCash and Ethereum by computing Geweke’s feedback estimates and generalized impulse response functions. Their estimates highlighted a strong contemporaneous correlation, with minimal lagged effects observed among these cryptocurrencies, except for Bitcoin. Liu and Serletis (2019) examined the interlinkage dynamics among leading cryptocurrencies using generalized autoregressive conditional heteroskedasticity (GARCH)-in-mean and found a statistically significant spillover effect. Additionally, they identified statistically significant spillover effects from the cryptocurrency market to other financial markets in the United States, Germany, the United Kingdom and Japan. Zięba et al. (2019) examined the interdependencies between log-returns of cryptocurrencies converging on Bitcoin using vector autoregression (VAR) and spanning tree methods and found no evidence of volatility interdependencies. Dahir et al. (2020) examined the dynamic interlinkages between Bitcoin and equity markets in BRICS economies with the time-varying parameter vector autoregression (TVP-VAR) model of Antonakakis and Gabauer (2017) and found weak interlinkages of Bitcoin returns to market returns. Qureshi et al. (2020) investigated the interdependencies among Bitcoin, Ripple, Ethereum, BitcoinCash and Litecoin, applying wavelet analysis and found evidence of short-term and long-term interlinkages among these cryptocurrencies. Hung (2020) examined the interlinkages between Bitcoin and conventional asset clutter using wavelet transformations and found significant unidirectional interlinkages at low, medium and high frequencies. Yousaf and Ali (2020) examined the interlinkages between pairs of Bitcoin, Litecoin and Ethereum with the VAR-AGARCH model during the pre-Covid and Covid period. They found higher interlinkages during the Covid period as compared to pre-Covid period in case of Bitcoin–Litecoin pair, Bitcoin–Ethereum pair and Ethereum–Litecoin pair. Shahzad et al. (2021) studied the interlinkages among 18 cryptocurrencies with Markov’s regime-switching VAR model and found higher transmissions during Covid period. Bouri et al. (2021) applied the variance-decomposition-quantile-VAR model to estimate the interlinkages among seven cryptocurrencies and found strong interlinkages among cryptocurrencies during extreme events. Malladi and Dheeriya (2021) investigated the linkages between the returns and volatilities of Bitcoin and Ripple using autoregressive moving average with exogenous variables (ARMAX), GARCH and VAR models. They found no causal effect of returns of global stock markets and gold on Bitcoin returns; however, Ripple returns were found to have a causal effect on Bitcoin prices. Assaf et al. (2022) quantified the interlinkages between Bitcoin, Ripple and Ethereum with Rényi’s transfer entropy and found a bidirectional connection between Ripple and Bitcoin, as well as unidirectional information transmission from Ripple to Ethereum. Agyei et al. (2022) provided wavelets insights of connexion between cryptocurrencies and volatility index using wavelet techniques. They found high connexion between cryptocurrencies primarily influenced by cryptocurrency-specific events rather than volatility index. Gupta and Chaudhary (2022) investigated the interlinkage and volatility dynamics of four mostly traded cryptocurrencies (Bitcoin, Ether, Litecoin and XRP) using dynamic conditional correlation–GARCH (DCC-GARCH) and exponential GARCH (EGARCH) models. They found significant causality and a strong spillover effect among these cryptocurrencies. Additionally, they found asymmetric impact in volatility in the case of Bitcoin and Ether. Shahzad et al. (2022) applied the least absolute shrinkage and selection operator (LASSO) technique to study the interlinkages among cryptocurrencies in different market conditions and found evidence of interdependencies in normal as well as extreme market conditions. Bouri and Jalkh (2023) investigated the interlinkage dynamics in Bitcoin, Ethereum, Ripple, Litecoin and Monero using the ARCD model and found time-varying interlinkages among these cryptocurrencies on the basis of conditional skewness and excess kurtosis. Zhang et al. (2023) examined the co-jump dynamics in 30 cryptocurrencies using network modelling and found a time-varying impact of co-jumps, with Bitcoin as the strongest influence. Additionally, the empirical evidence affirms the existence of co-jump heterogeneity across pairs of cryptocurrencies with different market capitalizations.
Researchers in these recent studies have explicitly employed dynamic methodologies to estimate the interlinkages among cryptocurrencies, aiming for a better comprehension of financial interconnectivity through dynamic empirical measures. These dynamical measures stipulate an ameliorate framework for exploring long-term relationship theory in the cryptocurrency market.
Subtleties of Interlinkages Between Assets, Markets and Economies
The diverse literature on the exploration of interlinkages among economies and financial assets, encompassing studies by Kawaller et al. (1987), Eun and Shim (1989), Wahab and Lashgari (1993), Booth et al. (1997), Johnson and Soenen (2002), Bose (2007), Natarajan et al. (2014), Dangi (2016), Yin et al. (2017), Hung (2020), Behera and Rath (2021), Assaf et al. (2022), has focused on empirical measures to explore long-term relationship theory. Many researchers have also comprehensively explored the subtleties of interlinkages between assets, markets and economies to provide wholesomeness in discernment analysis of connexions. For instance, Tsai (2015) identified market conditions as the prominent factor behind the direction and magnitude of causality between US housing and stock prices, as the direction of causal relation reverses during a financial crisis in comparison to normal periods. Similarly, Shchepeleva (2017) pointed out sensitivity to internal instability as the prominent factor behind the higher magnitude of interconnectedness in stock markets in comparison to bond markets. Geraci and Gnabo (2018) highlighted the predominance of echelon dynamics, long-term capital management crisis and the 2008 financial crisis in market contagion. Walther et al. (2019) identified ‘global real economic activity’ as the most important exogenous drivers of volatility in cryptocurrency markets through the GARCH-MIDAS (mixed data sampling) framework, providing superior volatility predictions for bull and bear markets. Mansour et al. (2020) found marketplace specificities affecting volatility transmission and persistence between crude oil and Islamic stock markets. Yousuf and Zhai (2021) found the predominance of developed markets as global contributors of return and volatility shocks. Aslam et al. (2023) highlighted the exponential growth of fintech innovation as the prominent factor behind the massive increase of the interest in cryptocurrency market’s informational efficiency using the multifractal detrended fluctuation analysis approach. Their empirical findings confirmed multifractality, indicating evolving market efficiency influenced by conditions. Bouri and Jalkh (2023) found significant influence of inflation expectation, precious metal volatility, financial stress and geopolitical risk on the joint spillover dynamics of Bitcoin, Ethereum, Ripple, Litecoin and Monero using causality-in-quantile analysis. Among the plethora of literature on the interlinkages among different facets of financial and commodity markets, more focus has been on the peripheral factors, creating a lacuna to explore volatility as a driver for interlinkages, particularly in the context of cryptocurrencies.
As it is clear from the review of literature that recently many researchers, such as Yi et al. (2018), Bação et al. (2018), Liu and Serletis (2019), Zięba et al. (2019), Dahir et al. (2020), Qureshi et al. (2020), Hung (2020), Shahzad et al. (2021), Bouri et al. (2021), Malladi and Dheeriya (2021), Assaf et al. (2022), Agyei et al. (2022), Gupta and Chaudhary (2022), Shahzad et al. (2022), Bouri and Jalkh (2023) and Zhang et al. (2023), have extensively investigated the interlinkages among major cryptocurrencies in their studies, but none of these studies except Agyei et al. (2022) have explored the implied volatility as driver for interlinkages between cryptocurrencies. So, the present study aims to investigate real-time market implied volatility as a driver for interlinkages between high-market-cap cryptocurrencies. The present treatise also employs methodological progression by applying wavelet analysis to comprehensively characterize direction, persistence and intensity of interlinkages across investment horizons.
OBJECTIVES OF THE STUDY
The focal objective of this study is to explore volatility as a driver for interlinkages across cryptocurrencies’ returns, with the following peripheral objectives:
To assess time-frequency co-movements of cryptocurrencies and CVI.
To determine lead–lag or causal relationships among cryptocurrencies and CVI.
To assess the impact of CVI on the interlinkages between cryptocurrencies.
To investigate the magnitude of interlinkages among cryptocurrencies and CVI across investment horizons.
DATA AND THEIR DESCRIPTION
This article uses daily spot prices of Bitcoin, Ethereum, Tether, USD-Coin and BNB, along with CVI, spanning from April 2019 to August 2022. Data were sourced from the world’s largest financial markets platform, that is, Investing.com. Bitcoin, Ethereum, Tether, USD-Coin and BNB were chosen for inclusion in the analysis due to their high market capitalization, making them representative of broader market trends as the most prominent and widely traded assets in the crypto market. The CVI was included in the dataset as it tracks the 30-day implied volatility of the cryptocurrencies. The discernment of implied volatility is valuable for assessing overall market sentiment as it provides a comprehensive view of overall market sentiment and volatility levels that help market participants in anticipating and managing risk in the dynamic cryptocurrency landscape. As the focal objective is to investigate real-time market volatility as driver for interlinkages between cryptocurrencies, that is why the data from the inception of CVI (i.e., 31 March 2019) were taken from Investing.com to investigate the magnitude of interlinkages among cryptocurrencies and CVI across investment horizons, providing a comprehensive view of short-term as well as long-term driving market movements. Missing values of CVI were imputed using the Kalman (1960) filter. These series were transformed to return series through the following equations:


where Rcrypto is cryptocurrency’s return for day ‘t’, RCVI is CVI’s return for day ‘t’,
Basic Descriptive Statistics of Cryptocurrencies and CVI.
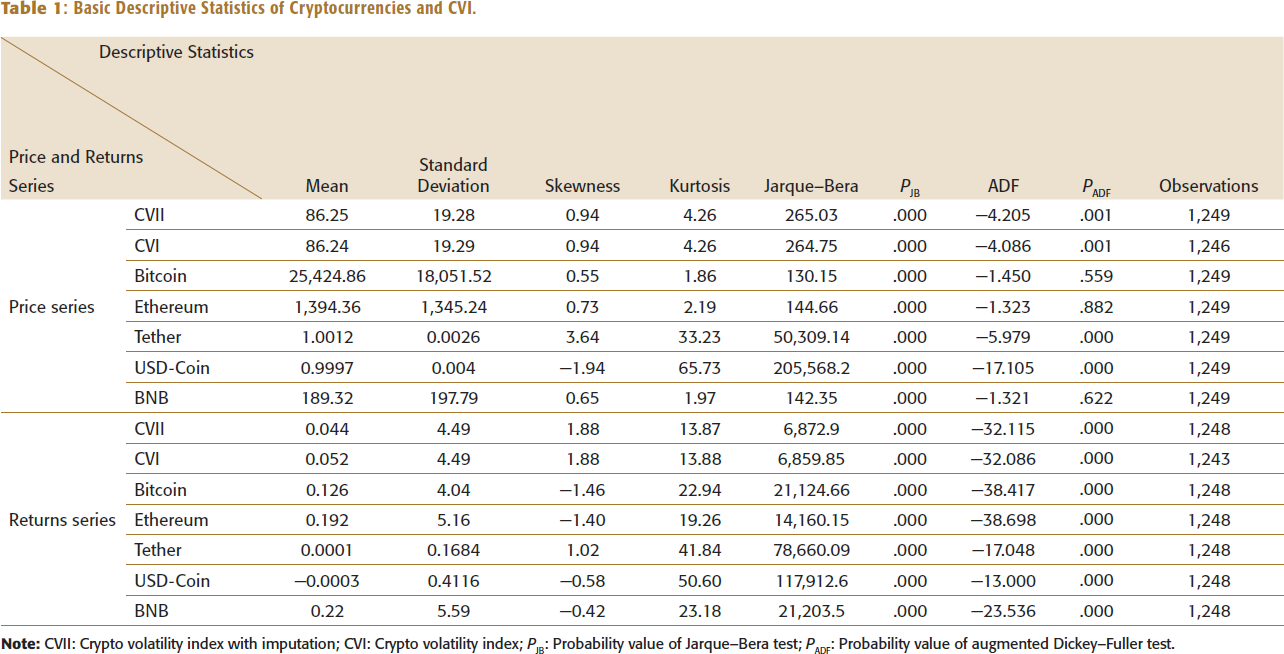
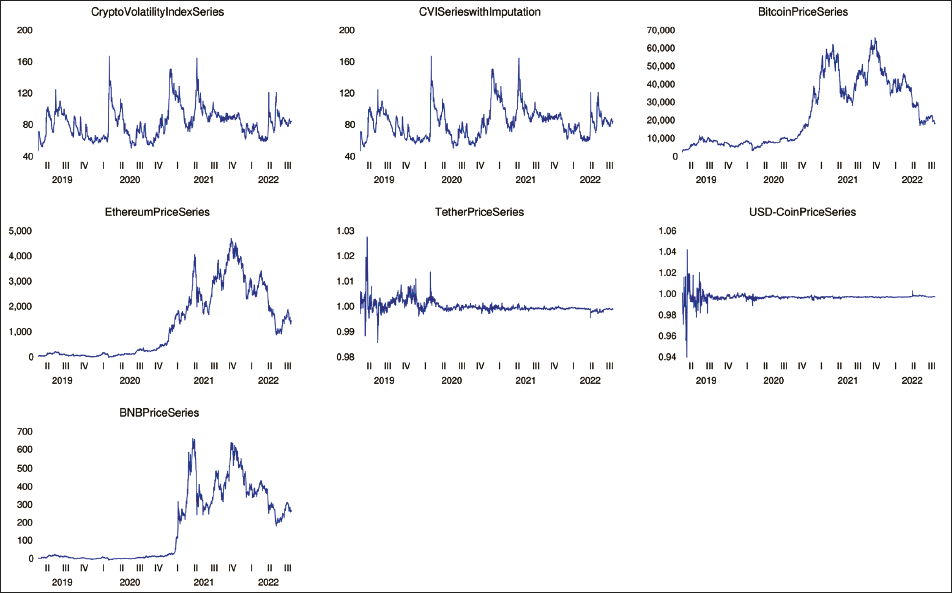
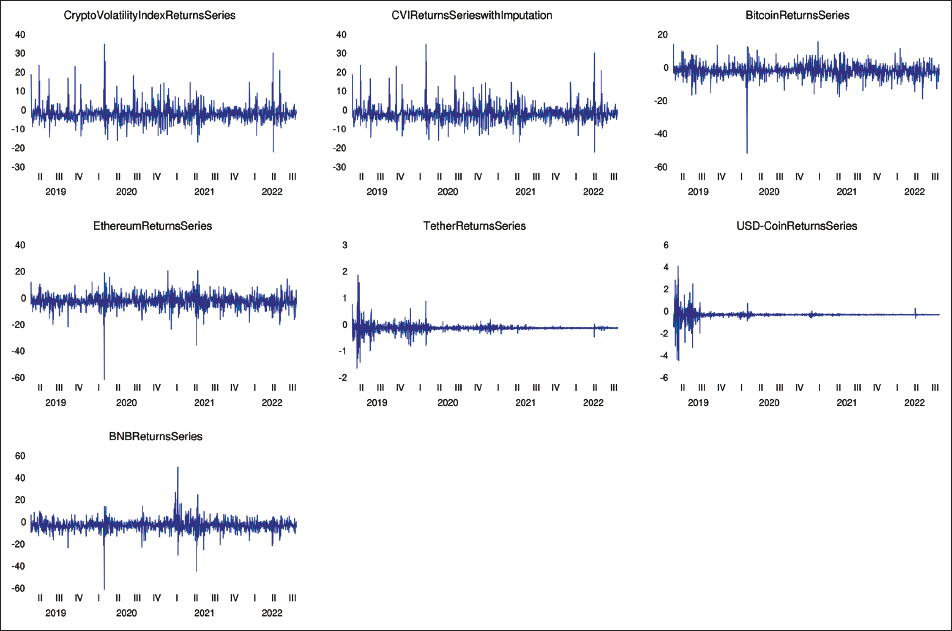
The average values of all prices and returns series are positive, except for the returns of USD-Coin, which portray a downward trend during the sample period. In contrast, the prices and returns of Bitcoin, Ethereum, Tether, BNB and CVI display an upward trend over the same period. The largest average return is 0.22 for BNB with the highest risk, whereas the smallest average return is −0.0003 for USD-Coin. The negative skewness values in the case of USD-Coin prices, USD-Coin returns, Bitcoin returns, Ethereum returns and BNB returns depict an inclination of earning negative returns during the sample period. The kurtosis values of the returns series of all cryptocurrencies and CVI indicate leptokurtic behaviour. However, the kurtosis values of prices of Bitcoin, Ethereum and BNB indicate different behaviour of peakiness. The Jarque–Bera test statistics of all series depict statistically insignificant normality as indicated by PJB (p value). It is noteworthy here that the average returns of all series are less than their standard deviation. The PADF (p value) of augmented Dickey–Fuller test for the price series of Bitcoin, Ethereum and BNB is greater than 0.05, depicting these series are non-stationary. However, all other series are stationary series with PADF of less than 0.05. The same concepts are pictorially presented in Figures 1 and 2. The plots of price series of all cryptocurrencies display a downward spike during the initial Covid period, followed by a rapid increase after 2020 in the case of Bitcoin, Ethereum and BNB. The price series of Tether and USD-Coin remain stagnant following the volatile regime during the Covid period. Meanwhile, fluctuations in the CVI series display volatility in the cryptocurrency market. The pictorial pattern of the returns series of all cryptocurrencies and CVI also exhibits volatility clustering. These descriptive properties of the return series of cryptocurrencies and CVI align with the findings of studies by Bação et al. (2018), Zięba et al. (2019), Qureshi et al. (2020), Shahzad et al. (2021) and Zhang et al. (2023) on cryptocurrencies’ return distributions.
Crypto Volatility Index and Cryptocurrencies’ Price Series.
Crypto Volatility Index and Cryptocurrencies’ Returns Series.
The descriptive discernment of the price and return series of Bitcoin, Ethereum, Tether, USD-Coin, BNB and CVI in this treatise reveals varying trends over time, indicating possibilities for these cryptocurrencies to respond differently to market conditions and resulting in varying co-movements at different time scales. Additionally, the variations in average returns and risk, as evidenced by skewness and kurtosis values, indicate differing risk–return profiles among these cryptocurrencies. These differences in risk and return characteristics may result in varying co-movements across different time scales. Furthermore, the clustering of volatility in the return series of these cryptocurrencies influences their co-movements at different time scales, with periods of high volatility potentially strengthening correlations among these cryptocurrencies. In a nutshell, the diverse trends, risk–return profiles and volatility patterns suggest that the co-movement of cryptocurrencies may vary over different time scales due to unique market dynamics, justifying the expectation of differing co-movements between cryptocurrencies across short and long terms.
Econometric Methodology
The interlinkages among Bitcoin, Ethereum, Tether, USD-Coin, BNB and CVI are studied in this treatise with unconditional correlation, covariance, the Johansen cointegration test and wavelet analysis. Initially, the interlinkages are examined using unconditional correlation and covariance analysis. However, to better understand the relative integration and causality of their relationships, cointegration in their price series is investigated using the Johansen test of cointegration. The descriptive properties of their series exhibit intricate dynamics of their markets with diverse trends causing the possibility of varying co-movement of cryptocurrencies across different time scales or frequencies. Moreover, the risk–return statistics of these cryptocurrencies exhibit heterogeneous and adaptive fluctuations over time. These variations highlight the importance of employing time-frequency analysis to capture the evolving dynamics of cryptocurrency markets and understand how co-movements may vary over different investment horizons. Therefore, analysing multi-scale and time-frequency interlinkages using wavelet analysis is well-suited to capture these varying market movements. Moreover, the wavelet analysis supports the heterogeneous market hypothesis of Müller et al. (1997) and the adaptive market hypothesis of Lo (2005). The heterogeneous market hypothesis postulates variation in market efficiency across different time scales, while the adaptive market hypothesis postulates variation in market efficiency over time. By analysing co-movements across different time scales, the present treatise validates these postulates, highlighting the vitality of considering both short-term and long-term interlinkage perspectives. The short-term interlinkages are often influenced by rapid changes in investor sentiment, market news and trading activity. In contrast, long-term interlinkages are influenced by fundamental factors, adoption rates and regulatory developments, which evolve gradually. By employing various wavelet techniques, the study captures both short-term and long-term fluctuations in co-movements, thus providing insights into the dynamic nature of cryptocurrency market interdependencies. The time-frequency analysis using wavelet coherence comprehends the time frequencies of co-movements between series. The frequency-dependent analysis is an extension to time-frequency analysis as it depicts multiple interactions, highlighting the behaviour of cryptocurrency markets ranging from heterogeneous to adaptation. The wavelet bivariate correlations display averaged calendar time correlation at various investment horizons, while the multiple wavelet correlations reveal the degree of cointegration. Additionally, the multiple wavelet cross-correlations reveal lead–lag relations across investment horizons. These statistics provide better insights by measuring overall interactions at various time scales (short-term, medium-term and long-term horizons). In summary, the Johansen cointegration test is applied to their price series to assess cointegration between these cryptocurrencies and CVI, biwavelet coherence is applied to investigate their time-frequency co-movements and causal relationships, partial wavelet coherence is applied to assess the impact of CVI on interlinkages between these cryptocurrencies, and multiple wavelet is employed to assess the magnitude of interlinkages among cryptocurrencies and CVI across investment horizons. It is noteworthy that time and scale are two fundamentals of wavelet analysis. These are defined as follows:

where 
where 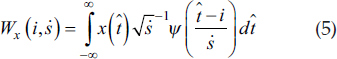
The transform coherence of a wavelet is the squared absolute value of its cross-spectrum to a single spectrum that is defined by Torrence and Gilbert (1998) as follows:
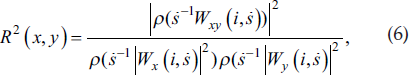
where ρ is a smoothing factor that poses significance and resolution, 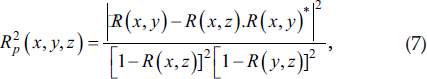
where x is a particular cryptocurrency’s returns, y is the remaining cryptocurrencies’ returns, and z is CVI. Its value also ranges from zero to one. It is noteworthy that biwavelet and partial wavelet coherence are not sufficient to detect interlinkages in the multivariate case, wherein interlinkages between these cryptocurrencies and CVI are not secluded. So, the multiple wavelet correlation is applied in the present study to determine the extent of integration among these cryptocurrencies and CVI. Agyei et al. (2022) defined it as:
where 
where τ is a lag at each scale λj.
ANALYSIS AND RESULTS
Unconditional Correlation, Covariance and Cointegration Analysis
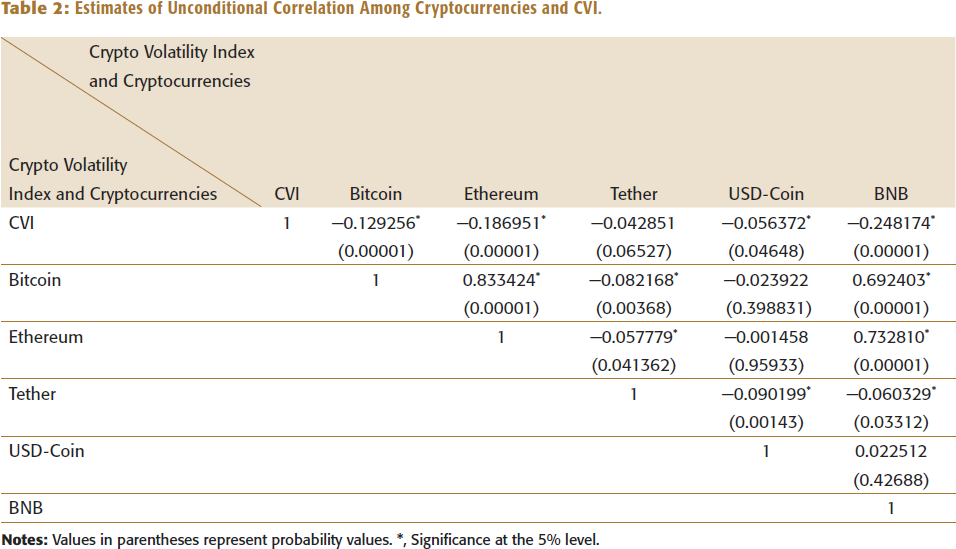
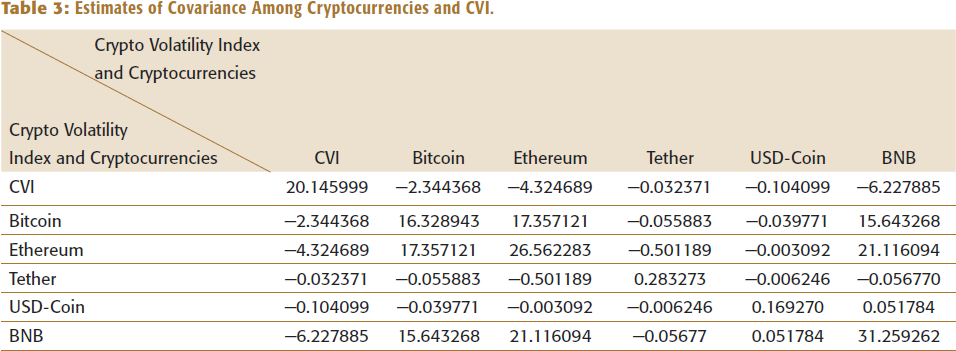
The unconditional correlation and covariance analysis presented in Tables 2 and 3 depicts a negative relation between the CVI and cryptocurrencies, with evidence of simultaneous co-movements. This negative relation is statistically significant in the case of Bitcoin, Ethereum, USD-Coin, BNB and insignificant in the case of Tether. Notably, the depiction of significant negative correlation suggests potential for portfolio diversification, indicating that they could serve as safe havens in case included in a portfolio. The positive and statistically significant relationships between Bitcoin, Ethereum and BNB make diversification practically impossible, and in the worst case, could lead to speculative bubbles. Additionally, the negative and statistically significant relation between Bitcoin and Tether, Ethereum and Tether, USD-Coin and Tether, and BNB and Tether is suggestive of portfolio diversification, that is, these cryptocurrencies could serve as a safe haven in case included in a portfolio. However, some cryptocurrencies demonstrate weak and insignificant associations. Specifically, there is a negative but statistically insignificant relation between Bitcoin and USD-Coin, as well as Ethereum and USD-Coin. And, BNB and USD-Coin show an insignificant positive relation. These weak relations make diversification practically impossible between these pairs and, in the worst case, could lead to speculative bubbles.
Estimates of Unconditional Correlation Among Cryptocurrencies and CVI.
Estimates of Covariance Among Cryptocurrencies and CVI.
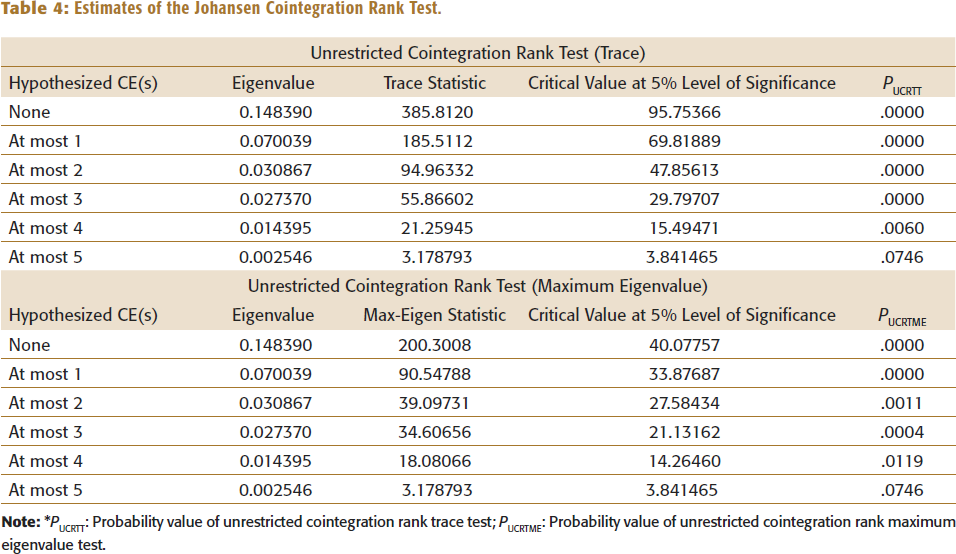
This analysis of unconditional correlation and covariance of cryptocurrencies and CVI cannot illustrate relative integration and causality of their relationships. That is why the cointegration in price series of Bitcoin, Ethereum, Tether, USD-Coin, BNB and CVI is investigated using the Johansen test of cointegration. Table 4 exhibits the estimates of the unrestricted cointegration rank test (trace and maximum eigenvalue). The results of trace statistic and maximum eigenvalue depict long-term relationship among these cryptocurrencies and CVI, as the hypothesis of at most five cointegrating equations is accepted while rejecting none, at most 1, at most 2, at most 3 and at most 4 cointegrating equations. These results of the presence of cointegration among the cryptocurrency series affirm the results of Yi et al. (2018), Bação et al. (2018), Qureshi et al. (2020), Yousaf and Ali (2020), Assaf et al. (2022) and Shahzad et al. (2022) and are contrary to the results of Zięba et al. (2019) and Dahir et al. (2020).
Estimates of the Johansen Cointegration Rank Test.
Wavelet Analysis
Following the initial depiction of the presence of cointegration between these cryptocurrencies and CVI, it is worthwhile to investigate their multi-scale and time-frequency interlinkages using wavelet analysis. The study covers various time scales, encompassing the intraweek scale, weekly scale, fortnightly scale, monthly scale, monthly to quarterly scale, quarterly to biannual scale and biannual to annual scale. Bivariate wavelet coherence, partial wavelet coherence and multiple wavelet correlations are estimated to depict co-movements, causal relationships, the impact of CVI on interlinkages and the degree of interlinkages among cryptocurrencies and CVI across different investment horizons.
Time-Frequency Analysis of Interlinkages Using Wavelet Coherence
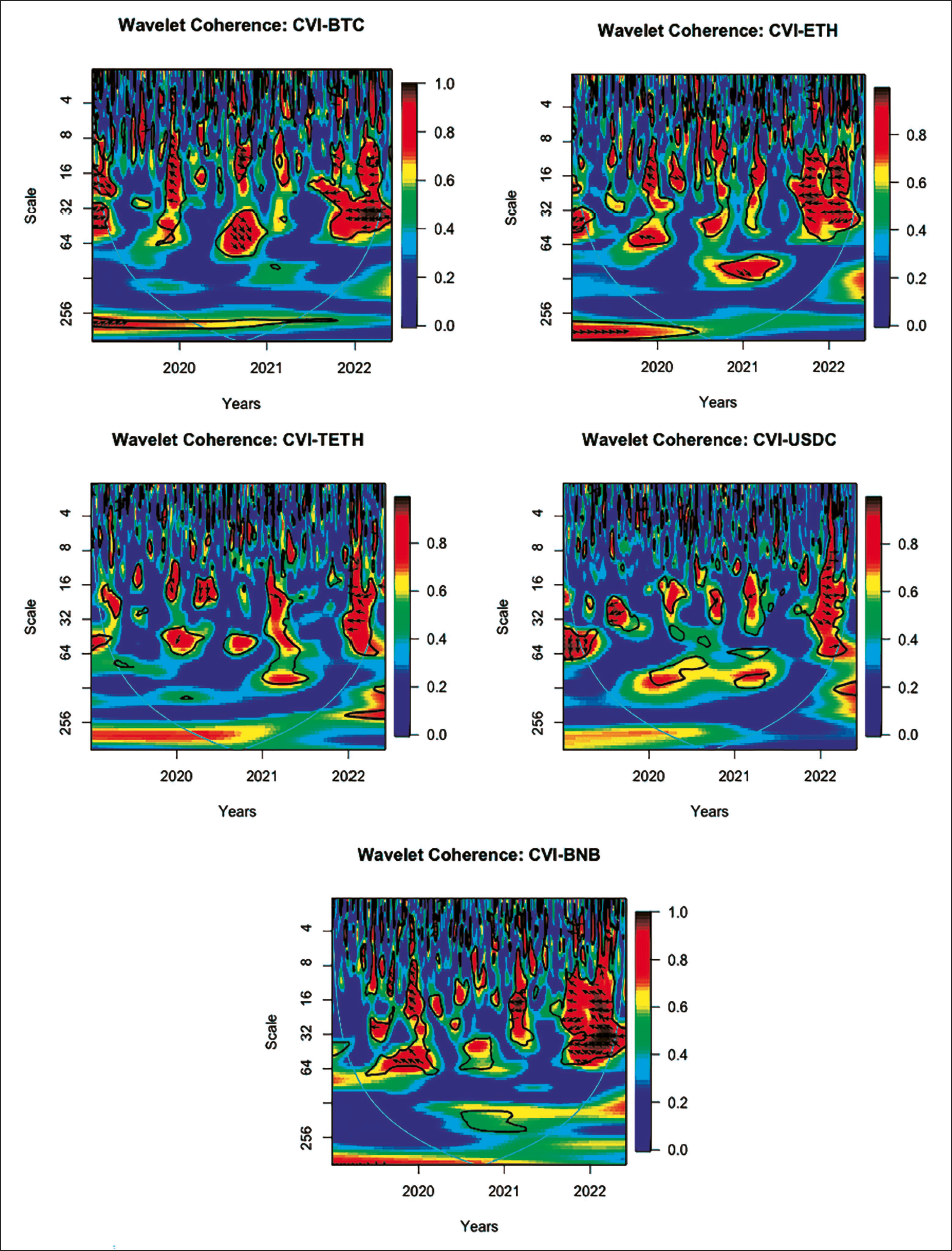
The wavelet coherence comprehends the time frequencies of co-movements between series. The time on the horizontal axis and scale on the vertical axis encompass time-frequency space in which co-movements of two series are illustrated by wavelet coherence using colours and arrows. The warm red colour represents the region of significant co-movements, while the cold blue colour represents the region of lower co-movements of the series. The cold regions beyond significant areas specify no co-movements in series. Arrows in the figures represent the direction of co-movements between the series. If the arrows are pointing to the right, they represent two series that are moving in the same direction, that is, in phase. If they are pointing to the left, they represent two series that are moving in the opposite direction, that is, anti-phase. These arrows also represent lead–lag relation in variables. Their left-down or right-up pointing depicts the leading position of the first variable, while their left-up or right-down pointing depicts the lagging position of the first variable and the leading position of the second variable.
Interlinkages Between CVI Returns and the Returns of Five Cryptocurrencies
The wavelet coherence plotted in Figure 3 displays the time frequencies of interlinkages between CVI returns and the returns of five cryptocurrencies from April 2019 to August 2022. Right-pointing arrows depict positive co-movements between CVI and cryptocurrency returns, meaning that a rise in cryptocurrency returns is associated with a rise in CVI, thereby diluting the diversification benefits between them. On the other hand, left-pointing arrows depict negative co-movements, where a rise in cryptocurrency returns is associated with a fall in CVI, thereby enhancing the diversification benefits between them. This plot reveals that the CVI exhibits interlinkages with Bitcoin, Ethereum, Tether, USD-Coin and BNB across short-term, medium-term and long-term horizons. It reveals variations in co-movements between CVI and Bitcoin, with positive co-movements in 2019, negative co-movements in 2020, positive co-movements in 2021 and negative co-movements again in 2022. Similar patterns are displayed in the co-movements between CVI and Ethereum, CVI and Tether, and CVI and USD-Coin, with the exception of continued positive co-movements throughout 2022. In contrast, there were negative co-movements between CVI and BNB during the entire sample period. The left-up and right-down pointing arrows depict the leading position of Bitcoin and Ethereum, with the CVI in a lagging position. In the medium term, the left-down and right-up pointing arrows depict the leading position of CVI and the lagging position of Tether. During 2019−2021, the left-down and right-up pointing arrows depict the leading position of CVI, which is overtaken by USD-Coin in 2022. The left-up pointing arrows throughout the sample period depict the clear leading position of BNB, with the CVI in a lagging position. In the sections where the CVI is leading, investors may lose investment values due to high fluctuations in the cryptocurrencies market, especially if they did not capitalize on the diversification benefits offered during the negative co-movements periods, as indicated by the left-pointing arrows. The positive co-movement sections, highlighted by right-pointing arrows, display the extinction of the property of cryptocurrencies as a safe haven. The empirical evidence depicting the presence of significant interlinkages among cryptocurrencies and CVI contradicts the findings of Zięba et al. (2019), who found no evidence of volatility interdependencies.
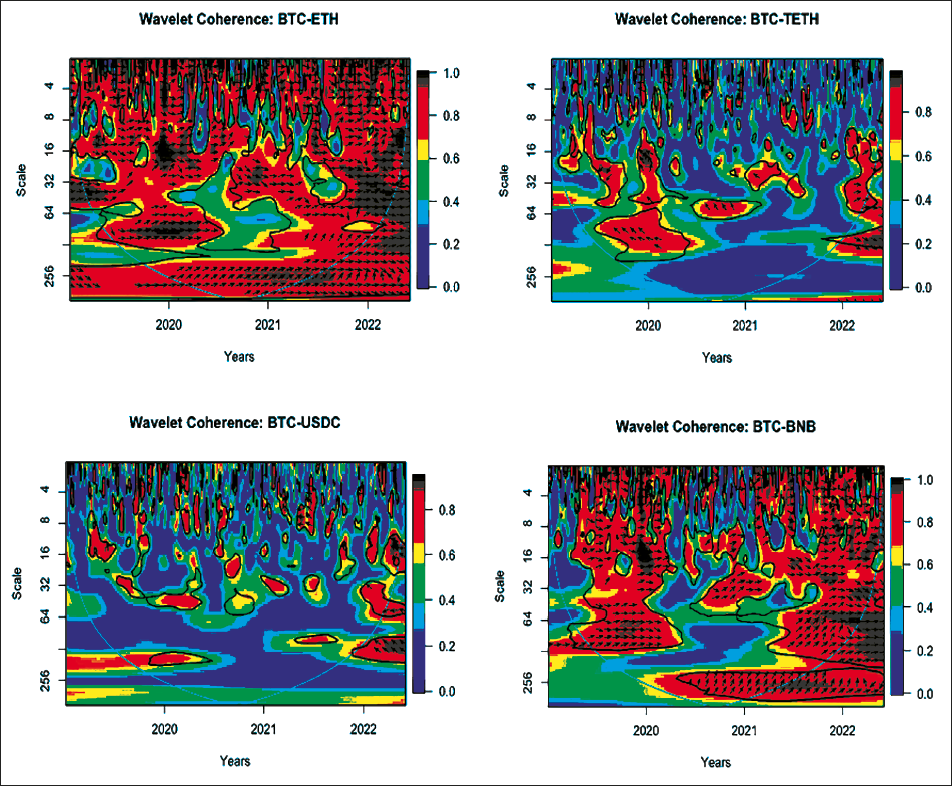
Interlinkages Between Bitcoin Returns and the Returns of Other Cryptocurrencies
Figure 4 displays the time frequencies of co-movements between Bitcoin returns and the returns of other cryptocurrencies from April 2019 to August 2022. There is dominance of warm red colour that represents regions of higher co-movements of Bitcoin with Ethereum, as well as Bitcoin with BNB, while the cold blue colour represents regions of lower co-movements of Bitcoin with Tether and USD-Coin. From this plot, it is evident that Bitcoin exhibits significant short-term, medium-term and long-term interlinkages with Ethereum and BNB, in contrast to its weaker interlinkages with Tether and USD-Coin. The right-pointing arrows depict positive co-movements between Bitcoin returns and Ethereum returns, that is, both cryptocurrencies have been in phase, diluting diversification benefits between them. Figure 4 also displays lead–lag relations between Bitcoin and the other cryptocurrencies. The right-up pointing arrows depict the leading position of Bitcoin and the lagging position of Ethereum. The left-pointing arrows during 2019–2021 depict negative co-movements between Bitcoin and Tether, enhancing diversification benefits between them. However, the pointing position of arrows reversed in 2022, indicating positive co-movements between Bitcoin and Tether, fading away diversification benefits between them. This reversal of causal relation during extreme and calm market conditions is in tune with the findings of Tsai (2015). The left-down pointing arrows in the medium term in 2019 depict the leading position of Bitcoin and the lagging position of Tether. However, the left-up pointing arrows during 2020 and 2021 depict the leading position of Tether, followed by taking over of the leading position by Bitcoin in 2022. Although there is dominance of cold blue colour representing the region of lower co-movements of Bitcoin and USD-Coin but still there were negative co-movements in the short-term after mid-2021, with the leading position of USD-Coin. The right-pointing arrows depict positive co-movements between Bitcoin returns and BNB returns, that is, both cryptocurrencies have been in phase, diluting diversification benefits between them. There have been variations in lead–lag relations between them. The right-up pointing arrows during the sample period depict the leading position of Bitcoin and the lagging position of BNB in the short, medium and long term, except their reversal in the medium term during 2022.
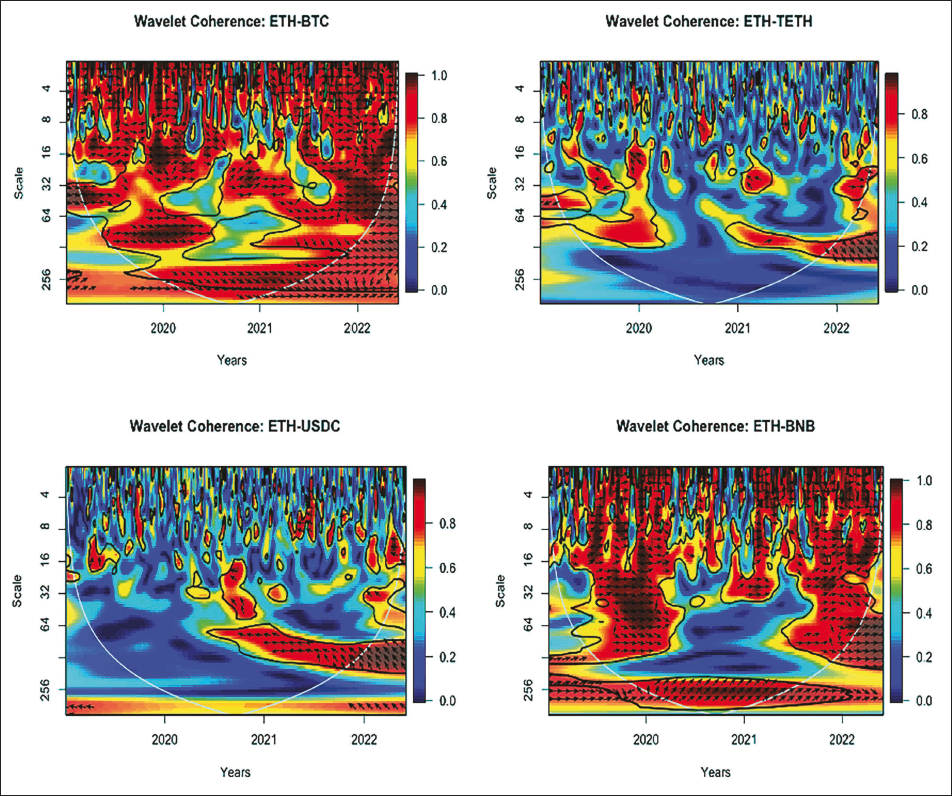
Interlinkages Between Ethereum Returns and the Returns of Other Cryptocurrencies
The wavelet coherence plotted in Figure 5 displays the time frequencies of co-movements between Ethereum returns and the returns of other cryptocurrencies from April 2019 to August 2022. This plot reveals that Ethereum exhibits significant short-term, medium-term and long-term interlinkages with Bitcoin. The right-pointing arrows depict positive co-movements between Ethereum returns and Bitcoin returns, that is, both cryptocurrencies have been in phase, diluting diversification benefits between them. Figure 5 also displays lead–lag relations between them. The right-down pointing arrows depict the lagging position of Ethereum and the leading position of Bitcoin. The left-pointing arrows during 2019–2021 depict negative co-movements between Ethereum and Tether, enhancing diversification benefits between them. However, the direction of arrows reversed in 2022, indicating positive co-movements between Ethereum and Tether, thereby fading away diversification benefits between them. The left-up pointing arrows from 2019 to 2021 and right-down pointing arrows in 2022 depict the lagging position of Ethereum. The left-pointing arrows depict negative co-movements between Ethereum and USD-Coin, enhancing diversification benefits between the two. These arrows are pointing upwards, indicating the lagging position of Ethereum and the leading position of USD-Coin. The right-pointing arrows depict positive co-movements between Ethereum returns and BNB returns, meaning both cryptocurrencies have been in phase, thus diluting diversification benefits between them. The right-up pointing arrows depict that Ethereum led BNB in the short, medium and long terms, except for a reversal in the medium term during 2022. This reversal, observed during extreme and calm market conditions, aligns with the findings of Tsai (2015).
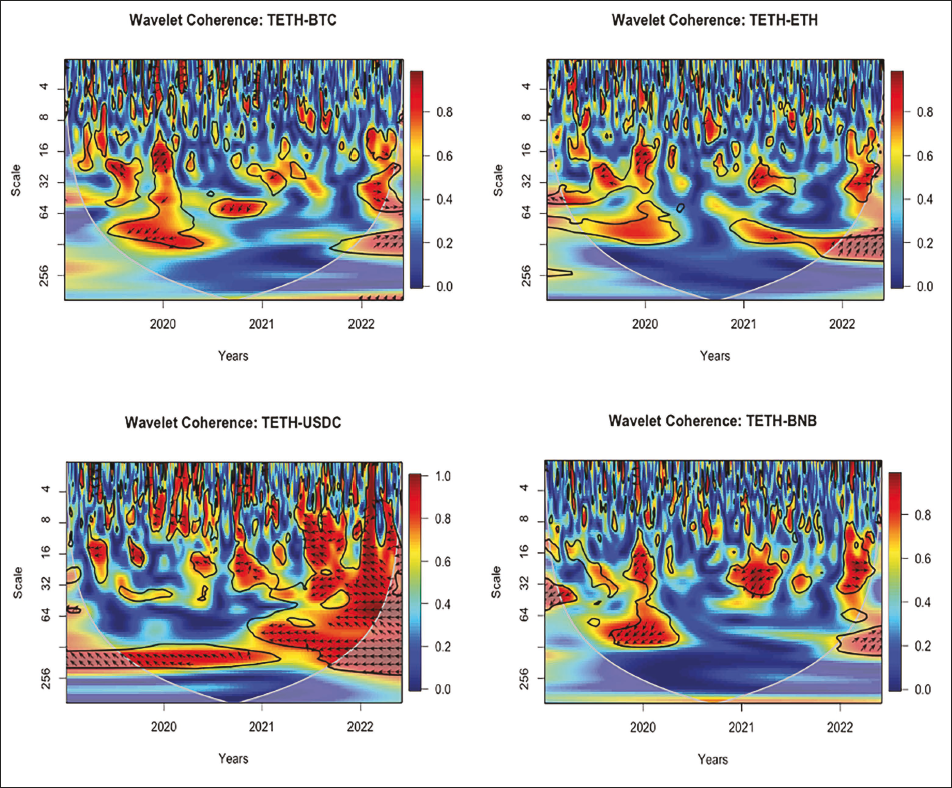
Interlinkages Between Tether Returns and the Returns of Other Cryptocurrencies
The wavelet coherence plotted in Figure 6 displays the time frequencies of co-movements between Tether returns and the returns of other cryptocurrencies from April 2019 to August 2022. This plot reveals that Tether has significant short-term, medium-term and long-term interlinkages with Bitcoin. The left-pointing arrows during 2019–2021 depict negative co-movements between Tether and Bitcoin, enhancing diversification benefits between them. However, the direction of arrows reversed in 2022, indicating positive co-movements between Tether and Bitcoin, thereby fading away diversification benefits between them. Figure 6 also displays lead–lag relations between Tether and the other cryptocurrencies. The left-up pointing arrows during 2019 depict the leading position of Bitcoin, followed by taking over of the leading position by Tether during 2020–2021, after which Bitcoin regains its leading position. The left-down and right-up pointing arrows depict the leading position of Tether and the lagging position of Ethereum. The left-pointing arrows throughout the sample period depict negative co-movements between Tether and USD-Coin. The upward arrows depict that USD-Coin leads, while Tether lags. The left-pointing arrows during 2019–2021 depict negative co-movements between Tether and BNB, enhancing diversification benefits between them. However, the direction of arrows reversed in 2022, indicating positive co-movements between Tether and BNB, thereby fading away diversification benefits between them. Figure 6 also displays lead–lag relations between Tether and BNB. The left-down pointing arrows during 2019–2021 depict the leading position of Tether, followed by BNB taking over the leading position in 2022.
Interlinkages Between USD-Coin Returns and the Returns of Other Cryptocurrencies
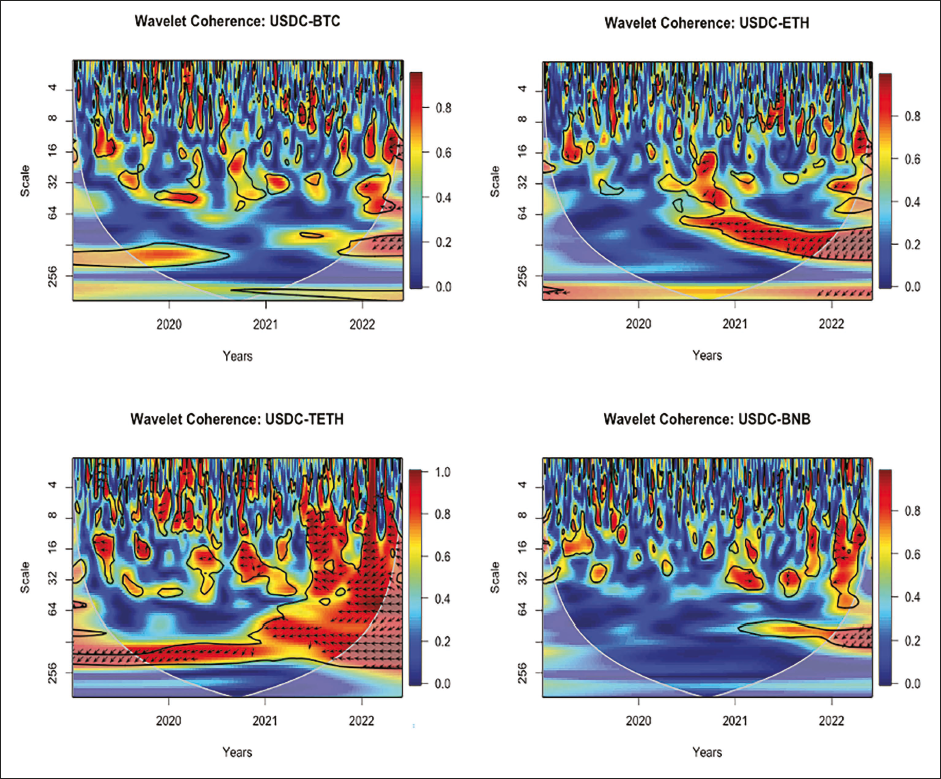
Figure 7 highlights the dominance of cold blue colour representing regions of lower co-movements of USD-Coin and Bitcoin. Although there were negative co-movements in the short term after mid-2021, with USD-Coin holding the leading position, the left-pointing arrows depict significant negative co-movements between USD-Coin and Ethereum, enhancing diversification benefits between them. These arrows are pointing downwards, indicating the leading position of USD-Coin. Additionally, the left-pointing arrows throughout the entire sample period depict significant negative co-movements between USD-Coin and Tether. The downward arrows depict the leading position of USD-Coin and the lagging position of Tether. Although the dominance of cold blue colour represents regions of lower co-movements between USD-Coin and BNB, there were still positive co-movements in 2021. However, these co-movements were reversed in 2022, with USD-Coin assuming the leading position.
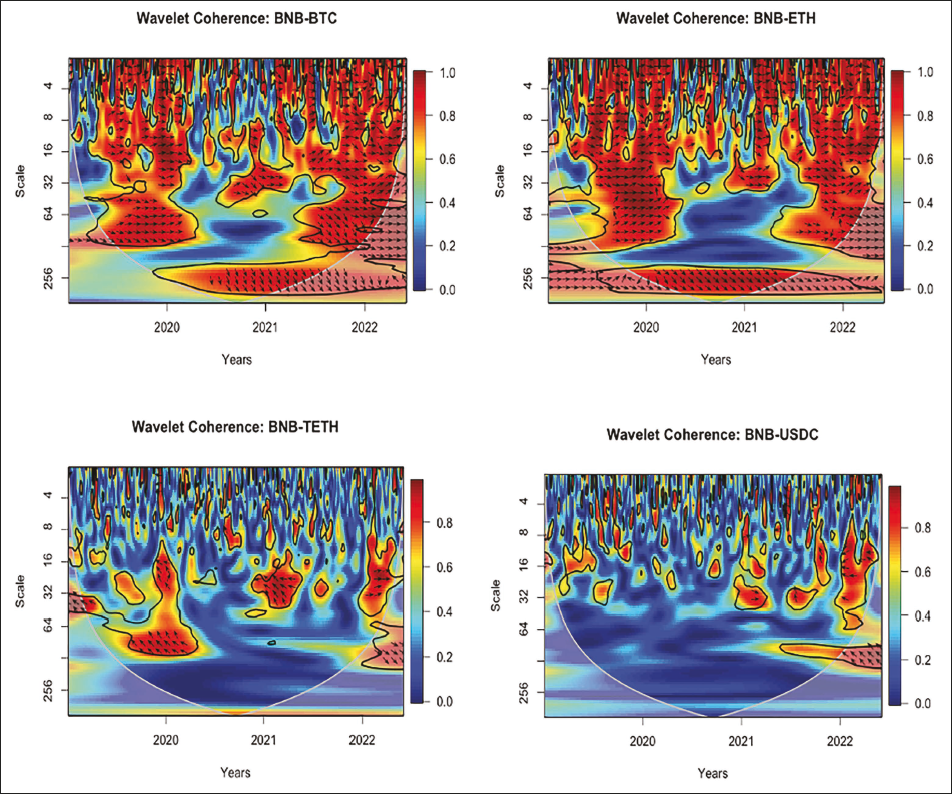
Interlinkages Between BNB Returns and the Returns of Other Cryptocurrencies
The wavelet coherence plotted in Figure 8 displays the time frequencies of co-movements between BNB returns and the returns of other cryptocurrencies from April 2019 to August 2022. This plot reveals BNB has significant short-term, medium-term and long-term interlinkages with Bitcoin and Ethereum, as represented by the dominance of warm red colours. The right-pointing arrows depict positive co-movements between BNB returns and Bitcoin returns, as well as between BNB returns and Ethereum returns. The left-pointing arrows during 2019–2021 depict negative co-movements between BNB and Tether, enhancing diversification benefits between them. However, the direction of arrows reversed in 2022, indicating positive co-movements between BNB and Tether, thereby fading away diversification benefits between them. The right-pointing arrows during 2021 depict positive co-movements between BNB and USD-Coin, while left-pointing arrows during 2022 depict negative co-movements between BNB and USD-Coin, enhancing diversification benefits between them. The right-down pointing arrows in the medium term in 2021 and the left-up pointing arrows after 2021 depict the lagging position of BNB and the leading position of USD-Coin.
The presence of significant interlinkages among cryptocurrencies during normal as well as extreme market conditions affirms the findings of Qureshi et al. (2020), Yousaf and Ali (2020) and Shahzad et al. (2022), while contradicting the findings of Geraci and Gnabo (2018) and Bouri et al. (2021), who advocated significant interlinkages during extreme market conditions only.
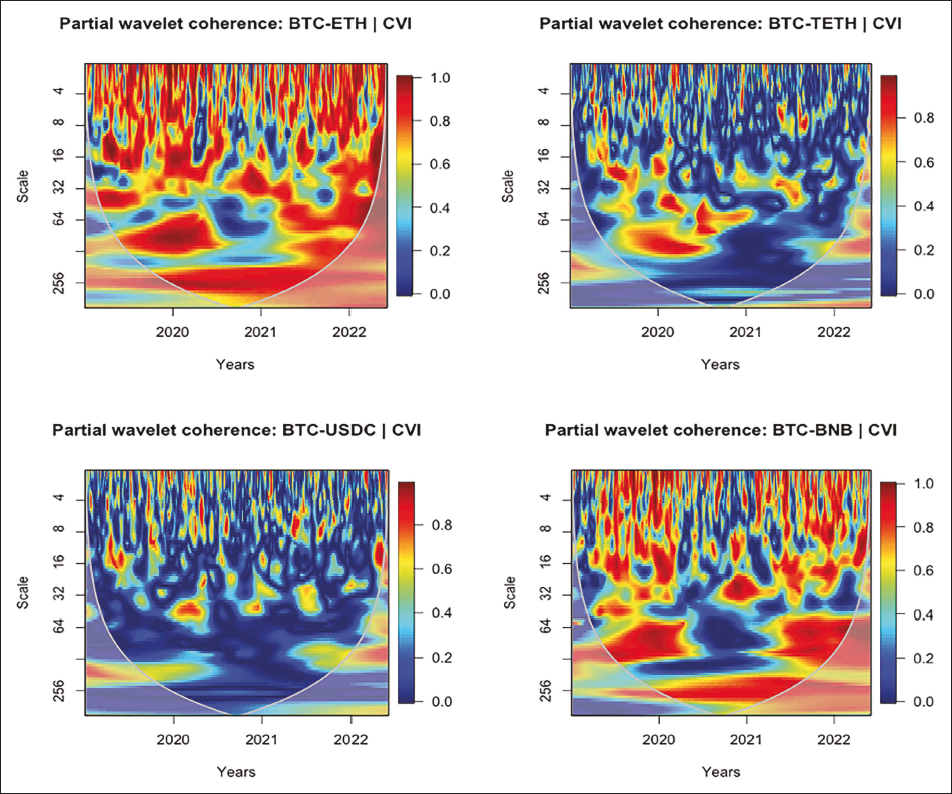
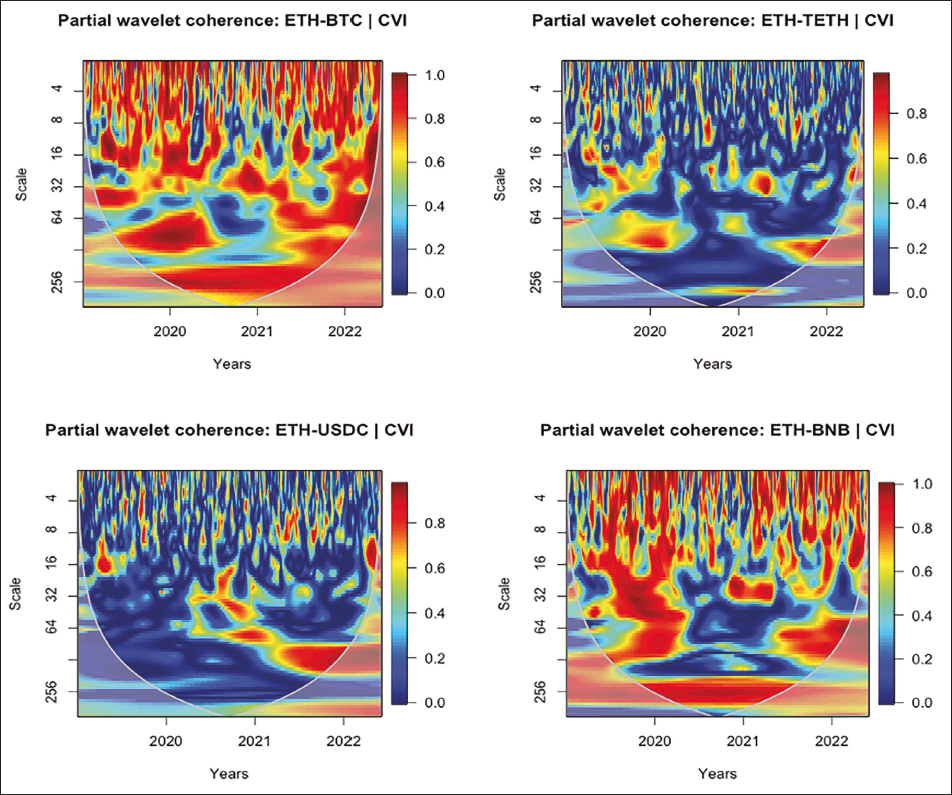
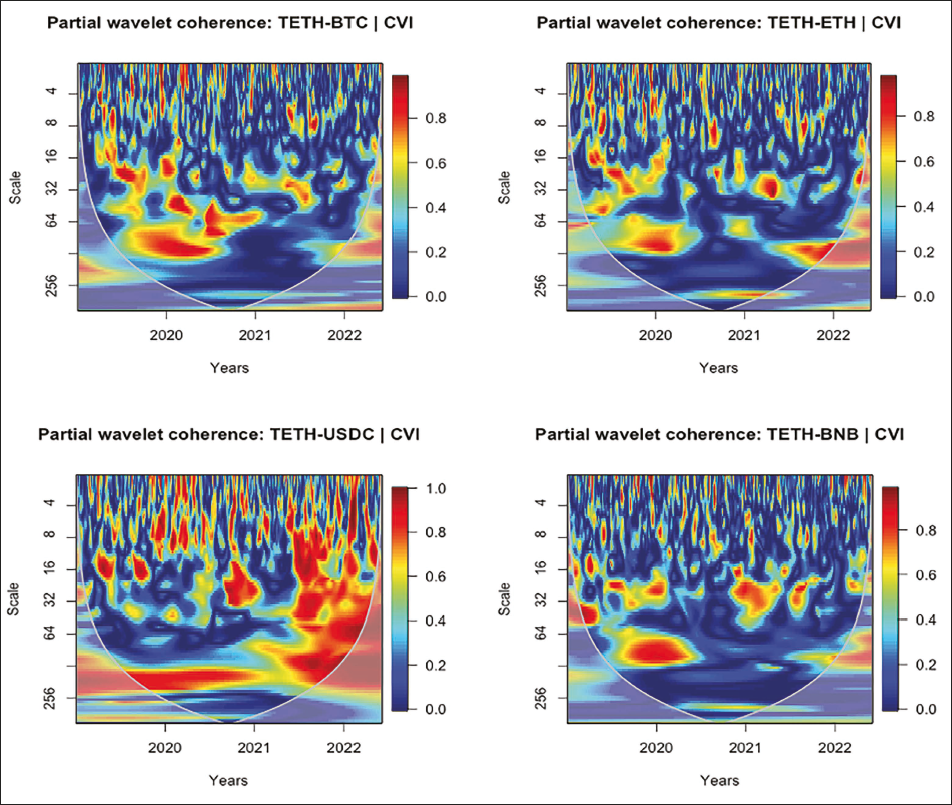
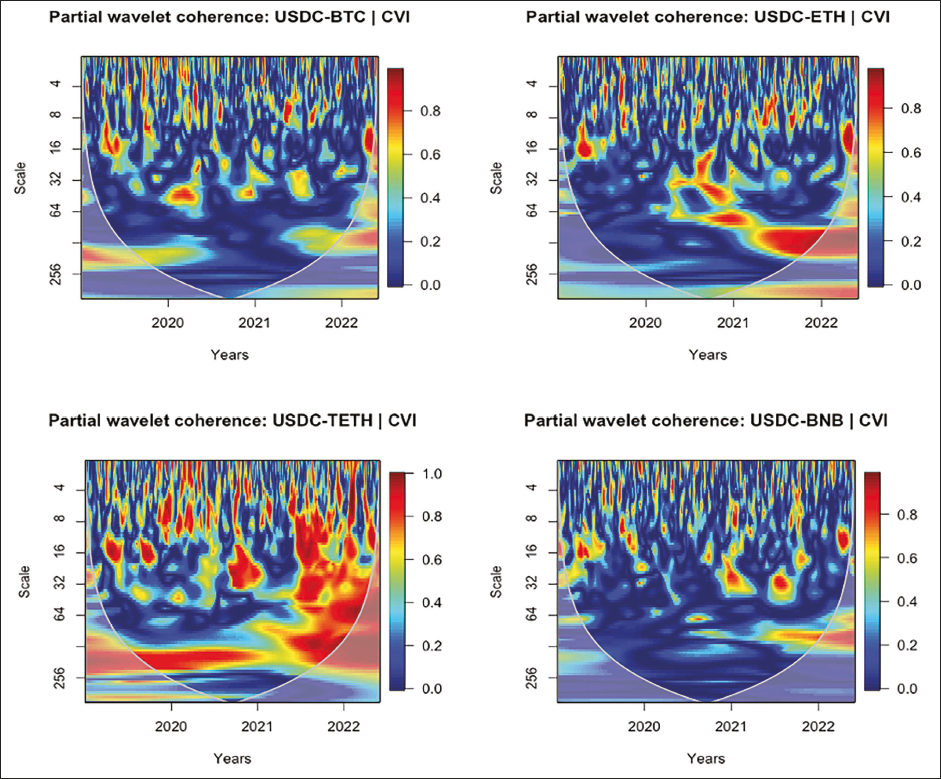
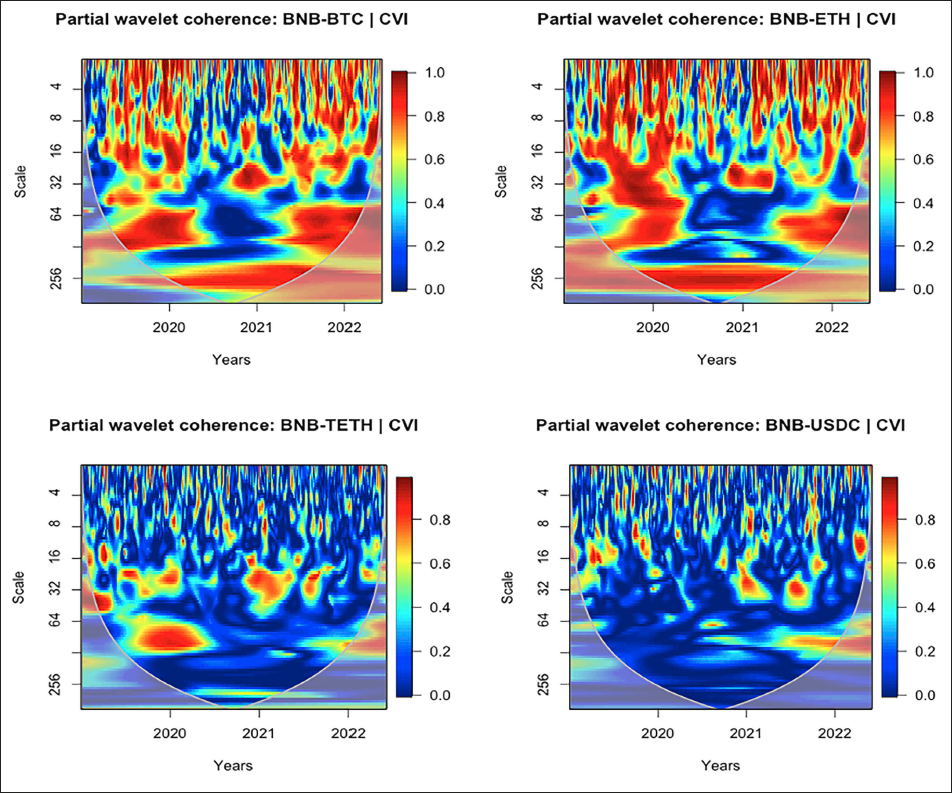
Time-Frequency Analysis Using Partial Wavelet Coherence
The impact of CVI on the co-movements between cryptocurrencies, as shown through partial wavelet coherence in Figures 9–13, reveals that CVI does not drive the perseverance of high correlations between cryptocurrencies. From these plots, it can be observed that the inclusion of CVI as a covariate does not change the degree of interlinkages between Bitcoin and other cryptocurrencies, Ethereum and other cryptocurrencies, Tether and other cryptocurrencies, USD-Coin and other cryptocurrencies or BNB and other cryptocurrencies. This implies that the CVI does not significantly influence the relations between cryptocurrency pairs. Moreover, it indicates the prevalence of idiosyncratic shocks over the common interlinkage within individual cryptocurrency markets during the sample period. Consequently, CVI may not generally serve as a hedging proxy for these cryptocurrencies in case they are included in the same portfolio.
Frequency-dependent Wavelet Analysis
The frequency-dependent analysis examines the interlinkage dynamics of cryptocurrencies and CVI simultaneously over investment horizons during 2019–2022. This analysis is an extension to time-frequency analysis as it depicts multiple interactions with the comprehension of averaged interlinkages. It depicts the average response of each variable to shocks from the other variable, across short-term, medium-term and long-term periods. The analysis encompasses multiple variables over investment horizons to highlight the behaviour of cryptocurrency markets, ranging from heterogeneous to adaptive patterns.
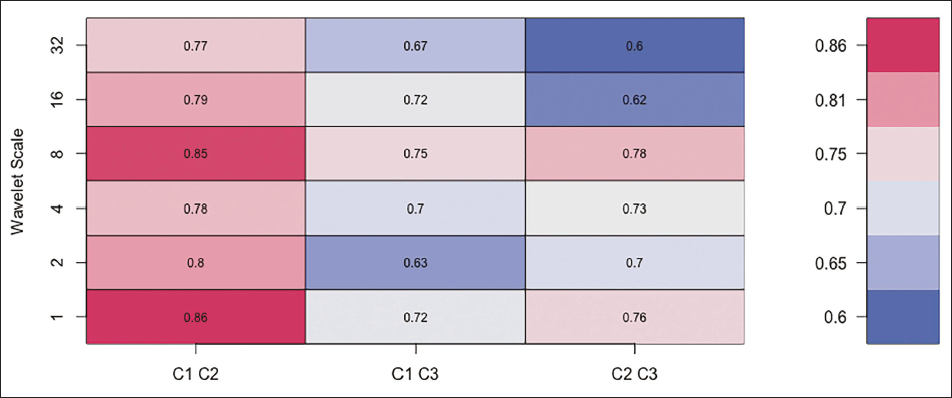
Frequency-dependent Analysis Using Wavelet Bivariate Contemporary Correlations
The wavelet bivariate correlations are estimated to display averaged calendar time correlation across various investment horizons. Figure 14 displays a bivariate contemporary correlation matrix at six wavelet scales, with the horizontal axis portraying possible combinations and the vertical axis portraying wavelet scales. Note that similarities between pairs become weaker with switching to the right from the left. This matrix displays the correlations between cryptocurrency pairs for the period from 2019 to 2022. Bitcoin and Ethereum demonstrated the highest degrees of co-movements, with parameters fluctuating between 0.77 and 0.86 across diverse time scales, followed by Bitcoin and BNB, and Ethereum and BNB. The co-movements in these pairs are positive across intraweek to quarterly scales, representing short-term and medium-term real economic transactions. These positive co-movements make diversification between these pairs impracticable, as they exhibit a tendency towards speculative bubbles.
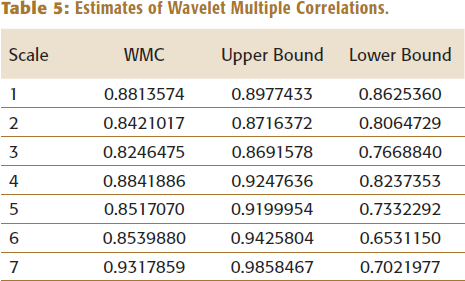
Frequency-dependent Analysis Using Wavelet Multiple Correlations (WMC)
The multiple wavelet correlations are estimated to reveal the degree of cointegration, while the multiple wavelet cross-correlations are estimated to uncover the lead–lag relation among Bitcoin, Ethereum, Tether, USD-Coin, BNB and CVI, across different investment horizons. These statistics provide better insights by measuring the overall interactions at various time scales. Figure 15 and Table 5 display the wavelet multiple correlations among these cryptocurrencies and CVI, with frequency localization using maximal overlap discrete wavelet transform to capture the interlinkages across short-term, medium-term and long-term horizons. The degree of interlinkages is relatively higher in the long term, with undulations or surges in WMC over the time horizon. The value of WMC averages around 0.9317859, with an upper bound of 0.9858467 and a lower bound of 0.7021977 in the long term. This accentuates the higher convergence of cryptocurrencies’ returns in the long term, even in the presence of CVI.
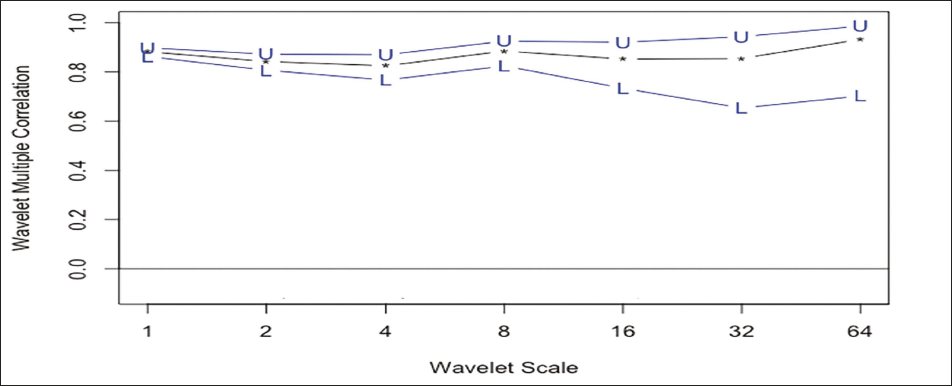
Estimates of Wavelet Multiple Correlations.
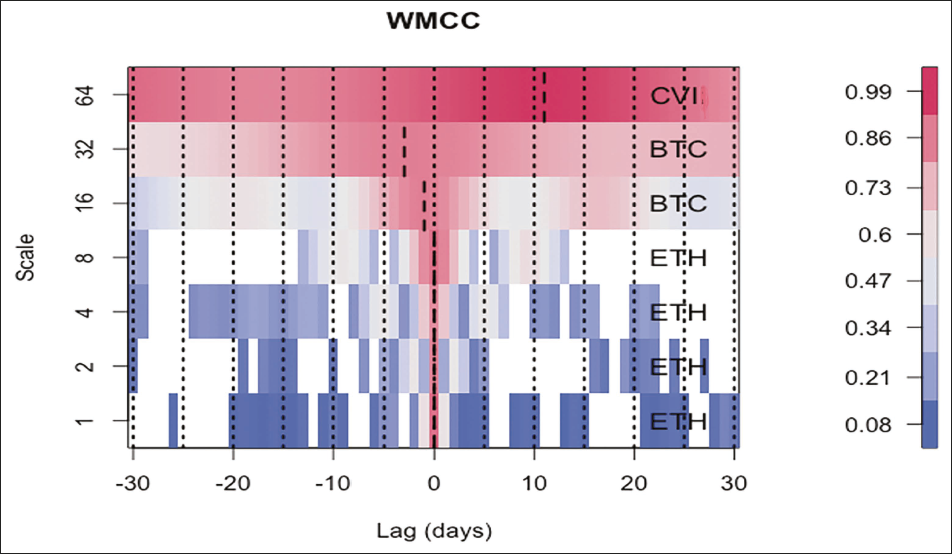
Frequency-dependent Analysis Using Wavelet Multiple Cross-correlations
Figure 16 displays the wavelet multiple cross-correlations coefficients, with the horizontal axis portraying positive and negative lag length of 30 days and the vertical axis portraying wavelet scales. Note that localizations at negative lags represent the leading variable, while those at positive lags represent the lagging variable. A localization at zero lag represents the absence of both lead and lag relationships. In this analysis, localization means the peak values in the linear combination of Bitcoin, Ethereum, Tether, USD-Coin, BNB and CVI at their respective wavelet scales. The localization in Figure 16 is portrayed by short-dashed lines within dotted lines at the corresponding lag intervals. The variable listed on scale indicates the variable that has the potential to either lead or lag all other variables. From the plot, it can be observed that Ethereum is the most influential variable for maximizing the WMCC in the short term, Bitcoin is the most influential variable for maximizing the WMCC in the short to medium term, and CVI is the most influential variable for maximizing the WMCC in the monthly to quarterly scale, that is, in the medium term. The plot also reveals that Ethereum leads or lags at the intraweek and weekly scales, Bitcoin leads at the fortnightly and monthly scales, and CVI lags at the monthly to quarterly scale.
In summary, the evidence confirms that Ethereum is the dominant variable, with the potential to lead or lag the linear combination of other cryptocurrencies and the CVI in the short term. Bitcoin dominates in the short to medium term, with the potential to lead other cryptocurrencies and the CVI. In the medium term, the CVI is the dominant variable, with the potential to lag all cryptocurrencies.
DISCUSSION
The descriptive discernment of the price and return series of Bitcoin, Ethereum, Tether, USD-Coin, BNB and CVI in this treatise reveals varying trends, risk–return profiles and volatility patterns. These dynamics indicate that the co-movement of these cryptocurrencies may vary over different time scales due to unique market dynamics, justifying the expectation of differing co-movements between cryptocurrencies across short and long terms. These properties of return series of cryptocurrencies and CVI align with the results of Bação et al. (2018), Zięba et al. (2019), Qureshi et al. (2020), Malladi and Dheeriya (2021), Shahzad et al. (2021), Gupta and Chaudhary (2022), Bouri et al. (2023) and Zhang et al. (2023) regarding cryptocurrencies’ return distributions. The affirmation of cointegration among cryptocurrencies series in this treatise supports long-term relationship theory aligning with the results of Yi et al. (2018), Bação et al. (2018), Liu and Serletis (2019), Qureshi et al. (2020), Yousaf and Ali (2020), Assaf et al. (2022), Gupta and Chaudhary (2022), Shahzad et al. (2022) and Bouri and Jalkh (2023), while contrasting with the results of Zięba et al. (2019) and Dahir et al. (2020), which confront long-term relationship theory. Additionally, the confirmation of significant interlinkages in present treatise affirms to the findings of Kawaller et al. (1987), Eun and Shim (1989), Wahab and Lashgari (1993), Booth et al. (1997), Johnson and Soenen (2002), Bose (2007), Natarajan et al. (2014), Yin et al. (2017), Hung (2020), Behera and Rath (2021), Malladi and Dheeriya (2021), Assaf et al. (2022) and Agyei et al. (2022) in terms of timing and pace of information transmissions and its pivotal role in investment decisions. Many researchers, such as Yi et al. (2018), Bação et al. (2018), Liu and Serletis (2019), Zięba et al. (2019), Dahir et al. (2020), Qureshi et al. (2020), Hung (2020), Shahzad et al. (2021), Bouri et al. (2021), Malladi and Dheeriya (2021), Assaf et al. (2022), Agyei et al. (2022), Gupta and Chaudhary (2022), Shahzad et al. (2022), Bouri and Jalkh (2023) and Zhang et al. (2023), have extensively explored the interlinkages among major cryptocurrencies in their studies. However, none have delved into the role of volatility as a driver for these interlinkages except Agyei et al. (2022). So, the present treatise contributes to investigating CVI as a driver for interlinkages across cryptocurrencies and investigating the magnitude of interlinkages across investment horizons.
The empirical evidence of significant interlinkages among cryptocurrencies during normal as well as extreme market conditions affirms the findings of Qureshi et al. (2020), Yousaf and Ali (2020), Malladi and Dheeriya (2021), Shahzad et al. (2022), Bouri and Jalkh (2023), Zhang et al. (2023) and contrary to the findings of Geraci and Gnabo (2018) and Bouri et al. (2021), who advocated significant interlinkages during extreme market conditions only. The frequency-dependent analysis as an extension to time-frequency analysis depicts multiple interactions with the comprehension of averaged interlinkages of these cryptocurrencies and CVI simultaneously over investment horizons during 2019–2022 and highlights the behaviour of cryptocurrency markets ranging from heterogeneous to adaptation supporting the heterogeneous market hypothesis of Müller et al. (1997), adaptive market hypothesis of Lo (2005) and the competitive market hypothesis suggested by Cornell (2018). The confirmation of the highest degrees of co-movements between Bitcoin and Ethereum at diverse time scales, followed by Bitcoin and BNB, and Ethereum and BNB, signifies positive co-movements from intraweek scales to quarterly scales, representing short-term and medium-term real economic transactions. These positive movements make diversification impracticable between these pairs, as they exhibit a tendency toward speculative bubbles. The empirical evidence of variations in lead–lag relations between these cryptocurrencies during the sample period depicts the leading position of Bitcoin and the lagging position of BNB in the short, medium and long terms, except for their reversal in the medium term during 2022. This reversal of causal relation during extreme and calm market conditions is in tune with the findings of Tsai (2015), Geraci and Gnabo (2018) and Bouri and Jalkh (2023).
The results of the present treatise, consistent with findings of Agyei et al. (2022), confirm that the CVI does not drive the perseverance of high correlations between cryptocurrencies. That is why CVI may not generally serve as a hedging proxy for these cryptocurrencies in case included in the same portfolio. These empirical findings contribute to the existing literature on the subtleties of interlinkages, such as market condition and specificities explored by Tsai (2015), Geraci and Gnabo (2018), Mansour et al. (2020) and Bouri and Jalkh (2023), sensitivity to internal instability by Shchepeleva (2017), echelon dynamics, long-term capital management crisis and the 2008 financial crisis in market contagion by Geraci and Gnabo (2018), global real economic activity by Walther et al. (2019), fintech innovation by Aslam et al. (2023) and inflation expectation, financial stress and geopolitical risk as well as precious metal volatility by Bouri and Jalkh (2023). Collectively, these insights provide wholesomeness in discernment analysis of the connections between assets, markets and economies.
IMPLICATIONS
The present treatise presents interlinkage dynamics highlighting the practicality of cryptocurrencies and CVI to comprehend the behaviour of cryptocurrency markets with imperative implications for investors, portfolio managers and regulators.
Implications for Investors
The findings highlight the importance of understanding the market dynamics of the cryptocurrency landscape by investigating the connections among different cryptocurrencies and the role of CVI in driving the interlinkages and co-movements among different cryptocurrencies. Investors should contemplate these results while framing diversification strategies for their portfolios. Like, in sections where CVI leads, investors may lose investment values due to high fluctuations in the cryptocurrency market if they do not take the benefits from diversification in negative co-movement sections. Furthermore, the positive co-movement sections display the extinction of the property of cryptocurrencies as a safe haven. The empirical evidence of varying co-movements across different time scales suggests investors should not rely solely on short-term trends, but they should also consider medium-term and long-term connections. Additionally, the results also identify the significant interlinkages during both normal as well as extreme market conditions, highlighting the discernment of market dynamics impacting their investments. Moreover, the results depict the prevalence of idiosyncratic shocks over the common interlinkage within individual cryptocurrency markets. So, CVI may not generally serve as a hedging proxy for these cryptocurrencies in case included in the same portfolio. By adopting this discernment, investors can manage risks and optimize returns in the volatile cryptocurrency market.
Implications for Portfolio Managers
The present treatise’s insights can help portfolio managers in constructing and managing investment strategies. As the findings suggest varying trends, risk–return profiles and volatility patterns of cryptocurrencies, portfolio managers can consider these findings in their portfolio construction. Furthermore, the depiction of varying interlinkages among cryptocurrencies across investment horizons may also facilitate portfolio managers in asset allocation and rebalancing strategies. So, the contemplation of these findings by portfolio managers into their investment models can facilitate in construction of resilient portfolios that will withstand market volatility along with the capitalization of the available opportunities in the dynamic cryptocurrency landscape.
Implications for Regulators
The present treatise’s insights can help regulators to gain a deeper understanding of the complex dynamics of the cryptocurrency landscape. The empirical evidence of significant interlinkages and volatility patterns can help in framing robust regulatory frameworks to address the unique challenges of the cryptocurrency market. They may use the insight to monitor market behaviour more effectively and implement the measures to protect investors from excessive volatility and market manipulation.
LIMITATIONS AND AREAS OF FUTURE RESEARCH
The analysis in the present treatise is based on the daily return series of CVI and five cryptocurrencies (Bitcoin, Ethereum, Tether, USD-Coin and BNB) with the highest market cap only. This narrow scope poses a limit in generalizing the results to the broader cryptocurrency market landscape as the cryptocurrencies with mid-market cap and small-market cap are not included. Additionally, the analysis is based on daily returns data that may miss the intraday price movements and volatility captured by high-frequency data. These results may be further upgraded by extending the time-frequency methodology to more cryptocurrencies with mid-market cap and low-market cap using their high-frequency data over a more extended time frame or across different market cycles.
CONCLUSION
The pivotality of timing and pace of interlinkages regarding dynamics of returns and volatilities has aroused the interest of investors, portfolio managers, and regulators to comprehend the direction and magnitude of causal relationships, along with their attributed dynamisms, for cryptocurrencies. Recently, many researchers have addressed their concern by studying interlinkages among cryptocurrencies using advanced methodologies, but much of the focus has been on peripheral factors, creating a lacuna to explore volatility as a driver for interlinkages. So, this study aims to fill this lacuna by examining volatility as a driver for interlinkages between cryptocurrencies and investigating the magnitude of interlinkages among cryptocurrencies and the CVI across investment horizons using econometrical and wavelet analysis. The data in this treatise encompass daily spot prices of the top-market-cap cryptocurrencies (Bitcoin, Ethereum, Tether, USD-Coin and BNB) and the CVI starting from April 2019 to August 2022.
The estimates from unconditional correlation and covariance depict a negative relation between CVI and the cryptocurrencies, with evidence of simultaneous co-movements. However, this analysis does not illustrate the relative integration and causality of their relationships. To address this, the cointegration is investigated using the Johansen test of cointegration, and the estimates depict long-term relationship among these cryptocurrencies and CVI. The exploration of interlinkages between these cryptocurrencies and CVI is further extended using wavelet analysis to highlight their multi-scale and time-frequency interconnections.
Bivariate wavelet coherence, partial wavelet coherence and multiple wavelet correlations are estimated to depict co-movements, causal relationships, the impact of CVI on interlinkages, and the degree of interlinkages among cryptocurrencies and CVI across investment horizons. The time-frequency analysis of interlinkages using wavelet coherence comprehends the time frequencies of co-movements between the series. It can be inferred from their estimates that the CVI exhibits significant short-term, medium-term and long-term interlinkages with Bitcoin, Ethereum, Tether, USD-Coin and BNB. The time-frequency analysis using partial wavelet coherence depicts that CVI does not drive the perseverance of high correlations between cryptocurrencies. Specifically, there is no change in the degree of interlinkages between Bitcoin and other cryptocurrencies, Ethereum and other cryptocurrencies, Tether and other cryptocurrencies, USD-Coin and other cryptocurrencies, or BNB and other cryptocurrencies when CVI is included as a covariate. These results depict the prevalence of idiosyncratic shocks over the common interlinkages within individual cryptocurrency markets. As a result, CVI may not generally serve as a hedging proxy for these cryptocurrencies when included in the same portfolio. The estimates of wavelet bivariate correlations highlight that Bitcoin and Ethereum exhibit the highest degrees of co-movements across various time scales, followed by Bitcoin and BNB, and Ethereum and BNB. The co-movements in these pairs are positive from intraweek scales to quarterly scales, representing short-term and medium-term real economic transactions. These positive movements make diversification impracticable between these pairs, as they tend to exhibit behaviour associated with speculative bubbles. The estimates from multiple wavelet correlations confirm that the degree of interlinkages is relatively high in the long term, with undulations or surges over the time horizon. This accentuates a higher convergence of cryptocurrencies’ returns in the long term, even in the presence of CVI. The wavelet multiple cross-correlations coefficients depict Ethereum as the most influential variable in the short term, Bitcoin as the most influential variable in the short to medium term, CVI as the most influential variable in the monthly to quarterly scale (i.e., in the medium term). The estimates also confirm that Ethereum leads or lags at the intraweek and weekly scales, Bitcoin leads at the fortnightly and monthly scales, and CVI lags at the monthly to quarterly scale.
These empirical findings, which highlight significant interlinkages among cryptocurrencies and the CVI, particularly in terms of timing and pace of information transmissions, may aid investors, portfolio managers and regulators in comprehending the behaviour of cryptocurrency markets for effective asset allocation, portfolio rebalancing and mitigating price manipulation. Moreover, discerning the practicality of cryptocurrencies and CVI in diversification, hedging and asset allocation across varying market conditions enhances the comprehension of market dynamics. This, in turn, can improve diversification benefits, help guard against losses from speculative bubbles and provide a more comprehensive perspective on market sentiment and volatility levels, for better risk anticipation and management in the dynamic cryptocurrency landscape.
Footnotes
DECLARATION OF CONFLICTING INTERESTS
The author declared no potential conflicts of interest with respect to the research, authorship and/or publication of this article.
FUNDING
The author received no financial support for the research, authorship and/or publication of this article.
E-mail: