
Abstract
The article attempts to measure financial inclusion at the household level with the Wroclaw taxonomic approach as an appropriate method of construction of composite indices and study the effects of various socio-economic development indicators on financial inclusion at the disaggregated level. Data analysis exemplified that the level of financial inclusion was directly related to per-capita income, household amenities, literacy and awareness of Pradhan Mantri Jan Dhan Yojana (PMJDY) and inversely to the distance from the bank (beyond 3 km). The results also suggested that the intended outcome of creating awareness about PMJDY to promote financial inclusion was not achieved in rural areas.
Executive Summary
Financial inclusion has emerged as a major development issue in recent times. However, more than 2 billion people worldwide lack access to financial services, with nearly 50% residing in developing countries. Despite the momentum gained with the launch of the Pradhan Mantri Jan Dhan Yojana (PMJDY) in 2014, there still exists a significant disparity in the levels of financial inclusion in India and Odisha. One effective approach to advancing financial inclusion is to measure it coherently and identify the factors that drive it. To that end, this study, using the financial inclusion index developed by Raichoudhury (2020), has sought to measure financial inclusion at the household level. The study also used the stepwise regression method to examine the relationship and impact of various socio-economic development indicators on financial inclusion at disaggregated levels. Data analysis from 348 households revealed that financial inclusion was directly associated with per-capita income, household amenities, literacy and awareness of PMJDY and inversely related to the distance from the bank (beyond 3 km). A rural–urban comparison indicated that respondents in rural areas mostly had medium to low levels of financial inclusion. The results also suggested that the intended outcome of creating awareness about PMJDY to promote financial inclusion was not achieved in rural areas. This underscores the need for banks and policymakers to focus on raising awareness about the benefits of PMJDY in rural areas, as such efforts can significantly contribute to financial inclusion in these areas.
Financial inclusion has become a significant focus for countries worldwide, as reflected in the Sustainable Development Goals of 2030 and the National Strategy for Financial Inclusion 2019–2024. Various studies and existing literature demonstrate the crucial role of financial inclusion in socio-economic development (Demirguc-Kunt et al., 2015; World Bank, 2013). Research has linked financial inclusion to reduced poverty rates, decreased inequality and higher economic growth (Barclays, 2010; Beck et al., 2007; Brune et al., 2011; Burgess & Pande, 2005; Park & Mercado, 2015; Sharma, 2016). Despite its recognized importance, achieving complete financial inclusion remains a challenge, with over 2 billion people globally lacking access to financial services (Ansar et al., 2018). Notably, half of these individuals reside in Bangladesh, China, India, Indonesia, Mexico, Pakistan and Nigeria, posing a significant obstacle to achieving comprehensive financial inclusion.
In the Indian context, only 58.7% out of 246.7 million households had access to banking services, according to the Census of India 2011. Out of this, the urban population accounts for 67%, while the rural population is only 54%. Similarly, Credit Rating Investment Services of India Limited (CRISIL) reported that one-third of the population in India did not have a savings account at any bank in 2013 (CRISIL, 2013; Singh, 2018). The Swabhimaan campaign under the UPA government and the Pradhan Mantri Jan Dhan Yojana (PMJDY) under the NDA government reflected determination and gravity. The entire banking industry, under the guidance of the Reserve Bank of India (RBI), prepared roadmaps for financial inclusion. The result was mostly millions of no-frills accounts being opened, with the majority lying dormant. The proportion of adults having an account at any financial institution has doubled in India since 2011, reaching 80% in 2017 (Ansar et al., 2018). However, 50 million of these accounts had no transactions (Jha, 2019, January 3). Furthermore, 23.3% of the total Jan Dhan accounts are inactive (Nair, 2016). Merely opening bank accounts may result in unused accounts, which undoubtedly do not serve the purpose of financial inclusion. At this juncture, too much importance is placed on a single component of financial inclusion, such as the penetration of banking services, which may not be justified. Moreover, achieving comprehensive financial inclusion is not just restricted to individual indicators such as availability and penetration of financial inclusion. To a certain extent, the ultimate purpose lies in the usage of financial services and minimizing the barriers in socio-economic development conditions causing social exclusion. If comprehensive financial inclusion is to be achieved as an instrument of development, a clear intent and strategy would be required to address poverty and vulnerability and support economic security and viable livelihoods. Many studies have been done on financial inclusion and development, and the argument in this article is somewhat different. In previous studies, the standard approach to measure financial inclusion was through individual indicators. However, recent studies reveal that financial inclusion is a multidimensional concept and is a complex phenomenon that cannot be precisely encapsulated by sole indicators. A very large set of indicators is required. Although several studies provided composite indices to measure financial inclusion, they have used publicly available data. While a few pieces of literature used primary data, the findings are still inadequate. The existing composite measures/indices used arbitrary weights and only demand- and supply-side information. The choice of weights was either based on the intuition of the researcher or selected endogenously by making assumptions about raw data. Moreover, a few other dimensions of financial inclusion were almost invariably missed out of these studies. Recent research has also been touched upon to some extent by studies looking at the important socio-economic development factors and determinants of financial inclusion. However, given the growing importance of financial inclusion in India, to the best of our knowledge, there has been no systematic research on understanding the consequences of socio-economic development factors on financial inclusion at the disaggregated level of a household. Data comparability issues are less severe within a country than across countries. There is also unnoticed heterogeneity at the cross-section level. Thus, cross-country evaluation can be ambiguous. Given this context, there is a growing need to evaluate financial inclusion coherently and determine the important socio-economic development predictors that may affect the intensity of financial inclusion even at the disaggregated level and further suggest appropriate policy implications. In this regard, the measurement of financial inclusion needs a fresh look and examination. The present study is an effort in this direction. In this spirit, the study focused on the measurement of financial inclusion coherently and also explored the socio-economic constraints of financial inclusion at the household level of the Puri district of Odisha.
The article is dissected into four sections. The next section provides a comprehensive literature review. The methodology followed for constructing composite indices of financial inclusion and the statistical analysis have been explained in detail in the subsequent section. The article concludes with a discussion and policy implications of the study.
LITERATURE REVIEW
Financial inclusion is a catalyst for the next wave of growth and prosperity. Numerous studies have been conducted on the theoretical and practical aspects of financial inclusion, ranging from general concepts to country-specific issues (Ardic et al., 2011; Basu & Srivastava, 2005; Corr, 2006; Demirguc-Kunt & Klapper, 2012; Kempson et al., 2000; Kempson & Whyley, 1999; Leyshon et al., 1997; Ramji, 2009; Rangarajan, 2008; Sinclair, 2001). The significance of financial inclusion in a country’s socio-economic development and its positive impact on growth has been recognized for quite some time. Schumpeter (1934) first proposed the idea of a positive relationship between financial development and growth. The crucial role of the banking system in economic growth has also been acknowledged by Bagehot (1873), King and Levine (1993), Levine (1997) and Peachey and Roe (2004). However, the focus on the role of financial inclusion in the development process has intensified in recent years, particularly after the influential work of Sarma and Pais (2011). Nonetheless, additional research is necessary to evaluate the access and usage of financial services and assess their impact on development outcomes.
The literature on financial inclusion has highlighted that having access to financial services does not necessarily mean that people are using them (Claessens, 2006). Previous studies, such as those by Honohan (2008) and Iqbal and Sami (2017), often used individual indicators like the number of bank branches or ATMs per adult population as substitutes for measuring financial inclusion. Similarly, indicators like gross domestic product (GDP), real per-capita GDP or gross national product have been used as proxies for economic development by researchers such as Cracolici et al. (2010), World Development Indicators (2016) and the World Bank (2006, 2018). Despite the emphasis on the importance of financial inclusion, one major challenge is the lack of standardized techniques for assessing it. In recent years, there has been a growing body of research focusing on various dimensions of financial inclusion, with many studies attempting to measure it using a multidimensional index (Ambarkhane et al., 2016; Amidžić et al., 2014; Beck et al., 2007; Cámara & Tuesta, 2015; Chattopadhyay, 2011; CRISIL, 2013; Goel & Sharma, 2017; Gupte et al., 2012; Honohan, 2008; Mehrotra et al., 2009; Pal & Vaidya, 2011; Raichoudhury, 2016; Sarma, 2008, 2012; Sophastienphong & Kulathunga, 2010; Tuesta et al., 2015; Yadav & Sharma, 2016). However, existing composite indices often use arbitrary weights and rely on either demand- or supply-side information. The construction of these indices has typically involved parametric or non-parametric methods. Non-parametric methods, as noted by Lockwood (2004), are more susceptible to intuitive and restrictive weight assignments, while parametric methods make assumptions about the data and may be biased toward weakly correlated indicators (Mishra, 2016, 2017; Steiger, 1979). Consequently, studies on the measurement of financial inclusion through composite indices are still limited and may contain methodological flaws. Moreover, there is a lack of discourse on developing composite indices of financial inclusion at a disaggregated level, which could enable tracking financial inclusion in a management information system framework and promote transparency across India’s three-tier governance system. To address these limitations, composite scores can be computed using the Wroclaw taxonomic method, as demonstrated by Myers (1963), Evans et al. (1965) and Harbison (1975). This method has also been utilized by Khan and Islam (1990), Belzile (2012), Narain et al. (2011) and Khan and Zerby (1981).
Predictors of Financial Inclusion
The significance of socio-economic development factors concerning financial inclusion has not been given much attention in theory or practice. However, the discussion about the impact of socio-economic development on financial inclusion continues. There is limited literature on the connection between financial inclusion and socio-economic development, and the debate on the relationship between financial deepening and socio-economic development is ongoing. Early work by Goldsmith (1959) emphasized the strong link between financial and economic development. Some studies, including those by Bencivenga and Smith (2006), Gerschenkron (1962), Greenwood (1990) and Schumpeter (1934), provided theoretical evidence that countries with well-developed financial systems have better growth prospects. King and Levine’s (1993) study also supports similar findings. Theoretical support suggests that the opposite is also true, as a lack of inclusion can exacerbate poverty through unequal income distribution and lead to slow economic growth (Banerjee & Newman, 1994; Greenwood, 1990; World Bank, 2014). Therefore, economic growth is closely associated with financial inclusion. However, empirical studies using regression analysis have shown weak statistical significance in the relationship (Banerjee & Duflo, 2003). Overall, the studies confirm that people experience better economic conditions when they are included in the financial system. Various studies have reported that financial inclusion leads to improved standards of living, increased income, and reduced poverty (Allen et al., 2016; Brune et al., 2011; Gwalani & Parkhi, 2014; Honohan, 2008; Karlan, 2014; Park & Mercado, 2015; Rojas-Suarez, 2015). Other studies have highlighted the importance of higher literacy rates, better education and healthcare facilities for achieving better financial inclusion (Cámara & David, 2015; Chibba, 2009; Sarma & Pais, 2011). This study aims to identify the factors influencing financial inclusion, using household data from remote villages and towns in the Puri district of Odisha. It is also unique in its effort to capture the socio-economic development predictors that influence the financial inclusion index.
The objectives of the study are:
To measure the extent of financial inclusion in a composite manner at the household level with special reference to Puri district. Assess the contribution of socio-economic and development factors influencing the level of financial inclusion at the household level.
RESEARCH METHODOLOGY
Sampling and Data Collection
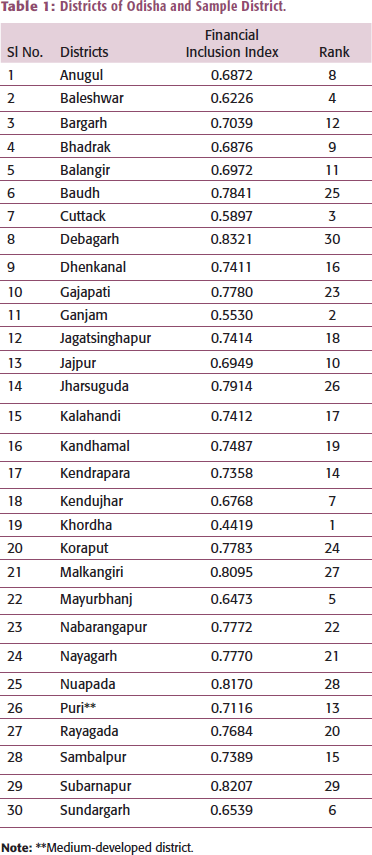
Most studies have focused on creating a composite index of financial inclusion at either the cross-country level or for the states of India. To the best of the author’s knowledge, no study has been done on Odisha. Raichoudhury (2020) calculated a financial inclusion index for 28 states of India, and Odisha was ranked as medium. The present study attempted to choose a medium-ranked state. In the next phase of sampling, the sample was selected based on the financial inclusion indices (FI) of the districts, as shown in Table 1, using the Wroclaw taxonomic approach, which will be discussed later in the article. Puri district, out of all the 30 districts, was selected for the study as it was medium-ranked. To consider the nature and degree of variations in financial inclusion in the rural and urban areas within the Puri district, it was decided to select two blocks (Nimpara and Gop) to represent rural areas and the Puri municipal corporation to represent the urban block. Two blocks (Nimapara and Gop) with the highest number of villages in the district were chosen. This selection will provide an average picture and give an idea about the extent of imbalances.
Districts of Odisha and Sample District.
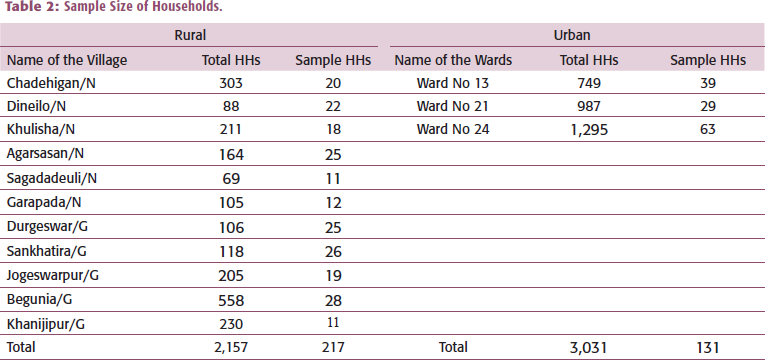
In the next stage, six villages were selected in the Nimapara block and five villages in the Gop block of Puri district for the final survey. Half of the villages that were chosen had a bank within 1.5 km, while in the other half, the bank was located more than 3 km away. To compare rural and urban situations, the Puri district headquarters/municipality was included as part of the urban sample. Additionally, three wards were selected from the urban sample. In the final stage, the sample households were selected through convenience sampling. The study had a total of 358 sample households from a universe of 5188 households. Out of these, 217 households were selected from the sampled villages in the rural areas, and 141 households were selected from the urban centre. The respondents were the heads of the household. Finally, 348 households (217 from rural areas and 131 from urban areas) were selected after filtering for completeness of answers (see Table 2).
Sample Size of Households.
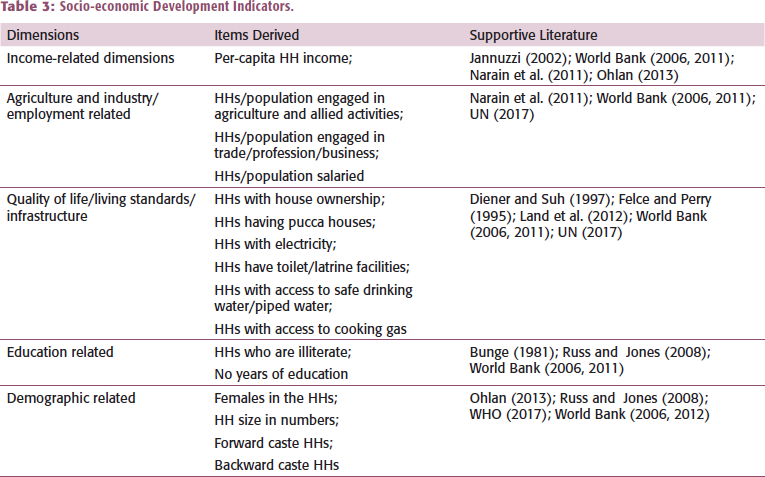
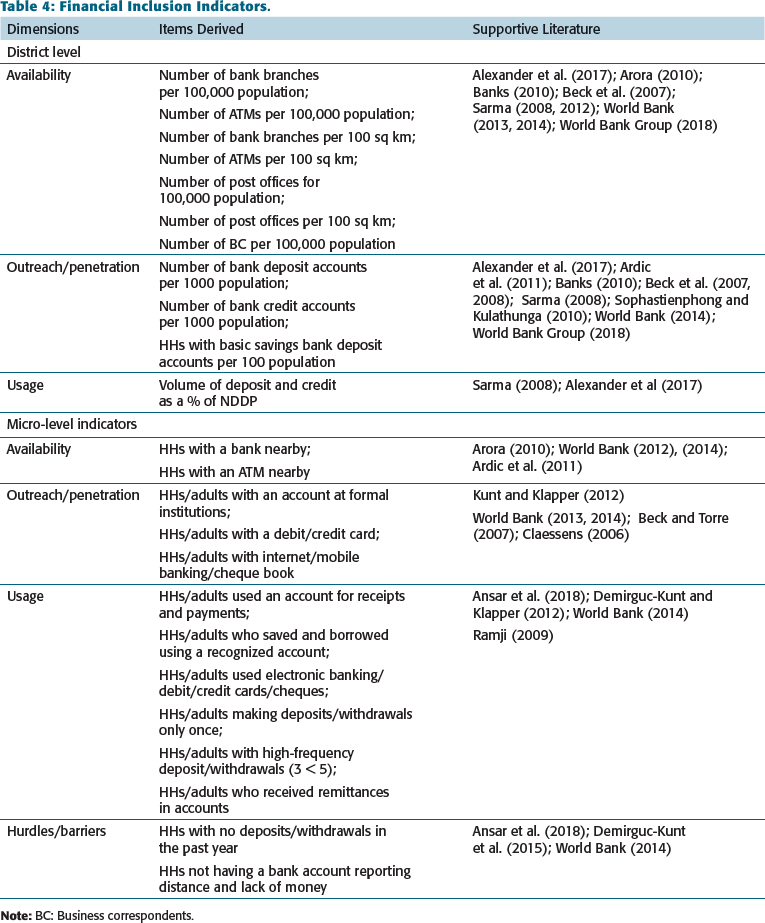
Against this backdrop, both secondary and primary data were used in this study. The secondary data were collected to compute the financial inclusion indices of different districts of Odisha. The sources of secondary data were the Directorate of Economics and Statistics Government of Odisha, the Economic Survey of Odisha, the Statistical Abstract of Odisha and the District Statistical Handbook. In addition to secondary data, primary empirical data from the heads of the household were collected with a pretested and well-structured schedule. With 32 statements, the questions were essentially adapted from the World Bank Financial Inclusion Survey Questionnaire: FINDEX. The choice of various financial inclusion and socio-economic development indicators was adapted from several kinds of literature. The selection of indicators, their context, along their literature support are given in Tables 3 and 4.
Socio-economic Development Indicators.
Financial Inclusion Indicators.
Tools and Techniques Used in the Analysis
Taxonomic Method
The basic steps in the taxonomic method are calculating the mean Xj and standard deviation Sj of all the chosen parameters. Second, the chosen parameters are made comparable or unit-free as they are in diverse standards of measurement. The indicators are made uniform utilizing the following formula:
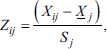
where i = 1, 2, 3 … n, or the number of districts/villages/households;
j = 1, 2, 3 …k or parameters;
Zij = standardized value of the ith districts/villages/households;
Xij = given the value of the jth indicator of the ith districts/villages/households
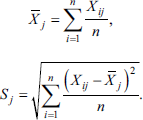
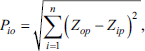
The third step involves computing the pattern of inclusion. Next, the best district/village for each parameter was identified. The best is one with the highest comparable value in the case of positive parameters. Otherwise, the minimum or lowest value is selected in case of negative parameters. The standardized value of every parameter is deducted from the best-standardized value, and the pattern of inclusion/development is computed utilizing the procedure:
where
i = 1, 2, 3 … n;
Finally, the composite score is calculated utilizing the following procedure:

where
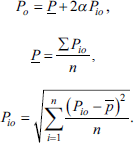
The Di scores range between 0 and 1. If the score of the composite index is close to 0, the higher the level of inclusion. The level of inclusion is low if the score of the composite index is close to 1.
The Regression Model
Stepwise regression was used to identify the important socio-economic development predictors of financial inclusion. The advantage of using the stepwise regression method over other methods is that it looks for the predictor variable that nearly correlates with the dependent variable. The model used was as follows:
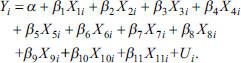
The dependent variable, Y, in the model is the financial inclusion index (FI) representing the financial inclusion status of the population.
The independent variables are per-capita income (X1), asset index (X2), education in years (X3), age (X4), family size (X5), origin of the household (X6), gender (X7), occupation (X8), caste (X9) distance from bank (X10) and PMJDY awareness (X11). U was the error term, and i = 1,2,3…n households.
Crude Composite Index for Household Amenities
The crude composite scores based on the household amenities have been constructed by judiciously assigning scores for each dimension. The scores for each dimension have been given by keeping the perceived contribution of that amenity to the household quality. The total score for a household has been obtained by the simple aggregation of the scores for individual amenities for that household. The total score indicates the status of the household in terms of household quality. A detailed description of the amenities and the scores assigned to each of them for the construction of the crude composite scores is given in Appendix A.
The overall composite index is obtained by the simple aggregation of the scores for individual dimensions for every household. Mathematically,

where
Κ = number of variables.
The composite scores based on the selected dimensions have a possible score range of 0 to n. The score ‘0’ represents the lowest status, and ‘n’ represents the highest quality of the household. The scores have been worked out, which corresponds to approximately the lowest one-third, the next one-third, and the last one-third of the sample households (NFHS 2014).
1
Lowest one-third sampled HHs = Scores 0 to 4 as ‘Lower quality amenities’. Next one-third to two-thirds sampled HHs = Scores 5 to 8 called ‘Moderate quality amenities’. Top one-third sampled HHs = Scores 9 to 13 called ‘Higher quality amenities’.
Financial Inclusion Analysis of the Villages: Their Relative Status
For the computation of the composite indices of financial inclusion in the village/town, the indicators for availability, penetration, usage and barriers to banking services are chosen. Fifteen parameters of financial inclusion are included at the village/town level (see Appendix B). The values of the composite indices of financial inclusion for all the sample villages and Puri town are presented in Table 5. For such classification of the villages/town of Puri district based on the composite indices of financial inclusion and their relative comparison, it is assumed that the villages/town having a composite index less than or equal to (mean – standard deviation, i.e., 0.40) are in the high financial inclusion group. Similarly, the villages/towns having indices greater than (mean + standard deviation, i.e., 0.56) are in the low financial inclusion group, and in between (mean – standard deviation, i.e., 0.40) and (mean + standard deviation, i.e., 0.56) are in the medium financial inclusion category.
Composite Indices of FI of the Sample Villages/Town in Puri District.
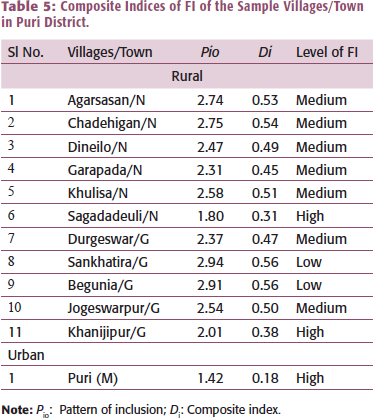
The composite indices ranged from 0.31 to 0.56. Sagadadeuli in Nimapara block and Khanijipur in Gop block are the villages with high financial inclusion. Shankatira and Begunia in the Gop block are placed in the low-level category, while the remaining villages are in the medium inclusion category. Similarly, it is observed that Puri town has high financial inclusion, indicating a relatively higher level of financial inclusion in urban households compared to rural households. The overall results show significant disparity in the level of financial inclusion among villages in the district, pointing to deficiencies in policies and a lack of awareness about financial inclusion. The poor state of financial inclusion is highlighted by 38.5% of accounts being dormant, meaning they do not have any deposits in a bank. In rural areas, the proportion is 50%. Additionally, half of the households do not withdraw any money in a typical month. The proportion of households using debit cards for payments is less than 10% in rural areas, compared to two-thirds of households in urban areas. There is much that needs to be achieved in the coming years.
However, it is also essential to know the key socio-economic development predictors of financial inclusion through statistical investigation. Does financial inclusion depend on the income level of the household, the geographical location or the quality of life using better household amenities? Or are there other socio-economic development factors leading to financial inclusion? And if so, what are those factors? The next section throws light on this aspect.
STATISTICAL ANALYSIS OF THE DETERMINANTS OF FINANCIAL INCLUSION OF HOUSEHOLDS
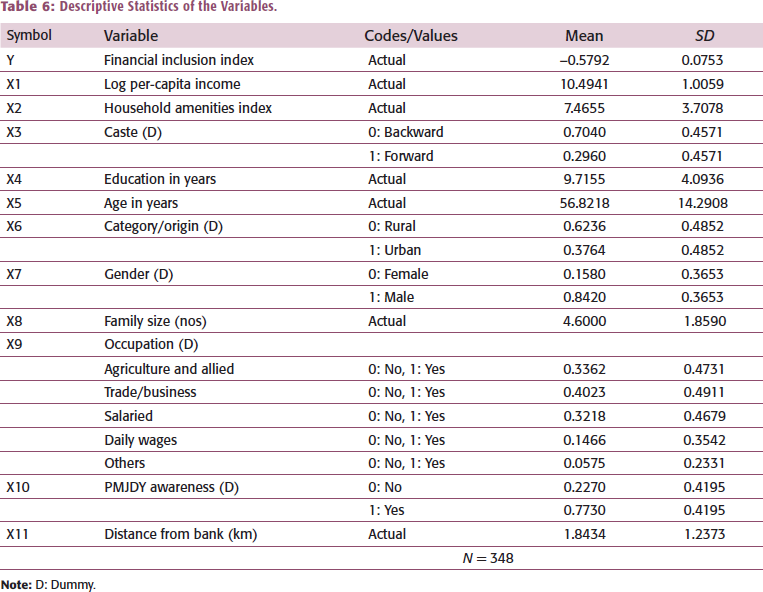
The objective of this section was to find out the socio-economic development predictors influencing financial inclusion through regression analysis. To prop up financial inclusion, in 2014, the GOI announced the PMJDY. One of the explanatory variables in the study is PMJDY awareness, and a substantial part of the sample (77.30%) reported being aware of the scheme. Thus, it was important to understand if such endeavours from the government through PMJDY awareness drastically contributed towards financial inclusion in rural areas. For regression analysis, 11 explanatory variables were taken into consideration. The study did not include other independent variables that affect financial inclusion due to the small size of the sample.
It is evident from Table 6 that some explanatory variables (caste, category/origin, gender, occupation and PMJDY awareness) are categorical. Hence, dummy variables were used for the above categories and assigned the value of 1 if the respondent falls in that particular group and zero if he does not. While using dummy variables, for n levels of variables,
Descriptive Statistics of the Variables.
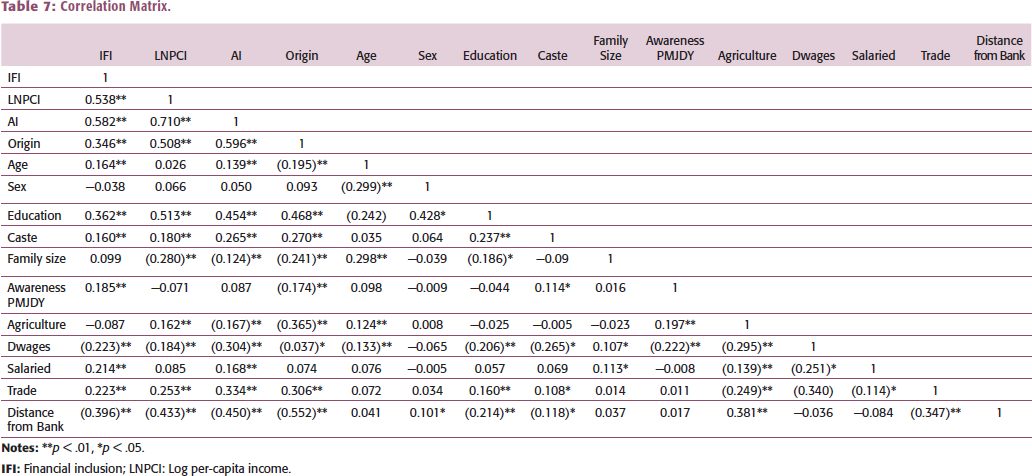
A multiple correlation analysis using the variables is presented in Table 7. The analysis revealed a strong correlation between the asset index and the log of per-capita income, as well as the origin of the household. Additionally, the origin of the household showed a high correlation with the distance from the bank. These results suggest the presence of multicollinearity among the study variables (Willis & Perlack, 1978). However, none of the correlations exceeded the threshold level of 0.80 in the analysis. The correlation matrix for regression indicates that multicollinearity is not a significant issue. Tolerance levels and variance inflation factor (VIF) were also used to assess the multicollinearity problem. The VIF of all the significant explanatory variables was well below 10, and the tolerance levels were not below 0.05 (see Table 8). This implies an absence of multicollinearity among the significant predictors (Gujarati, 2004; Gujarati & Porter, 2008). Consequently, stepwise regression was conducted to identify the important predictors influencing financial inclusion (Mishra & Mohanty, 2016). The ‘forward’ stepwise method was employed using SPSS 24.0 to isolate the effects of socio-economic and development indicators on financial inclusion.
Correlation Matrix.
Stepwise Regression Results to Predict Financial Inclusion.
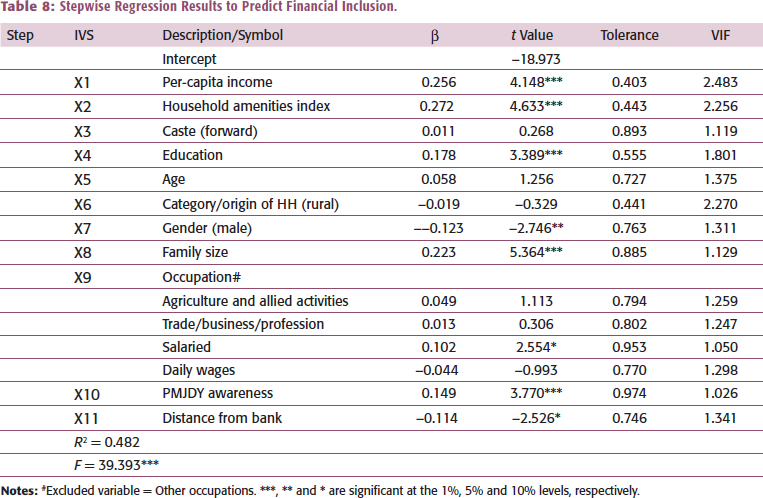
The index of financial inclusion served as the dependent variable, while socio-economic development indicators were considered explanatory variables. As shown in Table 8, the R-square value of the final step revealed that eight parameters collectively accounted for a 48% variation in financial inclusion (F = 39.393/df = 341/6) with the variables included in the model. The stepwise results indicate that the model significantly predicts the outcome variable ‘financial inclusion’ as the p value is less than .01. The regression summary table provides information on each predictor variable along with beta coefficients, t-values, VIF and tolerance levels.
Regarding the individual predictors of financial inclusion, the household amenities index (β = 0.272), log of per-capita income (β = 0.256), education (β = 0.178), PMJDY awareness (β = 0.149), family size (β = 0.223), gender (β = –0.123), distance from bank (β = –0.114) and salaried occupation (β = 0.102) were identified as the most significant predictors. The positive beta value indicates that households with better amenities are more likely to have higher financial inclusion. In other words, if the household amenities index was high (i.e., owning a house, having a permanent structure, access to electricity, better cooking fuel, safe drinking water, improved sanitation facilities and higher asset value), the households exhibited higher financial inclusion.
The following factors are crucial in predicting financial inclusion: per-capita income, education, family size and awareness of PMJDY. These factors have a p value of <.000, indicating their high level of importance. Notably, a positive and statistically significant coefficient value was observed for per-capita income, suggesting that households with higher per-capita income are more likely to be financially included. Similarly, awareness of PMJDY also showed a positive and statistically significant coefficient value, indicating that households with knowledge of PMJDY benefits are more likely to be financially included. Education was found to be a significant contributor to financial inclusion, indicating that educated households are more likely to be financially included than illiterate households. Family size was also found to be a significant predictor of financial inclusion, with larger families being positively associated with financial inclusion. Gender was also identified as an important factor, with a significant p value. The negative beta value for gender suggests that males are negatively associated with financial inclusion. Additionally, distance from the bank and salaried occupation were found to be significant contributors to financial inclusion at a 10% significance level. This suggests that a greater distance from the bank is associated with a decline in financial inclusion. These findings are consistent with the results reported by Acharya (2013).
The results also indicate that financial inclusion increases with higher salaries. However, other variables such as age, different sources of occupation (such as agriculture, trade/business/profession), caste and household origin were not found to significantly predict financial inclusion. Previous studies and research reports (Dar & Ahmed, 2021; Ansar et al., 2018) have shown strong evidence for the impact of age on the level of financial inclusion. Therefore, the lack of significance of age in predicting financial inclusion at a detailed level may be a concern for researchers in this field. Caste and origin also do not appear to affect financial inclusion, perhaps due to the availability of financial products and business models across different caste groups and areas, which offsets their impact, making them insignificant factors. Similarly, other sources of occupation and self-employed households tend to rely more on cash transactions than account transactions, which makes them insignificant factors in predicting financial inclusion.
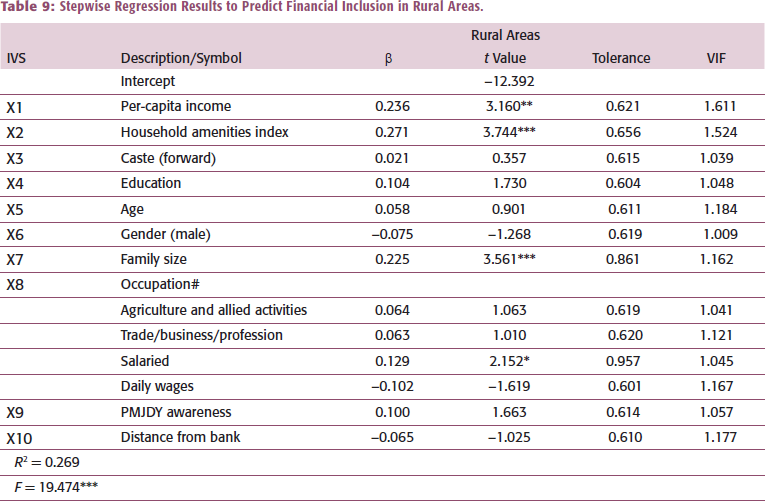
The study also examined whether the factors influencing financial inclusion are consistent across rural areas. A separate regression model was used to analyse this. Table 9 provides the regression summary, including beta coefficients and t-values for each predictor variable. The results of the stepwise regression for rural areas are particularly noteworthy. In rural areas, the R-square value in the final step indicates that four factors combined account for 27% of the variation in financial inclusion (F = 19.474/df = 213/3). Moreover, the stepwise results demonstrate that the model effectively predicts ‘financial inclusion’, as the p value is less than .05. The coefficients for the household amenities index and family size are the most significant predictors of financial inclusion. Both the household amenities index and family size have a positive and significant impact on financial inclusion, with a p value of less than .01. Additionally, per-capita income was found to be significant, with a positive influence on financial inclusion at a p value of less than .05. Furthermore, having a salary as a source of occupation was also significant, with a p value of less than .10. It is noteworthy that PMJDY awareness had a negligible impact in rural areas, suggesting that it has not significantly raised the level of financial inclusion. Lack of awareness about the benefits of PMJDY appears to be a major obstacle. It is recommended to enlist the support of local self-government entities to promote awareness.
Stepwise Regression Results to Predict Financial Inclusion in Rural Areas.
DISCUSSION AND POLICY IMPLICATIONS
The study conducted a comprehensive analysis of financial inclusion in sample villages of the Puri district of Odisha through a household survey. The findings showed that while the majority of households are financially included, a significant portion still experiences low to medium levels of financial inclusion. This raises concerns about the sustainability of financial inclusion efforts in the district, especially given the average socio-economic conditions. Though this is an interesting question, this study has not tried to fill this resource gap. The study identified several factors that influence financial inclusion at the micro level, including household amenities, per-capita income, awareness of the PMJDY, education, family size, distance from banks and gender. Notably, households with better amenities were found to be highly significant as a predictor variable. This confirms the observation that households owning a house and, more particularly a pucca house, electricity, better sanitation facilities, equipped with modern cooking fuel, safe drinking water facilities and asset holdings > ₹200,000 and so on, are more likely to be financially included. The findings suggest that the government should focus on improving household amenities and thereby the overall household quality to enhance financial inclusion. Additionally, the study highlighted the unequal income distribution among different quintiles of households. A more detailed analysis of factors such as household dependency ratio, household size, female-headed households and income sources was also proposed to inform targeted policy interventions. Despite progress in the penetration of financial services by banks and banking agencies, the usage of financial services remains a challenge in rural areas. The study pointed out the inadequate contribution of PMJDY awareness in rural areas and emphasized the need for improved adherence to government guidelines on promoting financial inclusion through PMJDY awareness. The bank officials and business correspondents persuade people to open accounts without spreading the benefits of keeping the account active, leading to a rise in dormant accounts and duplications. To a major extent, the failure of PMJDY is the outcome of the mishandling of data awareness by the bank officials and the local self-government machinery. The study also found that the occupation type and level of education influence financial inclusion, with salaried individuals and educated households showing higher levels of financial inclusion. Salaried people get their salary mostly into their bank accounts and are more likely to use other banking services. Thus, promoting cashless transactions, that is, mandatory payments through bank accounts in other occupations, may improve the financial inclusion status of the households.
It was observed that gender also plays a role, with more men ranking higher in financial inclusion overall, while in rural areas, more women rank higher in financial inclusion. This may be due to the saving prudence habits of rural women in particular. This finding could partially explain the success of some programmes and pilot projects such as self help group (SHG) for savings and loans that are targeted specifically at women in rural areas. However, the study noted that the sample size of rural women was limited, and therefore, caution is needed in interpreting this finding. Finally, the study highlighted the negative impact of distance from banks on financial inclusion and called for increased efforts from banks to expand their network and promote mobile banking and internet banking in unreached areas. Additionally, the study suggested that qualitative aspects such as respondents’ attitudes towards financial inclusion and the trustworthiness of banks should be considered in future research to further enhance the understanding of financial inclusion dynamics.
Footnotes
DECLARATION OF CONFLICTING INTERESTS
The author declared no potential conflicts of interest with respect to the research, authorship and/or publication of this article.
FUNDING
The author received no financial support for the research, authorship and/or publication of this article.
NOTES
e-mail: