
Abstract
In this paper, we illustrate the key improvement indicators, their performance variance, and their respective financial impacts on airline operations. Through the six sigma process improvement methodology (DMAIC), this paper presents the passengers’ expectations, current performance level, compensation expenses due to nonconformities, root causes of the nonconformities, and means to reduce performance variance and improve process to achieve cost savings. The research methods consist of data collection from several sources such as SITA, U.S. Aviation consumer reports, Aviation accident statistics from multiple sources. Our results indicate airlines can save billions of dollars annually once six sigma operational processes are reached.
Executive Summary
The purpose of the article is to investigate the financial and operational benefits when deploying six-sigma methodologies in airline operations. Specifically, it intends to improve the service operations of the airline industry. The six-sigma continuous improvement methodology, that is, define, measure, analysis, implementation and control (DMAIC), is used in this study. Six-sigma statistical analysis is used to measure the current performance of each critical metric involving the operational processes within international and US domestic airline industry. Using the six-sigma level or the current sigma level (whichever is higher) as the benchmarking tool, this article compares the compensation expenses caused by the variations in operational processes before and after the sigma level is achieved. We present a new approach to set an internal benchmark and determine the tolerance level when measuring airlines' (international and domestic) operational standards. The findings depict the difference between the current sigma level and the proposed six-sigma level for each critical metric. Through the six-sigma methodology, we provide an improvement in the following six critical passenger-defined quality metrics: accident rate, casualty rate, flight delay rate, flight cancellation rate, baggage irregularity rate and denied boarding rate. An analysis of the annual financial savings on each of the above operational metrics is presented. The aggregate annual savings obtained across all the critical metrics is in the order of billions of dollars. Lastly, the challenges of deploying six-sigma methodology and the underlying recommendations are discussed.
The number one rule of customer satisfaction is to close the gap between the customer’s expectations of service quality and the actual services received. To understand air passengers' perceptions and expectations, airline companies must capture the customer’s voice. The voice of the customer translates their needs, requirements, specifications, standards and criteria for quality of services. Air passengers' expectations go beyond simple air transportation service. They expect safe transportation, flawless customer service, accurate baggage handling, undisturbed flight schedules and less wait time in the airport. They can obtain travel options and airline services information from various sources on the Internet, finding not only air travel services that fulfil their needs but also high-quality airline services they were unfamiliar with. This makes them more selective and demanding. Therefore, in the airline industry, satisfying customers not only transforms companies' business models but also forces them to re-engineer their business processes.
The American Consumer Satisfaction Index (ACSI) reports that customer satisfaction is on the rise in most industries. However, the index of the airline industry has been decreasing in comparison with four other industries: hospitals, newspapers, full-service restaurants and computer software (Cook & Stephen, 2008). This decrease can be attributed to economic duress, fuel prices and deregulation of the US airline industry, all of which have forced airlines to cut operational and administrative costs while rapidly stretching out to new destinations to remain profitable. Airlines seem to give lower priority to customer satisfaction, even though customer satisfaction is positively correlated to revenues. They must translate customers' needs into quality services.
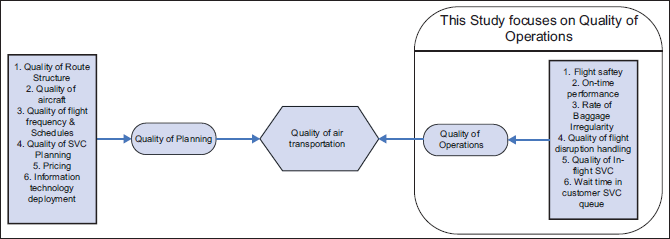
The methodology presented in this article focuses on improving passenger-defined quality of operations and can help airline management achieve significant cost savings if it is implemented. Figure 1 shows an overview of the factors that lead to high-quality air transportation, with the focus of this study highlighted.
Costs spent to retain and acquire customers are extensive; hence, air carriers must increase their market share while maintaining their loyal customer base. The decline in the customer satisfaction index should alert air carriers that the current operational processes and quality standards are unsatisfactory (Cook & Stephen, 2008). One way to raise the quality of service and improve financial performance is to reduce the variations in the operations process that are the root cause of external failure costs (e.g., loss of life, rework time, insurance payment costs and loss of goodwill).
The liability and compensation caused by external failure events are set in two agreements. The first is the Montreal Convention, which replaced the Warsaw Convention in June 2004 and applies to all international air carriers transporting passengers, baggage and cargo. It defines and regulates the monetary liability of air carriers for the death or injury of passengers and irregular baggage handling. The second is the European Regulation (EC) No. 261/2004, established in February 2004, which sets common rules for compensation and assistance to air passengers in the event of denied boarding, long flight delays and flight cancellation disputes.
While flight safety of both domestic (United States) and international airlines has reached the six-sigma level, airlines' operational areas are significantly below these levels. In this research, we illustrate that by providing six-sigma level services in these other areas, airlines could eliminate the extensive compensation they must pay per the Montreal and EC No. 261/2004 conventions. Through the six-sigma process improvement methodology, that is, define, measure, analyse, improve and control (DMAIC), we quantitatively show that the aggregate annual savings obtained can reach tens of billions of dollars. One of the authors had worked for Singapore Airlines, a major international airline, for more than six years at the time the study was conducted in 2010, and every attempt was made to ensure that the methodology and assumptions throughout this article are realistic by working with the management Singapore Airlines (both in the United States and Hong Kong).
Next, we present a detailed review of the literature on the quality of services for the airline industry and other industries.
LITERATURE REVIEW
Review of Six-sigma Methods in the Airline Industry
Psychogios and Tsironis (2012) provide an integrated framework for lean six sigma (LSS) in the airline industry. Baker (2013) examines service quality and customer satisfaction for the top 14 airlines in the United States between 2007 and 2011 to compare service quality and customer satisfaction with respect to airlines' quality dimensions and subsequently to detect the relationships between the dimensions of service quality and passengers' satisfaction. Wu and Cheng (2013) use a hierarchical model to improve the understanding of service quality in the airline industry through the development of conceptual frameworks and measurement scales. Chen and Hu (2013) conducted a quantitative analysis of data from surveys of individual passengers and concluded that service quality equates to positive effects on relational benefits and customer loyalty in the airline industry. Unlike prior research that modelled it exogenously, Greenfield (2014) examines the endogeneity of market structure to model service quality and competition and shows a three-fold improvement with this new modelling. Choi et al. (2015) utilize a service quality-adjusted data envelopment analysis (SQ-adjusted DEA) to examine US-based airline carrier operational efficiency and find that it is better suited to explore service productivity compared to the standard DEA. Woo (2019) studies four different types of consumer citizenship behaviour in the airline industry and suggests decomposing two dimensions of service quality (intangible and tangible resources of airline services) that indirectly affect consumer citizenship behaviour by way of perceived value. Gupta (2017) investigates service quality in the Indian aviation industry with respect to the attributes of tangibility, reliability, security, safety and ticket pricing and uses a best-worst method to rank and prioritize these attributes using VIKOR (a multi-criteria decision-making methodology) for all airlines in India.
Review of Six Sigma in Other Industries
There is significant literature on LSS in other industries. LSS is a process improvement methodology that has been shown to be a powerful management strategy across services. LSS strives to improve processes, focusing on both rapid and robust improvements like reducing waste and abnormalities in a given process. Sunder (2016a) highlights the importance of LSS in the banking industry by way of a real-time process improvement study. Sunder (2016b) analyses the success of LSS in banking and financial services industry and attempts to establish a methodical stakeholder management model for successful LSS project management. A two-phase methodology is used to understand the practical challenges faced by LSS project managers in banking and financial services, tying back to the existing literature and the possible opportunities for structured stakeholder management across different phases of the DMAIC project. Sunder et al. (2019) measure the significant success of six sigma in both manufacturing and services; illustrating the application of LSS in consumer banking in a real-time setting. They present five important managerial implications and demonstrate the relevance of LSS in consumer banks, which handle high volumes of data, customer bases and associated financial transactions.
Sunder et al. (2020) were the first to apply LSS to support design thinking in a mobile hospital setting, providing a case study of improving patients' satisfaction by reducing turnaround time. Their article adds to the body of knowledge about healthcare quality.
There is significant research on service quality in the healthcare industry. Leape et al. (2002) show what practices will most improve safety in their article on healthcare policy. Van Den Bos et. al (2011) use an actuarial approach to measure the frequency and costs of measurable US medical errors identified through medical claims data. Using mathematical models, they estimate the annual cost of measurable medical errors that harm patients to be $17.1 billion. Chiarini and Bracci (2013) test ways of using LSS in healthcare organizations and present several recommendations–be implemented by the physicians and healthcare managers.
Akpolat (2017) examines the application of six sigma in service and transactional environments, focusing on the knowledge needed for six-sigma methodology and presenting practical examples of six-sigma application. In essence, Akpolat’s goal is to provide the reader with some practical and useful guidelines for six-sigma applications. Psychogios et al. (2012) provide a multifactor application approach of lean six-sigma methodology in the telecommunication services industry.
Though there is significant literature on the use of six-sigma methodology in the service industries (including the airline industry), the research problem and approaches to the solutions investigated in this article have not been addressed in the literature before.
The research problem studied in this article is the financial and operational benefits of deploying six-sigma process improvement methodology (DMAIC) in airline operations. Specifically, we develop a methodology to improve six critical passenger-defined quality metrics: accident rate, casualty rate, flight delay rate, flight cancellation rate, baggage irregularity rate and denied boarding rate.
We use six-sigma statistical analysis to measure the current performance of each critical metric of the operational processes in the international and US domestic airline industry. Using six-sigma level or the current sigma level (whichever is higher) as the benchmarking tool, we compare the compensation expenses caused by the variations in operational processes before and after the sigma level is achieved. Using the DMAIC approach, we illustrate the key improvement indicators, their performance variance and their respective financial impacts on airline operations. We present passengers' expectations, current performance level, compensation expenses due to nonconformities, root causes of the nonconformities and means to reduce performance variance and improve processes to achieve cost savings. The data are collected from several sources such as SITA/Air Transport World, US aviation consumer reports and aviation accident statistics from multiple sources. We then provide an analysis of the annual financial savings for each of the above operational metrics and aggregate annual savings obtained across all the critical metrics.
SIX-SIGMA METHODOLOGIES
According to the Association for Operations Management (APICS, 2007), six-sigma methods are intended to enhance customer experience and increase profitability by reducing the number of defects caused by the variations in the operation processes until they approach statistical insignificance. To reach zero-defect operation, it must reach the sigma level that requires a nonconformity rate reduced to 3.4 defects per million opportunities (DPMO). To measure the gap between the current performance level and the six-sigma level, we use 3.4 DPMO as a benchmark. See Appendix 11 for details of this sigma computation model, the illustration of yield produced by various sigma levels, and some examples of the difference between three-sigma (3σ) and six-sigma (6σ) performance level capabilities. According to the American Society of Quality, in the context of the airline industry, a four-sigma level (4σ) is achieved for airline baggage handling, while a seven-sigma level (7σ) is achieved for domestic (US) airline fatality rates.
Using six sigma as a benchmark, we compare the compensation expenses at the current sigma operations with those at six-sigma operations. Opportunities for improvement in the airline industry include the number of departed flights, enplaned passengers, baggage handling and overall customer service.
To achieve six-sigma levels for airline operations, we implement the DMAIC approach. In the define phase, we model passengers' concerns in the air travel process. We then collect data to measure the current performance. In the analysis phase, we identify the gap between the target and the current levels and the annual savings with a six-sigma solution. In the improve phase, we present solutions using a cause-and-effect analysis. In the control phase, we suggest implementing the solutions to optimize operational efficiency.
DEFINE PHASE: AIR PASSENGER PERCEPTION AND OPERATION PROCESSES
In the define phase, we identify passengers' critical criteria for quality of operations. We first present the areas of concern to most air travellers and the expectations of improvement as the key performance indices. Subsequently, we provide the statistics for complaints from air travellers on US domestic and international (non-US) carriers. Unlike manufactured goods, airline services cannot be produced in advance and inspected before serving the passengers. In addition, the standard of service quality is subjective. Hence, we use the rate of unpleasant incidents as a measurement metric in this study. We then introduce the irregularity of air transportation services, and the liability of air carriers stated in the Montreal Convention and European Regulation (EC) No. 261/2004. Finally, we depict the current operational processes with process flowcharts and describe the hidden problems in those processes and flow charts. We provide a solution approach in the improve and control phases.
International Travellers
The results of a survey of 2,143 passengers (see SITA and ATW, 2008, p. 5) who were interviewed at six major international airports show that after price and flight schedules, the airline’s reputation, safety and punctuality are top criteria in the choice of an airline for international air travellers. There is a positive correlation between travellers’ expectations and the quality of airline operations. Further, the categories ranked 4, 5, 6, 8 and 9 in Table 1 pertain to quality operations and are of interest in this article.
Criteria for Choosing an Air Carrier by an International Traveller.
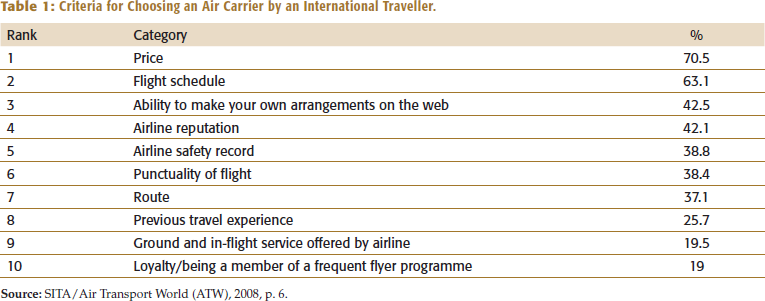
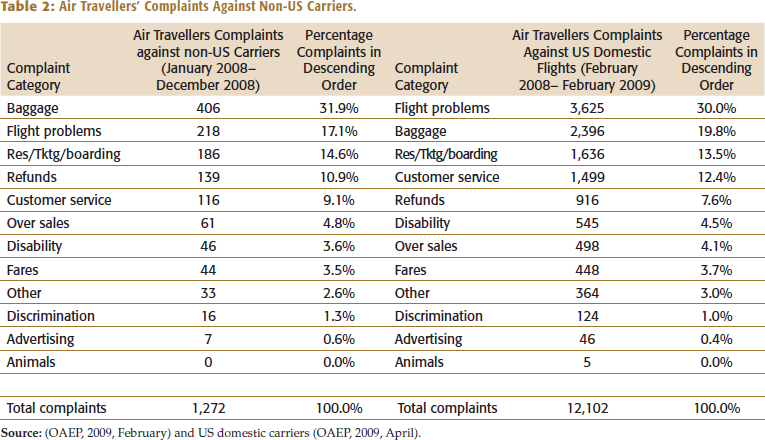
International travellers noted waiting time for checked baggage on arrival, the check-in process, and the in-flight experience to be the top unsatisfactory travel experiences (see SITA and ATW, 2008, p. 5). Complaints against international carriers about baggage irregularity ranked number one in the report compiled by the Aviation Consumer Protection Division (ACPD) of the US Department of Transportation’s Office of Aviation Enforcement and Proceedings (OAEP; see Table 2).
Air Travellers' Complaints Against Non-US Carriers.
US Domestic Travellers
According to the OAEP 2009, about 30% of the complaints of domestic travellers were attributed to flight problems that include cancellations, delays or other deviations from flight schedules, while 20% were attributed to baggage irregularities and 12% to customer service issues (see Table 2).
Steps of Air Transportation Services
To obtain a complete air transportation service, we assume that each air passenger goes through the seven major steps depicted in Figure 2.
Major Steps of Obtaining Air Transportation Services.

We illustrate each step using the flow charts in Figures 3–10. Detailed descriptions of the content in each of these figures can be found in Appendix 12.2
Ticket Reservation Process Map.
Check-in Process Map.
Check-In Baggage Handling.
Flight Disruption Process Map.
Boarding and Departure Process Map.
In-flight Service Process Map.
Flight Arrival Process Map.
Baggage Claim Process Map.
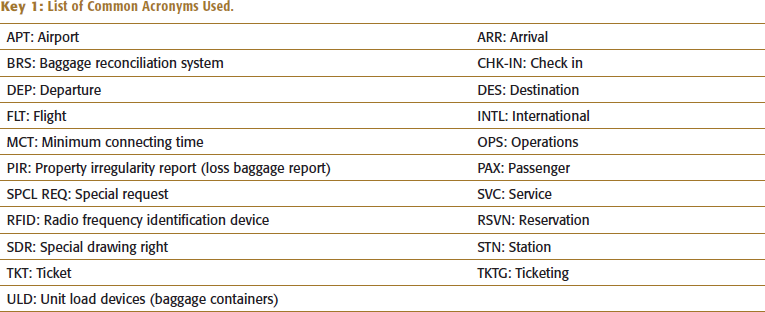
For convenience, we provide a list of common acronyms used in Figure 3 through 10 in Key 1.
List of Common Acronyms Used.
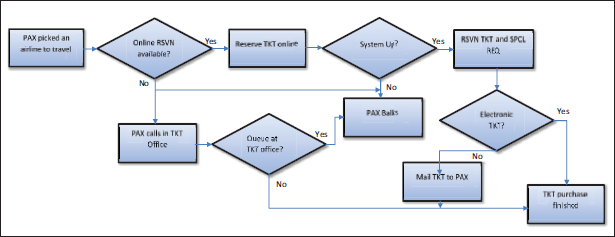
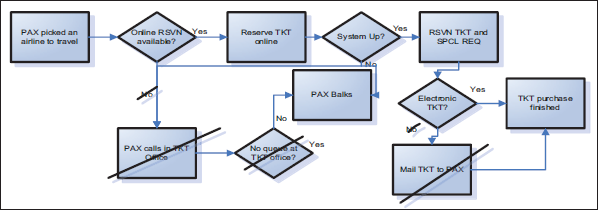
Step 1. Ticket Reservation Process
Figure 3 illustrates how air travellers reserve air tickets directly via an airline’s website or ticketing office.
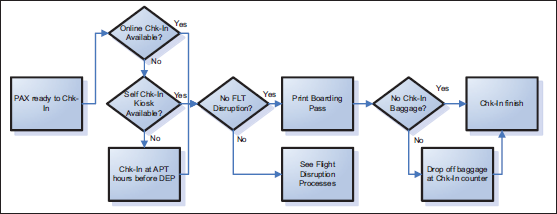
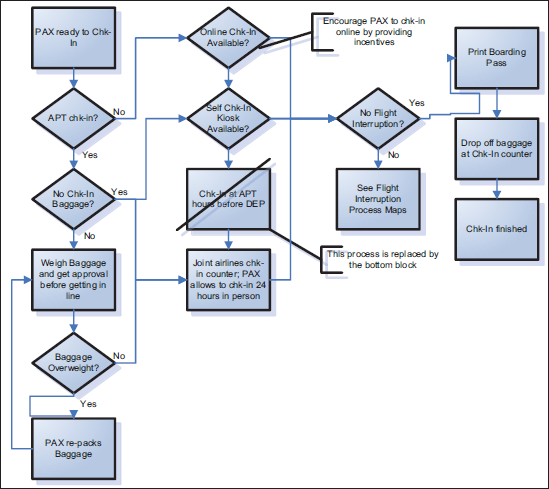
Step 2. Check-In Process
Figure 4 shows the general steps for air passenger check-in.
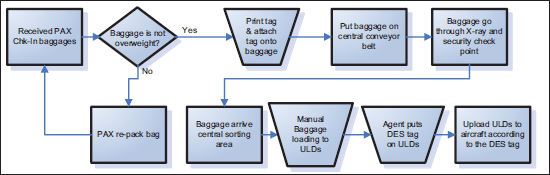
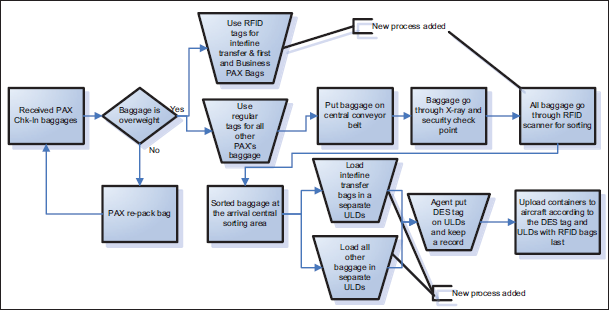
Step 3. Check-in Baggage Handling Process
Figure 5 shows the process baggage goes through before being loaded onto the aircraft.
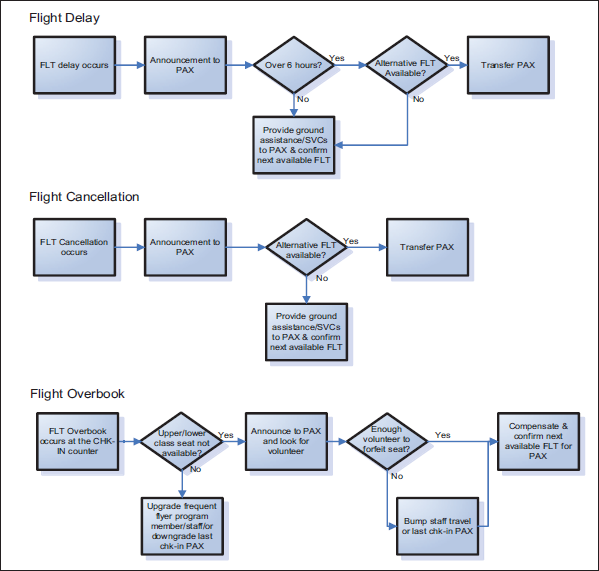
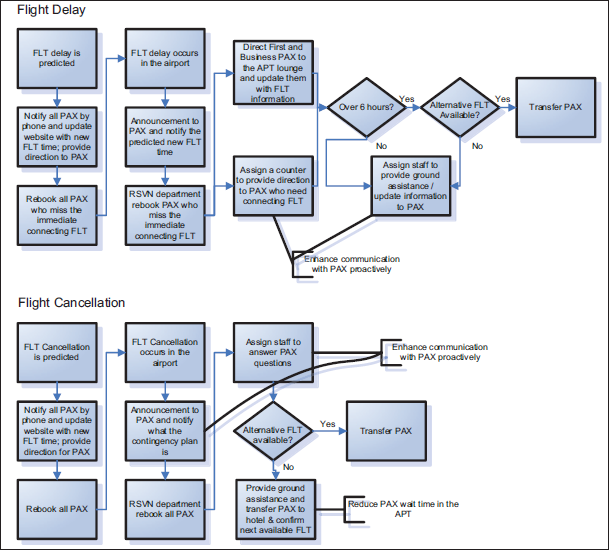
Step 4. Flight Disruption Process Map
Figure 6 shows the regular procedure a customer service team performs when flight delay, flight cancellation or flight overbooking occurs.
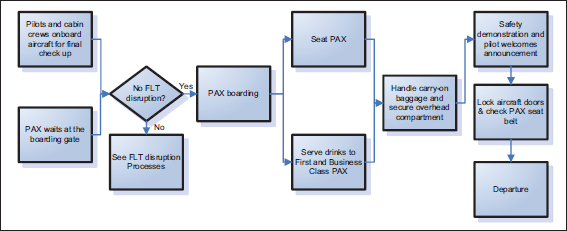
Step 5. Boarding and Departure Process
Figure 7 shows the typical boarding process for both international and domestic flights.
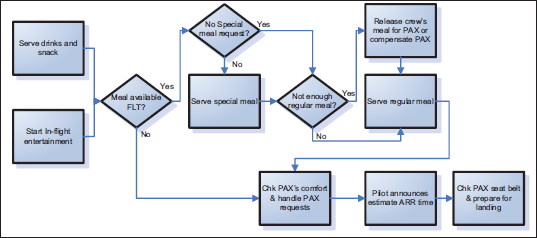
Step 6. In-flight Service Process
Figure 8 shows the major operational steps during flying time.
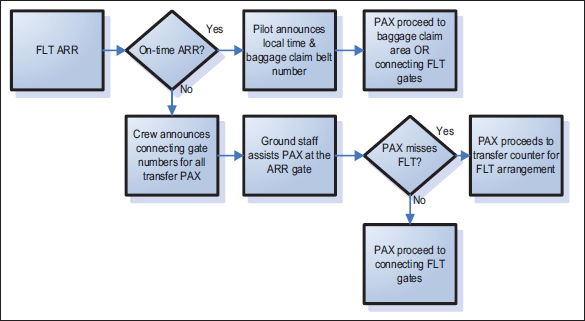
Step 7. Flight Arrival Process
Once an aircraft has safely landed at the destination, airline operators perform the processes shown in Figure 9.
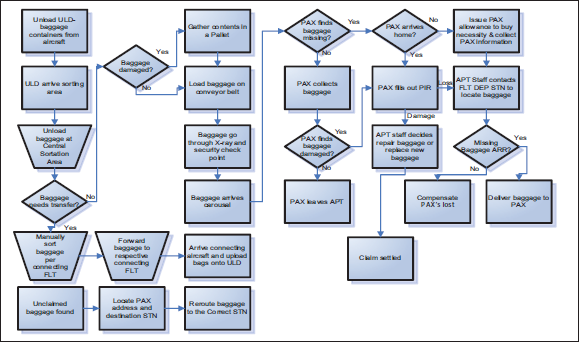
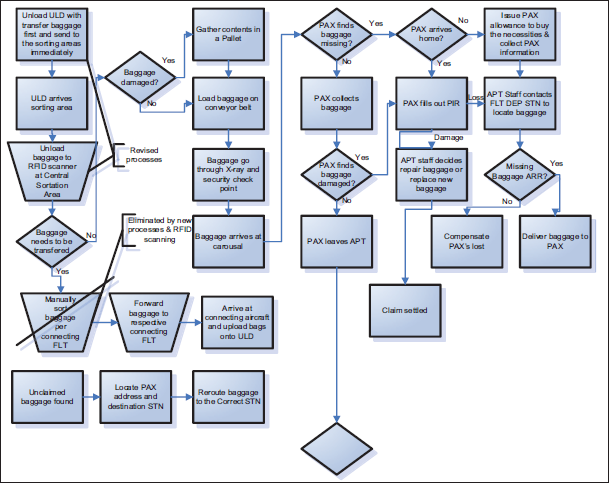
Step 8. Baggage Claim Process
Figure 10 shows all the major scenarios during the baggage claim process. This is the reverse of the baggage-loading process.
When we present the improve and control phases of the methodology, we will review all the process flow charts discussed above (Figures 3–10) and suggest changes and improvements in the current process for all seven of the major steps in air transportation services.
MEASURE PHASE: CURRENT PERFORMANCE OVERVIEW AND FAILURE COSTS
This section presents the current performance of airline operations based on the six-sigma methodologies. After evaluating the current performance, we compute the annual monetary compensations of the external failure rates based on the provisions in the Montreal Convention, European Regulations (EC) 261/2004, and US airline practices.
Analysis of Current Sigma Levels of Critical Airline Operations
We present an evaluation of the current performance across six critical criteria: rate of accidents, casualties, flight delays, flight cancellations, baggage irregularities and denied boarding. Using the formula presented earlier and averaging the performance measures of the best-in-class industry average and underperforming air carriers from different regions of the world, we found that sigma levels for these six criteria lie between 2.36 sigma and 6.48 sigma (for more details, refer to Appendix 2).3)
Airline Performance: International and US Domestic Carriers.
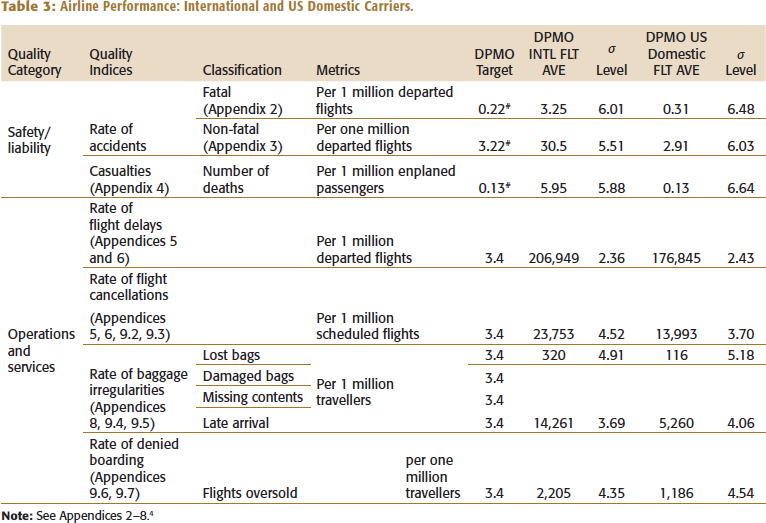
The rate of fatal accidents shown in Table 3 is based on the number of accidents that cause passenger deaths per one million departed flights. The actual number of passenger deaths in an accident does not affect the calculation of the rate. On the other hand, the rate of casualties is based on the number of passenger deaths per one million enplaned passengers. Since data on non-fatal accidents for international flights are not available, the rate of non-fatal accidents for international flights in Table 3 is calculated from the ratio of the international fatal accident rate to the US domestic fatal accident rate. The rate of non-fatal accidents for international flights (DPMO INTL FLT AVE) is calculated as follows: (International fatal accident rate/US domestic fatal accident rate): (3.25/0.31) = 10.48. The rate of non-fatal accident in international flights is then given by 10.48 × 2.91 = 30.5, where 2.91 is the US domestic carrier performance.
The rate of lost baggage for US domestic flights (DPMO US Domestic FLT AVE) is calculated as follows: We first calculate the ratio of (International lost baggage/International mishandled baggage): 320/14,261 = 0.022. The rate of lost baggage for US domestic flights is then given by 0.022 × 5,260 = 116.
The rate of denied boarding of international flights (DPMO INTL FLT AVE) is calculated as follows: We first calculate the average of: (International flight delay/US domestic flight delay) + (International flight cancellation/US domestic flight cancellation) + (International mishandled baggage/US domestic mishandled baggage): ((206,949/176,845) + (23,753/13,993) + (14,261/5,260))/3 = 1.859. The rate of denied boarding of international flight is then obtained as 1.859 × 1,186 = 2,205, where 1,186 is the US domestic carrier performance.
Monetary Compensation for Nonconformity Operations
In this subsection, we show how the sigma levels translate to the financial deficiency of airline operations. We only consider the upfront compensation to travellers from the airline. All other external failure costs such as the total loss of an aircraft, administrative costs, lost goodwill, loss of sales and labour hours for rework are not considered. The compensation values shown in Table 4 are based on the maximum financial liabilities and compensation for damage as stated in the Montreal Convention Provisions of Treaties and EC No. 261/2004. Due to local consumer laws and exemptions, compensation values suggested in Table 4 may vary in different countries and are adjusted based on individual situations. All values presented in Table 4 are in US dollars.
Monetary Compensation for Nonconformity Operations.
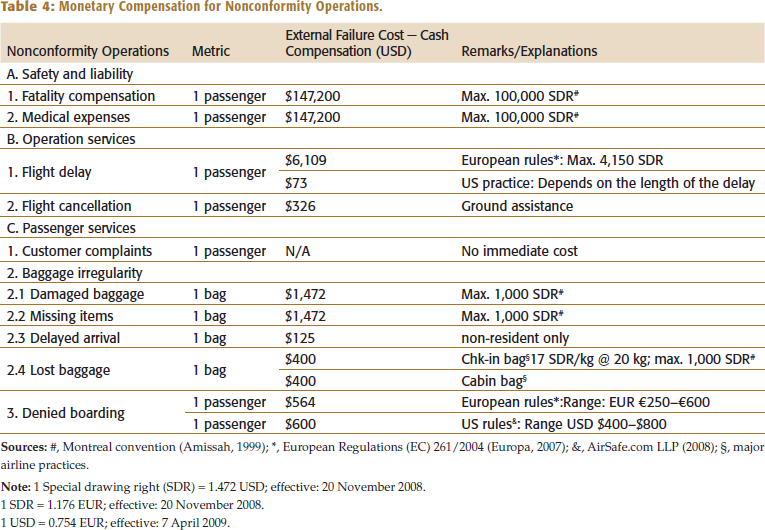
1 SDR = 1.176 EUR; effective: 20 November 2008.
1 USD = 0.754 EUR; effective: 7 April 2009.
For a flight delay, an example of cash compensation for a full Boeing 744 aircraft with 14 passenger seats in first class, 58 passenger seats in business class and 379 passenger seats in economy class is calculated as follows:
For a flight cancellation, the cash compensation is calculated as follows:
ANALYSIS PHASE: FINANCIAL BENEFITS IN SIX-SIGMA OPERATIONS
In this section, we identify the gap between the target-level and the current performance-level compensation expenses and show how the sigma levels translate to the financial deficiency of airline operations as well as the annual savings obtained with a six-sigma solution. We only consider the upfront compensation to travellers from the airline. All other external failure costs such as the total loss of an aircraft, administrative, goodwill, loss of sales and labour hours for rework are not considered. Table 5 presents the data.
Annual Compensation for External Failure Events Based on Current Performance, Six-sigma Level Performance and Resulting Annual Gross Compensation Savings.
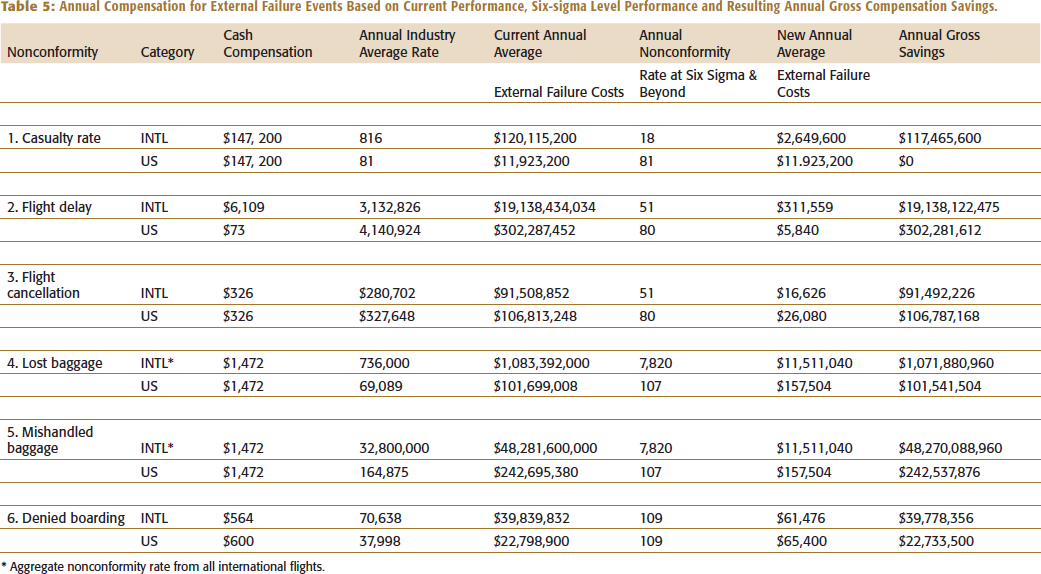
* Aggregate nonconformity rate from all international flights.
Annual Compensation Expenses at Current Performance Level
Table 5 shows the annual failure costs of an individual airline carrier when external failure events occur. The costs are computed based on the current nonconformity rates shown in Table 3 (refer to Appendix 95 for calculations) and the cash compensation described in Table 4. The fifth column in Table 5, current annual average external failure costs, is the product of cash compensation and annual industry average rate. The compensation amounts for mishandled baggage and denied boarding for international carriers are aggregate numbers across all sample air carriers.
Annual Compensation Expenses at Six-Sigma Capability
Table 5 also shows the new annual failure cost for an air carrier when it operates at the six-sigma level (see Appendix 106 for details). The seventh column in Table 5, new annual average external failure costs, is the product of cash compensation and annual nonconformity rate at six sigma and beyond.
Annual Savings on Compensation Expenses
Table 5 also illustrates that an air carrier can save as much as $19 billion annually on in-flight delays and as much as $1.2 million annually in denied boarding compensation if it operates at a six-sigma level. The eighth column in Table 5, annual gross savings, is the difference between current annual average external failure costs − new annual average external failure costs.
IMPROVE AND CONTROL PHASES: CAUSES OF OPERATIONAL DISRUPTION AND SUGGESTED SOLUTION IMPLEMENTATION
The improve and control phases are presented together in this section as it is convenient to analyse the cause and present the solution immediately. In the improve phase, an analysis of the critical factors and solutions is presented using a cause-and-effect analysis. In the control phase, we suggest implementing the solutions to optimize operational efficiency. Since this study focuses on the financial benefits of deploying six-sigma methodologies, we provide an overview of the potential causes of each type of operational disruption and suggest implementing the solutions following it.
Cause-and-effect and Solutions
We categorize the causes into five categories: people, process/methods, machines, material/information and external/environment as shown in Figure 11.
Causes of Flight Accidents.
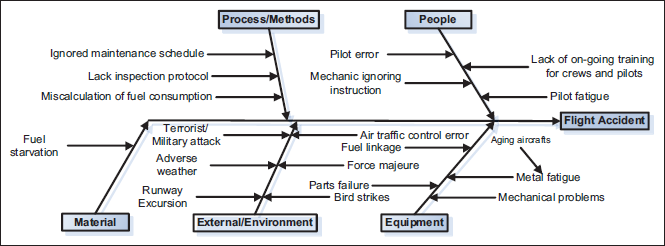
Flight Accidents
Accident Statistics (2019) provides information on the causes of fatal accidents by decade. According to Accident Statistics (2019), 50% of fatal accidents can be attributed to pilot error. Other prominent causes are mechanical failure (22%), weather-related factors (12%) and human error (7%). Refer to Appendix 117 for details. Though human error cannot be entirely eliminated, it is the most critical factor in airline safety performance that is manageable by airline companies. Table 6 shows the suggested solutions to correct the three major causes of fatal accidents and compares the new casualty rate with the current performance. The data are extrapolated from the annual industry average rates in Table 4.
Annual Casualty Reduction.
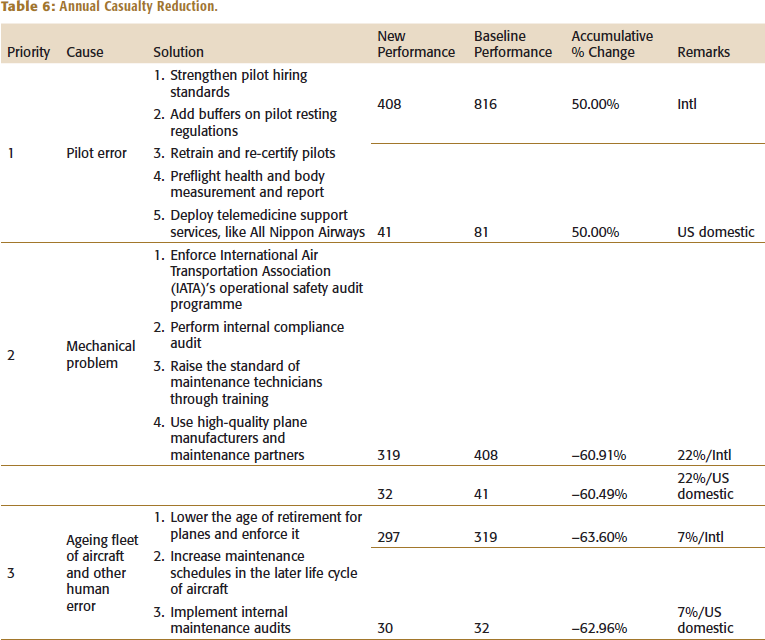
If pilot errors are alleviated, the new casualty rate could be reduced by 50%. After implementing solutions to address the mechanical problems and human errors, the total annual casualty rate can be reduced by 63%.
Some other suggestions include: (a) Increase pilot and aircraft maintenance technician hiring standards and revise training materials to address emergency handling and ethical issues. (b) Add time buffers on pilot resting regulations (c) Set up an internal self-audit reporting system to monitor stations' compliance performance (Singapore Airlines deploys this). (d) Increase compliance auditing schedule for all stations. (e) Retrain and re-certify pilots and maintenance technicians. (f) Select high-quality plane manufacturers and maintenance partners, like Boeing Aerospace support that received the Malcolm Baldrige National Quality Award. (g) Initiate self-report and self-auditing system to promote high standards of safety (All Nippon Airways deploy this). (h) Enforce IATA’s Operational Safety Audit Program. (i) Keep and enforce fleet retirement schedule, so that the fuel-efficient aircraft that are equipped with advanced technologies—Airbus A380 is recorded to consume 20% less fuel than a Boeing 747 on a seat-mile basis (All Nippon Airways and Singapore Airlines deploy this).
Flight Delay or Cancellation
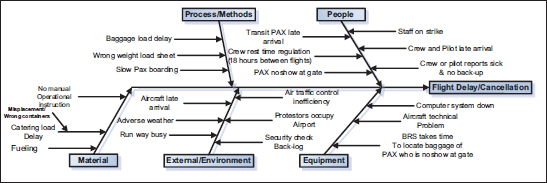
Based on delay reports from seven major US airlines to the US Bureau of Transportation, 28.5% of flight delays are attributed to internal factors (airline operations). Other major contributors to delays are aircraft arrival delays (37.7%) and national aviation system delays (27.9%). Extreme weather conditions (5.6%) and security delays (0.3%) are additional contributing causes. Figure 12 suggests that the causes of delays are: the late arrival of transfer passengers and their baggage, unloading the baggage of ‘no-show’ passengers, maintenance and crew-related problems. Table 7 provides some solutions to reduce the delay rates and a comparison of the new and baseline annual flight delays.
Causes of Flight Delays.
Annual Flight Delay Reduction.
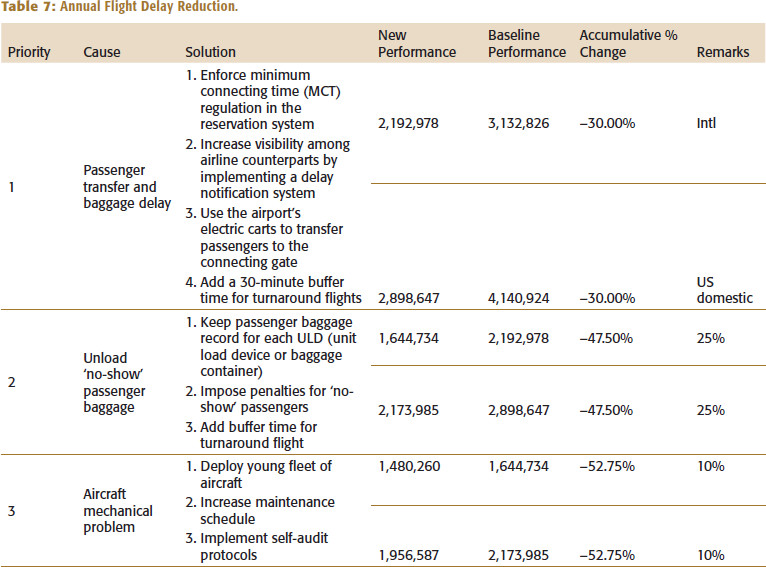
Table 7 shows that if the underlying causes of flight delays (transfer passengers and baggage delays) are alleviated, the annual flight delays caused by air carrier factors can be reduced by 30%. With a 25% improvement in unloading no-show passengers’ baggage and a 10% improvement in addressing mechanical problems, the annual flight delay rate caused by air carrier internal factors can be reduced by 53%.
Some other suggestions include: (a) Add cabin crews reporting time buffers. (b) Coordinate airport electric carts to convey delayed passengers to their connecting flight gate. (c) Educate passengers about the importance of on-time boarding. (d) Enforce on-time boarding and penalize passengers who are no show at gate. (e) Increase communication with labour unions to avoid strikes. (f) Notify partner airlines in advance to assist delayed passengers in baggage and in-person transfers.
Denied Boarding Caused by Overbooked Flight
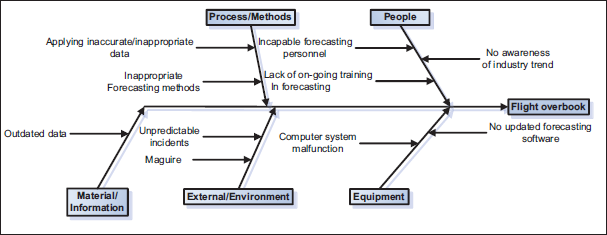
Although flight overbooking is normal practice to mitigate the ‘no-show’ rate, it is risky and costly if the ‘no-show’ rate forecasting is not standardized. Figure 13 shows the potential causes of denied boarding. Table 8 provides suggestions to reduce the denied boarding rate.
Causes of Flight Overbooking.
Reduction of Annual Denied Boarding Rate.
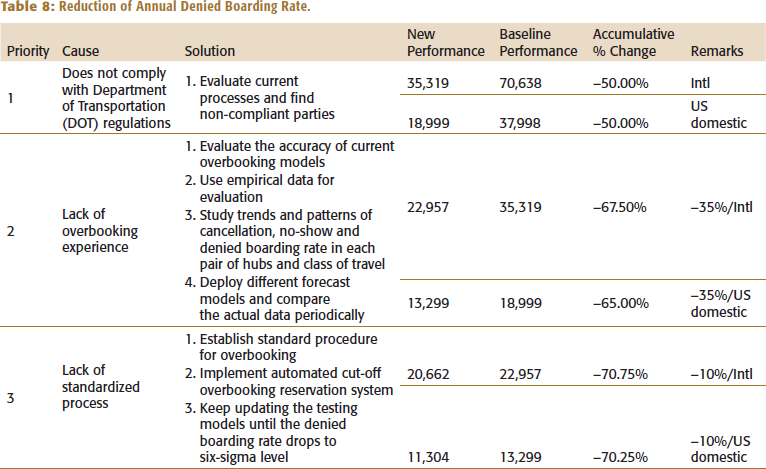
In Table 8, we show the hypothetical reduction rate of denied boarding with suggested solutions. If air carriers follow the regulations set forth by the US Department of Transportation (DOT), the rate of denied boarding will be reduced by approximately 50%. Deploying various forecasting models, standardizing overbooking practices and comparing data provided by their counterparts could reduce the annual rate of denied boarding by 70%. Although overbooking forecasts are estimates, the rate of denied boarding is comparatively easy to improve in order to reach six-sigma levels. Based on past empirical data, air carriers could study passengers’ cancellations, ‘no-shows’ and flight overbooking to reduce the rate of denied boarding to achieve six-sigma levels.
Some other suggestions include: (a) Train flight sales planners in sales forecasting techniques. (b) Hire experience sales forecasting experts and promote a mentorship programme to train newly employed forecast planners. (c) Perform internal audit for oversold practice compliance. (d) Retrain and monitor flight sales forecast planners. (e) Assign staff to provide immediate personalized assistance for all denied boarding passengers.
Queue at Check-in Counter and Ticketing Office
Figure 14 shows the main causes of long wait times for customer service in the airport.
Causes of Long Queues at Customer Services.
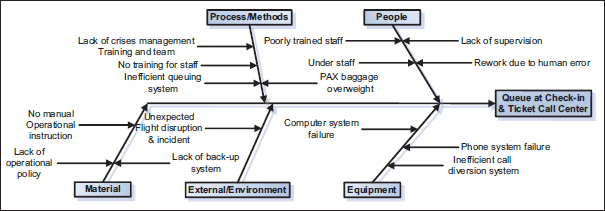
The main reasons for long queues at the customer service counters are understaffing, poorly trained staff and equipment/software failure. To resolve these problems, we propose that airline companies cut down the number of reservation and ticketing offices and transition to an automated reservation and electronic ticketing operation (see Figure 15). Most of these transactions are done via online systems or are outsourced to online or brick-and-mortar travel agencies. We also suggest that global alliance partners cross-train a team of customer service staff to handle different check-in systems. That pool of staff could serve as a buffer for all airlines within the alliance group. Moreover, airline companies should encourage passengers to check in online (see Figure 16); some check-in counters are available for all flights as early as 24 hours before departure. We predict that check-in time could be reduced by 80% if these solutions are deployed.
Some other suggestions include: (a) Promote a mentorship programme to provide continuous on-the-job training (deployed by Singapore Airlines). (b) Create staff buffers: a backup staff work schedule and on-call part-time workers list.
A list of common acronyms used in Figures 15–20 has been mentioned earlier in the article in the key before Figure 3.
New Ticket Reservation Process Map.
New Check-in Process Map.
Passenger Complaints About Customer Service
Figure 17 shows common customer complaints related to customer service.
Causes of Passenger Complaints in Customer Services.
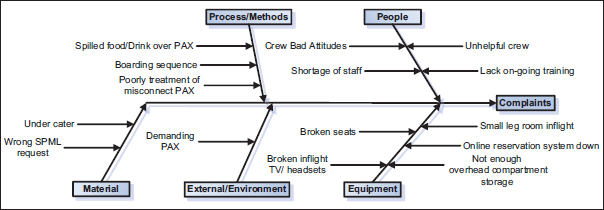
Complaints about unhelpful employees occur in various operational areas. Many travellers complain about being unattended during flight disruption because of miscommunication between airlines and passengers. Air carriers must take proactive steps to communicate with passengers and provide immediate assistance. We suggest some steps that could be added to the current flight disruption processes in Figure 18. In addition, extra training for all frontline staff in cultural awareness, interpersonal communication skills and customer psychology will improve the process. Airline companies should empower their employees and provide them with clear compliance guidelines. If the employees follow these steps, customer complaints could be significantly reduced.
New Flight Interruption Process Map.
Baggage Handling Irregularity
Figure 19 illustrates many causes of baggage irregularities, including lost and mishandled luggage.
Causes of Baggage Handling Irregularity.
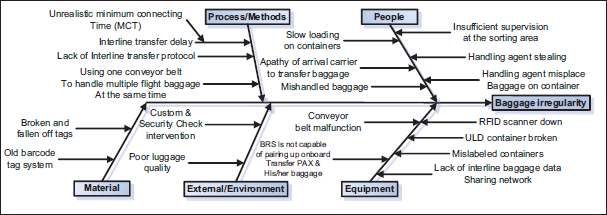
Infosys reports that 58% of mishandled baggage is due to interline transfers, that is, baggage transferred from one carrier to another during transit (Pandit, 2007, p. 6), and 30% of mishandled baggage was lost in multisector/multi-airline journeys, that is, passengers travelling within multiple sectors operated by multiple air carriers (Pandit, 2007, p. 3). The other causes of mishandled baggage according to SITA (2009) are loading and ticketing errors (16% of lost baggage) along with switched baggage (13% of lost baggage). Table 9 shows some ways to alleviate this problem and reduce the annual rates of mishandled baggage.
Reduction of Annual Rate of Mishandled Baggage Reduction Rate.
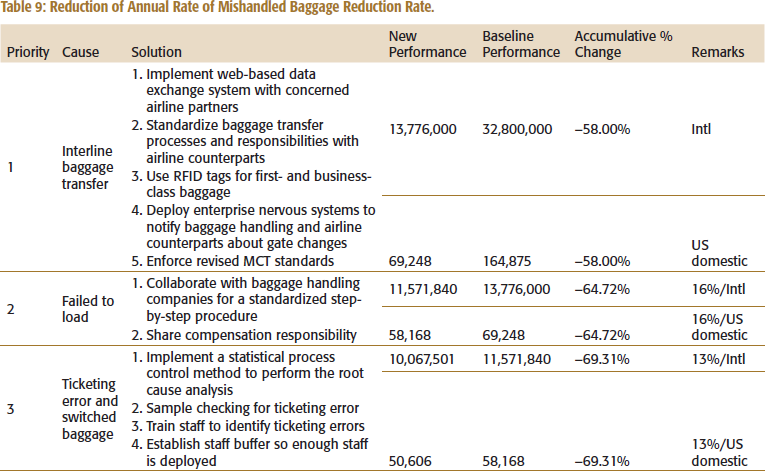
In particular, we suggest deploying advanced technologies and process re-engineering to rectify the interline baggage transfer problem. If the causes of mishandled baggage are corrected, it can be reduced by 58%. After implementing the other solutions suggested here like alleviating the ticketing errors, the total annual mishandled baggage rate can be reduced by 69% from the current performance level. Figures 20 and 21 show a suggested process with RFID tags implemented.
New Check-in Baggage Handling Process Map.
New Baggage Arrival Process Map.
Some other suggestions include: (a) Set up an internal quality improvement team to perform statistical process control assessment to monitor the variations continuously. (b) Set up a quality improvement team that involves personnel from baggage handling company and partner air carriers to audit and establish step-by-step baggage transfer processes. (c) Perform periodic and unexpected compliance audits of baggage handling agents. (d) Set up a penalty system for baggage handling companies to promote correct baggage handling processes. (e) Educate passengers to check in early and avoid oversized carry-on baggage that is forced to check-in at the boarding gate. (f) Set up compensation-sharing policies among operating carriers and baggage-handling companies.
CHALLENGES IN DEPLOYING SIX-SIGMA PROJECTS
We identified three main challenges to six-sigma implementation in airline operations: resource constraints, human factors and external factors.
Resource Constraints and Suggestions
1. Initial investment for staff training, six-sigma personnel acquisition, process re-engineering and equipment acquisition are required to initiate a six-sigma project. Oliver Wight (2000, p. 71) suggests that airline companies maintain a reference library containing published materials, educational videos, computer-aided instruction material, reference manuals and other supporting material to assist staff with their continuous skill development. This helps reduce training expenses and time. Equipment and technology infrastructure should be selected based on their contribution to improved quality, fast changeover and overall throughput time. Airline companies can reduce the cost of equipment and technology acquisition by sharing them with partner airline companies or local airport authorities.
2. Qualified six-sigma–trained personnel should be assigned to multiple projects, while other operational personnel could be engaged in different process improvement projects in addition to their routine responsibilities. For personnel-related constraints, airline companies may consider functional outsourcing or hiring temporary six-sigma practitioners to implement a six-sigma project. To mitigate risks, airline leadership must focus on solving one operational problem at a time and consider performing pilot programmes in the base station.
3. Six-sigma quality control projects and capital acquisition projects compete to obtain funding. A six-sigma project may not be successful due to the significant initial investment and uncertainty about the resulting improvement in quality. Airline top management teams must set a clear goal and a separate budget for quality improvement projects. Since the benefits of quality improvement seem intangible to some stakeholders and laypersons, translating improvement results into measurable deliverables using a six-sigma benchmarking study helps them see the financial benefits of implementing a six-sigma project.
Human Factor Challenges and Suggestions
4. In addition to providing a financial commitment to a six-sigma project, top management should play an active role while the project management team executes the project. Top management leadership must develop mechanisms to reflect external and internal customer needs and expectations regularly. Encouraging contributions from all stakeholders is the key to building ownership of the project. The management team needs to communicate with internal and external customers routinely to promote six-sigma projects and encourage feedback.
5. Line managers may be resistant to cooperating with six-sigma project managers since they fear a loss of leadership role and position. The functions, responsibilities, mission, scopes and operating guidelines of each team must be clearly defined and introduced to all teams. Oliver Wight (2000, p. 37) recommends that corporations develop three types of teams: (a) lead teams that oversee inter-functional project team activities, (b) project teams comprised of technical and subject matter experts to work on specific inter-functional projects, and (c) process teams (six-sigma project teams) that are responsible for improving the performance of the entire business processes. Line supervisors and managers should be held accountable for administering the change in the process.
6. Lower-level employees are resistant to change because of fears of loss of employment or extra workload. Therefore, they may not cooperate with the execution plan and instead provide inaccurate data and dishonest perspectives about the current processes. To help employees overcome this hurdle, the goal of employment continuity should be clearly articulated to staff members. Key performance indicators (KPIs) and performance scorecards should be used to measure success while data are collected by multiple testing systems. Change management must be in place before the project starts. Employees throughout the company may need to be redeployed based on their aptitudes, skills and capabilities to support the new processes. Managers should also encourage feedback from staff related to customer needs and process improvements.
External Factor Challenges and Suggestions
7. Deregulation of the US domestic airline industry has forced air carriers to take shortcut methods to make a quick return on investment. It is difficult to convince air carriers to form a consortium to create standardized operational procedures.
8. There is a lack of transparency and collaboration between international airline carriers, airplane manufacturers and airplane parts suppliers. Due to the competitive characteristics of these industries, most airline companies work independently and must collaborate with other air carriers.
9. Varying technology infrastructures and standards, different local laws and regulations, and changing demand levels discourage international airline companies from investing in quality improvement programmes overseas.
External challenges are difficult to overcome. However, airline companies can start by establishing six-sigma programmes in collaboration with their global alliance partners and promoting these programmes in international air carriers’ consortiums like the IATA or the United Nations’ International Civil Aviation Organization (ICAO). Airlines that implement successful six-sigma pilot programmes at their base stations could become role models to their global counterparts, assuring that customer-focused operations are profitable and beneficial.
DISCUSSION AND CONCLUSIONS
The purpose of this article is to investigate the financial and operational benefits of deploying six-sigma methodologies in airline operations. Specifically, it intends to improve the service operations of the airline industry. The six-sigma continuous improvement methodology, DMAIC, is used in this study. Six-sigma statistical analysis is used to measure the current performance of each critical metric involving the operational processes of the international and US domestic airline industries. Using the six-sigma level or the current sigma level (whichever is higher) as the benchmarking tool, this article compares the compensation expenses caused by the variations in operational processes before and after the sigma level is achieved. We present a new approach to set an internal benchmark and determine the tolerance level when measuring airlines’ operational standards. The findings depict the difference between the current sigma level and the proposed six-sigma level for each critical metric. The aggregate annual savings obtained across all the critical metrics is in the order of billions of dollars.
The six-sigma DMAIC methodology presented in this article can be extended to other service industries such as healthcare. The research on the quality of service applied to the healthcare industry shows that the approaches to measure the frequency and costs of medical errors as identified through medical claims data are estimated to be $17.1 billion per year in the United States alone. The practices to be followed by physicians, healthcare managers and hospitals to reduce these medical errors and thus save significant costs to the healthcare industry can be identified and then implemented using the six-sigma methodology.
There is significant research in applying six-sigma methodology to other service industries such as consumer banking and telecommunications. A topic for future research in this area is to conduct a comparative analysis between our methodology and the methods in the literature.
Six-sigma methodologies are a continuous improvement process that can help air carriers to set a baseline for the performance of their internal operations. If all airline companies start using six sigma as a benchmark to measure performance, six-sigma methods will become a global standard for evaluating the efficiency of airline operations. Although the initial investment may be large, the airline industry will see significant financial benefits from a long-term financial perspective as demonstrated in this article. The airline industry is highly competitive; therefore, airline companies must seek and implement the best operational practices. The suggested process improvement procedures can help managers achieve the six-sigma levels for each operation.
One of the authors of this article has worked for more than six years at Singapore Airlines. The methodology and assumptions in this article were shared with managers at Singapore Airlines (both in the United States and overseas) to ensure they are realistic. A future extension to this work is to include the cost of the six-sigma implementations recommended in this article at a specific airline company and discuss the successes and limitations of such implementation.
APPENDIX
The appendix is detailed and extensive. Therefore, it is hosted with all data and tables on the website,
Footnotes
ACKNOWLEDGEMENTS
The first author, Ramesh Bollapragada, thanks several of his students (Sandra Laudoniu, Victoria Lopez and Elena Seynova) at the College of Business, San Francisco State University for providing research assistance at various stages of this work.
DECLARATION OF CONFLICTING INTERESTS
The authors declared no potential conflicts of interest with respect to the research, authorship and/or publication of this article.
FUNDING
The authors received no financial support for the research, authorship and/or publication of this article.
Notes
e-mail:
e-mail: