
Abstract
Executive Summary
Predicting stock trends in the financial market is always demanding but satisfying as well. With the growing power of computing and the recent development of graphics processing unit and tensor processing unit, analysts and researchers are applying advanced techniques such as machine learning techniques more and more to predict stock price trends. In recent years, researchers have developed several algorithms to predict stock trends. To assist investors interested in investing in the stock market, preferably for a short period, it has become necessary to review research papers dealing on machine learning and analyse the importance of their findings in the context of how stock price trends generate trading signals. In this article, to achieve the stated task, authors scrutinized more than 50 research papers focusing on various machine learning algorithms with varied levels of input variables and found that though the performance of models measured by root-mean-square error (RMSE) for regression and accuracy score for classification models varied greatly, long short-term memory (LSTM) model displayed higher accuracy amongst the machine and deep learning models reviewed. However, reinforcement learning algorithm performance measured by profitability and Sharpe ratio outperformed all. In general, traders can maximize their profits by using machine learning instead of using technical analysis. Technical analysis is very easy to implement, but the profit based on it can vanish too soon or making a profit using technical analysis is almost difficult because of its simplicity. Hence, studying machine, deep and reinforcement learning algorithms is vital for traders and investors. These findings were based on the literature review consolidated in the result section.
Keywords
Furthermore, with information technology and advancement in computing skills, traders began to apply computer programming skills to automate the trading strategy. This helped generate profits even in cases where trading signals occurred for a brief period. This is called algorithmic trading. In algorithmic trading, buying and selling occur through a script such as Python whenever backtesting conditions are fulfilled. Generally, tracking stock prices is difficult as it does not follow a specific pattern or changes patterns frequently. A current strategy can become obsolete in no time. Hence there is always a demand for research in the trading field to exploit the stock market. Recently, computer science and mathematics researchers have taken an interest in artificial intelligence to generate trading signals, and they have progressed exponentially in developing a trading strategy. Artificial intelligence (AI), a very challenging and demanding skill set, is drastically evolving and is in widespread use in the financial market and big data. Technically, AI is a superset of machine learning (ML), and machine learning is a superset of deep learning (DL). In this study, the authors consider machine, deep and reinforcement learning, but as a general practice, these are referred to collectively as machine learning. Hence, the same reference is used in this study. Thus, examining the importance of machine learning is necessary in the context of the stock market for generating trading signals.
Despite the beauty of the machine learning models, they suffer from several biases. In a supervised machine learning model, the motive is to predict the target variable while optimizing the loss function. In a regression problem, the loss function is generally mean squared error, and in a classification problem, the loss function is typically some form of accuracy score. This prediction error is decomposed into bias, variance and irreducible error. Bias indicates an error during the training phase, and variance indicates an error during the test phase. While the under-fitting model has high bias and high variance, the overfitting model has low bias and high variance. In general, when we increase the biases or variance, the other will decrease; this is called bias-variance trade-off. The one way to reduce variance is to reduce the number of weights or the number of predictors, but the bias will increase. In practice, we need models with low bias and low variance. Furthermore, such prediction error is due to several other inherent biases.
Lim (2020) emphasized some of the biases. A sample bias is induced when the data set does not represent the reality of the environment in which the model will run. A measurement bias is induced when data collected for training differs significantly from the real world because of the faulty measurement used. An exclusion bias arises during the data pre-processing stage by deleting valuable data believed to be unimportant. A recall bias occurs when labelling similar types of data inconsistently. A confirmation bias occurs when too much emphasis is laid on data that confirm your belief. Baer and Kamalnath (2017) explained some of the other biases. For instance, the problem of stability bias is that the predictive models work on detecting patterns on historical data. This bias assumes history speaks about the future. If the pattern ceases to exist or does not repeat, the models will not predict as expected. The anchoring bias keeps holding on to old information even when there is a remarkable change in information. The availability bias to base decisions on information that is readily available or easily recallable.
RESEARCH QUESTIONS
The eventual objective of this study is to evaluate the efficiency of machine learning algorithms in making investment decisions in the stock market by answering the following questions:
What are the performance highlights of various machine learning algorithms? How important are feature variables such as stock price, trading volume, investors’ sentiments and news articles in building machine learning algorithms? Do technical indicators also play an important role in building machine learning algorithms?
RESEARCH OBJECTIVES
To proceed with answering the above research questions, we set the following research objectives:
To gather machine learning research articles that focus on making investment decisions To evaluate the performance of various machine learning algorithms favouring investors in generating profits To check the variables considered important and used in training and testing algorithms To understand the combination of feature variables that play important roles To diagnose the fitness of tests by computing root mean squared error (RMSE) and accuracy matrix
SCOPE OF THE STUDY
As it is difficult to understand the nature and dynamics of the movement of stock prices, there is always scope for research to look at generating trading signals. A trading signal means that when a predicted stock price is expected to fluctuate, the algorithm generates a buy/sell signal accordingly. In the case of reinforcement learning, the algorithm generally tries to maximize profit by forming a basket of assets. The algorithm uses market order, limit order, loss order, or a combination of these to add further constraints to maximize gain or minimize loss. Furthermore, because the stock market is dynamic, a developed strategy can soon become obsolete. Researchers need to develop, train, validate and test a new strategy compatible with the current environment. It is also necessary to monitor an algorithmic trading strategy that is live in the environment. Otherwise, there would be severe losses for investors in case of an adverse change in the environment, including systematic risk and idiosyncratic risk.
LITERATURE REVIEW
To foretell the trend of stock prices in the stock market, researchers face various challenges about what models need to be used, whether a new model needs to be developed, and what feature variables need to be considered. Researchers use different models with different sets of variables in predicting stock price trends.
Explaining the robustness of the model and the importance of the feature parameters are not mutually exclusive. In other words, both can be examined in a research article. However, we have tried to categorize the research articles surveyed.
Focus on Input Variables
Technical Indicators
Using adaptive stock technical indicators, Agrawal et al. (2019) developed a long short-term memory (LSTM) classification model to forecast the movement of stock trends. Technical indicators are taken as inputs to the model for more accuracy. As the number of epochs increases, prediction accuracy increases, but prediction accuracy deteriorates due to the over-fitting problem after a certain point. Finally, the optimality of the LSTM model is determined. The results revealed that the prediction accuracy of optimal LSTM measured by accuracy score is better than that of support vector machine (SVM) and logistic regression models.
Using technical indicators and financial news titles as input, Vargas et al. (2018) used a deep learning algorithm for daily trend movement forecasting of a stock. The results indicated that the convolutional neural network (CNN) outperformed recurrent neural network (RNN) on picking semantics from texts. On the other hand, the results showed that RNN is superior to CNN on picking the context of information from news and formulating a model of complex temporal characteristics for stock market forecasting. The technique explained that financial news articles play an important role in stabilizing the results, but there was no improvement when comparing various sets of technical indicators.
By using a computational efficient functional link artificial neural network (CEFLANN) and by analysing the nonlinear relationship between a few important technical indicators, Dash and Dash (2016) produced a set of continuous trading signals ranging from 0 to 1. The learning capability of CEFLANN, along with the technical analysis rules, is instrumental in generating profitable stock-trading signals. The output from the CEFLANN is transformed into simple trading signals, which are nothing but buy, hold and sell signals. This is achieved by applying an appropriate set of rules. The given model performance is compared, and the authors found that its performance was far superior to traditional machine learning algorithms such as decision tree (DT), Naive Bayes, SVM and K-nearest neighbour model (KNN).
Inthachot et al. (2016) applied an artificial neural network (ANN) on technical indicators as input variables chosen by a genetic algorithm (GA) to predict future trends of stock. Genetic algorithms are better known for selecting subsets of input variables for importing into ANN. Using the t-test, prediction accuracy was statistically significant and far superior to that of the research model developed earlier by Inthachot et al. (2015).
Using technical indicators, Zeng and Khushi (2020, p. 2) used a genetic algorithm for building an automatic robotic trading (Robo Trading) strategy to optimize Sharpe and Sterling Ratio. To reduce the variance and the magnitude of drawdowns, the proposed cost function computes the Sharpe and Sterling Ratio. The proposed model on experimentation with intraday data of six major currency pairs showed consistent significant positive results. The optimized trading strategy yielded the highest return of 320% annually with 1:20 leverage using 5-minutes AUD/USD currency pairs. In this model, the authors have not considered the transaction fee.
Financial News Articles
Attanasio et al. (2019) investigated the significance of time series descriptors derived from technical analysis and news information to forecast stock direction reversal for the next few days by using various classification techniques. They compared the performance of different proposed classification techniques trained on the historical time series data, a set of technical indicators, news sentiment descriptors and a combination of these. The results depicted that among the tested combinations, the combination of stock price indicators and historical news sentiment revealed the best performance, on average. Therefore, news articles are significant when studying trend predictions of stock.
Online financial news content is very vague and volatile. Its quality and trustworthiness vary greatly. Hu et al. (2018) imitated the learning process of human beings facing such chaotic online news driven by three principles: effective and efficient learning, sequential content dependency and diverse influence. The authors applied a self-paced learning mechanism for imitating the first principle and implemented hybrid attention networks to forecast the stock direction based on the sequence of recent related news for selecting the last two principles. Through backtesting, the results showed that in a one-year-round trading simulation trip, the framework produced reasonable profits, with great improvement in annualized excess return.
By combining traditional time-series and technical indicators with inconsistent online data sources, Weng et al. (2017) implemented three machine learning algorithms—neural networks, decision trees and SVM—and achieved among them 85% forecasting accuracy for next-day stock trends. Hence, in addition to generating features from traditional time-series and technical indicators, information from online data sources can significantly improve prediction accuracy.
Focus on Models
Machine Learning
By incorporating trading volume and price information with even weight, Dinh and Kwon (2018) attempted to extract input features. They formulated three modelling parameters: input window sizes, target window sizes and profit threshold. With the help of feature and target variables, they trained and tested SVM and multilayer perceptrons (MLP), and then compared the results with expected performance. The results revealed that the model’s performance was better than both anticipated performance and the performance of passive strategy (i.e., buy and hold strategy). The results also depicted that when input variables derived from the trading volume were not included in learning, the model’s performance deteriorated, thereby illustrating that trading volume information plays an important role. Stock price alone is not enough. The authors further recommended that more complex input variables (indicators) be considered, derived from either price and volume or other related features. There are several derived technical indicators available in the financial market.
Using only historical price and technical indicators, Dingli and Fournier (2017) used several machine learning algorithms to predict stock price trends and compare the outcomes. In this study, technical indicators consisted of volatility, volume, momentum and cycle-based indicators, and features were prepared and derived accordingly. The results described that as the number of classifiers and features increased, the accuracy of prediction increased initially but later decreased slightly; therefore, an optimal number of classifiers and features was determined. Further, results also revealed that among the regression techniques used, the authors achieved 81% accuracy for forecasted trend movements using classification, 0.0613 RMSE for next day change in price, and 0.0117 RMSE for next day price. The authors suggested that this approach be further improved using deep learning architectures such as CNN and RNN.
Dey et al. (2016) extracted features such as a set of technical indicators from smoothed stock data. Using the Xtreme Gradient Boosting (XGBoost) technique (a decision-tree-based ensemble machine learning algorithm), they found that its performance was much higher than that of the traditional non-ensemble learning technique. The robustness of this algorithm is evaluated by checking its accuracy in predicting results, or it can be achieved by analysing the receiver operating characteristics (ROC) curve and area under the ROC curve.
Khaidem et al. (2016) built a random forest classifier on technical indicators derived from stock data. The robustness of the model in predicting stock price movement is evaluated by computing various parameters such as accuracy, precision, recall and specificity. Additionally, ROC curves were also plotted and examined to evaluate the model. The results for selected data revealed that prediction accuracy is in the range of 85%–90%, which is quite impressive.
Reddy (2018) fitted an SVM, a type of traditional machine learning model, on feature data prepared from sector volatility, sector momentum, price volatility and price momentum and observed that the fitted model did not show any sign of an over-fitting problem. The results indicated that the model generated higher profit than the selected benchmarks.
By applying a logistic regression model on stock price, Kambeu (2019) investigated whether trading volume influences the forecasting of stock-market movement. The previous five days’ trading volume data were analysed. The results illustrated that only the third most recent day’s trading volume influences were significant in forecasting today’s stock market trend. This study can be instrumental in building a predictive model that uses trading volume in forecasting stock market trends.
To incorporate public mood analysed from social media into market views which in turn integrated into modern portfolio theory, Xing et al. (2018) discovered Bayesian market views for intelligent asset allocation. In this Bayesian asset allocation model, optimally allocated assets maximized returns in each period. Results revealed that the model significantly increases the simulated portfolio profitability by 5% to 10% annually at a given risk level. This model has been attempted with only five assets and should be tried and tested with at least ten assets.
Deep Learning
The daily stock market returns of Standard & Poor’s Depositary Receipts (SPDR) S&P 500 ETF and 60 economic and financial features were considered by Zhong and Enke (2019) to apply ANN and DNN to predict their daily returns direction. While controlling the over-fitting problem, the number of hidden layers was gradually increased from 12 to 1000, and statistical tests were also performed. The simulated results show that using two ‘principal component analysis represented data sets’, the DNNs give significantly superior classification accuracy as compared to those using the entire unchanged dataset and several other hybrid machine learning techniques. As DNNs possess more complicated learning algorithms and additional concealed layers, they are considered a sophisticated technology in AI and computational intelligence. Nonetheless, DNNs are still a black box. The authors recommend further research in these areas in the context of making predictions in the stock market.
Moukalled et al. (2019) considered the historical stock market data and related news sentiments to deploy an AI framework mainly consisting of RNN, feed-forward neural network (FFNN), support-vector regression (SVR) and SVM for directional prediction of stock price trends. The authors found that the directional prediction accuracy with SVM was the highest. The authors suggested incorporating other important variables such as technical indicators or related news.
Based on a set of technical indicators and financial news titles as input, Vargas et al. (2017) applied deep learning techniques for intraday trend forecasting of the S&P 500 Index. The authors implemented RNN and CNN architecture generally popular in performing traditional natural language processing (NLP) tasks. The architecture of the model consists of four stages: input layer (technical indicator layer and sequence of encoded sentences of news titles), recurrent layer, convolution layer and output layer. The results revealed that RNN performs better on selecting context information and modelling complex temporal characteristics for stock market forecasting. Additionally, the results illustrated that the performance of CNN was superior to that of RNN in selecting semantics from texts. The authors emphasized reinforcement learning methods to train and test the model on stock-trading simulations for further improvement.
By taking daily closing price and trading volume as feature variables, Sharma et al. (2019) applied LSTM architecture and predicted stock prices. The results revealed that the performance of the LSTM model improved compared to that of linear regression; in other words, RMSE improved significantly going from linear regression to the LSTM model. The authors recommended that the implemented model be extended and modified by training the model with more feature variables.
Shah et al. (2018) present a comparative study of two very important models – DNN and LSTM neural network– in predicting the daily and weekly movements of stock prices. These two models reduce the problem of over-fitting and perform well even in a volatile environment. While both models performed better in daily prediction, LSTM RNN outperformed DNN in weekly prediction. Thus, the LSTM model is more promising for making longer-term predictions.
By applying the DNN algorithm, Yong et al. (2017) tried to predict the Singapore stock-market index using the Financial Times Stock Exchange (FTSE) Straits Time Index. They also tested market simulations on historical daily prices. The performance of the DNN model was measured by RMSE and mean absolute percentage error (MAPE). Based on market simulation on test data, the results described were outstanding with a profit factor of 18.67, Sharpe ratio of 5.34, and 70.83% profitable trades.
Livieris et al. (2019) implemented a weight-constrained deep neural network with three hidden layers for forecasting stock exchange index movement. Training of the model exploited the computational performance and very low memory requirements of the limited-memory Broyden–Fletcher–Goldfarb–Shanno matrices, along with a gradient-projection strategy for handling the bounds on the weights of the network. The results were found to be statistically significant.
For predicting stock price, Hiransha et al. (2018) considered four types of deep learning techniques, RNN, MLP, CNN and LSTM, on historical stock data from two different stock markets: New York Stock Exchange (NYSE) and the National Stock Exchange (NSE) of India. The models are only trained by a single stock from the NSE and predicted for five different stocks from both the NYSE and the NSE. It is quite clear from the results that CNN outperformed the other models used in the study. Furthermore, the authors illustrated that, even though the models were trained from NSE data only, they could predict NYSE stocks because both stock markets have some common inner-risk profile.
Ghosh et al. (2019) used the LSTM algorithm on stocks listed on Indian stock markets to predict future stock prices and found that errors for long-term predictions come down significantly for various sectors. Therefore, the authors recommended that the LSTM-based model be adopted to predict the share price on long-time historical data.
Lai et al. (2019) applied the LSTM model using the rectified linear unit (ReLU) activation function on a combination of stock information and a set of technical indicators to forecast stock movement for the next five days. During simulation (simulation was performed for up to 1,000 epochs with ReLU activation function) it was observed that the LSTM model achieved the best results with an RMSE of 1.3 and an MSE of 1.9%, indicating that the results were impressive.
Roondiwala et al. (2017) tried to apply the LSTM model, a type of recurrent neural network, on four feature variables (low price, high price, open price and closed price) with 500 epochs. The authors analysed stock index prediction accuracy, and the model efficiency was evaluated using RMSE. The results showed that the authors achieved the best performance RMSE of 0.00983 from training and RMSE of 0.00859 from testing.
Zeng and Khushi (2020) proposed a hybridized model consisting of the wavelet de-noising, attention-based recurrent neural network (ARNN) and autoregressive integrated moving average (ARIMA) on the forex market (USD/JPY). ARIMA helps in reducing the gap between the predicted value from ARNN and the actual value. The hybridized model tested on 5-minute data revealed that the model outperformed the baseline method. The RMSE of the hybridized model, was 1.65 with directional accuracy of approximately 76%.
Considering low, high and closing prices, Noguer i Alonso and Srivastava (2020) implemented reinforcement learning algorithms with different learning architectures—long short-term memory (LSTM) networks, convolutional neural networks (CNN) and recurrent neural networks (RNN)—for asset allocation in US Equities and compared them with more traditional portfolio management approaches such as mean-variance, minimum variance, risk parity and equally weighted. It was observed that using a simple reward function and the time series of stocks, the deep reinforcement learning approach performed better than traditional approaches. Furthermore, among the models studied, CNN without turnover control provided the best cost adjusted returns. In future, this research can be further investigated for the effect of different reward functions, interpretability of the different reinforcement learning approaches and the effect of diversification. Additionally, the inclusion of technical indicators and exogenous factors are also important aspects of consideration.
Taking ten technical indicators as input, Nabipour et al. (2020) applied various machine and deep learning algorithms, including LSTM, a variant of RNN, for predicting stock trends. Results showed that LSTM outperformed the other machine learning models studied here by a considerable difference.
Hosker et al. (2018) developed regression and classification models using VIX futures and options data and other technical indicators to estimate a 1-month VIX future contract for 3-and 5-day forward. They found that long short-term memory results improved performance over existing linear regression, principal components analysis and ARIMA methods.
Using an artificial neural network, Dixit et al. (2013) modelled predicting the up and down movement of the India volatility index (INDIA VIX), which is derived from the Nifty 50 index. Authors only used daily data of VIX and its technical indicators as feature variables and found that artificial neural network can predict the up and down movement of VIX with an accuracy of over 60%.
Using open, close, high and low price and volume of Google and Amazon, Shyam and Vinayak (2020) applied the LSTM model with ReLU in the hidden layer and Sigmoid activation function in the output layer. The authors also used dropout to prevent overfitting and RMS prop as optimizer. The result revealed that minimum losses are 0.00085 and 0.0018 for Amazon and Google, respectively. The overall accuracies are 52.23% and 89.44% for Amazon and Google, respectively.
Reinforcement Learning
Nan et al. (2020) applied reinforcement learning on a combination of traditional time-series stock price data and news headline sentiments as input. In the financial market, because of a lack of label data, the authors said that reinforcement learning could perform better than supervised and unsupervised. This is also so because, in reinforcement learning, the algorithm itself learns and builds a set of rules based on feature data. The authors compared both approaches: an agent with sentiment data provided and another agent without any sentiment data provided. It is evident from the results that the Sharpe ratio for an agent with sentiment data outperformed an agent without any sentiment data. This research article illustrates the importance of reinforcement learning and news sentiment in predicting stock trends in the financial market.
Using real-world stock data, Dang (2019) implemented a deep reinforcement learning model and compared it with a state-of-the-art supervised deep learning forecasting model in real-world data. Considering the complexity of the stock market, the author believes that the reinforcement learning model has tremendous potential to generate stock trading signals. The results illustrated that using only a few hundred sample data, reinforcement learning model variants based on Q-learning, a type of deep Q-network, could generate a positive profitable trading signal.
Meng and Khushi (2019) reviewed several research articles investigating reinforcement learning and took historical data, including price and volume, technical indicators, economic indicators and correlation coefficient as input variables. Some research findings stated that the performance of reinforcement learning, applied in an appropriate context, could substantially improve compared to baseline models when the performance measurement was based on either trading profitability or predicting trend. Other research findings stated that reinforcement learning did not perform well when the price pattern changed drastically between the data used to train the system and the data used to test the system. The authors gave a reasonable explanation, stating that as liquidity plays an important role in profitability and reinforcement, learning required frequent trading, and high transaction costs generated from frequent trading of illiquid assets dragged down profitability.
Ponomarev et al. (2019) applied a reinforcement learning algorithm based on a deep neural network on RTS Index Futures for trading at Moscow Exchange. The learning method applied is the asynchronous advantage actor-critic (A3C) algorithm. The research resulted in the creation of an exchange trading algorithms based on asynchronous advantage actor-critic, which is ultimately lucrative for investment from an economic point of view. Thus, the optimal algorithm resulted in gross profit of 110% and net profit of 66% after accounting for commission.
Moody et al. (1998) extended the previous work of Moody and Wu (1997) to compare Q-learning to reinforcement learning technique based on real-time recurrent learning that maximizes immediate reward. Models were tested on the monthly S&P 500 stock index. The results revealed 4000% of profit for the proposed strategy compared to 1300% of profit for buy and hold strategy.
Based on recent reinforcement learning development, Carapuço et al. (2018) developed a new model for short-term expectation in the foreign exchange market. This model consists of three layers of ReU neurons to build a neural network, which are trained as RL agents under the Q-learning algorithm. As a result, it consistently induces stable learning that generalizes to out-of-sample data. Results from EUR/USD market during 2010–2017 over 10 tests with varying initial conditions revealed an average total profit of 114.0±19.6% and average annual of 16.3±2.8%.
After changing existing approaches by incorporating technical indicators, Chakraborty (2019) explored the usage of deep reinforcement learning algorithms by applying the Markov decision process (MDP) model to capture consistent, profitable, robust, uncorrelated trading signal of any financial instrument. It is proved through the experiment that this model can be applied on any financial market for trading such as stocks, currencies and commodities market trading for generating reliable and consistent profit. Hence, it can be confidently deployed on real-time for automated trading. The author suggested expanding to other trading scenarios such as portfolio of assets, placing limit orders, applying stop-loss order and high-frequency trading. Further, the author also suggested exploring more sophisticated reinforcement learning algorithms used by Wang et al. (2018) and Bellemare et al. (2017).
Using deep reinforcement learning, Kanwar (2019) optimally allocates assets to stocks from a given set of stocks to maximize the long-term wealth. In this model, as the learning agent directly interacts with the environment, applying a model-free algorithm gets optimized results. The Author focused on Policy Gradient and Actor-Critic Methods, which construct an estimate of the optimal policy. The author then compared performance of deep reinforcement learning algorithms to traditional strategies. It was found that deep reinforcement learning strategy either outperformed all other strategies or behaved similar to the traditional strategy.
RESEARCH METHODOLOGY
This is a qualitative study based on data collected from research papers published in well-ranked journals. We first reviewed a few research papers and found that to build models for making investment decisions, features variables and algorithms play an important role. During the review of the literature, several suggestions and recommendations were identified. The authors used online search tools to collect research papers that instantiated the idea further, whether in terms of feature variables or the model itself. The ultimate aim is to judge the importance of machine learning algorithms in making investment decisions in the stock market by studying qualitative secondary research. Therefore, it would be beneficial to look into machine learning algorithms for traders interested in buying and selling stocks.
During the literature survey, the authors considered several feature variables and applied different types of algorithms to improve the model accuracy. The authors evaluated models by using relevant evaluation criteria. Some of the important aspects used by the authors are elaborated below.
Feature Variables
The selection of feature variables plays an important role in building models. The price variables are open, high, low and close price of stocks; volume information is also available along with price variables. Technical indicators are computed from price, volume, or other characteristics of stock. Some important technical indicators are relative strength index (RSI), simple moving average, exponential moving average (EMA), Williams, stochastic oscillator, moving average convergence divergence (MACD) and momentum. These are independent of the fundamentals of business, such as the expected value of earnings, revenue and profit margins. News articles indicate the sentiment of the investors, and the same is processed through a natural language processing algorithm.
Evaluation Criteria
The regression model is evaluated by computing RMSE, MAPE, R-square and/or several other functions by taking actual and predicted target values. The classification model is assessed by confusion matrix, classification report and receiver operating characteristic curve; one of the important measures is the accuracy score. In reinforcement learning, the idea is to maximize the reward, which is profit here.
Root Mean Squared Error (RMSE)
It is calculated by taking square root of mean of the square of difference between actual and predicted target value. It is also called standard deviation of errors.
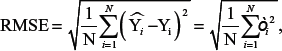
where, N is the number of observations.
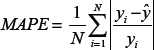
Mean Absolute Percentage Error (MAPE)
Coefficient of Determination (R-Square)
The goodness of fit is evaluated by calculating R-square. It indicates how much the variation in target variables is explained by the model.
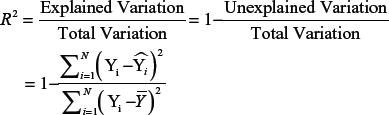
Where,
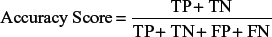
Accuracy Score
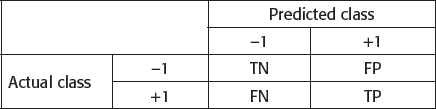
Where, TP is the number of true positives. FP is the number of false positives. FN is the number of false negatives. TN is the number of true negatives. A negative one (–1) and a positive one ( + 1) indicate down trend and uptrend, respectively. Accuracy score is one of the important measures derived from the confusion matrix.
Sharpe Ratio
It is the ratio of access return per unit of risk.

In this study, the model performance was evaluated mostly based on RMSE for regression models, accuracy score for classification models and profitability for reinforcement learning-based models. Based on the value of RMSE findings from articles surveyed, one cannot make a comparative analysis. However, based on accuracy score, profitability and R-square findings from articles surveyed, one can make a comparative analysis.
RESULT AND ANALYSIS
Summary of the Past Literature Reviewed
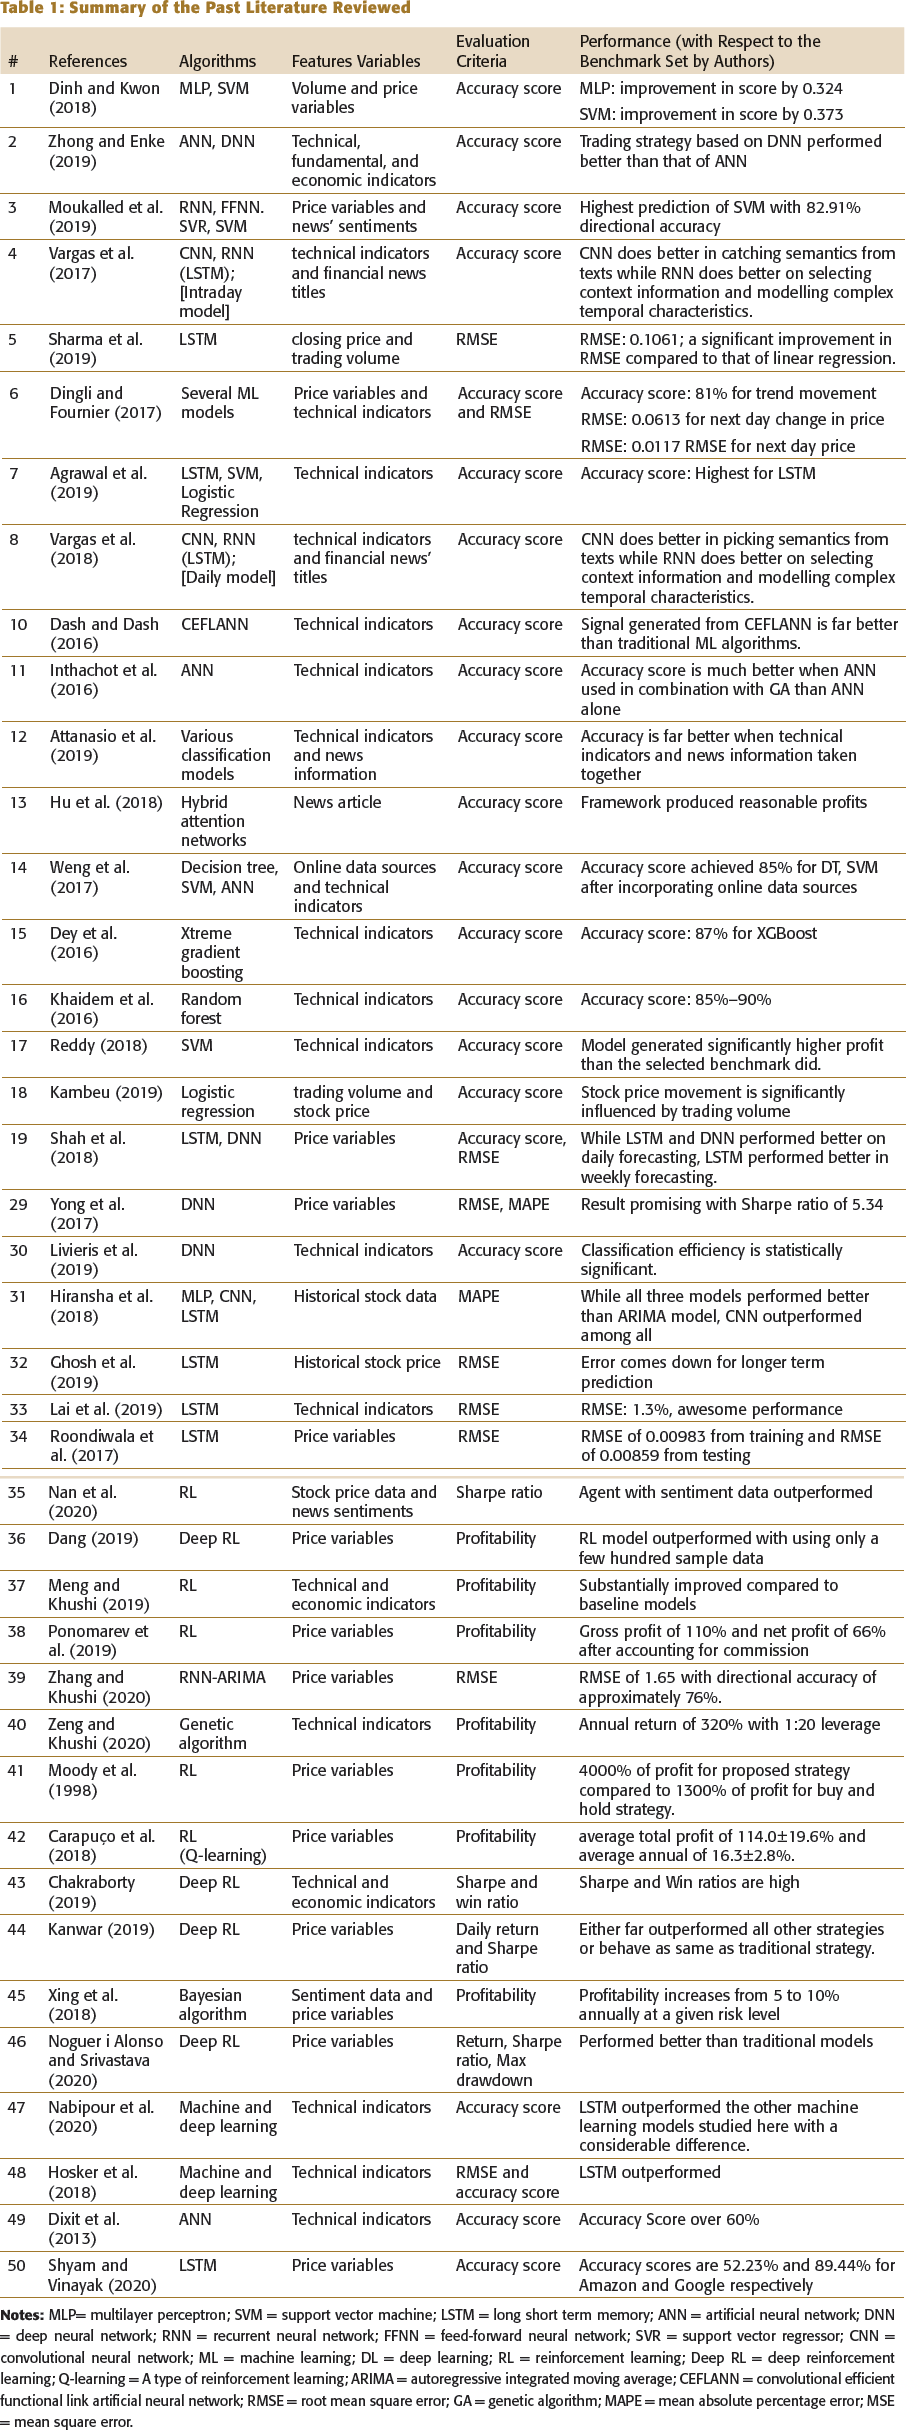
Price variables such as open, low, high and close price and volume information are the most important variables. Based on the above findings, it is evident that technical indicators play an important role in forecasting stock trends by a machine learning model. However, one of the findings indicated no improvement in model accuracy when incorporating different sets of technical indicators. However, incorporating news’ information does improve the model performance.
When deep learning models are compared to machine learning models, the performance of LSTM neural network model outperform in both regression and classification models. In deep learning, the performance of CNN is superior to that of RNN on selecting semantics from texts. On the other hand, the result from RNN is superior in selecting context information and modelling complex temporal characteristics for stock-market prediction. But it cannot be generalized, as the stock market is volatile and possesses complex dynamics. However, when we put reinforcement learning and compare profitability, the profitability of models implemented using reinforcement learning algorithms is far better than or as same as machine and deep learning models. It is so because, in reinforcement learning, the idea is to maximize reward and reward here is profitability; in other words, the algorithm directly tries to maximize profitability.
CONCLUSION AND FUTURE RESEARCH
The authors observed that the robustness of the models and the importance of the feature variables vary greatly. As the model becomes more complex, prediction accuracy becomes more accurate and reliable. In addition to closing stock prices, the trading volume also plays an important role. Additionally, financial news article information and technical indicators significantly improve prediction accuracy.
After reviewing over 50 papers focusing on various machine learning algorithms, the authors found that though the performance of models measured by RMSE for regression and accuracy score for classification models showed variations in predicting stock price movements. However, the LSTM model displayed better accuracy among the machine and deep learning models reviewed. Among the models analysed, reinforcement learning is best, followed by LSTM, because of its complexity and because reinforcement learning does not need target variables. Even so, based on the above findings, one can say that using machine, deep and reinforcement learning algorithms for predicting stock movement for making an investment decision is instrumental and reliable for traders.
Machine learning is a vast and growing field of interest in the capital market and other financial assets area. More reviews of research articles focusing on complicated algorithms that consider more input variables, including macro-level indicators, and consider financially distressed periods need to be undertaken.
Footnotes
Declaration of Conflicting Interests
FUNDING
The authors received no financial support for the research, authorship and/or publication of this article.