
Abstract
Executive Summary
In pandemics or epidemics, public health authorities need to rapidly test a large number of individuals without adequate testing kits. We propose a testing protocol to accelerate infection diagnostics by combining multiple samples, and in case of positive results, re-test individual samples. The key insight is that a negative result in the first stage implies negative infection for all individuals. Thus, a single test could rule out infection in multiple individuals. Using simulations, we show that this protocol reduces the required number of testing kits, especially when the infection rate is low, alleviating a key bottleneck for public health authorities in times of pandemics and epidemics such as COVID-19. Our proposed protocol is expected to be more effective when the infection rate is low, which suggests that it is better suited for early stage and large-scale, population-wide testing. However, the managerial trade-off is that the protocol has costs in additional time for returning test results and an increased number of false negatives. We discuss applications of pooled testing in understanding population-wide testing to understand infection prevalence, to diagnose infections in high-risk groups of individuals, and to identify disease cold spots.
INTRODUCTION
In pandemics or epidemics, public health authorities need to rapidly test a large number of individuals, both to determine the line of treatment as well as assess the spread of infection to plan containment, mitigation and future responses. However, lack of adequate testing kits could be a bottleneck, especially in case of unanticipated new diseases, such as COVID-19, where testing technology, manufacturing capability, distribution, trained manpower and laboratory equipment may be unavailable or be in short supply. In addition, the cost of test kits might be prohibitive for poorer patients or for governments in low to middle-income countries. This bottleneck can be addressed by examining a test methodology that pools samples from two (or more) patients in a single test (Dorfman, 1943). The key insight with pooled testing is that a negative result from a pooled sample likely implies negative infection for all individual patients and thereby rules out the need for further tests. This protocol, therefore, requires significantly fewer tests. In the context of diagnosing SARS-CoV–2, pooled testing has been advocated with few or no caveats (Gossner & Gollier, 2020a; Kaul, 2020; Ray, 2020).
This article examines strategies for pooled testing for large, densely populated countries. It analyses practical trade-offs in terms of longer turnaround times and potentially greater false negatives. Our simulations show that combining samples from two patients with a 5% underlying rate of infection implies that 40% fewer test kits are required on average, but with (a) 10% additional units of time for testing and (b) near doubling of false negative rate. Drawing on this analysis, we suggest situations where pooled testing can be an effective strategy for identifying and ruling out infections, permitting economic and social activity without insisting on extreme social distancing.
Pooled testing was first proposed by Dorfman (1943) as a methodology for identifying syphilis infection among US soldiers. Since then, pooled testing has been used to diagnose malaria (Zhou et al., 2014), HIV (Ming Tu et al., 1995) or infertility (Bilder & Tebbs, 2012). The method has also been adopted in other fields such as computer science (Tanenbaum & Wetherall, 2011) and information science (Aldridge et al., 2019).
Sinnott-Armstrong et al. (2020) report results from the first COVID-19 laboratory test using pooled samples. Having tested with three different pool sizes, they report significant improvement upon naive testing in all three cases. Pooled testing performed better for a particular infection prevalence. Gossner and Gollier (2020b) analyse the value of group testing with a binary search protocol (also see additional protocols proposed by Scarlett [2019] and Hahn-Klimroth and Loick [2019]). In contrast, we propose a simpler protocol while emphasising trade-offs resulting from pooled testing, namely savings in testing kits, increased turnaround time, and increased false negative rates.
POOLED TEST PROTOCOL
We illustrate pooled testing for the case of SARS-CoV–2 diagnosis. The RT-PCR diagnostic test may be used for the qualitative detection of 2019-nCoV in samples obtained from upper or lower respiratory systems by various methods, including nasopharyngeal or throat swab or sputum. An RT-PCR instrument is used to extract viral genetic material called RNA, if present in the sample, to produce a complementary strand of DNA that may be analysed to obtain a measurable result. The turnaround time to obtain results from the standard RT-PCR-based test for COVID-19 is from several hours to few days (Daley, 2020), while the actual time taken by an RT-PCR instrument may be in the order of an hour or two. We term the latter time duration as ‘1 unit’ of time.
Standard Testing Protocol
The standard testing procedure uses a single kit for a single patient. Hence, the straightforward, single-stage approach to determine whether individual members of a group of K persons {P1, P2…, PK} are infected is as follows.
Test P1 and publish the outcome, and Test P2 and publish the outcome, and … Test PK and publish the outcome.
This protocol requires exactly K test kits and uses K slots in an RT-PCR machine that can extract RNA simultaneously from multiple samples. In that case, the test duration ( = time spent to simultaneously test K swabs in the lab) is 1 unit (assuming K is small enough).
Pooled Testing Protocol
The proposed protocol pools portions from K swabs to create one sample, with the balance from each swab saved for future use, if necessary.
Stage 1:
Use one kit to test whether the pooled sample (earlier taken from K swabs) is infected.
If the result is negative, the conclusion drawn is that all individuals, P1, P2, …, PK, have tested negative for the infection. This outcome, namely P1, P2, …, PK are all negative, may be published.
If the test is positive, proceed to Stage 2.
Stage 2:
Test (balance of swab from) P1 and publish the outcome, and Test (balance of swab from) P2 and publish the outcome, and … Test (balance of swab from) PK and publish the outcome.
ANALYSIS
Main Calculations
First, we report analytical results assuming (a) pool size to be 2, or K = 2, and (b) underlying independent probability of infection is 5%. For the present, we assume there are no false positives and no false negatives. We also assume that samples from K individuals can be tested in one unit of time. The probability that any individual sample is infected is drawn from a binary distribution. While simulating, the outcome is 0 or 1. In case the infection rate is 1% the outcome is 0 (person not infected) with probability 0.99, and 1 (the person is infected) with probability 0.01. Similarly, when the infection is 2%, the outcome is 0 or 1 with probability 0.98 and 0.02, respectively. When the infection rate is 5%, the outcome is 0 or 1 with a probability of 0.95 and 0.05, respectively.
In Table 1, consider the case where the infection probability is 0.05, or
Example with K = 2.
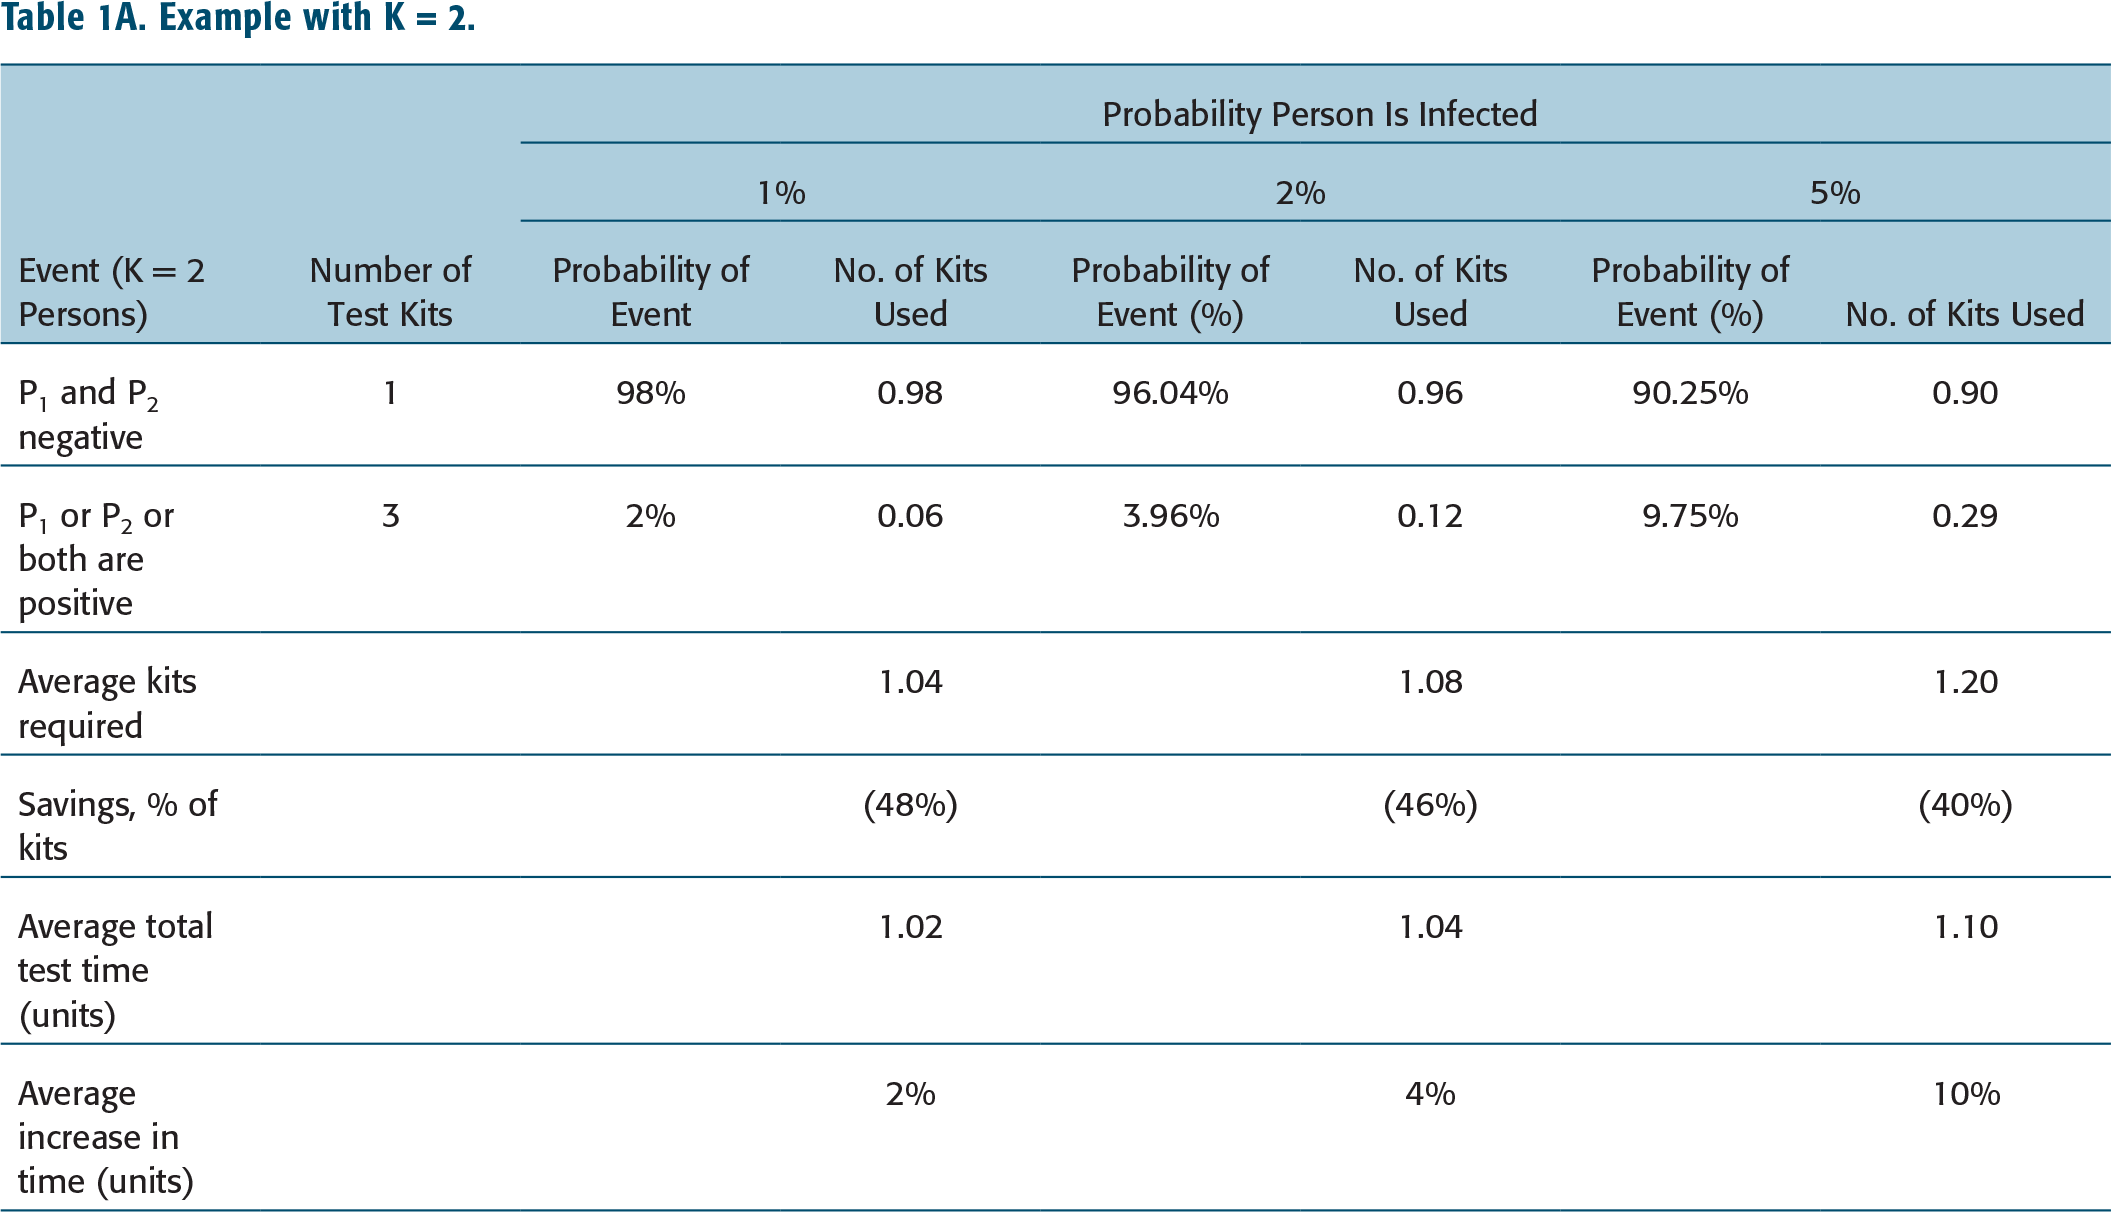
Prob(P1 is factually negative) = 0.95, Prob(P2 is factually negative) = 0.95.
The pooled sample will show a negative result if both are negative. Prob(P1 and P2 are each factually negative) = 0.95*0.95 = 0.9025.
If the test is positive, which will happen in the remaining 9.75% cases, then P1 and P2 should both be independently tested. Consequently, the average number of kits required is (1 kit * 0.9025 cases) + (3 kits * 0.0975 cases) = 1.195 kits as opposed to 2 kits that are required using the standard protocol, a saving of 0.805 kits or over 40% kits. This has yet another implication: with every decrease in the required number of kits, the ‘throughput’ of lab equipment and personnel improves correspondingly. For the above example, the throughput of the lab equipment and personnel increases by 67%. This is so since an RT-PCR extractor capable of processing n samples simultaneously is capable of screening using pooled testing (2/1.195)*n, or 1.67*n persons in one unit of time.
The savings in the number of kits is dramatically greater (46%) with a 2% infection rate. Correspondingly, the savings in the number of kits is lower as underlying infection rates increase, since a larger fraction of cases will require two stages of testing instead of one. Our analysis is based on the infection rate, which is, before testing, unobservable to public health authorities in an epidemic. Therefore, the best proxy is the fraction of the population identified as infected in past epidemics or pandemics. Data from South Korea is perhaps the best guide to understanding the COVID-19 infection rate. South Korea was the only large country not reporting increases in infections as of writing (April 2020), which suggests that the pandemic was well past its peak. Second, unlike China, South Korea’s Centers for Disease Control report the number of tests conducted. Thus, South Korea’s 578,000 tests and 10,700 positive infections suggest that the prevailing infection rate is 1.85%. This rate motivates the range of infections (1%, 2% and 5%) we analyse in this article.
The trade-off resulting from pooled testing is in the time taken to deliver results to physicians and/or patients. The standard protocol takes one unit of time for the RT-PCR instrument and lab personnel if both tests are run simultaneously. The proposed protocol is a two-stage process where the K samples are tested in the second stage only if the first test in Stage 1 is positive. In the above example, with an infection rate of 5%, the second test is run in 9.75% of cases. Thus, the average turnaround time is 1.0975 (or 1*0.9025 + 2*0.0975), near 10% more than the turnaround time in the standard test protocol. The increase in turnaround time is even lower for 2% infection rates—a 4% increase.
One method to increase the efficiency of the proposed pooled test protocol is to pool together more than two samples in a test. When K increases for the same infection rate, the savings in test kits increases significantly, though non-linearly.
One concern with increasing the number of samples in the pool is that the viral load per sample decreases. This decreases the ability of RT-PCR equipment to extract RNA, thereby detect positive infections and consequently return more false negatives (Wein & Zenios, 1994). The Limit of Detection (LoD) varies by RT-PCR kit. In other words, kits that are more sensitive can support the pooling of a larger number of samples.
Example with K = 5.
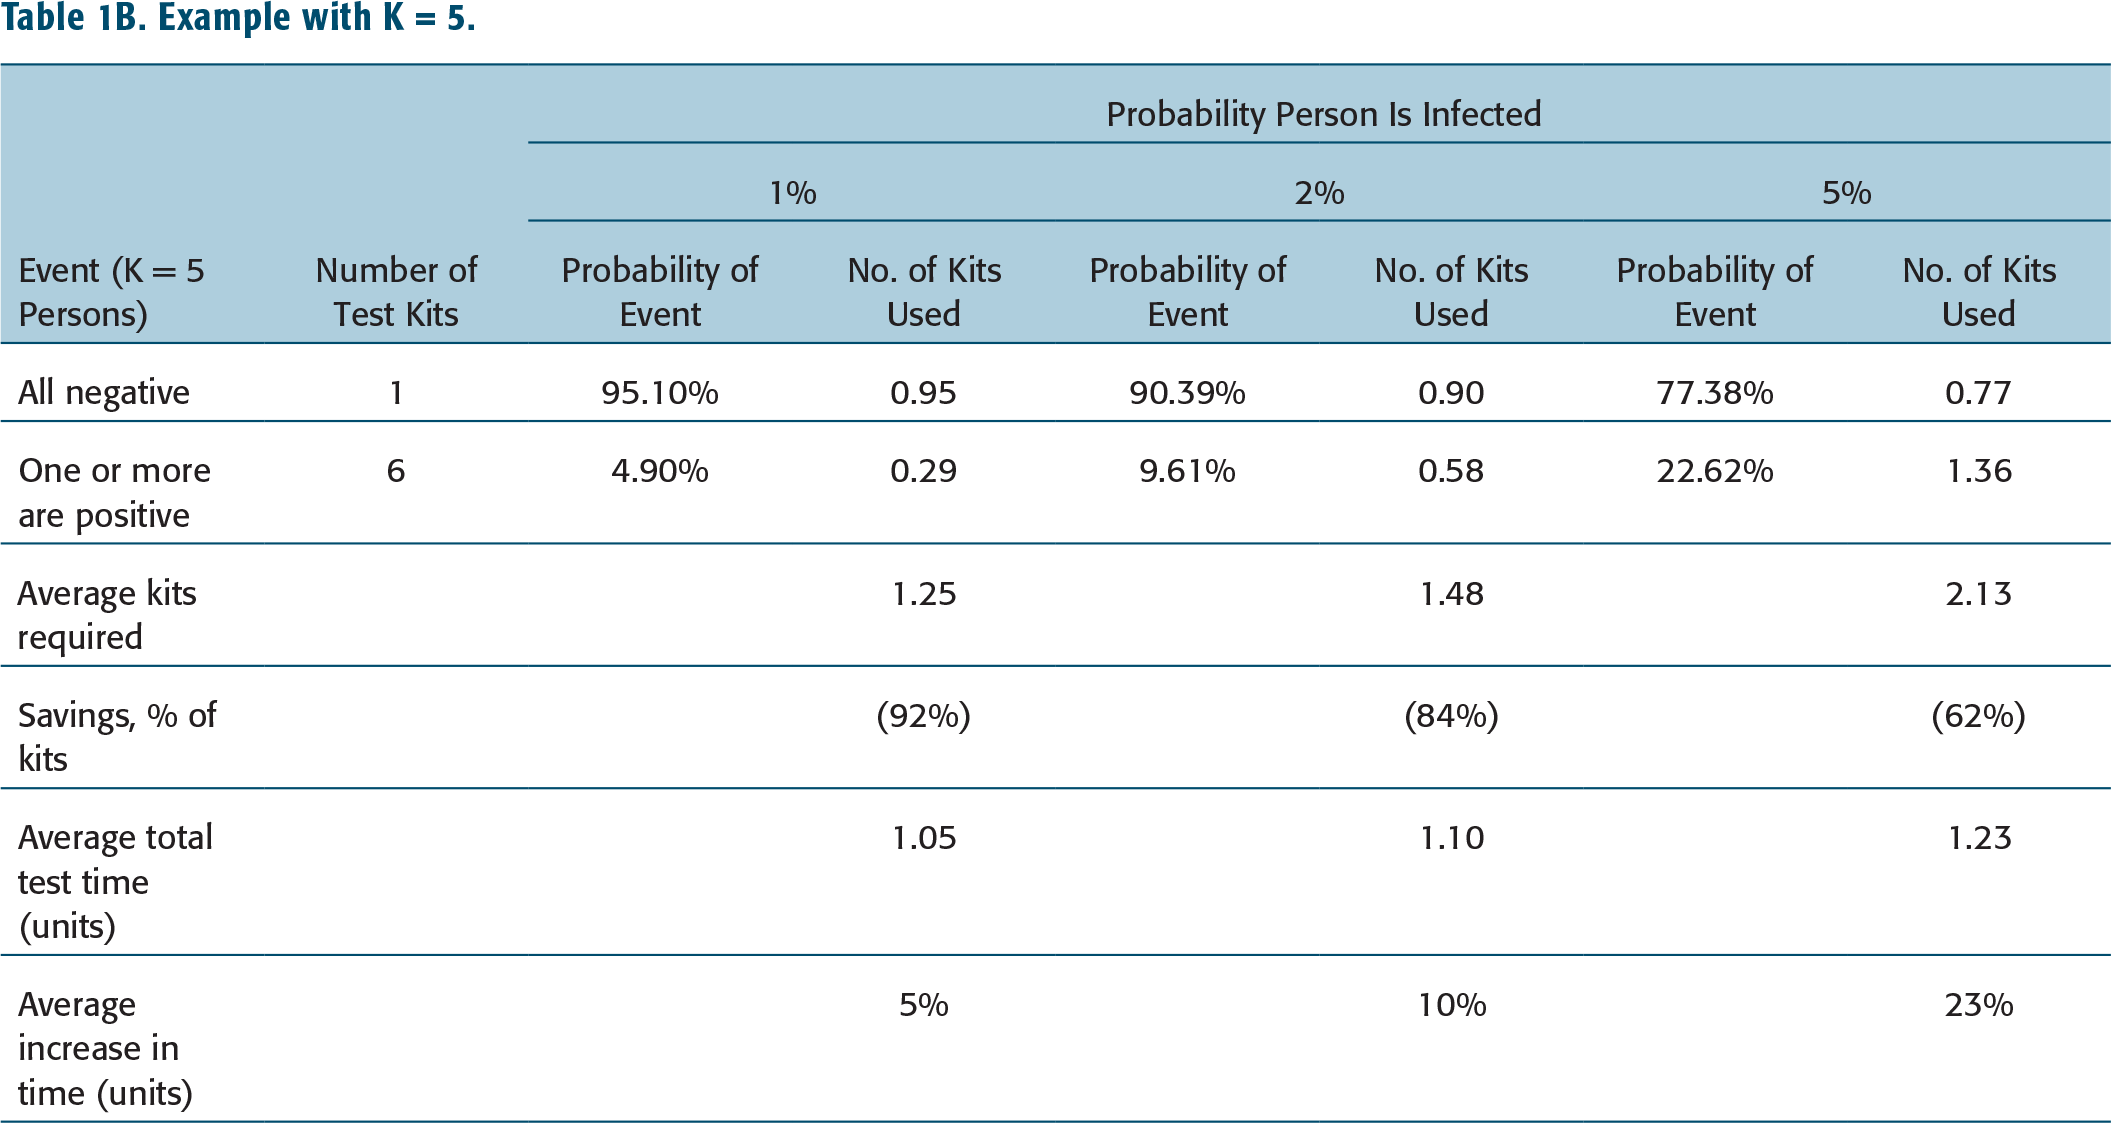
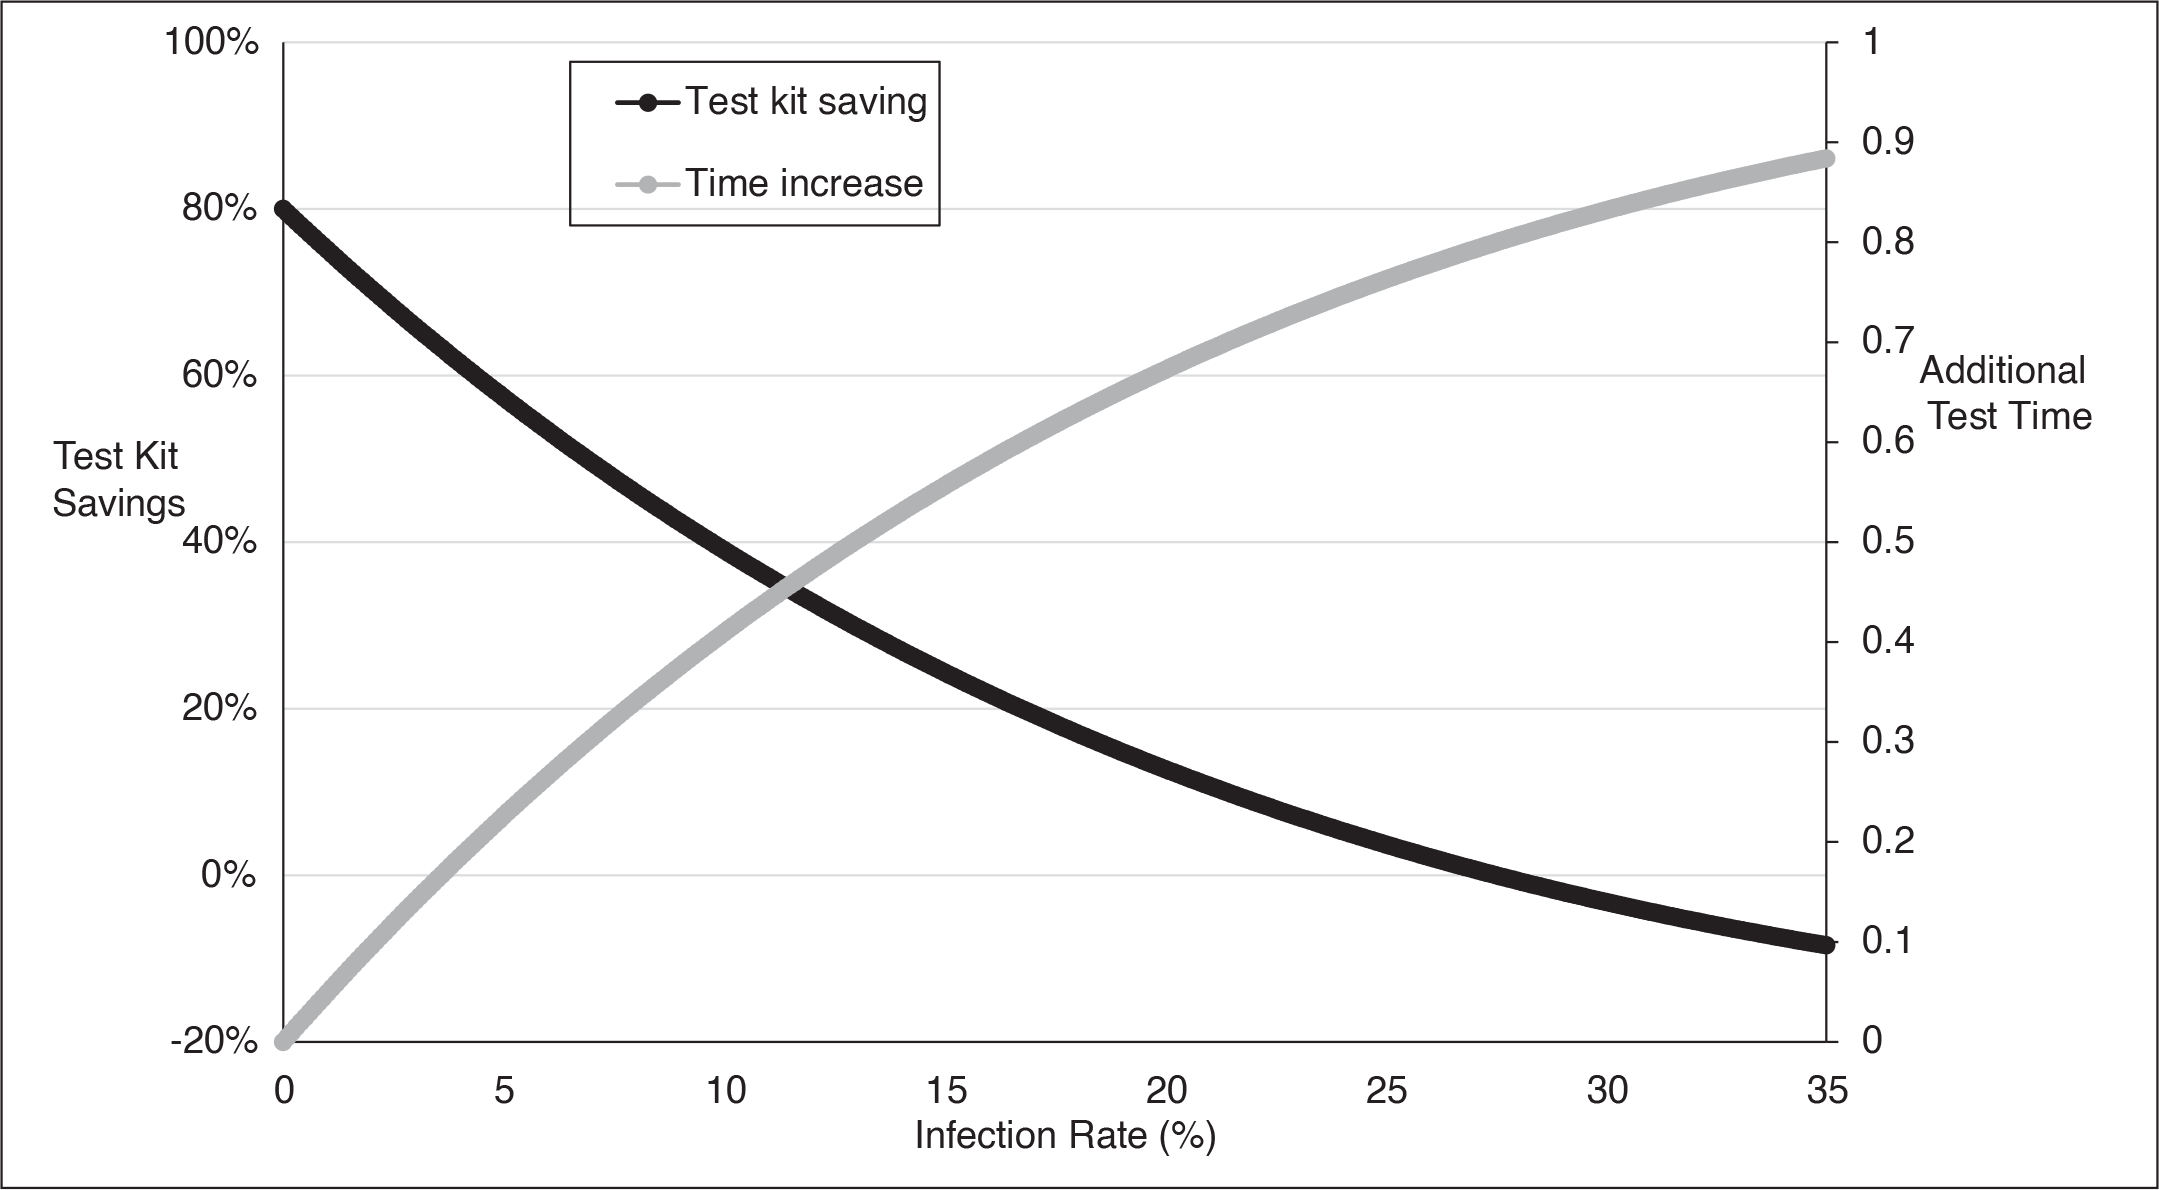
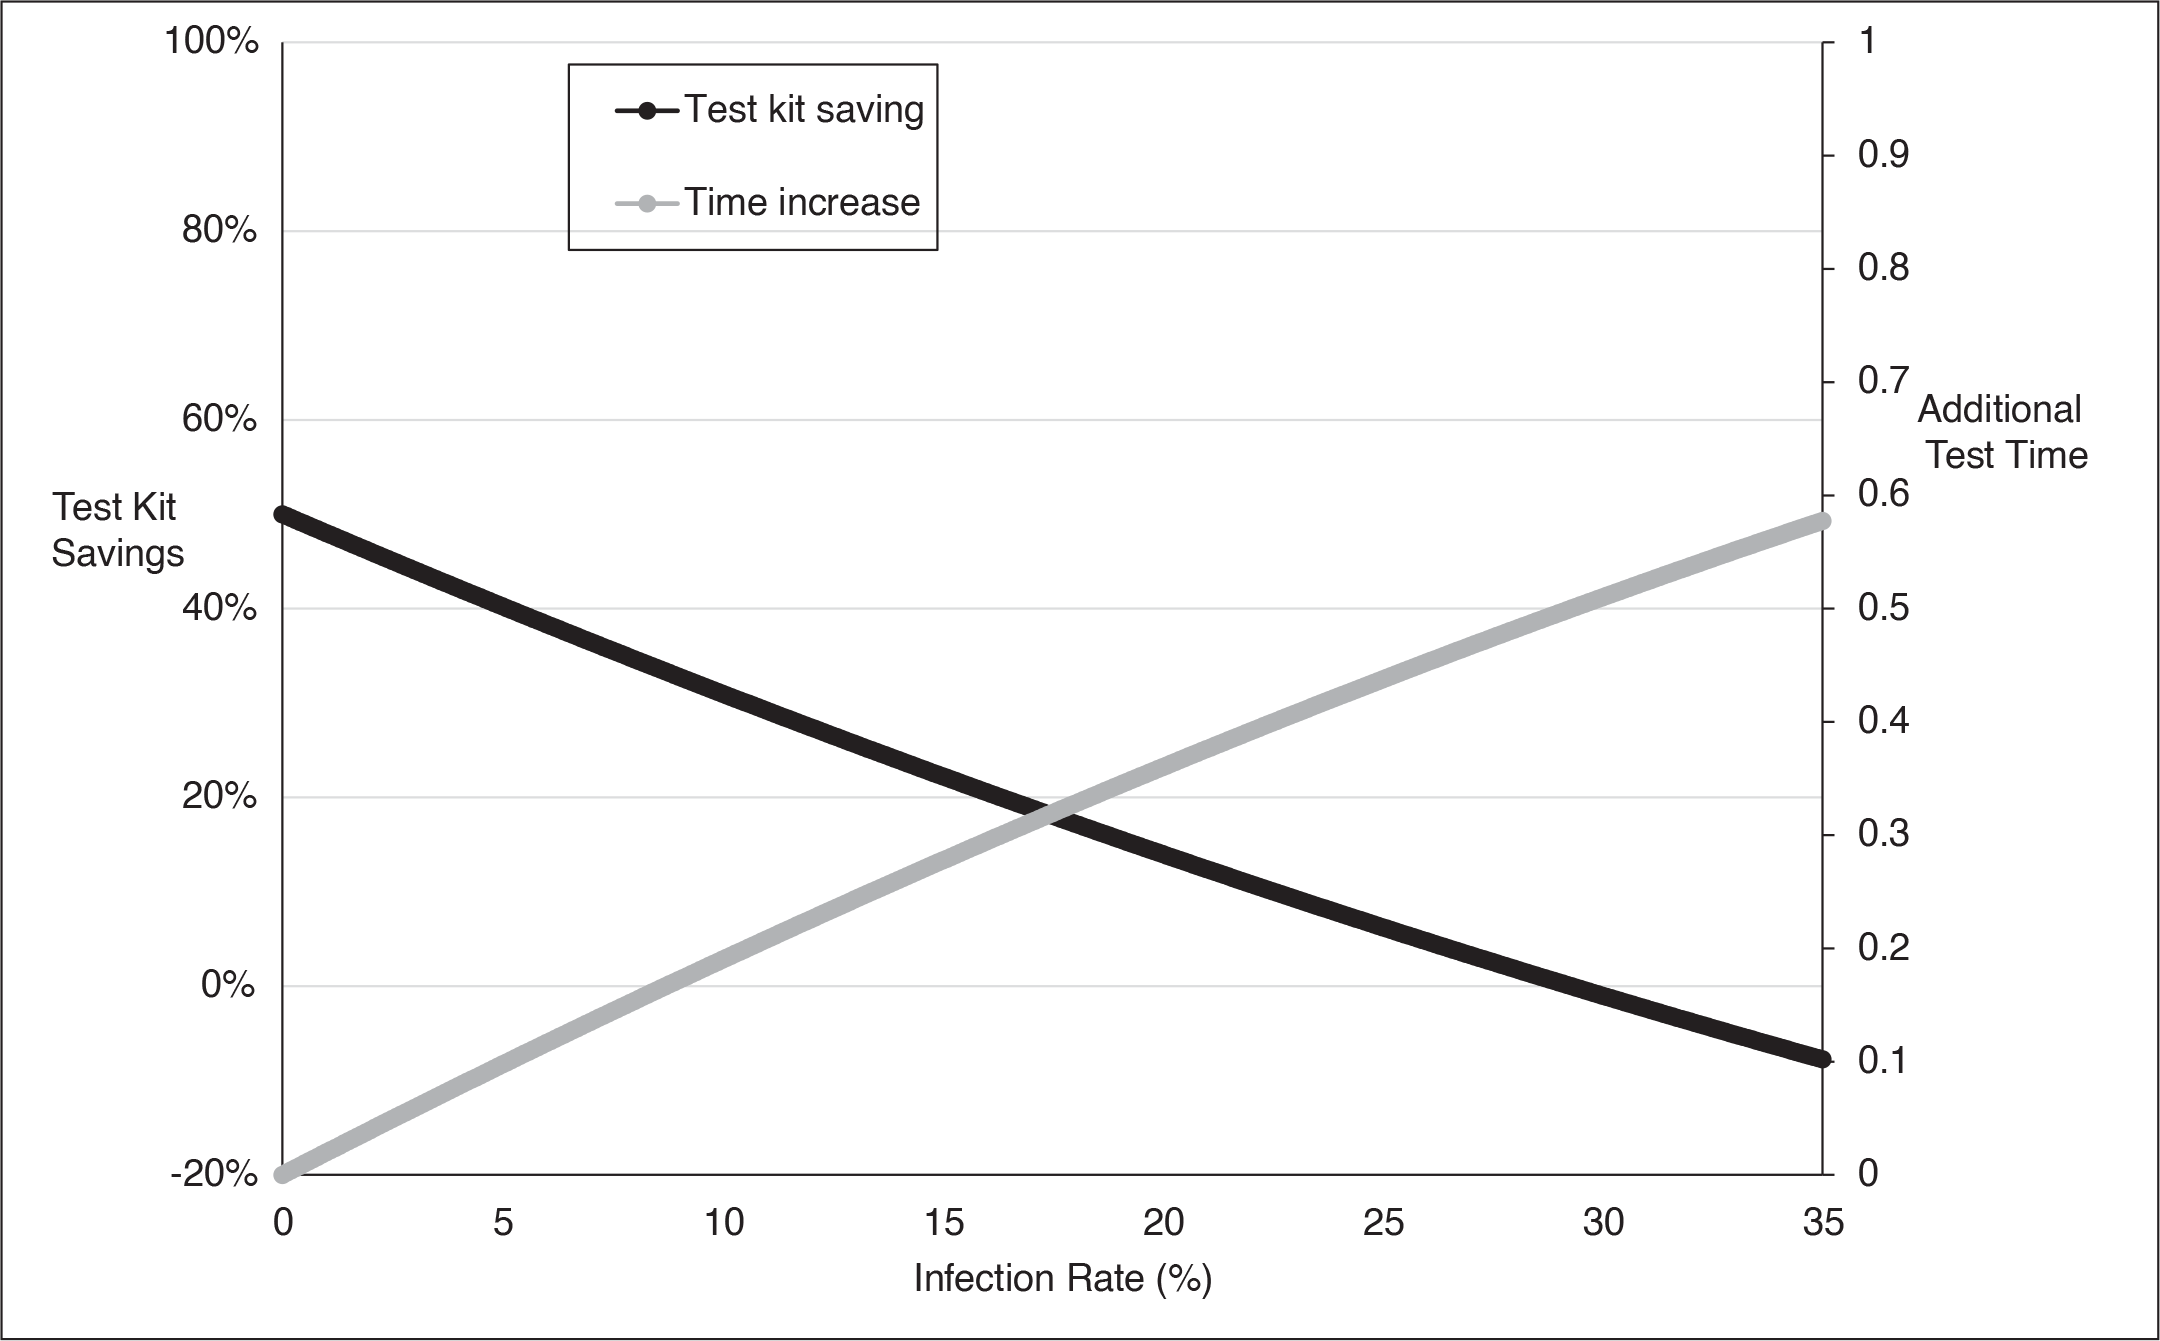
The key insight from these analyses is that as the infection rate increases, the probability that tests in Stage 2 will be required increases, thereby (a) increasing the average number of required kits and (b) increasing the average turnaround time to publish results. Figures 1A and 1B shows that by testing using a pool of 5 samples or 2 samples, the savings in the number of kits required is positive for infection rates lower than 30%. No credible estimate for COVID-19 predicts such high infection rates—the highest infection rate for the Spanish Influenza was approximately one-in-three, but spread over several years (CDC, 2020).
Test Kit Saving and Additional Test Time (K = 5).
Test Kit Saving and Additional Test Time (K = 2).
Efficiency Enhancement
Another method for increasing efficiency is to test a pool of samples from patients who are related and co-reside. For highly contagious diseases such as COVID-19, a co-residing couple or a family is likely to have the same or correlated infection status. Thus, a positive result can be interpreted as a likely positive result for all members, alleviating the need for testing in Stage 2, thereby further reducing the number of required test kits. Since the most common treatment for many infectious diseases, including COVID-19, is to quarantine at home, the couple or the family would be quarantined together as well.
Test Errors
Given that no test, including those to diagnose Coronavirus, is 100% accurate, we consider and incorporate test imperfections (resulting in false negatives and false positives) into our analysis (Liu et al., 2012). A false negative result reassures an individual that she is free of infection. Consequently, and unwittingly, she is more likely to spread the disease. Furthermore, public health authorities are less likely to trace contacts of individuals they believe are not infected. This is particularly harmful in the early stages of the pandemic when containing infections is the primary objective of public health.
False positives create a situation where a person is unnecessarily isolated and treated. This is harmful to the patient undergoing treatment for a disease she does not have. Further, the health system misallocates scarce resources (including hospital beds, physician and nurse time, drugs and other medical equipment) to treat individuals who did not need the treatment while depriving others of the treatment they need.
We, therefore, define conditional probabilities:
Prob(True positive) = Prob(person P is tested positive |P is factually positive), Prob(True negative) = Prob(person P is tested negative |P is factually negative), Prob(False positive) = Prob(person P is tested positive |P is factually negative), Prob(False negative) = Prob(person P is tested negative |P is factually positive).
To understand the impact of pooled testing, we have derived analytical expressions for true or false positives and true or false negatives, given (a) size of the pool, (b) probability of underlying infection, and (c) underlying probability of false diagnosis, both false positives and false negatives. In particular, we have assumed: K = 2 or 5, or number of persons whose samples are pooled together for testing, p = 0.01, 0.02, or 0.05, or Prob(Person Pi is positive), q = p, or Prob(Person P2 is positive) when K = 2, or q = 1 – (1 – p)4, Prob(Persons P2, P3, P4 or P5 is positive) when K = 5, ύ = 0.01 or 0.10, or Prob(sample is tested positive | sample is factually negative), namely Prof(false positive), and η = 0.01 or 0.10, or Prob(sample is tested negative | sample is factually positive), namely Prof(false negative).
Analytical Expressions for True and False Diagnosis Using Standard or Pooled Testing.
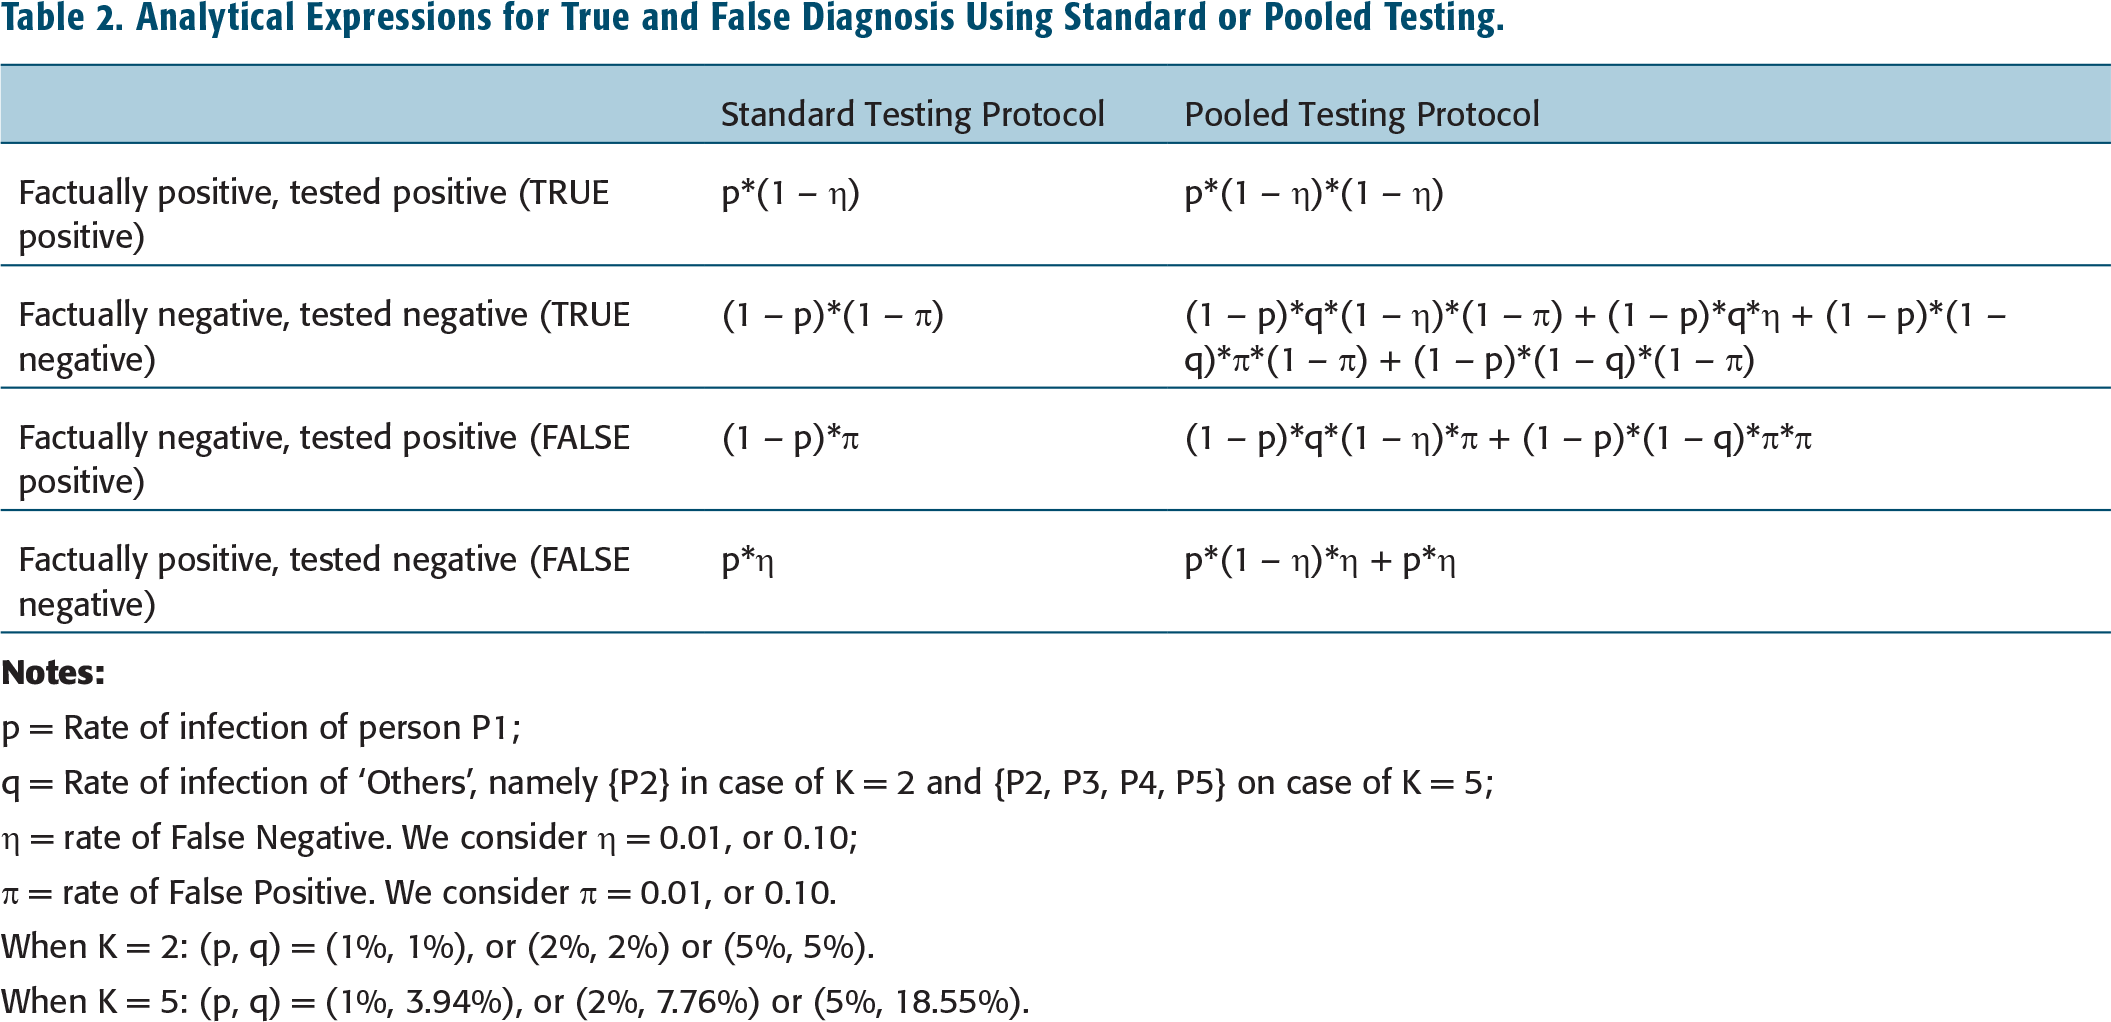
p = Rate of infection of person P1;
q = Rate of infection of ‘Others’, namely {P2} in case of K = 2 and {P2, P3, P4, P5} on case of K = 5;
η = rate of False Negative. We consider η = 0.01, or 0.10;
ύ = rate of False Positive. We consider ύ = 0.01, or 0.10.
When K = 2: (p, q) = (1%, 1%), or (2%, 2%) or (5%, 5%).
When K = 5: (p, q) = (1%, 3.94%), or (2%, 7.76%) or (5%, 18.55%).
Diagram Depicting State Resulting after Stage 1 from Standard Testing Protocol.
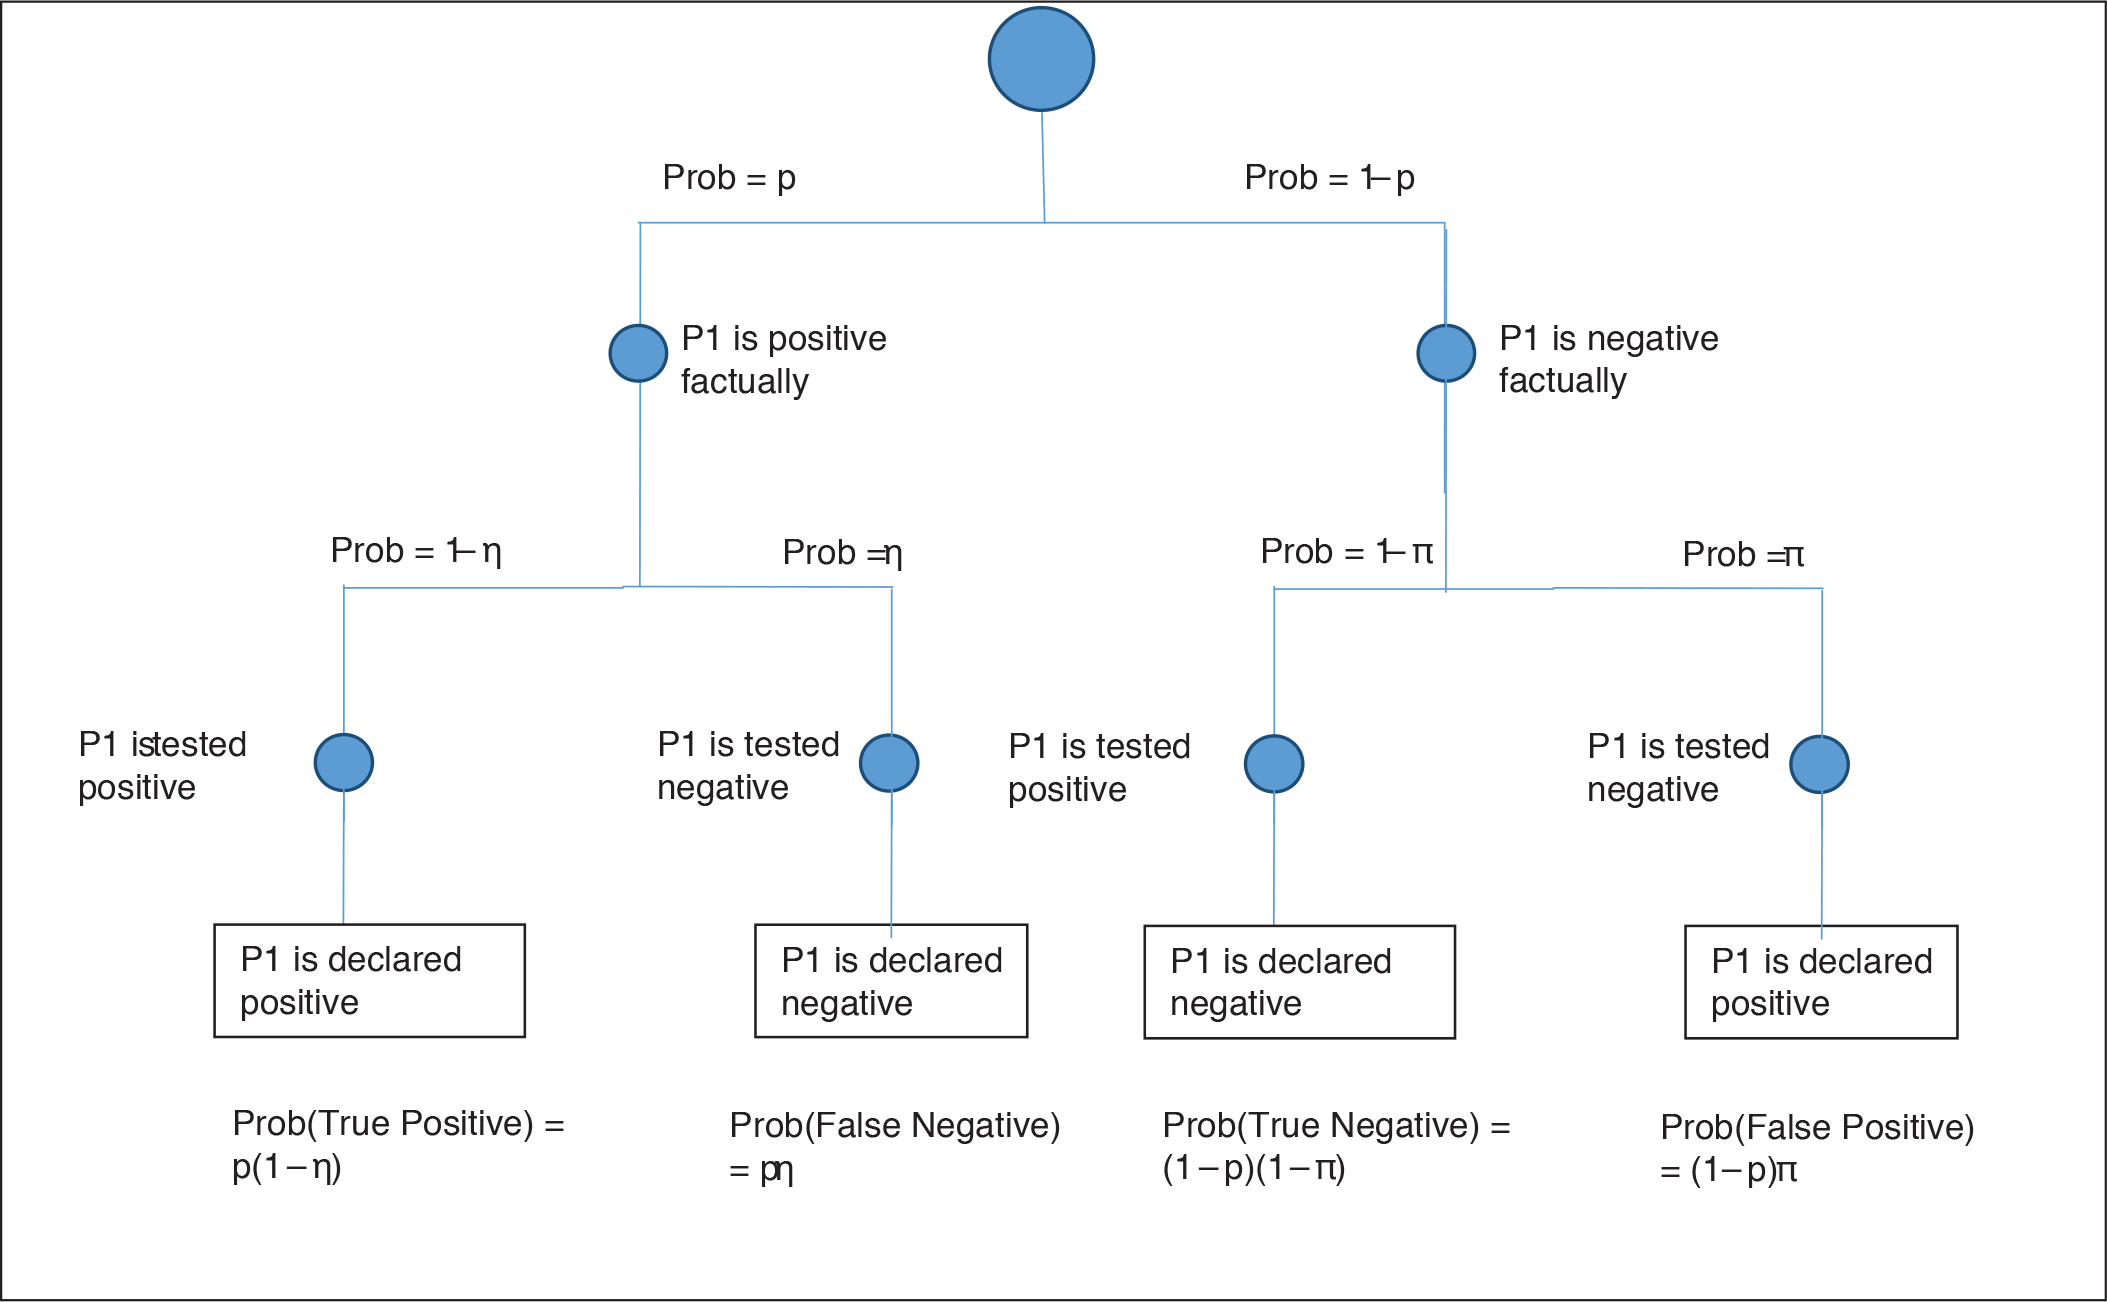
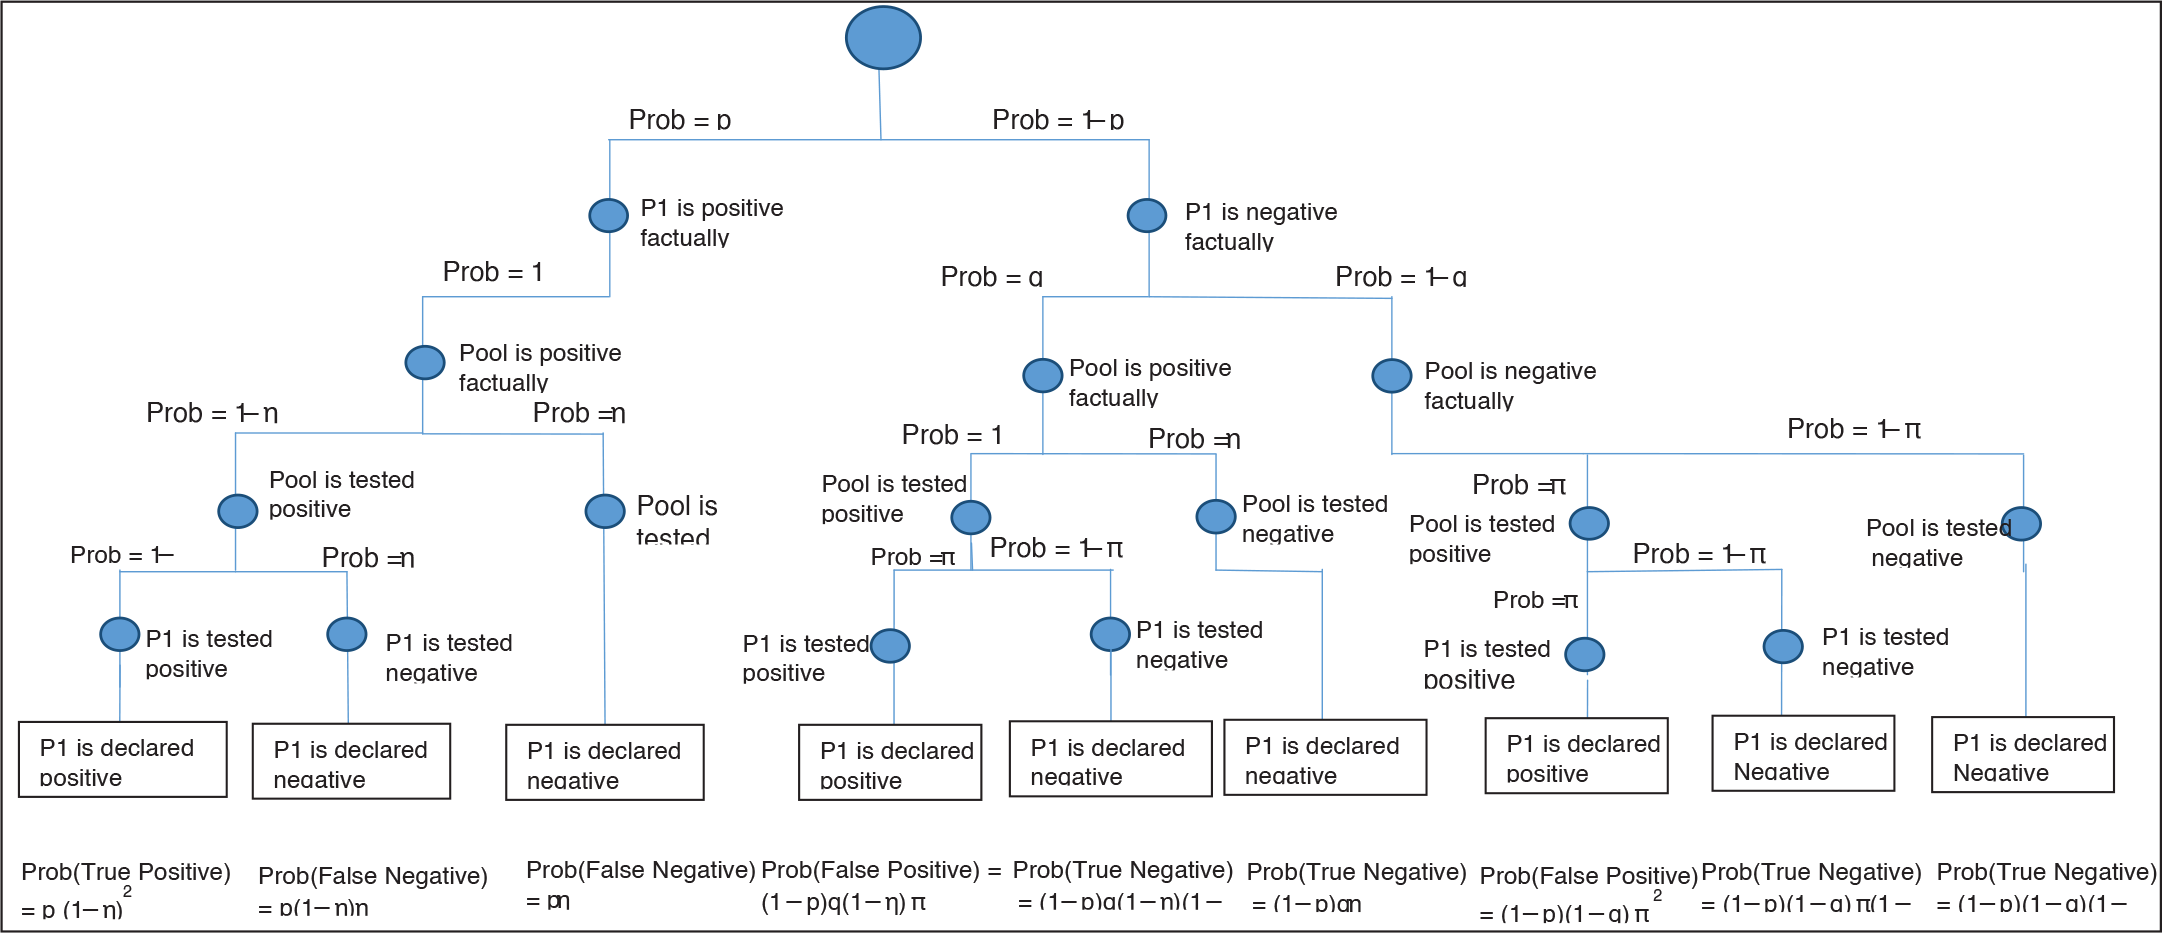
Diagram Depicting State Resulting After Stage 1 and Stage 2 from Pooled Testing Protocol.
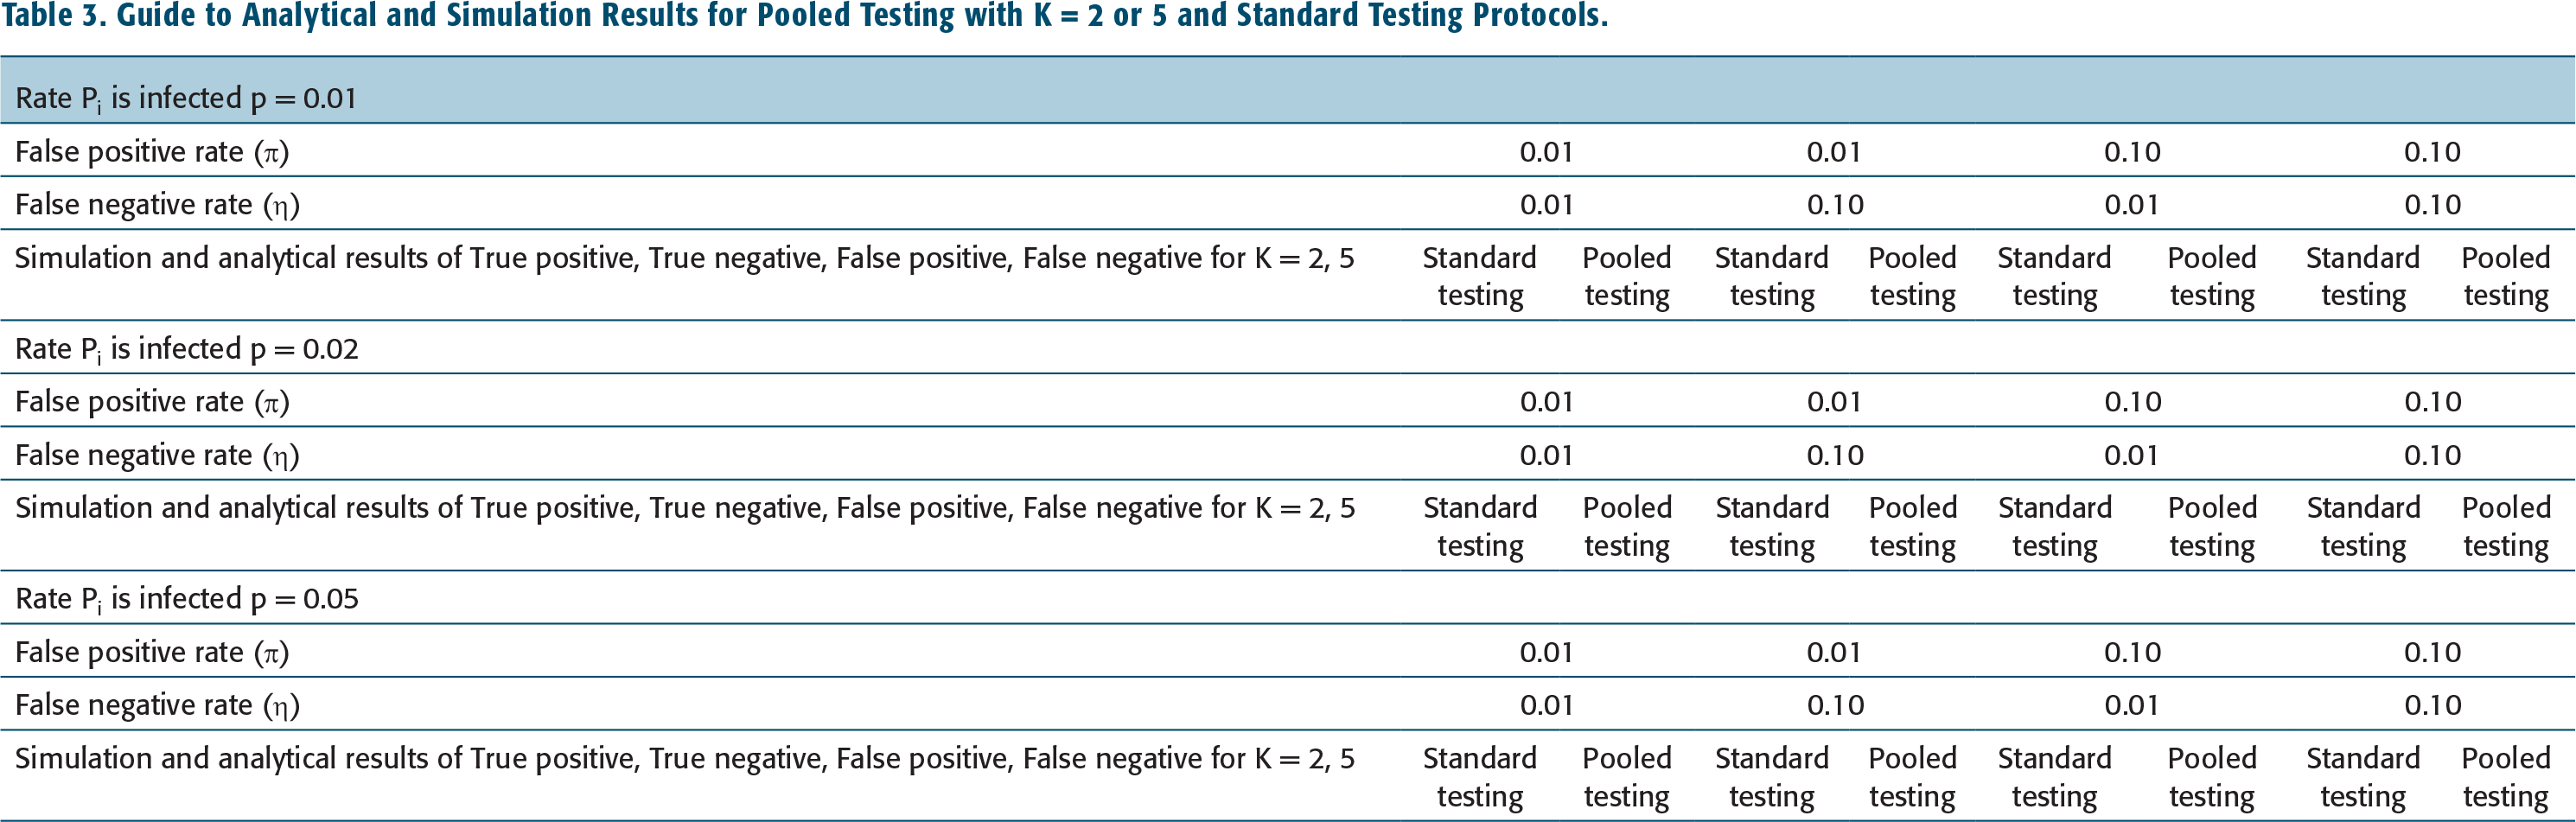
Guide to Analytical and Simulation Results for Pooled Testing with K = 2 or 5 and Standard Testing Protocols.
Infection Rate, p = 0.01 and K = 2.
Infection Rate p = 0.02 and K = 2.
Infection Rate p = 0.05 and K = 2.
Infection Rate p = 0.01 and K = 5.
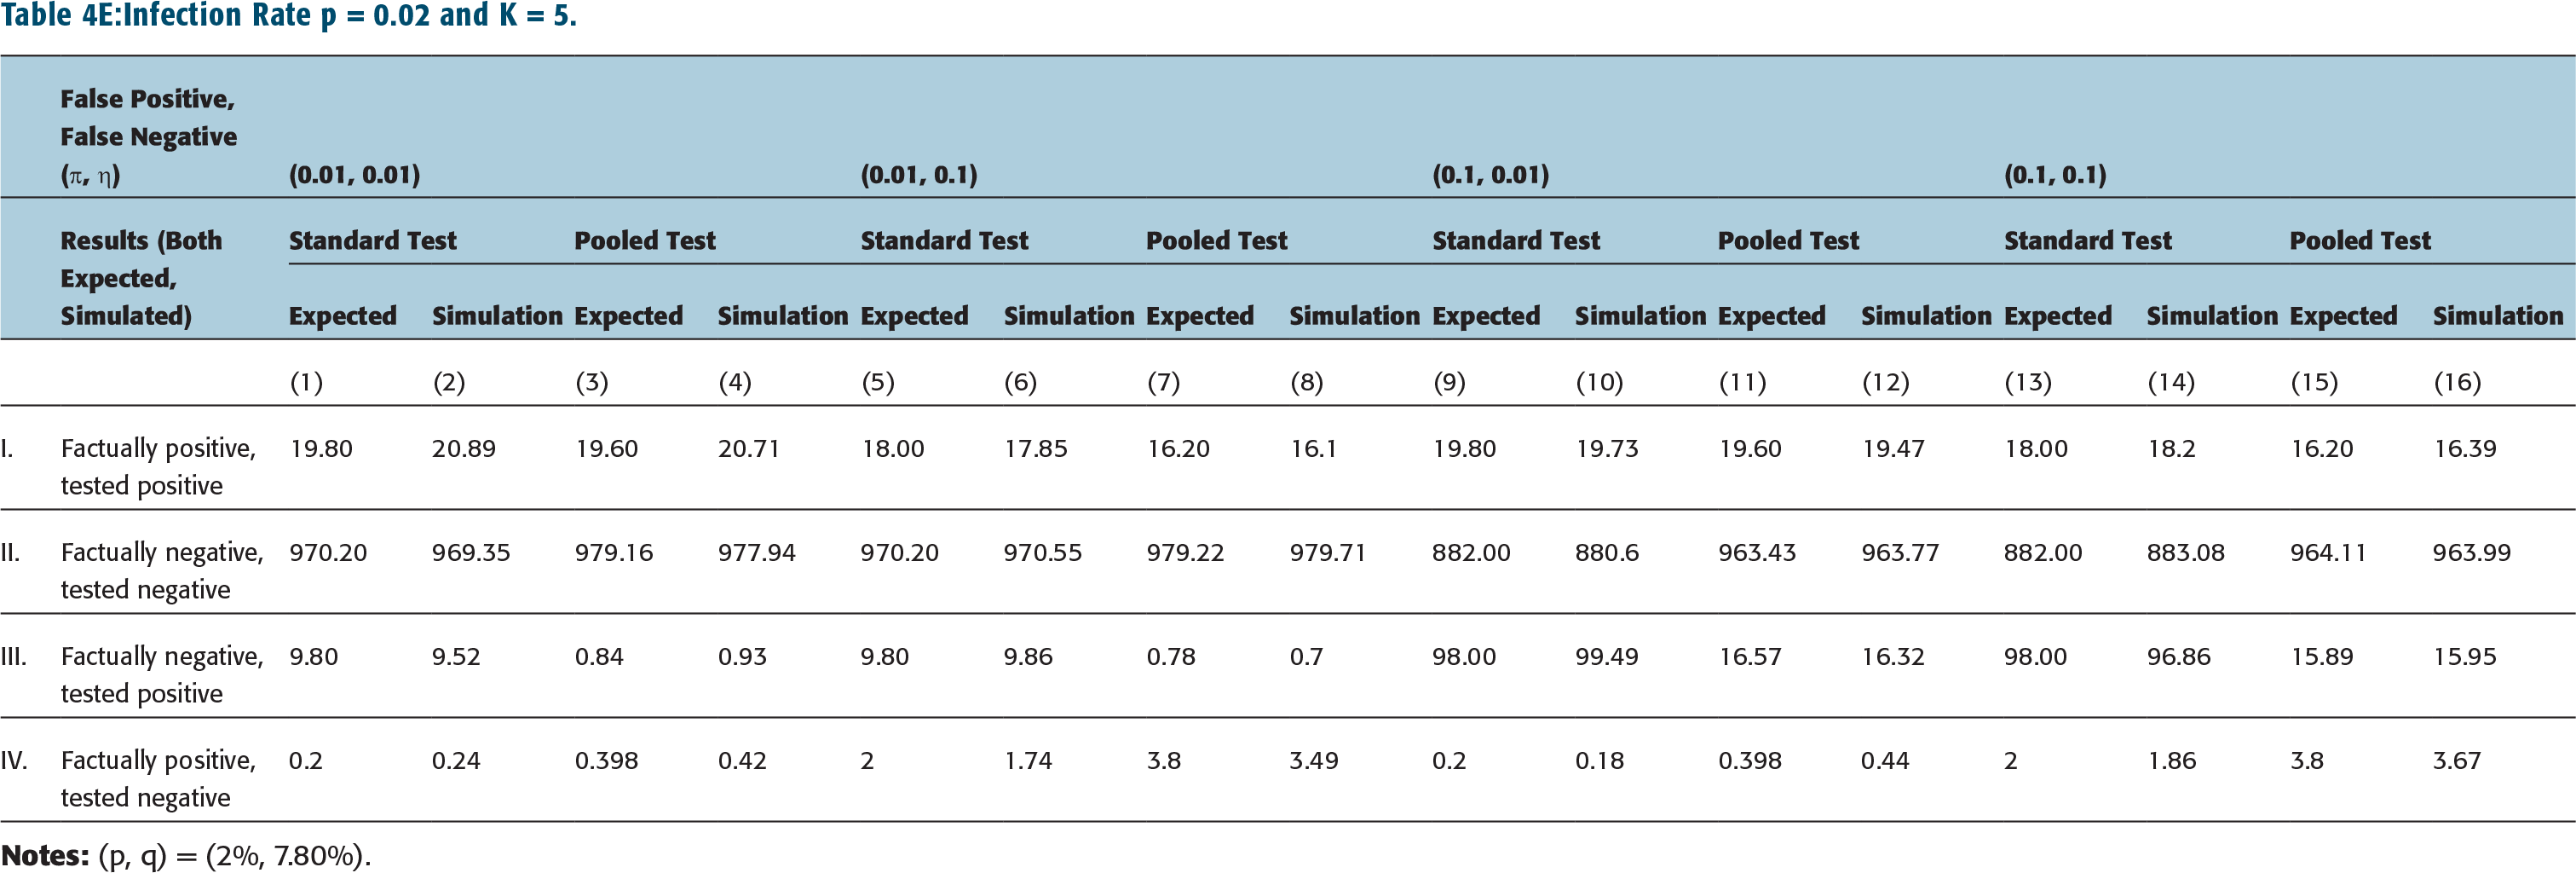
Infection Rate p = 0.02 and K = 5.
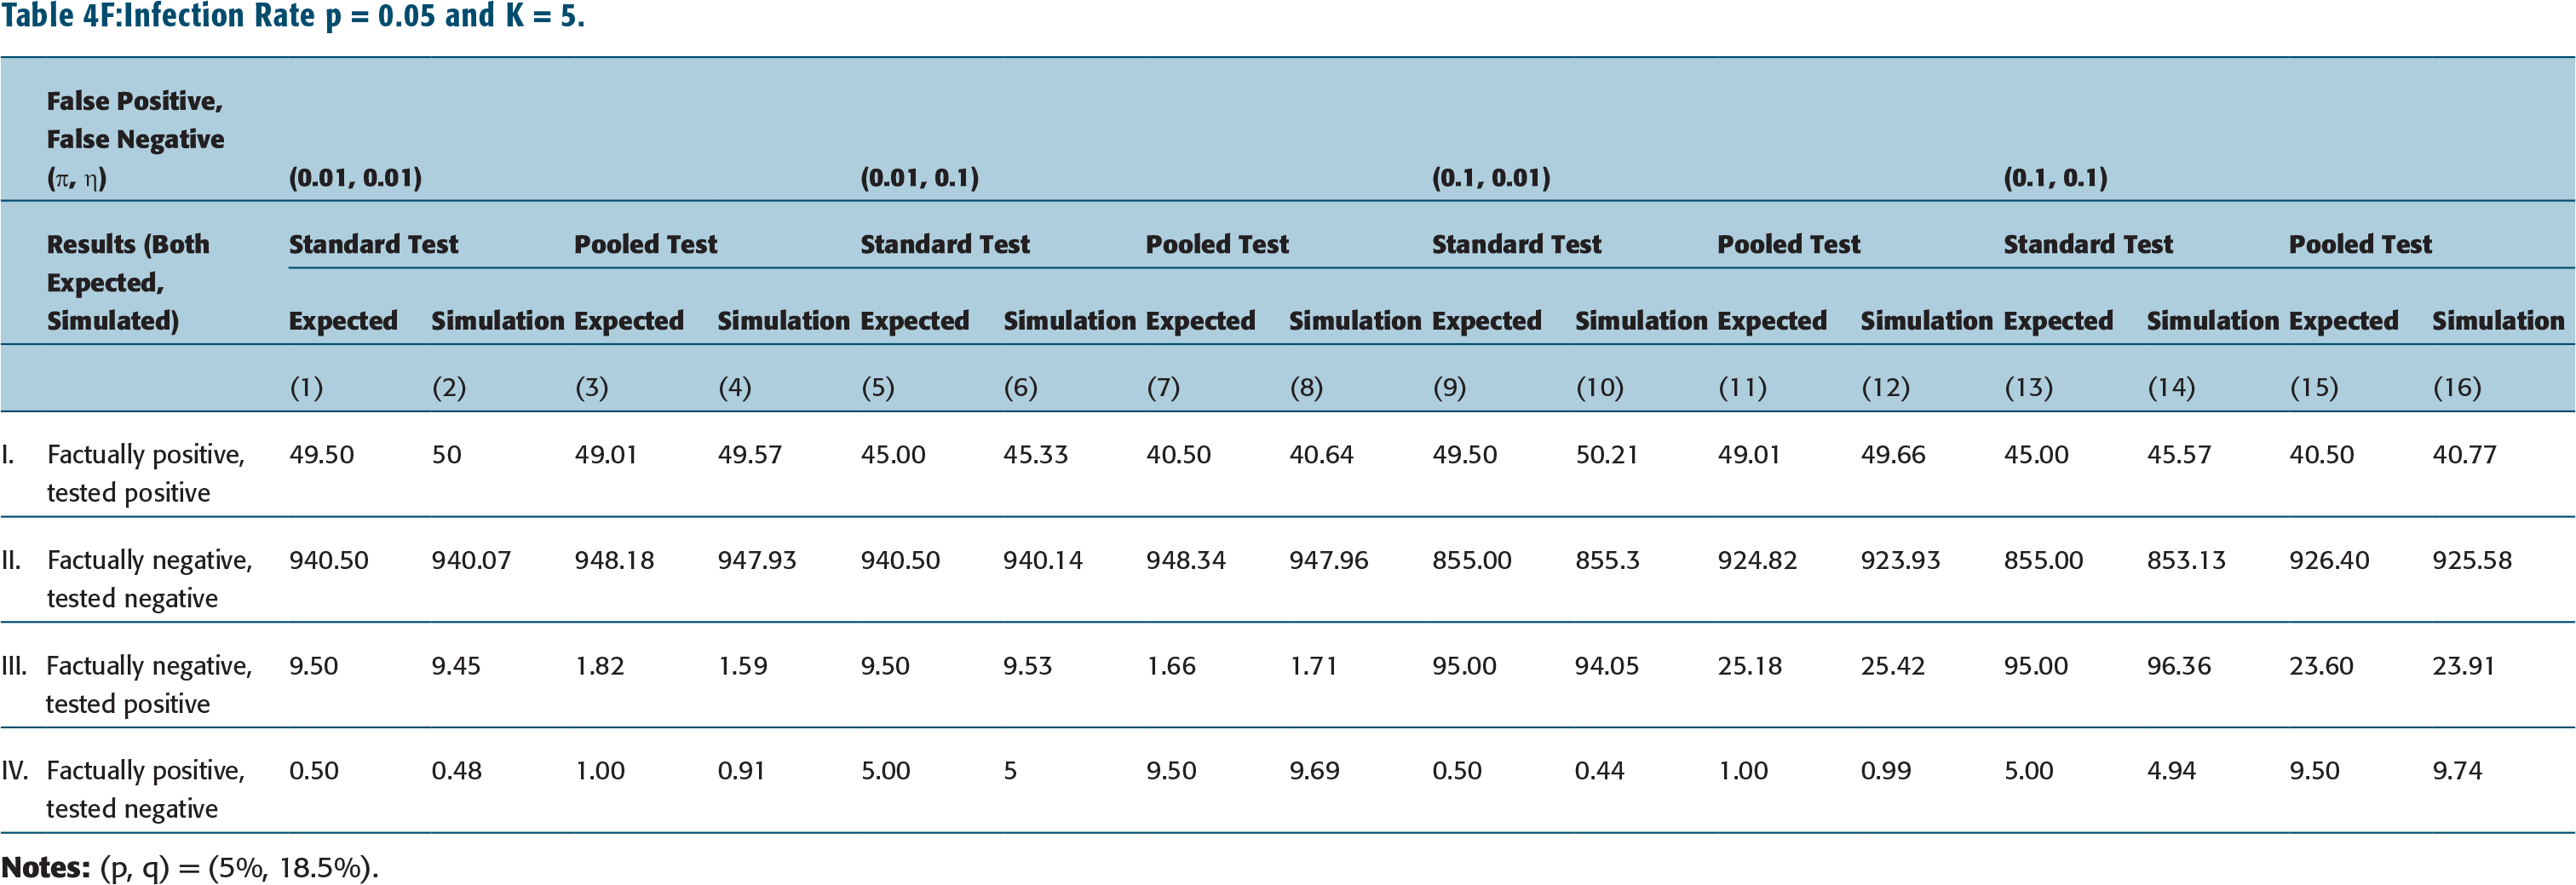
Infection Rate p = 0.05 and K = 5.
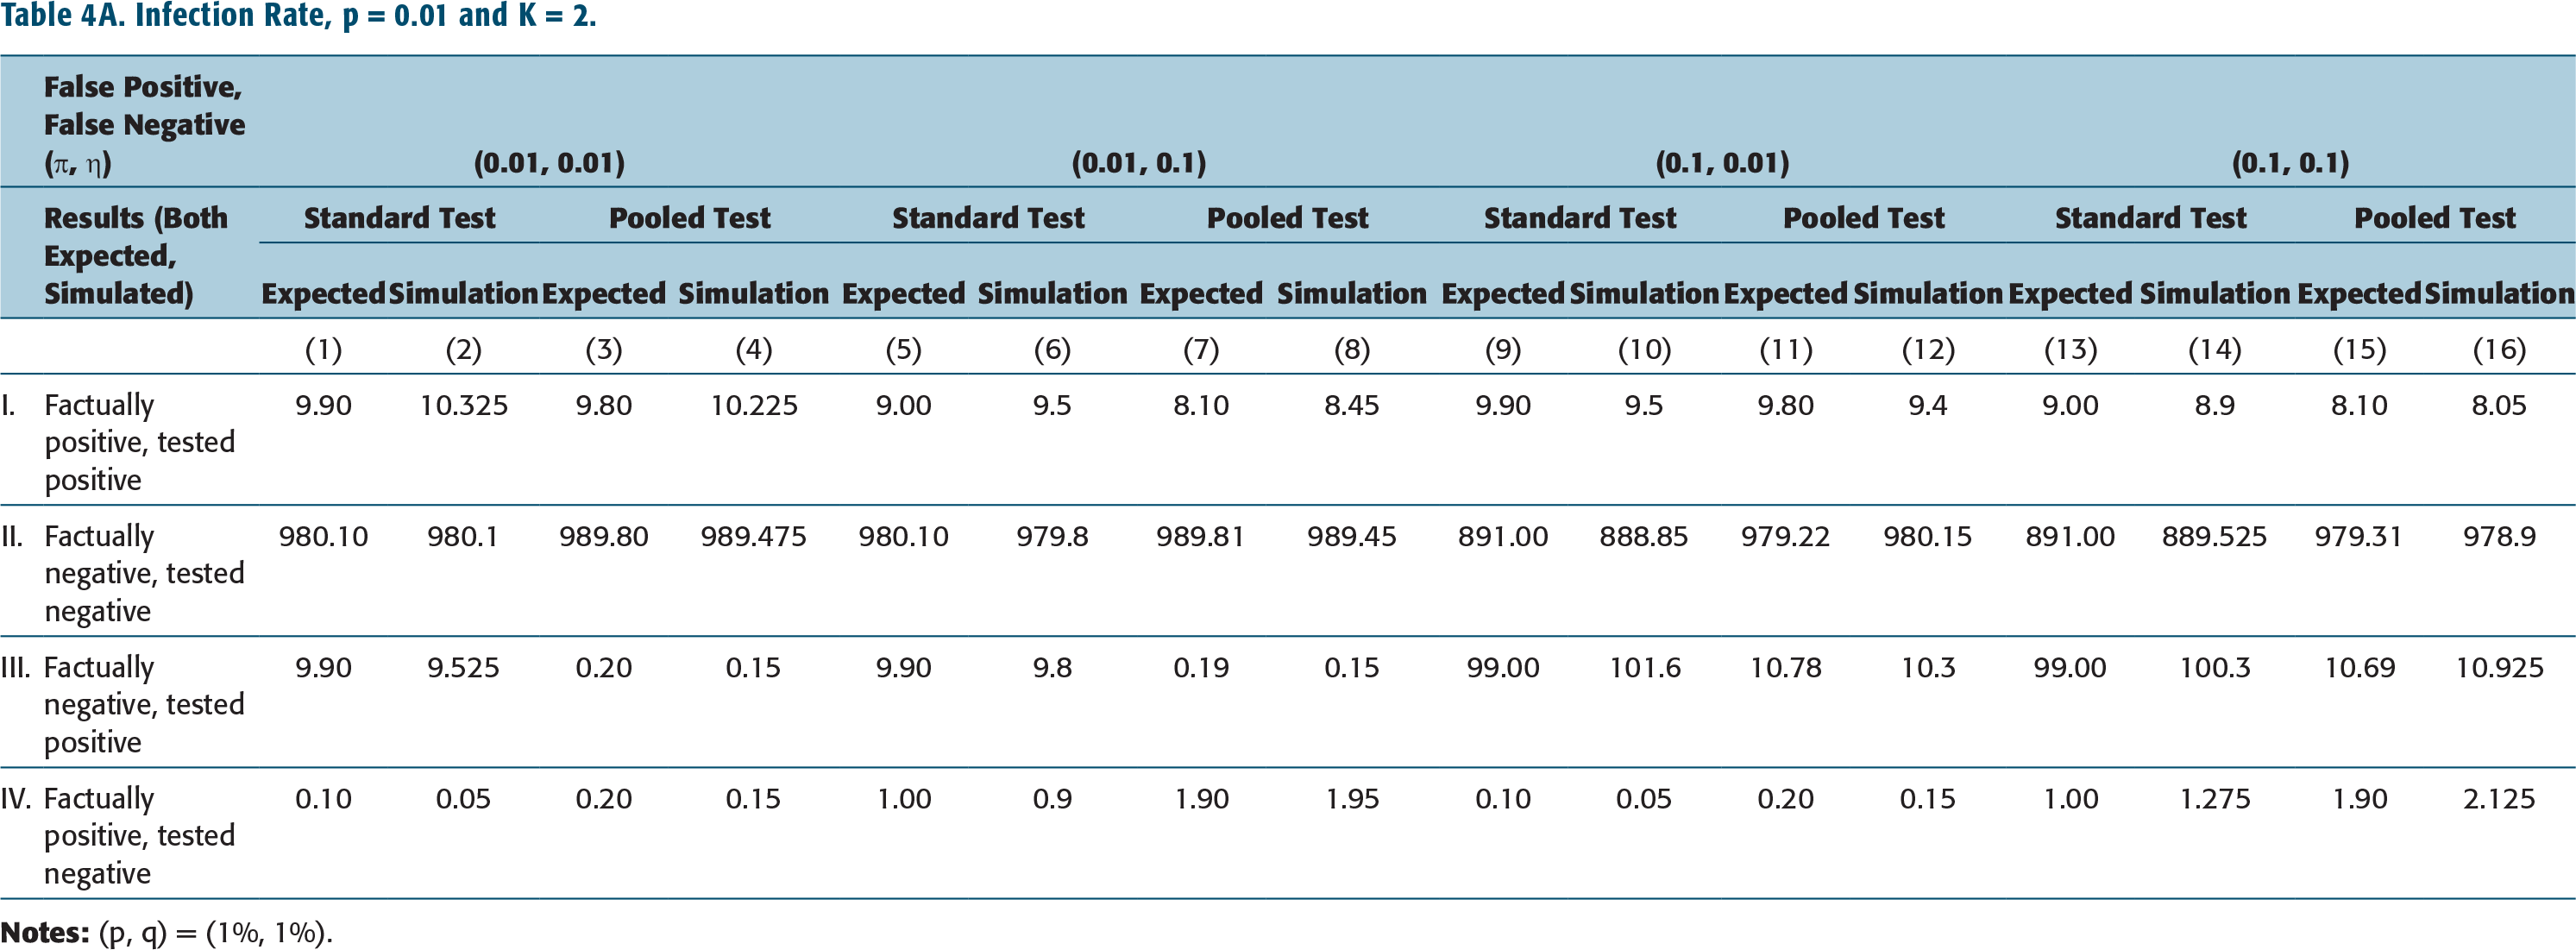
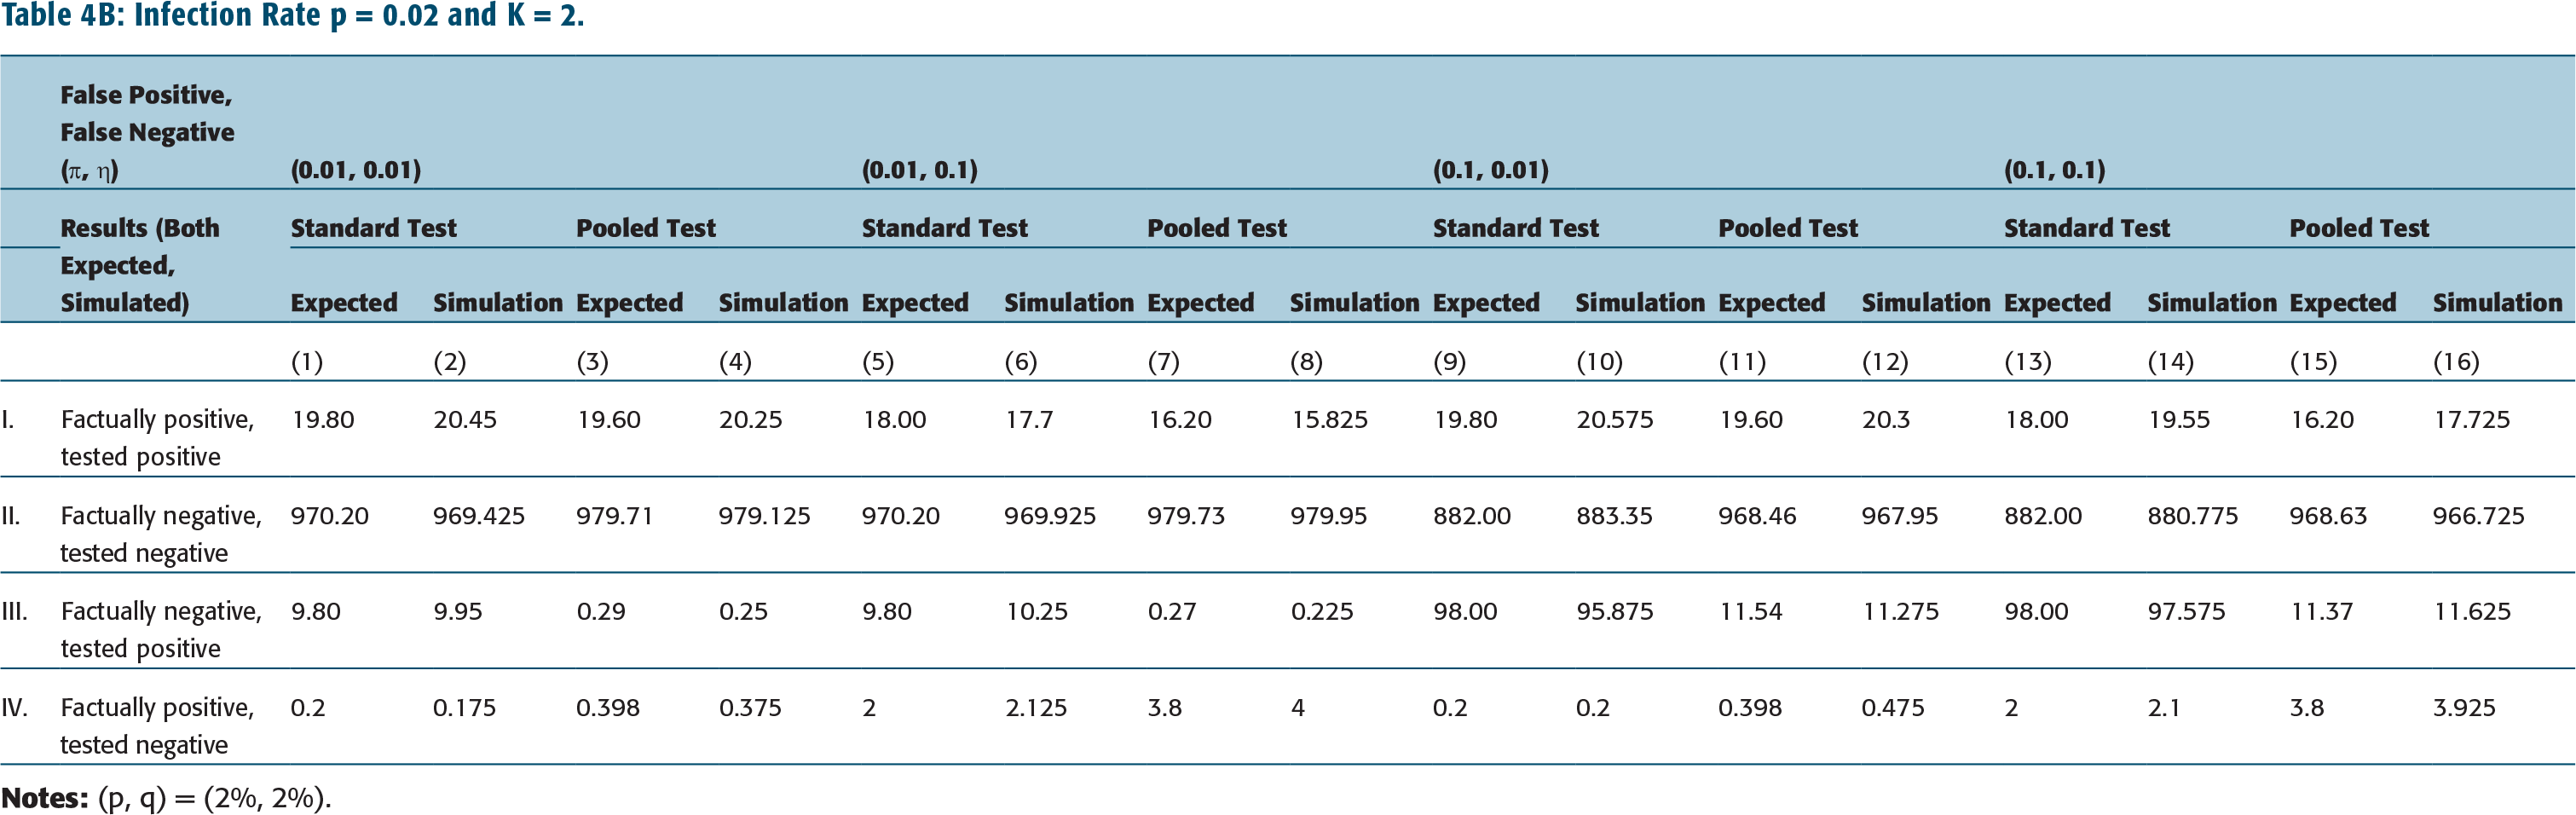
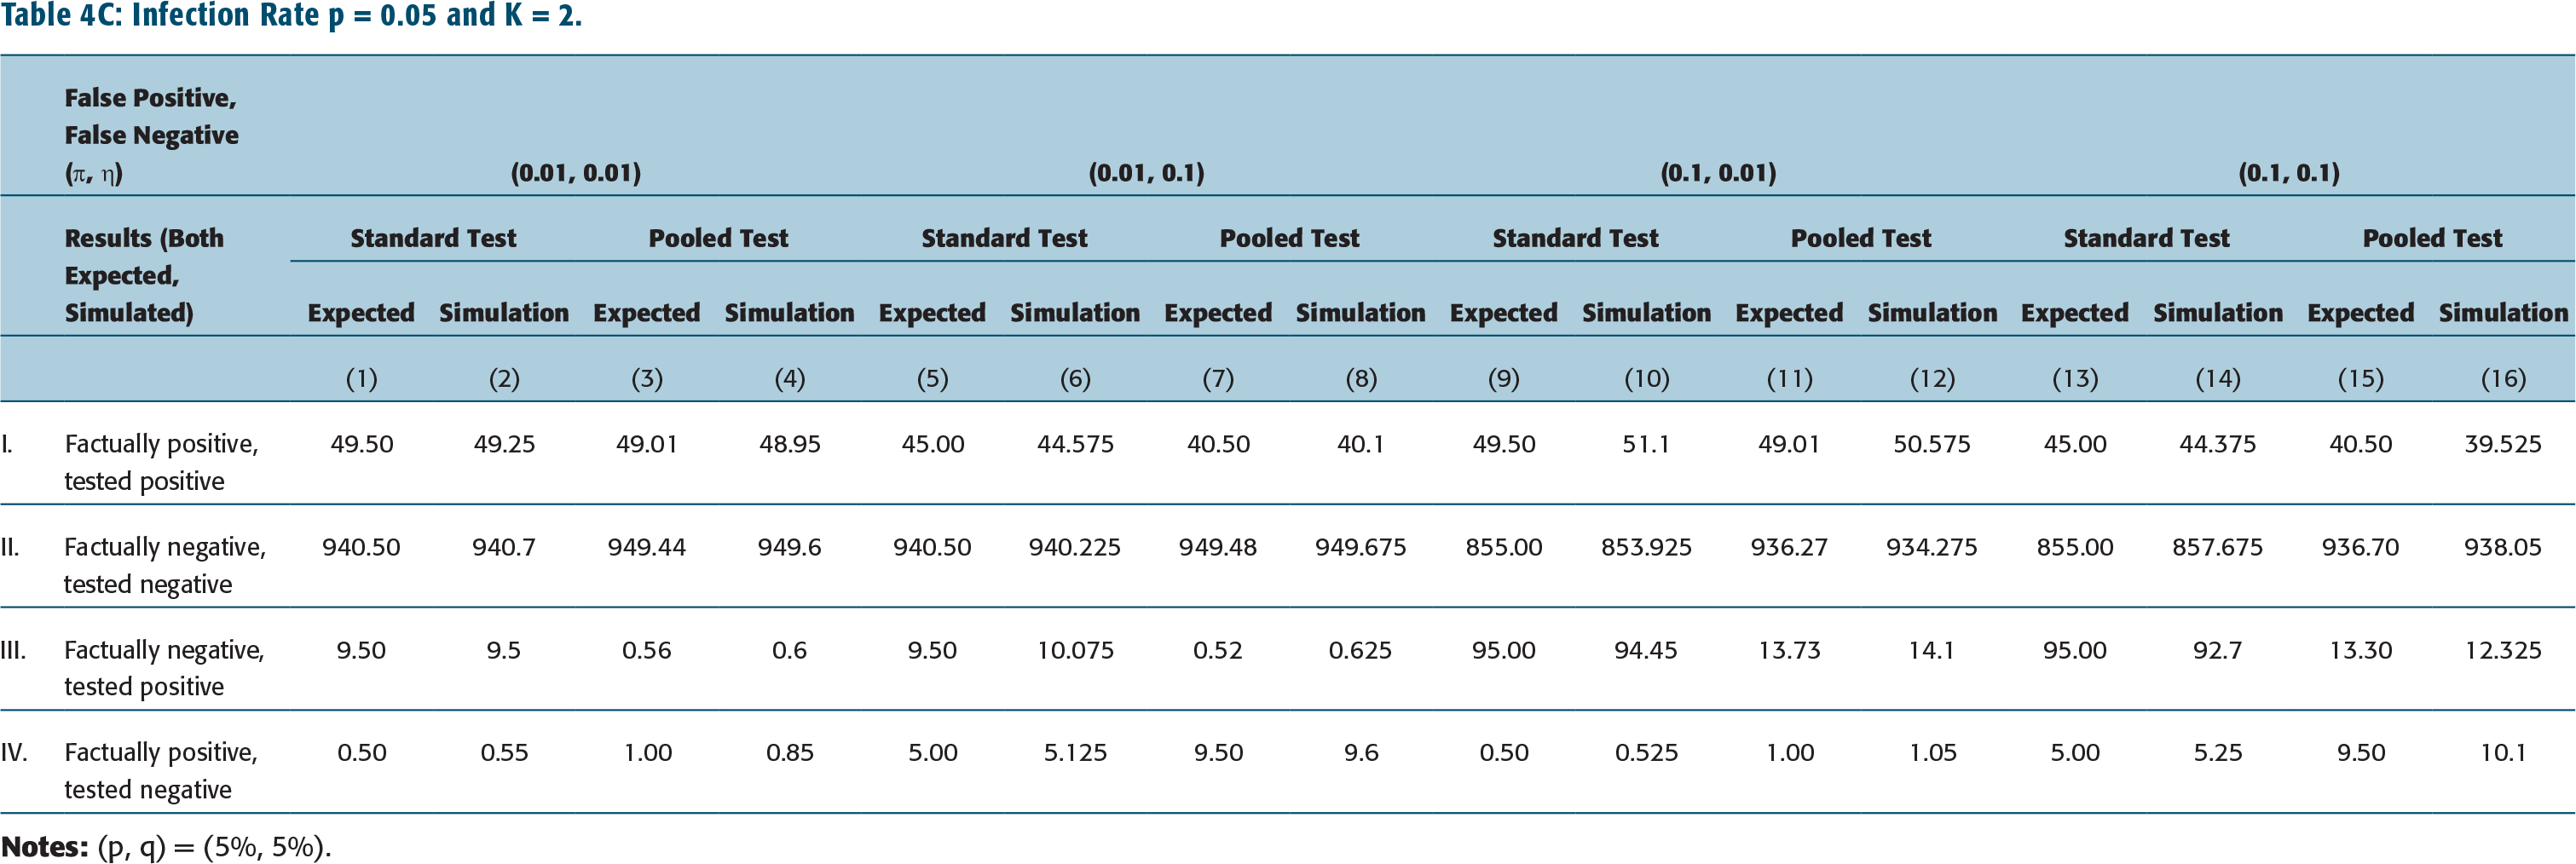
The impact of standard testing protocol is shown in columns 1, 5, 9, 13 in Tables 4A–Table 4C (and in Tables 4D–4F as well). These are to be compared with results corresponding to pooled testing protocol given in columns 3, 7, 11, 15 of Tables 4A–4C (for K = 2) or columns 3, 7, 11, 15 of Tables 4D–4F (for K = 5). (Note all numbers are shown as numbers tested positive or negative out of 1,000 samples.)
Simulation Results
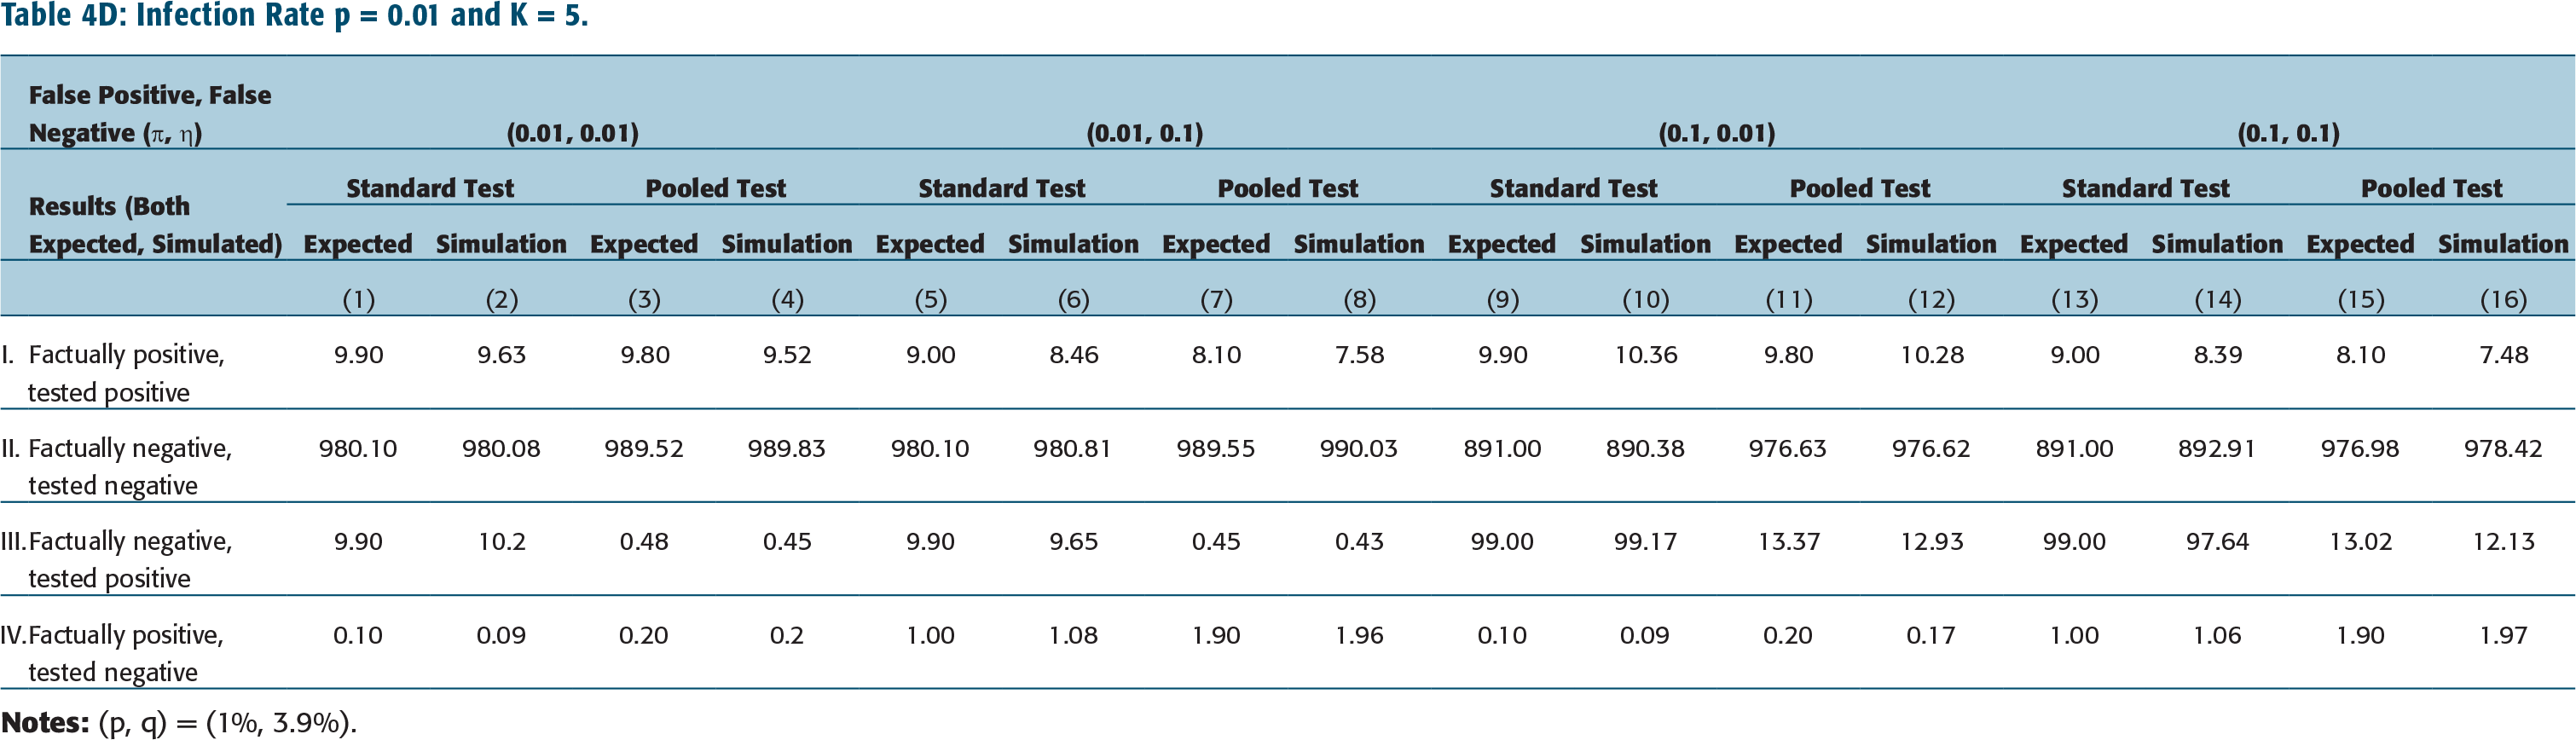
We have also simulated the standard testing protocol and pooled testing protocol, the latter with pool size K = 2 or 5, and different rates of infection, p, rates of false positives, ύ, and false negatives, η. The results, using 20,000 samples, are tabulated in columns 2, 6, 10, 14 in Tables 4A–4C for Standard testing protocol, and in columns 4, 8, 12, 16 of Tables 4A–4C (for K = 2) or columns 4, 8, 12, 16 of Tables 4D–4F (for K = 5).
We briefly describe the simulation of the Standard Test Protocol: If a patient P1 is truly infected, with probability p = 0.01 (or with p = 0.02 or0.05), she is declared negative falsely with probability η = 0.01 (or 0.10), else she is (correctly) declared positive. If patientP1 is (truly)not infected, with probability (1 – p) = 0.99 (or with (1 – p) = 0.98 or 0.95), she is declared positive falsely with probability ύ = 0.01 (or 0.10), else she is (correctly) declared negative. And, similarly for patients P2, P3, P4 and P5.
q = Rate of infection of ‘Others’, namely {P2} in case of K = 2, and {P2, P3, P4, P5} on case of K = 5
In the simulation for the pooled test protocol, if all patients are truly negative, then the simulation returns (in stage1) a positive test result falsely with probability ύ = 0.01 (or 0.10). Else, the simulation (correctly) declares all patients P1, P2, …, P5 to be uninfected. In the former case, P1, P2, …, P5 are tested separately in Stage 2. In the latter case, no further testing is required.
In case any one, or combination of P1, P2, …, P5 are truly positive, the simulation returns in Stage 1 a negative test result falsely with probability η = 0.01 (or 0.10), and no further testing is required. Else, when the test returns in Stage1 a positive result, P1, P2, …, P5 are each tested separately, and the simulation method of the standard protocol applies.
Observations
We first observe that in all cases, namely standard or pooled testing protocols, pool size K = 2 or 5, infection rate p = 0.01, 0.02 or 0.05, false negatives η = 0.01 or 0.10, and False positives ύ = 0.01 or 0.10, the simulation results are consistent with the results from the analytical expressions.
Now let, for instance, pool size K = 5, infection rate p = 0.02 and false negative rate η = 0.01. It is observed that for pooled testing protocol, the expected number of false positives increases from 0.84 in 1,000 to 16.57 in 1,000 with an increasing false-positive rate from ύ = 0.01 to 0.10. (See row III, columns 3 and 11 Table 4E.) Furthermore, if false positive rate ύ = 0.01, false negative rate η = 0.01, the expected number of false positives increases from 0.48 in 1,000 to 1.82 in 1,000 with infection rate increasing from p = 0.01 to p = 0.05. (See row III, column 3 in Tables 4D and 4F.) Both these results are to be expected.
Similarly, and as expected, for pooled testing protocol, the expected number of false negatives increases with increasing false negative rate, or η increases from 0.01 to 0.10. It also increases with the rate of infection, p. (See row IV, columns 3 versus 7 and columns 11 versus 15 of Tables 4A–4C for K = 2, and of Tables 4D–4F for K = 5.) This trend is true with standard testing as well.
We observe, from this analysis, that the expected number of false positives are significantly lower for the pooled testing protocol (with pool size K = 5) when compared to standard protocol—compare 16.57 in 1,000 false positives for pooled testing versus 98.00 in 1,000 for standard test protocol when infection rate is p = 0.02, rate of false positives ύ = 0.10 and rate of false negatives η = 0.01. (In particular, see row III, columns 11 versus 9 in Table 4E.) The above observation is somewhat more pronounced when the pool size is smaller—the false positive is now 11.54 in 1,000 for K = 2 versus 16.57 in 1,000 for K = 5. (See, for instance, Table 4B, row III, columns 9 and 11.) This is reasonable since Prob(false positive) depends on q = rate of infection of ‘others’, namely {P2} in case of K = 2, and {P2, P3, P4, P5} on case of K = 5 (see Table 2).
However, the expected number of false negatives are nearly twice as large for pooled testing protocol when compared to standard test protocol-compare 0.398 in 1,000 false negatives for pooled testing versus 0.20 in 1,000 for standard test protocol when K = 5, infection rate p = 0.02, rate of false positives ύ = 0.10 and rate of false negatives η = 0.01 (see in particular row IV, columns 9 versus 11 in Table 4E). The increase in False negatives in case of pooled testing when K = 2 is no different from that in case K = 5. (See Table 4B, columns 9 and 11.) This is reasonable since Prob(False negative) is independent of q (see Table 2).
The above observations on the number of false positives and false negatives resulting from pooled testing apply to all cases, namely size of pool K = 2 or 5, infection rate p = 0.01, 0.02 or 0.05, and false negatives η = 0.01 or 0.10, false positives ύ = 0.01 or 0.10.To understand this, we need to work with analytical expressions for true/false positives or negatives and for both the standard test protocol and the pooled test protocol.(See rows III and IV, columns 1 vs. 3, 5 vs. 7, 9 vs. 11, and 13 vs. 15 in Tables 4A–4F.)
Following the pooled testing protocol with K = 5, a person P1 may be falsely tested positive if P1’s sample when pooled together with that of person P1, P2, P3, P4 is correctly tested positive, but P1 is subsequently tested positive falsely. Or she may be falsely tested positive whether when her sample, when pooled together with that of P2, P3, P4, P5 is incorrectly tested positive, and P1 is subsequently tested positive falsely in stage 2. Consequently, false positives are significantly lower for pooled testing protocol compared to the standard test protocol. This is borne out by the analytical expression for false positives, namely Prob(false positive) = (1 – p){q*(1 – η) + (1 – q)*ύ}*ύ.
On the other hand, false negatives are nearly twice as large for pooled testing protocol since a sample from P1 may be tested negative either when the pool of all five samples is falsely tested negative or, otherwise, the sample from P1 is falsely tested negative in stage 2. This is also evident from the analytical expression for false negatives, namely Prob(false positive) = p*η*(2 – η).
In summary, the decrease in false positive outcomes on switching to the pooled testing Protocol, together with savings on the number of test kits, is a significant advantage of the pooled testing protocol. However, and this is very significant, a near doubling of false negatives should be of great concern with pooled testing, particularly when the infection rate is high, or when the rate of false negative is high.
POLICY APPLICATIONS
The analysis in previous sections suggests the principles to apply when considering applications of pooled testing protocol for COVID-19 diagnostics. First, pooled testing should be applied to situations where the infection rate is particularly low since the gains from a reduction in required test kits are lost in populations where the infection rate is high. Second, pooled testing should be conducted when the delays associated with longer test cycles are not prohibitive. Third, pooled testing without the second stage can help rule out infections in groups when all individuals are likely COVID-19 negative. Finally, pooled testing can be useful without the second stage where community or group level statistics, instead of individual-level statistics, are required.
Based on these principles, the following illustrate where pooled test protocol can be applied.
Public health authorities and researchers need to know about the spread of infections in the population with limited test kits. This requires large scale testing with samples from randomly selected communities. By pooling samples, public health authorities can dramatically increase the coverage of these tests and make population-level assessments on disease and infection spread. Several applications of pooled testing during pandemics are to rule out infections in a group of individuals. Airline crews are high-risk workers who may spread the infections over long distances. To prevent this, testing and clearing the entire crew before a flight is important. For this, an entire crew could be collectively tested using the pooled test protocol before the flight. If the test of the pooled sample is clear, all can fly. Else, the crew is replaced with another team. Front line medical and health workers face high infection risk that is correlated with others in the same hospital or team. This requires that the group is tested frequently to rule out infections. To save on test kits, medical staff from an entire hospital could be collectively tested every week—if the test is negative, all are clear to work. Else, second stage testing can be used to identify infected individuals for treatment. To restart economic activity after a lockdown, groups of workers at a factory who will subsequently work together, or groups of students at a college or school, could be tested with the pooled test protocol. If the first stage result is negative for several groups, then the factory or school can be reopened, and resources on screening and testing can be saved. The pooled test strategy can be used to identify ‘cold spots’, or places with very low infections, such as self-contained residential campuses.
CONCLUSION
We propose a pooled testing protocol to accelerate infection diagnostics by combining multiple samples and re-testing individual samples only in the case of positive results. The key insight of pooled testing is that a negative result in the first stage implies negative infection for all individuals. Thus, a single test could rule out infection in multiple individuals. We show that this protocol reduces the required number of testing kits, alleviating a key bottleneck for public health authorities in times of pandemics and epidemics such as COVID-19. Our proposed protocol is expected to be more effective when the infection rate is low, which suggests that it is better suited for early stage and large-scale, population-wide testing. However, the protocol also has trade-offs in terms of additional time for testing, as well as an increased number of false negatives.
Footnotes
ACKNOWLEDGEMENT
We thank Tushit Jain, resident of San Diego, CA for creating the simulator to assess impact of the pooled strategy protocol on false positives and false negatives, and for helping interpret the results.
DECLARATION OF CONFLICTING INTERESTS
FUNDING
The authors received no financial support for the research, authorship and/or publication of this article.