
Abstract
Executive Summary
This study presents evidence on time discount rate of forest-dependent communities (FDCs) in the backdrop of the joint forest management program launched by the Government of India in 1990. The study uses data from two regions of the Indian state of Andhra Pradesh—Rayalaseema (a relatively dry forest region with low income) and the coastal region (relatively fertile forest and with higher income). We also identify socio-economic determinants of their patience levels and factors which distinguish the two regions. To elicit individual discount rates of FDCs members and their determinants, we use the choice task design methodology. Members from both regions were found to be highly impatient using the standard choice task design with the revealed time discount rate averaging 800% per annum. Members of FDCs from Rayalaseema were more impatient than their counterparts from the coastal region, although the statistical evidence is weak. We find no association between the income of members of FDCs and their time discount rate for both regions. Membership to caste categories showed a different response in both the regions, with members from the Scheduled Caste category and Other Backward Classes found to have a lower discount rate than those from the Scheduled Tribes category of Rayalaseema region and vice versa for the coastal region. For the coastal region, those with larger family size and heads of households were found to have a lower discount rate.
INTRODUCTION
These changes, helped by aid from the World Bank 1 have enabled FDCs to participate more actively in forest management and undertake community projects involving investment decisions. This has increased the interactions between FDCs and the forest officials and provided the communities with first-hand exposure to financial management. As a result, FDCs have also been often required to evaluate trade-offs between present and future costs and benefits.
There is a fundamental difference in the way societies like FDCs perceive time compared to those living in towns. Those living in towns and cities tend to perceive time as a scarce commodity, precisely measurable even. For rural farmers and communities like FDCs, while time is not scarce, it is unpredictable and jumps into existence during special events like rain, childbirth and marriage (D'Exelle et al., 2012; Mbiti, 1968). While there is evidence on the increased participation of women in forestry activities after the JFM program, for example, in West Bengal (Das, 2011), to our knowledge, there are no studies that have studied the time preference of FDCs.
This study attempts to address that gap by providing evidence on time discount rate of FDCs and its determinants for two geographically distinct regions of Andhra Pradesh. The plan of the article is as follows. The second section reviews the literature on time discount rate of rural, farming and other special communities and its determinants. The third section provides details of the data and the study sample. The fourth section describes the methodology. The fifth section discusses the results and the sixth section concludes the study.
REVIEW OF LITERATURE ON TIME DISCOUNT RATE AND ITS DETERMINANTS
The individual time discount rate is the rate that is required for a person to defer her present consumption to a future time period. In terms of utility, the individual time discount rate measures a person’s preference for immediate marginal utility over expected future marginal utility. A time discount rate of zero implies that the person is indifferent between waiting for the reward in the future and enjoying it immediately. A high time discount rate indicates impatience, a higher inclination for present gratification and a lack of future orientation, while a low time discount rate implies patience, future orientation and a willingness to delay gratification. Mathematically, the time discount rate is defined as the logarithm of the marginal rate of substitution of present consumption over future consumption (Bazelon & Smetters, 1999; Godoy et al., 2004; Kirby et al., 2002).
The discounted utility model suggests that the inter-temporal preferences can be represented by a single discount rate applied to all forms of consumption (be it food or leisure, for example), amounts and horizons (Samuelson, 1937). However, there is widespread empirical evidence showing that observed discount rates are not constant but declining with time, and gains and small amounts are discounted more than losses and large amounts (Frederick et al., 2002). Time preferences have also been found to be different for different horizons, with those for the long-run (promise to quit smoking) often conflicting with the short-run (temptation to smoke one last cigarette), resulting in what is referred to as hyperbolic discounting (Angeletos et al., 2001). The poor have been found to be no different in this regard, with such myopia co-existing with farsightedness for them too (Banerjee & Mullainathan, 2010).
One of the most important determinants of individual time discount rate is wealth. Higher wealth should contribute both to a decrease in individual discount rates as the rich can afford to invest more in human capital (education) and stocks and bonds (Becker & Mulligan, 1997). This seems to be the case, as poor indeed have been found to have a higher discount rate and the rich with a lower discount rate (Andersen et al., 2008; Harrison et al., 2002; Hausman, 1979; Kurz et al., 1973; Lawrance, 1991; Pender, 1996).
To the extent that income contributes to wealth—income would also be associated with higher individual discount rates due to the demand for meeting subsistence needs (Fisher, 1930). The empirical evidence for rural communities on this seems mixed, however. While FDCs in Sinharaja Man and Biosphere Reserve in Sri Lanka have been found to have a high discount rate (Gunatilake et al., 2009), Tsimane Amerindians, who are a foraging and horticultural community in Bolivia, have been found to have low discount rates (Kirby et al., 2002). For the same sample of Tsimane Amerindians, both cash income and wealth have been found to have no effect on the time discount rates—likely due to sharing culture and reciprocity, which weakens the role of wealth and income (Godoy et al., 2004).
Evidence on the role of education is less ambiguous and has been found to decrease individual discount rates (Harrison et al., 2002; Kirby et al., 2002; Read & Read, 2004). On average, higher age is associated with higher discount rates, after middle age at least (Harrison et al., 2002). Looking at age just on its own, however, can be misleading and is best analysed in a context or with covariates (Read & Read, 2004). Responsibility of raising kids increases the need for savings and tends to decrease discount rates, especially for women with more than 2–3 children (Bauer & Chytilova, 2009; Ray & Wang, 2001).
Forest dwellers live in collectivist cultures where there is a high expectation that tribe members will offer financial and material support to members in times of need or income shocks. Hence, there is a decreased need for long term saving. For FDCs, this may further contribute to higher discount rates (Ehmke et al., 2010).
While the above studies assume that the individual discount rates of forest-dependent communities are uniform for all goods and services, Kumar and Kant (2019) offer a different perspective and find that the people’s discount rates in forest management communities are goods-specific. Specifically, Kumar and Kant report that the monthly mean discount rates are 0.67, 6.83, 55.49 and 3.47 for timber, fuel wood, grass and money.
From the evolutionary perspective, high time discount rates may be a natural response to meet present consumption to ward off loss of reproductive vigour and a fear that delayed rewards would benefit only children and not self (Rogers, 1994).
DATA AND STUDY SAMPLE
This study looks at the FDCs of the Indian state of Andhra Pradesh. The forests of Andhra Pradesh, covering roughly 23% of the state’s geographic area, is spread over 6.38 million ha and accounts for approximately 9% of India’s total forest cover. Rich in biodiversity, the forests harbour tribes like the Gonds, Chenchus, Savara and the Yanadi.
The Government of Andhra Pradesh adopted JFM as a tool to rejuvenate the degraded forests in 1992. Since its adoption, 7718 JFM committees, called the Vana Samrakshana Samithis (VSS) in vernacular Telugu, involving approximately 1.54 million people, are functional and managing 1.52 million ha (23.8% of total forest area in the state) of forests. In 2002, JFM was renamed community forest management (CFM), indicating its commitment to encourage deeper community participation in forest management (Andhra Pradesh Forest Department, 2011).
The study sample was spread over four VSS (Sri Venkateshwarapuram, Mangapuram, Goplalpuram and Gadanki) in Chittoor district, one VSS (Indiranagar) in Kadapa district (both districts from the Rayalaseema region) and four VSS (Chedimala, Peddavaram, Apparaothota and Kasumuru) in Nellore district from the coastal region of Andhra Pradesh. The nine VSS were thus geographically dispersed across Kadapa, Chittoor and Nellore over an area span of approximately 175 sq. km. The data was collected during the months of May and June 2013. About 149 VSS members participated in the study. Of these, 75 respondents were from the Rayalaseema region and the remaining were from the coastal region. Henceforth in the study, the two regions are referred to as VSS-R and VSS-C, respectively.
Descriptive Statistics
For each participant from both regions, data on demographic and economic variables like monthly income, age, sex, marital status, number of children, household head or not, family size, years of education, whether managing committee member or not and land ownership were collected.
The members of VSS who participated in the study were primarily middle-aged individuals. There was almost equal participation from both the sexes in the sample. On average, the members of VSS participating in the study were 35 years old. Approximately 52% of the study sample consisted of women, though this varied between VSS significantly. The participants were from households with an average size of four members. The average household income is ₹4168 per month. These income measures vary between the VSS in the study sample.
The average household income in VSS from Rayalaseema is ₹4155 per month while average household income is ₹4182 per month in the coastal region. This indicates that the average household incomes are almost the same in the VSS from the two regions, that is, income distribution is more homogeneous than heterogeneous. This is contrary to the expectation before the fieldwork began that the members of VSS-Coastal (VSS-C) may be earning more than those from VSS-Rayalasemma (VSS-R) due to the former being assigned lands for forest management in a more fertile region. Lack of heterogeneity in income data suggests that the income effect may not be significant (but given the nature of the population, this is not something that can be avoided).
The educational attainment of the members of VSS in the study sample was low. The members of VSS, on average, had just about four years of education. Approximately 43% of the sample in the study did not attend school and had zero years of schooling. Also, 34% of the sample had attained some level of primary education (between one and seven years of schooling) and 14% had completed primary education. No VSS member in the study sample had education beyond the pre-university level (12th standard), and no one had attended a degree college.
The members of VSS are reliant on forestry works under the state-funded JFM program for their livelihood. Overall, approximately 83% of the study sample depended on the jobs under the JFM program. However, there was considerable variation amongst the VSS ranging from 45% (Gadanki VSS) to 100% (Peddavaram, Kasumuru, and Indiranagar VSS). The remaining 17% of the sample consisted of wives who were homemakers, the aged and the infirm who could not undertake jobs in the forests and those dependent on poultry and livestock activities. The members of VSS-C, on average, were more dependent on forestry jobs under the JFM programme than those from VSS-R.
The average land-holding size was 0.33 acres per VSS household. Land is an important asset for members of the VSS, along with bovines, livestock and poultry. The average value of these assets per VSS household is ₹26,972 in the sample, which varies considerably within VSS (there is a significant variation of values of land depending on its fertility and proximity to pucca roads).
The revenue accrued in the bank accounts of these VSS from community forestry projects under the JFM program is perhaps a good indicator of the VSS members’ economic status. As of 31 May 2013, the average revenue deposits for VSS-R is less than ₹3000 and for VSS-C is almost 250 times larger at more than ₹750,000. Besides forestry works under public programs, the members of VSS-C have also benefitted from jobs available in the nearby towns like Nellore (20 km from Chedimala VSS and 29 km from Kasumuru VSS) and Kavali (15 km from Apparaothota VSS and 23 km from Peddavaram VSS).
To an extent, this is true within VSS-R too. As a matter of comparison, S. V. Puram and Mangapuram VSS are situated 6 and 13 kms respectively from Tirupati town in Chittoor district. Gopalapuram VSS, situated 29 km from Tirupati, is running an eco-tourism unit since 2010. Gadanki VSS is situated 47 km away from Tirupati. Indiranagar VSS is situated 16 km away from Kodur town in Kadapa district.
METHODOLOGY
In general, the forests allotted to VSS-R are degraded to a large extent, and hence, community forest plantations in the region have not been entirely successful. The forests assigned to VSS-C, on the other hand, lie in the Nellore district, which is known to have more fertile soil and is more amenable to community plantations.
Given the findings from the literature (Prasad, 2011; Reddy et al., 2004; Reddy, 2010), and the fact that members of VSS-R are part of a poorer region compared to those from VSS-C, we hypothesize that members of VSS-R would exhibit higher discount rates relative to members of VSS-C. We also hypothesized that members of both VSS-R and VSS-C who are poor would exhibit higher discount rates relative to their richer counterparts within the region.
Eliciting Individual Time Discount Rate
To elicit individual discount rates of FDC members and their determinants we use the standard choice task design used for Tsimane Amerindian forest dwellers in Bolivia (Kirby et al., 2002). The question to elicit the individual time discount rate (IDR) of a participant is: Do you prefer ₹100 today or ₹(100 + x) tomorrow, where x is greater than 0? If an individual prefers ₹100 today, her IDR is greater than x% per day and if she prefers ₹(100 + x) tomorrow her IDR is less than or equal to x% per day (Ehmke et al., 2010; Harrison et al., 2002).
As is standard in the literature, we used a front-end delay in this case (of seven days). Payments were made directly by the forest department to mitigate any distrust, increase credibility and render the transaction costs the same for collecting both present and future income (Ehmke et al., 2010; Harrison et al., 2002).
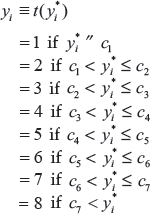
Details of Choice Task Design for Elicitation of Individual Time Discount Rate (IDR).
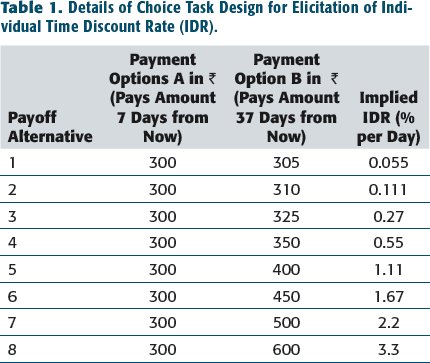
To reward active participation, one of the eight payment alternatives was randomly selected and payment was made according to the option selected for that alternative. The instructions, procedures and choices were all explained in the local language.
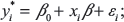
We use hyperbolic discounting to estimate IDR (Godoy et al., 2004; Kirby et al., 2002). The formula used to capture IDR is given by
The way the responses were interpreted is as follows: if the VSS participant selected option A for payoff alternatives 1 and 2 and then switches to option B for payoff alternatives 3 to 8, the IDR is taken to be between 0.111 and 0.27% per day, with the point estimate of IDR taken to be the geometric mean of 0.111 and 0.227, that is, 0.172% per day.
For those participants who exhibited multiple switching, a wider time discount rate interval was used following the principle of adopting the most conservative time discount rate (Coller & Williams, 1999). As an example, for a member of VSS who chose the payment option B in the 2nd row, switched back to payment option A for the 4th and subsequent rows, the most conservative estimate of her time discount rate is considered as her true response (which in this case would be 3.3% per day).
For the sample at hand, six out of the 149 members of VSS switched more than once. There were 17 cases that exhibited inconsistent and random choices like making choices in the reverse direction and alternating between choices on every other row. While interesting in their own right and worth a deeper look, for the purpose of this study, to obviate econometric complications, these were eliminated, leaving the total number of valid responses to be 132.
The implied IDR shown in column 3 suggests an annual rate of interest in the range of approximately 19.8% (for payoff alternative 1) to 1188% (for payoff alternative 8). Local enquiries and the first author's professional knowledge (as an Indian Forest Service officer) reveals that FDCs in the study area borrow and lend small amounts on a simple interest basis with interest ranging from ₹2–₹5 per ₹100 per month (Vaddi in the local language) depending on the volume and frequency of borrowing besides the relationship between the borrower and lender. This suggests a rate of between 24%–60% per annum approximately. The geometric mean of this band (∼38% per annum) is treated as the cut off for classifying members of VSS as having high IDR (impatient) or low IDR (patient).
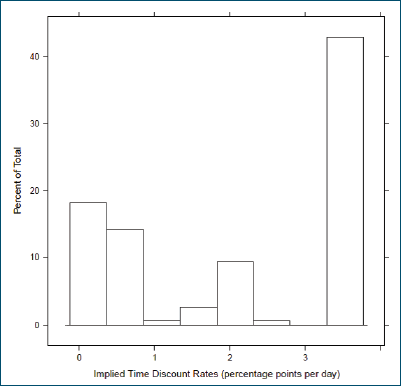
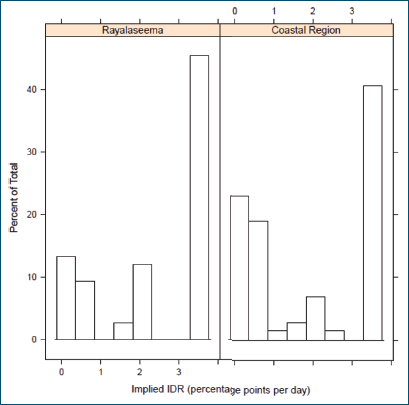
The distribution of IDR of participants for the entire sample is shown in Figure 1, and for individual regions VSS-R and VSS-C separately in Figure 2. Both figures indicate a positively skewed distribution. For the full sample, the average IDR is 2.24% per day, translating to roughly 800% per annum. Compare this with around 100% for rural villagers in Karnataka (Bauer & Chytilova, 2009), 150% for rural Tanzanians in Africa (D'Exelle et al., 2012), and in the range of 5148–6198% for Tsimane Amerindians (Godoy et al., 2004). A visual comparison between the two regions in Figure 2 suggests that VSS-R members were more impatient than those from VSS-C.
Distribution of Impatience of the VSS Members in the Study.
Distribution of Impatience of the VSS Members in the Study, Region-Wise.
Determinants of Individual Time Discount Rate
Given that the choice task design responses are intervals of time discount rate, the use of censored interval regression model is natural (Bauer & Chytilova, 2009; D'Exelle et al., 2011; Harrison et al., 2002). Note that what is observed is whether the IDR falls into one of these intervals and not the IDR itself, so if ordinary least squares (OLS) is used, regression coefficients would not be consistent (Wooldridge, 2002).
The interval regression model is specified as follows:
A function
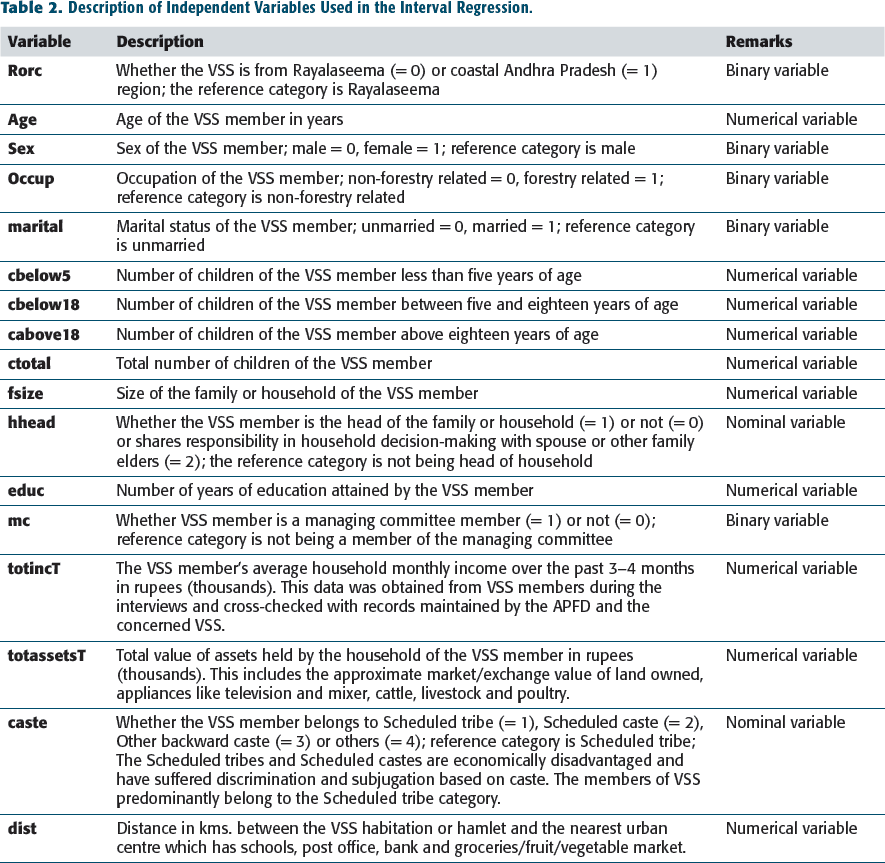
Description of Independent Variables Used in the Interval Regression.
The parameters were estimated using maximum likelihood with Gaussian errors, that is,
RESULTS
Full Sample Interval Regression Results on IDRs of Members of VSS.
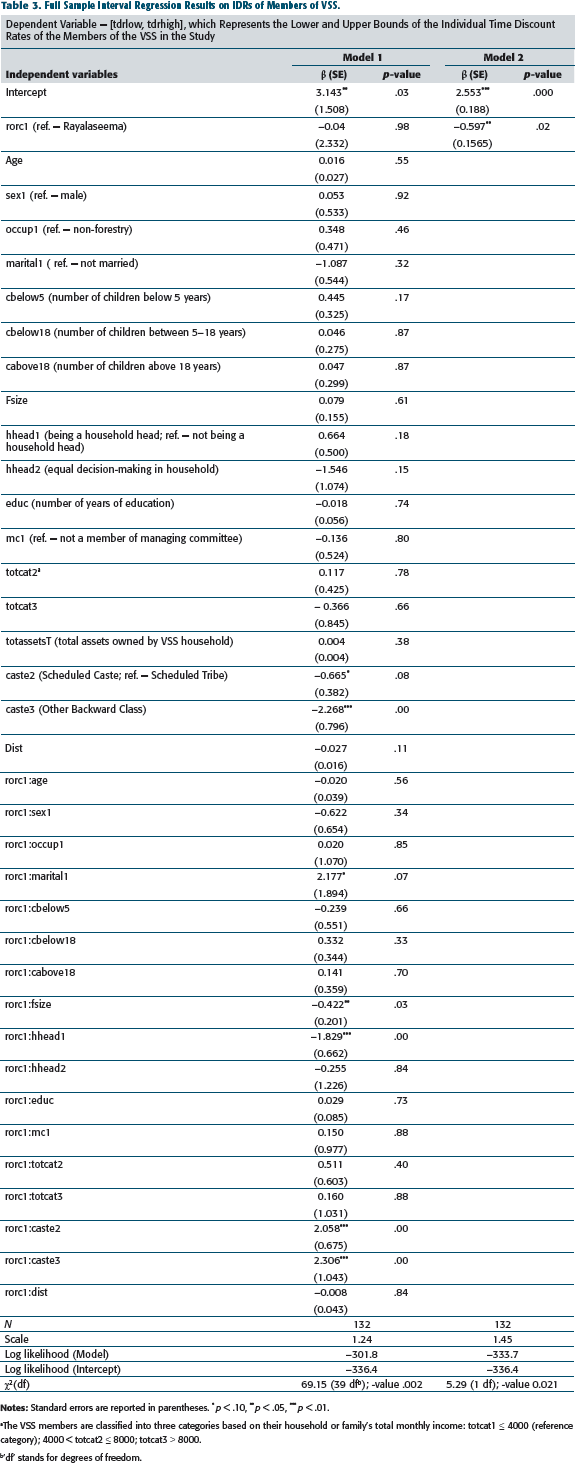
aThe VSS members are classified into three categories based on their household or family’s total monthly income: totcat1 ≤ 4000 (reference category); 4000 < totcat2 ≤ 8000; totcat3 > 8000.
b‘df’ stands for degrees of freedom.
Let us take a look at Model 2 first which is without covariates. The intercept, which represents the average time discount rate of VSS members from Rayalaseema region (rorc = 0) is 2.553% per day (result significant at the 1% level), which translates to 919% annum approximately. The average time discount rate of members of VSS from the coastal region (rorc = 1) is 2.553 – 0.597 = 1.956% per day (p-value < 5%), implying 704% per annum approximately. The model is significant at 5%. The statistic scale with a value of 1.45 is equivalent to the standard error of estimating the model in OLS.
Model 1 shows that after controlling for socioeconomic covariates, on average, members of VSS-C have a time discount rate that is 0.26% per day less than members of VSS-R, but the result is not statistically significant. Both together suggest that VSS-R members have a higher time discount rate, albeit with weak statistical evidence.
Predictors of Impatience in VSS-R
The VSS-R members belonging to the Scheduled Castes and the Other Backward Classes categories are found to have a time discount rate that is lower by 0.60% (p-value = .081) and 2.21% per day, respectively, vis-a-vis the VSS members belonging to the Scheduled Tribes of the reference category. Thus, VSS members belonging to Scheduled Castes and Other Backward Classes are less impatient than VSS member of Scheduled Tribes. Close to 80% of the sample had VSS-R members belonging to the Scheduled Tribes category, which is amongst the most disadvantaged population group in Indian society in important socio-economic indicators like literacy, nutrition, health and employment opportunities (Kumar, 2002).
An important main variable of interest in looking at the determinants of discount rates of FDCs members is their income.
The average monthly household income of the VSS member participating in the study (totincT) is used to classify the member into low, middle or high-income group corresponding to the poor, middle-income or rich members of VSS.
In view of the dependence of the majority of VSS members on daily wage forestry jobs offered by the government, the classification of VSS members is based on the average number of working adults per household, wage rate fixed by the District Collectors of Kadapa, Chittoor and Nellore districts (₹137) and the fact that the public works are available for 15–20 days per month. On this basis, a VSS member from a household earning less than or equal to ₹4000 is treated as belonging to the low-income group. A member of VSS from a household earning more than ₹4000 but less than or equal to ₹8000 is treated as belonging to the middle-income group. Members of VSS from households earning more than ₹8000 are treated as belonging to the high-income group.
The nominal variable totcat represents the three income categories of the members of the VSS and included in the model. The base group is totcat1 which is the low income (poor) group. The nominal variables totcat2 and totcat3 represent the middle income (middle status) and the high income (rich) group.
Ceteris paribus, the members of VSS-R with middle status (totcat2) have a time discount rate that is 0.12% lower (p-value = .78) than the poor members of VSS (totcat1), the reference category implying that members of VSS-R with middle status are more patient than their poor counterparts. The rich members of VSS-R (totcat3) have a time discount rate that is 0.37% lesser (p-value = .66) than the poor VSS-R members, indicating that the rich members of VSS-R are more patient in comparison to the poor. However, the direction of the income effect is on the expected lines; its influence on the IDR is statistically insignificant.
Overall, the income of VSS-R members does not seem to affect their impatience. As far as VSS members from Rayalaseema in the study are concerned, factors like membership in caste groups (Other Backward Class, Scheduled Castes) appear to be the main determinants of their time discount rate.
Predictors of Impatience in VSS-C
With reference to VSS-C, married individuals are predicted to be more impatient and have a time discount rate that is 2.22% per day higher (p-value = .067) than unmarried individuals.
Members of VSS from larger households are less impatient. For every increase in one adult member in the VSS household, a member of VSS from that household is found to have a time discount rate that is lower by 0.42% per day implying that presence of more adult members tends to make VSS-C members more patient.
Members of VSS-C who are household heads are found to be more patient than those who are not household heads (the reference group). The head of household is estimated to have a time discount rate of 1.82% per day lower on average than a member of VSS who is not the head of the household.
All things being the same, members of VSS-C belonging to the Scheduled Castes and the Other Backward Classes categories are found to have a time discount rate that is higher by 2.06% per day and 2.31% per day, respectively, as compared to the members of VSS belonging to the Scheduled Tribes, the reference category. It may be noted that VSS-R members belonging to the Scheduled Castes and the Other Backward Classes showed the opposite effect. While members of VSS belonging to the Scheduled Castes comprised only 14.8% of the sample in VSS-R, this group comprised 50.66% of the sample in VSS-C. While this may be due to lack of in-sample variation with VSS-R against VSS-C, such differences are interesting and worth a deeper look.
As with VSS-R, the income effect on the IDR is statistically insignificant in VSS-C too.
To sum up, there is some evidence that social factors like household size, decision making patterns within the household and membership to caste groups contribute to the impatience levels of members of VSS-C.
The average individual time discount rate for the entire sample is 2.235% per day, implying ∼805% per annum (p-value < .000); 40% of the study sample had revealed IDR between 3–3.5% per day (see Figure 1). Going by the rate at which they typically borrow and lend (at the interest of ₹2–5 per ₹100 per month), VSS members from both regions may be characterized as highly impatient.
The overall model is significant at 1%. The scale statistic (= 1.13), is not only lower than for Model 2 (Scale = 1.45), but is also lower than the standard deviations of both tdrlow (SD = 1.448, N = 132) and tdrhigh (SD = 1.576, N = 132).
As a robustness check, the geometric mean of the individual time discount rate for different intervals was regressed on the regional variable (rorc) with and without socio-economic covariates (Bauer & Chytilova, 2009). The results were similar and are available on request.
CONCLUSIONS AND MANAGERIAL IMPLICATIONS
As of 31 March 2008, about 28,181 JFM committees have been formed across all the 28 states in the country who actively co-managed approximately 1 million ha of forests utilizing ₹15735.7 million (Ministry of Environment and Forests, 2008). Aid agencies, notably The World Bank Group, have provided significant financial aid to India to strengthen the JFM institution, forest rejuvenation and building local capacities.
Due to these interventions, FDCs have had to make investment decisions involving trade-offs between the present and the future. While their risk preferences cannot be ignored while evaluating risk-return trade-offs, it is equally important to understand their subjective discount rates. This study has documented evidence on FDCs' individual discount rate and its determinants using data from Andhra Pradesh from two distinct geographical regions.
The average individual time discount rate from the full sample comprising data from both VSS-R and VSS-C comes out to be 2.24% per day, translating to 805% per annum, indicating high impatience levels. This is similar to the evidence reported for similar communities from Tsimane Amerindians, a foraging community in Bolivia in South America (around 5000% per annum; Godoy et al., 2004), Tanzania in Africa (around 150% per annum; D'Exelle et al., 2012), rural communities in Karnataka (around 100% per annum; Bauer & Chytilova, 2009) and FDCs from Sinharaja Man and Biosphere Reserve Sri Lanka (Gunatilake et al., 2009), suggesting that forest communities, in general, are highly impatient. This is in stark contrast to the evidence on time discount rate for undergraduates in a university in the range of 15–30% per annum (Coller & Williams, 1999; Harrison et al., 2002).
The experiments to elicit discount rates in this study relies on the assumption that the FDCs members are rational, time consistent and not influenced by present bias for money. However, the high discount rates documented in this study indicate that the FDCs members may display a present bias for money. Studies show that people prefer immediate benefits to future benefits, implying an overvaluation of immediate gratification and assigning relatively lesser worth to future benefits. Still, these preferences are reversed when the gratifications are equally (time) delayed (Frederick et al., 2002). Present bias for money exists strongly for immediate payments (Balakrishnan et al., 2017). Thus, present bias could very well be a confounding explanation for the high discount rates observed in the study sample.
The two communities, VSS-R and VSS-C, differed in geographical endowments, with the former belonging to a more arid region and the latter to a relatively more fertile region. The VSS-R members (poorer region) were found to be more impatient than those from VSS-C (richer region), though the results are statistically insignificant. While their monthly household income did not seem to affect their individual discount rate, the important determinants seem to be social factors like marital status, membership to caste groups (like Scheduled Castes, Scheduled Tribes and Other Backward Classes), household size (members from larger households were found to be patient), and decision-making responsibilities within the household (those who are household heads were found to be more patient than those who are not household heads). Much of these results resonate with evidence from studies from other FDCs in the literature (Godoy et al., 2004; Kirby et al., 2002, among others).
An important limitation to our econometric approach in eliciting determinants of discount rate is that the results have not been triangulated with field studies. It is well known in the anthropology literature that field studies do not suffer from ecological validity and that evidence from econometric studies may not always be applicable when faced with new and uncertain circumstances (Frederick et al., 2002).
Also, adjustments to household incomes should be made to account for the proportion of children against aged in the family (who do not contribute to income) and the public goods character of some of the expenses like housing rent, lighting and fuel which have economies of scale (Deaton, 2003), though we could not get such micro-level data for our study.
It is also possible that faced with a different set of payoffs, FDCs’ displayed time preferences may be different. Specifically, if choice A was set at ₹30,000 (instead of ₹300 as done in this study), and we let choice B as ₹30,000 + x; with x ranging from ₹5 to ₹300 (see Table 1), it is possible that the time preferences of the FDCs would be even more biased towards the present. As a direction for further research, future studies may experiment with a range of payoffs to arrive at more robust time preferences of FDCs. Notwithstanding the above possibility, it may be noted that ₹300 (in choice A) was chosen in this study, as this amount constituted the average two days’ earning of a typical member of the VSS. As is typical of such studies, multiples of such daily earnings have been typically used to elicit time preferences of rural and forest communities. (see Bauer & Chytilova, 2009; Godoy et al., 2004).
Yet another limitation stems from the possible endogenous nature of time preferences. As Kumar and Kant (2019) show, the forest communities in a community-based forest management framework do not exhibit homogenous time preferences but have different time discount rates for different forestry goods and services and money. Kumar and Kant conclude that a majority show an infinite discount rate for forestry goods at the household level. Forest dependent communities may display impatience about items of general consumption but show patience on consumption patterns of common property resources like grass ranges. Thanks to the various initiatives of the government, the forest-centred economy of the FDCs is gradually monetized to wean them away from forests in the interests of conservation. The FDCs tend to spend a substantial portion of their incomes on daily consumption items like rice, oil, pulses and salt to supplement their food from the forests. This consumption pattern finds support in several studies (Deaton, 2003; Kumar, 2020). From this perspective, the displayed time discount rates of FDCs for money may be useful for crafting policies and identifying alternative sources for meeting the FDCs’ current needs.
Of late, the governments of many states, including Andhra Pradesh, are experimenting with the distribution of forest land, with property title, to members of forest-dependent communities to improve their economic status (Express News Service, 2019). The high discount rates, implying high present consumption rates, as reported in the study is a cause for concern to policy makers. Viewed from a different perspective, the high impatience levels of FDCs, attributable to present bias for money as concluded earlier, provides a clue for policymakers to vest FDCs with ownership rights over assets that are less liquid than money. The government's move to assign ownership rights over forest lands to FDCs may perhaps be a step in the right direction. Massive financial literacy programs to instil a savings mindset amongst the FDCs seems indicated. On the lines of Kumar and Kant (2019), future research may throw valuable light on FDCs’ time preferences with reference to land assets for possible benchmarking with the results of this study.
Notwithstanding some of the limitations, we believe finding different determinants of individual discount rates for the two communities within Andhra Pradesh is itself exciting. More in-depth surveys from within and outside Andhra Pradesh would help address some of the limitations and throw up other interesting sociocultural patterns. To our knowledge, within India, no one other than Bandi (2013) has studied FDCs since the JFM program in any depth, and there has been no evidence on their behavioural attributes like subjective discount rates and attitudes towards risk (degree of risk aversion). In this study, we have tried to address the former. In a forthcoming study, we provide evidence on the latter.