
Abstract

Keywords
INTRODUCTION
Faculty, Economics Area
Indian Institute of Management Ahmedabad
e-mail:
Faculty, Economics Area
Indian Institute of Management Ahmedabad
e-mail:
World Bank. (2017). World development indicators database. Washington, DC: Author.
Retrieved from http://www.tata.com/tataworldwide/index/At-home-in-the-world
IMF. (2017). India: Staff report for the 2017 Article IV Consultation (Country Report No. 17/54). Washington, DC: Author.
Yet, while being broadly beneficial, rising international integration has also made the Indian economy more vulnerable to external shocks. This was highlighted by the impact on India’s external sector after May 2013, when the US Federal Reserve signalled tapering of its quantitative easing (QE) programme. 4
Basu, K., Eichengreen, B., & Gupta, P. (2014). From tapering to tightening: The impact of the feds exit on India (Policy Research Working Paper 7071). Washington, DC: World Bank.
In this Colloquium, eminent policymakers and economists from international institutions and the financial industry discuss various facets of India’s international integration and the challenges to sustaining growth. Four overarching messages can be distilled from this rich set of essays:
India has progressed significantly along the path of international integration on both trade and finance, despite the perceptions of India being a relatively closed economy; Global integration is largely beneficial, but should be carefully managed to reap the benefits. India’s experience of gradual and calibrated capital account liberalization has helped to shield it to an extent against external shocks, but the events following the Federal Reserve System’s (Fed) tapering announcement in 2013 suggest that with rising global integration, it is important to build adequate buffers and continue implementing sound economic policies; With weak growth and an increase in the protectionist sentiment in several advanced countries, policy coordination among the major economies on international trade and finance is likely to become increasingly difficult. This implies that emerging economies such as India will have to rely to a larger extent on domestic sources of growth; and Policies to enhance India’s growth will need to focus on, in the near term, financial sector reforms to reduce the non-performing assets (NPAs) of Indian banks and the related debt overhang of firms. This will help in resuming the stalled credit cycle and firms will invest in capacity expansion. The focus on sustained implementation of productivity-enhancing reforms and emphasis on macroeconomic stability through prudent monetary and fiscal policies should continue. Over the longer term, it is essential that economic growth is made inclusive by broadening access to education, health care, and social protection, which will improve productivity and drive future growth in an increasingly sophisticated knowledge economy.
The global economy may have gained some traction after the financial crisis of 2008–2009, but it faces several threats to accelerating growth. All these threats are structural in nature and require both strong national responses and effective global co-ordination. Subir Gokarn, Executive Director for Bangladesh, Bhutan, India, and Sri Lanka at the International Monetary Fund (IMF), in his article Challenges to Global Growth discusses four of these factors and draws some policy implications from the analysis. The two-year outlook for advanced and emerging economies shows that the current recovery is far from achieving the growth benchmarks set during the high-growth decade prior to the financial crisis of 2008. The appropriate policy question here is whether this pattern is likely to persist in the medium and long term and what this means for development and welfare aspirations that are closely linked to growth performance. Of several factors suggesting that growth impulses in the global economy in a business-as-usual scenario may be weak, four structural deterrents to growth are discussed: trade, investment, technology, and politics. The author elaborates on each of these factors and goes on to discuss the possible options to negate these four threats. For instance, while discussing response to the threats from declining trade, the author suggests that the dilution of a multilateral framework shifts the focus to meaningful bilateral and regional arrangements. The author emphasizes that if all these factors pose threats to growth, the policy imperative in each country is to find ways to grow when others around it are not.
Can India sustain the remarkable growth rates of per capita income achieved since 1991, which was propelled by rapid capital accumulation, increase in total factor productivity, and fast increase in exports? What will it take for India to avoid the middle-income trap and reach the status of a high-income country in the coming decades? Frederico Gil Sander, Senior Country Economist for India at the World Bank, in his article India Needs Inclusive Development to Sustain Growth explores a hitherto neglected but a highly significant factor that could influence India’s long-term growth prospects—disparity in income, welfare, and opportunities. The author points out that very few countries have successfully escaped the middle-income trap while maintaining high levels of inequality. Although India’s measured Gini index of income inequality is relatively low compared to other countries, there has been large variation in the performance of the states, and the top 1 per cent of India’s population account of more than half of the country’s wealth. He argues that with growing importance of automation and labour-saving technologies, economic growth in future will be driven mainly by higher productivity. The jobs of the future will need highly skilled knowledge workers, which would require broadening access to high-quality education and health care for all Indians and increasing the participation of women in the workforce. Sufficient investment needs to be made in health care and education (especially early childhood interventions) and strengthening social safety net through efficient forms of social protection. All these call for rethinking the delivery of public services and increasing accountability of public service providers to citizens, for example, by restructuring centrally sponsored schemes into a performance-based pact with the states and disseminating performance data so that citizens can hold their service providers accountable.
Integration with the global economy can potentially bring huge benefits to a country. However, it also poses complex challenges for monetary policy management, particularly for the emerging economies. Drawing upon his own experience, D. Subbarao, former Governor of Reserve Bank of India (RBI), in his article Challenges of Making Monetary Policy in a Globalizing World: The Indian Experience presents a brief account of the emerging markets (EMs) response to the capital flow management. He argues that in order to minimize the adverse impact of volatile capital flows, central banks in these countries generally follow a proactive approach and pursue a host of policies. Each policy pursued, nonetheless, is associated with costs. For example, intervention in foreign exchange market to absorb excess capital flows can have far reaching destabilizing impact on the overall economy. Effort to prevent nominal appreciation can manifest credit and asset price bubbles, overheating, high inflation, and thereby a real appreciation of the currency. Other approach like sterilization also imposes high costs—it increases central bank’s balance sheets, adversely affect government’s budget, and commercial banks’ income. Therefore, he advocates a monetary policy strategy that maximizes the economic benefits and minimizes the costs involved.
Emerging economies such as India are facing twin pressures from the ongoing normalization of monetary policies in the USA and increased tendency towards trade protectionism in advanced economies. In his article India and Deglobalization: More Open and Exposed Than You Think, Sajjid Chinoy, Chief India Economist at JP Morgan, argues that contrary to popular perception of India being a relatively closed economy, India’s exposure to international trade has increased significantly in recent decades. Additionally, the sensitivity of India’s export to global growth impulses has also risen, reflecting a changing composition of exports with increasing share of sophisticated manufacturing and services exports (engineering goods, pharmaceuticals, software services), and decline in share of traditional exports such as leather, gems, and jewellery. As a result, according to the author global growth volatility transmits more directly and acutely into India from this changed composition of exports. Moreover, India’s exports to the USA are particularly vulnerable to trade protectionism, with consequent adverse impact on GDP growth. This increased cyclicality of exports implies that de-globalization and slower world trade growth can have significant adverse impacts on India’s GDP growth. He estimates that if export growth of the last five years is maintained, then India’s GDP growth could be lower by a full 2 percentage points compared to the 2000s. In an inhospitable global environment, growth will need to be generated from domestic demand. These will involve public and private investments in physical and human infrastructure, which will require creating fiscal space and reducing the debt overhang on public sector banks and private sector balance sheets.
The substantial inflow of foreign investment in recent years into India is a reflection of its sound growth prospects and implementation of significant policy reforms. However, the volatility of foreign capital flows and possibility of sudden surges and reversals can pose considerable challenges for policymakers. In his article Macroeconomic Challenges of an Open Capital Account, Abhijit Sen Gupta, Economist with the India Resident Mission of the Asian Development Bank (ADB), provides a comprehensive review of India’s integration with global capital markets in the last 25 years, and the associated policy challenges that arise in managing volatile capital flows. He points out that India has been relatively conservative in liberalizing its capital account compared to other emerging economies, but the pace of opening up has increased over time. With increasing integration, there has been an increase in the volatility of private capital flows, particularly of portfolio and other flows, while that of FDI has declined. Taking the specific case of the episode of financial turmoil in the months following May 2013, when the US Federal Reserve signalled tapering of its QE programme, he finds that the impact of capital flow management measures implemented by the Indian authorities was relatively muted and not very successful in achieving the objectives of encouraging inflows and discouraging outflows. A decline in India’s reserve cover (in terms of external debt and imports) played a key role in increasing India’s external vulnerability to external shocks prior to the May 2013 episode. The trade-off between increased access to global capital and the vulnerability due to volatility of capital flows suggest that policymakers in emerging economies may need to be vigilant of developments in the global economy and maintain sufficient international reserve coverage.
Several reputed Indian public and private sector companies have raised local currency financing in international capital markets by issuing ‘masala’ rupee-denominated bonds in recent years. This represents a marked contrast with the past practice of issuing international bonds denominated in the currencies of major advanced economies such as the US dollar, euro, yen and British pound. Increased access to foreign capital and invoicing of trade transactions in Indian rupees can bring substantial benefits to Indian companies, in the form of lower vulnerability to future exchange rate changes. In his article Implications of India’s Integration with the Global Economy: How to Balance the Tradeoffs on the Path to Internationalisation, Saugata Bhattacharya, Senior Vice President and Chief Economist of Axis Bank, explores the prospect of internationalization of the Indian rupee in trade and foreign exchange transactions. Taking the example of the carefully planned approach followed by China in developing the necessary financial infrastructure and policies for the Renminbi’s (RMB) gradual internationalization, he argues that the process for the rupee’s internationalization will require sustained efforts by Indian policymakers over the medium term, maintaining sound macroeconomic policies, and raising India’s sovereign creditworthiness.
During last three years or so, Indian banks, particularly the public sector banks, have accumulated large amount of stressed assets. In essence, loans extended by Indian banks to few large concentrated firms in specific sectors have gone bad. Due to its financial stability implications, this has been a major policy concern of the RBI. Several options are being considered to deal with this problem. In this context, Viral Acharya, Deputy Governor, RBI, in his article, Some Ways to Decisively Resolve Bank Stressed Assets, proposes two different models to resolve banks’ stressed assets in India. He argues that both recognition of stressed assets and its resolution are linked to incentive structure of the banks. His first model called Private Asset Management Company (PAMC) focuses on the assets which are likely to have economic value in the short run. For the resolution plan, only turnaround specialists and private investors are proposed to be involved. For the other model, where the assets are economically unviable in the short to medium term, he proposed a quasi-government set-up called the National Asset Management Company (NAMC). The article clearly outlines the steps involved in both PAMC and NAMC for resolution of the stressed assets. Under both the models, it is emphasized that the banks’ balance sheets would be freed up from these assets so that banks can focus on healthier activities. While recapitalization from the government is essential in this process, government should also adopt measures to economize its total cost. In this direction, Acharya proposes five options: private capital raising, asset sales, mergers, tough prompt corrective actions, and divestments. So in a nutshell, this article provides a framework to resolve one of the most challenging issues Indian banks have ever faced after liberalization.
The views expressed in this article are personal.
Executive Director for Bangladesh, Bhutan, India, and Sri Lanka
International Monetary Fund
e-mail:
There are clear indications that the global economy has bottomed out. Recent forecasts by the IMF suggest that 2017 and 2018 will see faster growth than in 2016. Further, after several rounds of downward revisions in the two-year-ahead outlooks, the most recent forecast (April 2017) maintained the projections for global growth made in the previous round.
However, as reassuring as this picture might be, a comparison of these projections with the performance of both the global economy and individual economies during the high-growth decade prior to the financial crisis of 2008 should give pause. Growth will remain considerably slower than it was during that period. And, there are a number of structural factors to which this can be attributed. These factors pose enormous policy challenges to all countries as they seek to accelerate growth and, particularly, employment.
This article discusses four of these factors and draws some policy implications from the analysis.
THE GLOBAL GROWTH SCENARIO
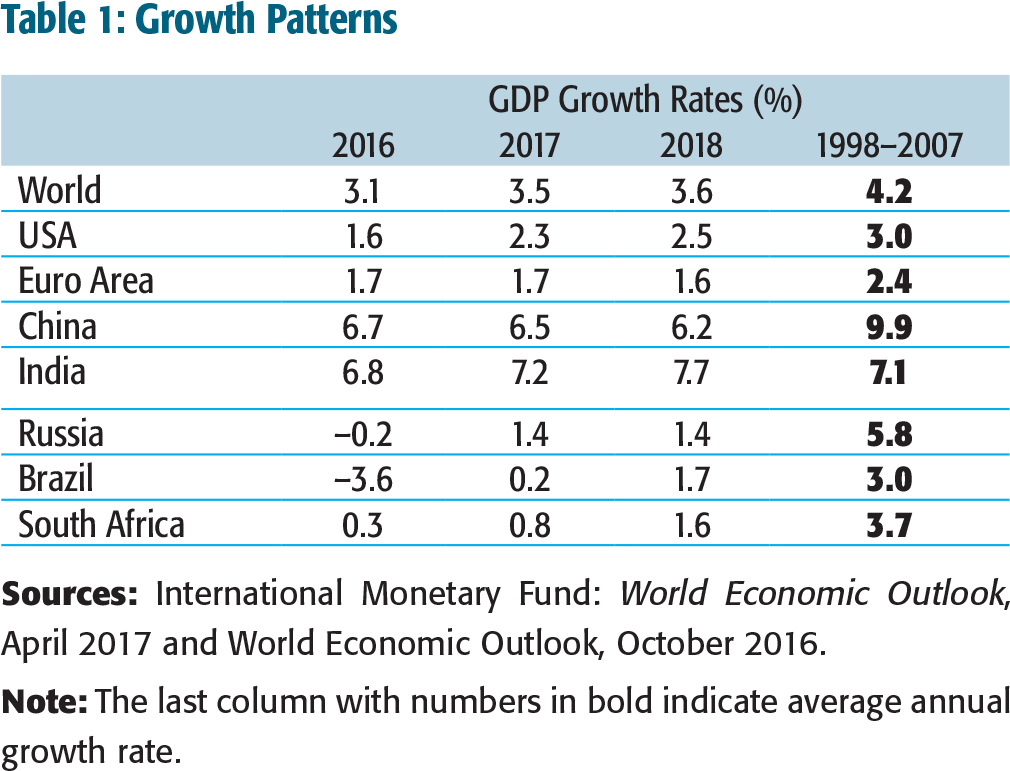
Table 1 lays out the forecasts for 2017 and 2018 as presented in the IMF’s most recent update. 6
International Monetary Fund. (2017, January). World economic review update. Retrieved from https://www.imf.org/external/pubs/ft/weo/2017/update/01/
A number of aspects deserve attention. First, focusing on the two-year outlook, among the advanced economies, the USA seems poised for a relatively strong recovery, while the Eurozone, having stabilized over the past couple of years, now appears to be settling into its current growth rate. Second, among the emerging economies listed in the table, India shows a relatively strong acceleration over the next two years, while China appears to be moderately slowing, although it will still be clocking relatively high rates of growth. However, Russia, Brazil, and South Africa, the other three members of the BRICS group and all significant commodity exporters, show a very different picture. They are expected to recover from negative or zero growth in 2016, but will register relatively low growth rates in 2017 and 2018.
It is important to place this modest recovery story in a somewhat longer term context. The last column in the table shows the average annual growth rate for these countries and region in the decade preceding the financial crisis. Clearly, the current recovery is far from achieving the growth benchmarks set during that period. Only India is expected to grow faster than that 10-year average, but the second half of the period saw the Indian economy growing at around 9 per cent, so even here, there is a shortfall.
Growth Patterns
STRUCTURAL DETERRENTS TO GROWTH
Trade
International trade was indeed an engine of global growth for a long time. Over the two decades 1985–2007, trade grew at roughly twice the rate of GDP. Clearly, many economies benefited from the expansion of opportunities that this created. Since 2012 the growth of trade has slowed down to match the rate of growth of GDP. Its days as an engine of growth appear to be over for now.
An analysis of this development by the IMF7
International Monetary Fund. (2016, October). World economic outlook (Ch. 2). Retrieved from http://www.imf.org/external/pubs/ft/weo/2016/02/
There is evidence of an increase in protectionist measures being imposed by several countries. The multilateral framework allows for several such instruments to be legitimately used: anti-dumping and countervailing duties are two important examples, but there are others as well. The analysis suggests an increase in the total number of discriminatory measures in 2014 and 2015, although there has been some offset by an increase in liberalizing measures.
It appears that a period of significant expansion of global supply chains is coming to an end. This expansion contributes to acceleration in trade growth and, with its plateauing, growth is bound to slow.
Investment
Like trade, investment activity was a significant contributor to global growth during the pre-financial crisis period. Analysis of trends in this key indicator by the World Bank show that during the five-year period 2003–2008, investment grew by about 12 per cent per year. In 2015, this rate had slowed to 3.4 per cent. In fact, the growth rate has been declining in every successive year since 2010. Another way of representing the severe trough that investment is currently going through is to contrast the current levels of investment across countries relative to its long-term average. In 2006, when the cycle was at its peak, 70 per cent of all countries saw investment activity above trend. In 2015, this proportion had fallen to 30 per cent. 8
World Bank. (2017, January). Global economic prospects (Ch. 3). Retrieved from http://www.worldbank.org/en/publication/global-economic-prospects
A number of factors are responsible for this decline. Once again, sluggish global growth contributes to it. Also, in the current energy and commodity price scenario, there are significant slowdowns in investment in new capacity in countries which export these. A third factor is the state of the financial sector in several economies. A combination of persistent asset quality problems and enhanced capital requirements has significantly reduced the risk-bearing capacity of financial systems. Even if there were demands, it is unlikely that significant funding would be forthcoming in this situation.
There are two other factors that are likely to be contributing. One is the presence of significant amounts of excess capacity in a range of mostly capital-intensive industries. A recent report by the European Union Chamber of Commerce in China indicates that in a range of capital-intensive industries in China, capacity utilization has dropped significantly between 2008 and 2014. For instance, in the steel industry, utilization dropped from 80 per cent to 70 per cent. The Chinese steel industry has an installed capacity of about 840 million tonnes, so 10 per cent is 84 million tonnes. 9
European Chamber of Commerce in China. (2016). Overcapacity in China.
The second factor is the rapid development of the ‘share’ economy. Companies such as Uber and Airbnb are following a strategy of what I would label ‘unearthing’ capacity. Until this business model emerged, personal vehicles and personal homes were not considered commercial assets. Now, they are. Suddenly, there has been a very large increase in the number of taxis and lodging facilities. There are several business unearthing capacity in different sectors, which will inevitably have an impact on investment plans. Why create new capacity when already extant capacity can be unearthed?
Technology
Automation is an ambiguous factor in terms of its impact on growth prospects. In the past, several new generations of automation generally appear to have increased employment opportunities. Even though automation is directly labour displacing, the emergence of new activities stimulated job creation indirectly. In other words, the direct, or substitution, effect has been more than offset by the (indirect) scale effect. However, in the ongoing process of rapid automation, there are concerns that the substitution effect may swamp the scale effect. In a recent speech, Jim Yong Kim, President of the World Bank, cited estimates that 69 per cent of India’s workforce and 77 per cent of China’s workforce were under threat of displacement from automation. 10
Kim, J. Y. (2016, October 3). The World Bank group’s mission: To end extreme poverty [Transcript]. Retrieved from www.worldbank.org
A recent visit to a garment factory in Bangladesh, an export powerhouse in that sector, provided a concrete illustration. A particular operation involving the assembly of the button strip of a shirt and the punching and finishing of buttonholes used to involve a machine with three operators—one each for folding, stitching, and punching—and two helpers. However, as the company began to cater to premium brands, the need for precision led to the installation of a more sophisticated machine, only one operator was required to perform all three operations; much faster and with better quality. Even the most labour intensive of activities are increasingly turning into low-labour intensive activities.
Politics
Recent political trends, particularly in the advanced economies, are seriously challenging the proposition that global integration is unambiguously good. While the aggregate benefits of the process may not be in doubt, their distribution between various social groups is clearly a bone of contention and the consequences of this are being seen in both actual and possible political outcomes in many countries. Whether or not anti-globalization forces come to power or not is not the most important issue here. Rather, it is the influence that this platform has on mainstream, centrist forces in these countries. To the extent that the anti-globalization platform gains traction in terms of popular support, parties that have thus far been pro-globalization will be bound to embrace at least some of that platform if they are to remain electorally viable.
This suggests that all further initiatives to expand and deepen global integration will stagnate for want of political support from national governments. It could also mean that at least some of the pillars of integration are under threat. Trade barriers, constraints on immigration, and other measures that are counter to integration are very much on the agenda. As was pointed out earlier, protectionist tendencies have already manifested over the past few years, even without the direct provocation from anti-globalization political platforms. This process can only gain momentum in the current political environment.
IMPLICATIONS
If all these factors pose threats to growth, the policy imperative in each country is to find ways to grow when others around it are not.
In response to the threats from declining trade, the dilution of a multilateral framework shifts the focus to meaningful bilateral and regional arrangements. India and other Asian economies have the relatively good fortune to be in a ‘growth neighbourhood’. Many of the countries in the region, even though growing more slowly than historical standards, are still amongst the fastest growing in the world. Many regional agreements already exist, but countries need to focus on making the most of them, to mutual benefit. As the locus of trade is likely to shift from the advanced economies to the neighbourhood, individual economies need to think about how best to utilize their competitive strengths to cater to new and somewhat different markets.
On the investment front, fundamental questions arise about what is going to drive investment activity. The combination of sluggish growth and commodity prices, stressed financial systems, and excess and unearthed capacity create a very different environment for investment activity. It is not clear that conventional levers such as interest rates and tax incentives will be able to stimulate investment to any significant extent. This raises the question of whether there are indeed any policy instruments that will do so. Meanwhile, even as policymakers come to grips with those questions, the basic necessities of infrastructure and streamlining regulations to ensure ease of doing business must be persisted with. Further, infrastructure investment becomes all the more risky if private investment is not sure to follow, so the right risk-bearing and risk-sharing financial structures need to be put in place.
Dealing with automation poses an enormous challenge. Referring to the distinction between substitution and scale effects, policymakers must focus on maximizing the latter even as the former move on inexorably. This means identifying and supporting new activities which can absorb workers and creating adequately skilled workers. One major concern when it comes to skilling programmes is that they rely heavily on past trends to decide on the skills to be provided. This will simply not work in the current technological environment. Skills become obsolete very quickly. Effective skilling programmes can only be designed on the basis of future developments. Forecasting these, as difficult as it is, must be now built into the design of any skill development initiative.
Even with the best of intentions and efforts, there will be failures. People will find themselves out of work because of obsolescence. Policymakers need to think in terms of more substantial safety nets, which will provide a minimum standard of living for relatively long periods of time. Designing affordable and sustainable safety nets is now a policy imperative.
In dealing with the political challenges to global integration and the impact that these might have on growth, the same safety net considerations might apply. Proponents of globalization must back up their positions with credible commitments to a more equitable sharing of the benefits, without of course derailing the process itself. More broadly, there has to be strong co-ordination across countries that have a vested interest in sustaining global integration in advocating the benefits and offsetting the costs.
CONCLUDING THOUGHTS
The global economy may have gained some breathing space after the financial crisis of 2008–2009, but it faces several threats to accelerating growth. All these threats are structural in nature and require both strong national responses and effective global co-ordination.
Senior Country Economist (India)
World Bank
e-mail:
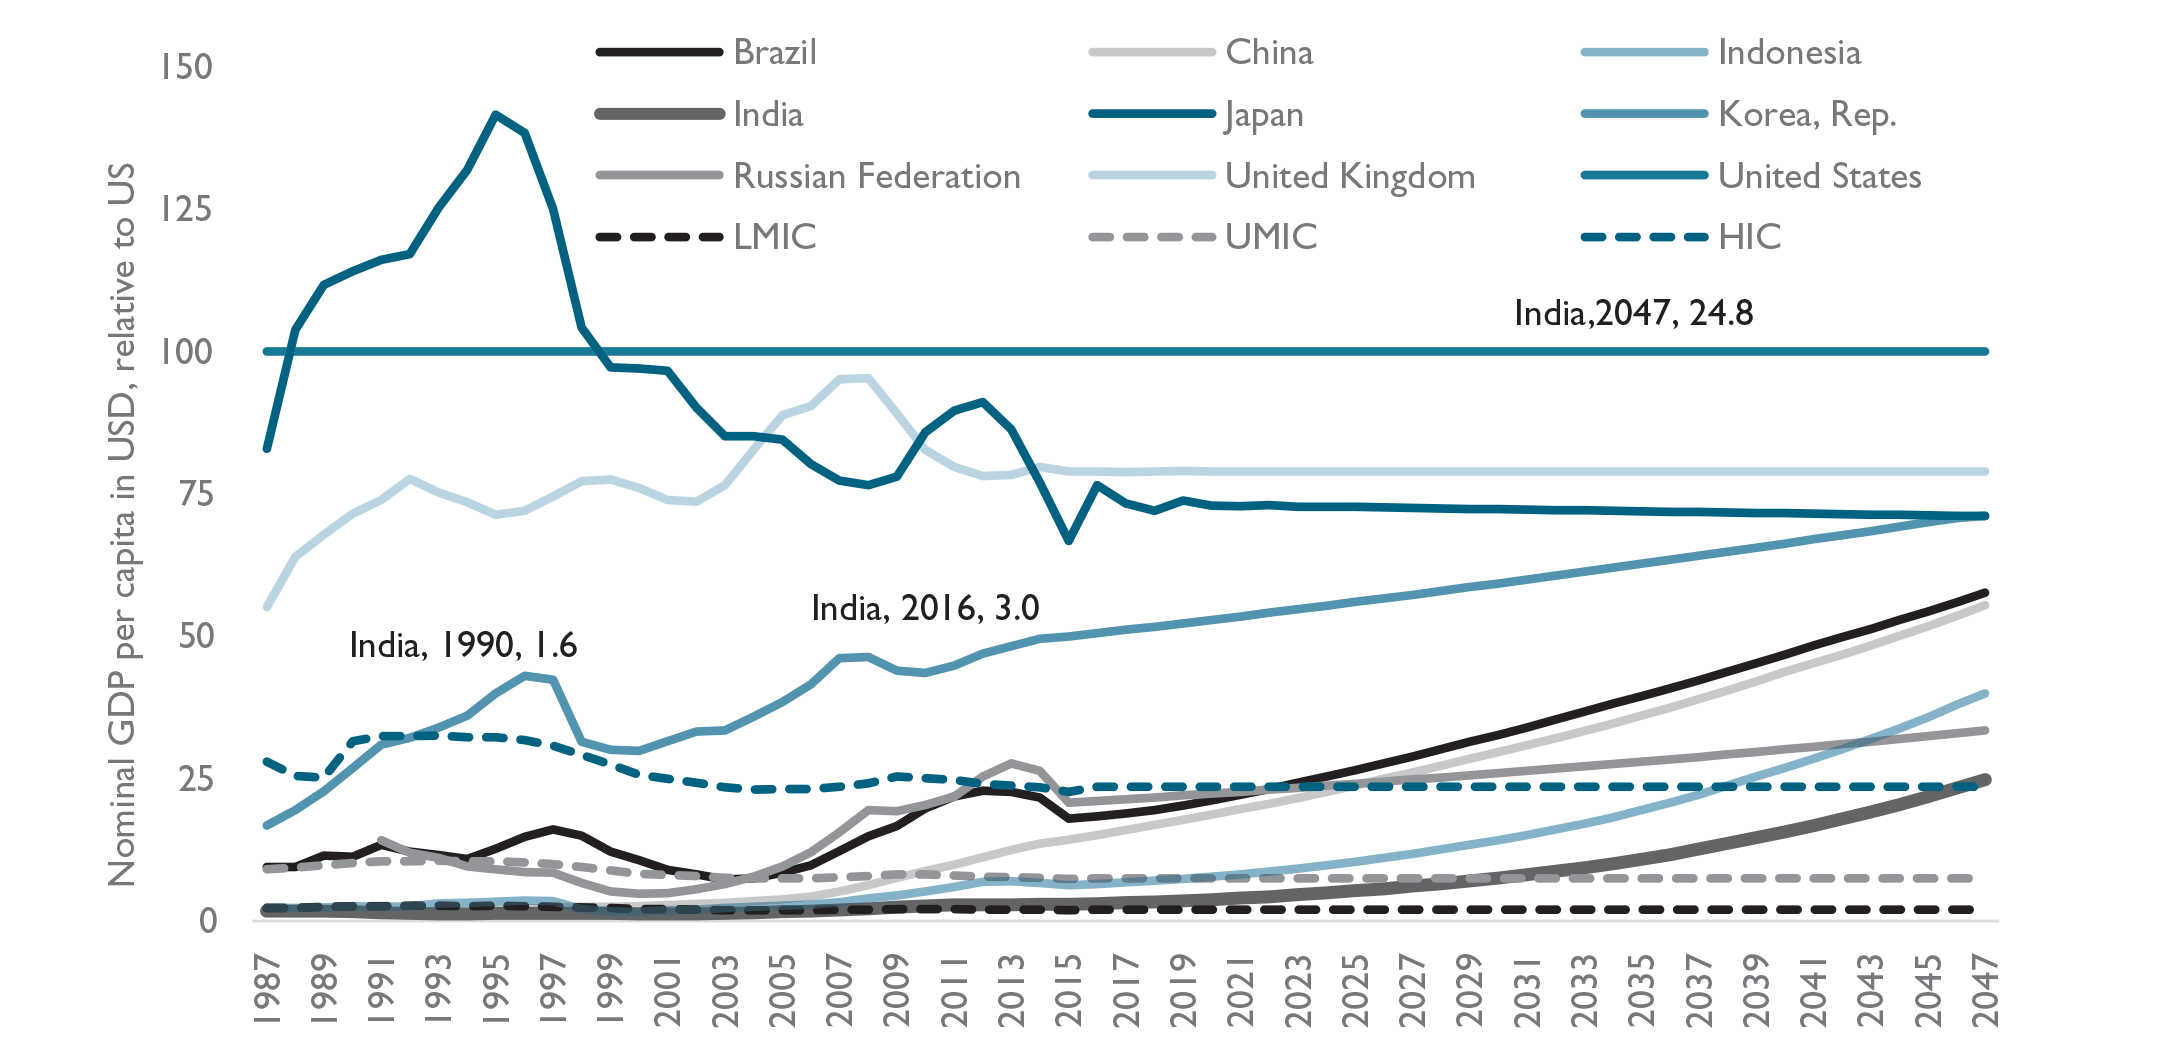
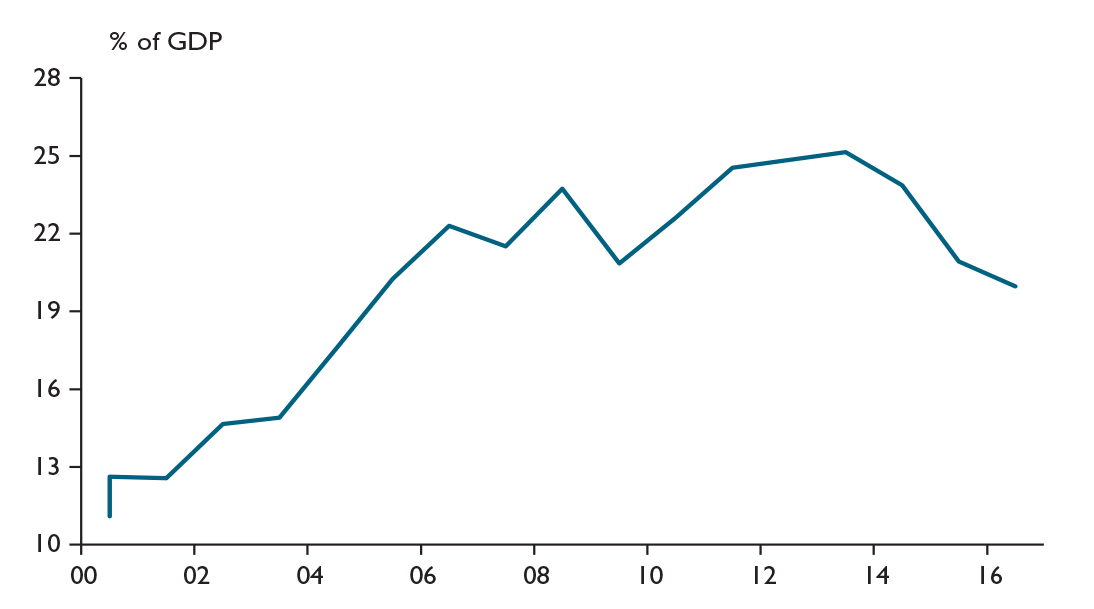
ure to 25 per cent, which is approximately the threshold required to reach high-income status (Figure 1).
This vision of a high-income India is, however, not pre-ordained. Achieving it will require that India sustain growth rates averaging over 8 per cent per year for more than three decades. This will call for concerted efforts. Many middle-income countries have grown fast for some time, but found it difficult to sustain the high growth rates needed to attain high-income status. Some call this the ‘middle-income trap’. It is worth noting that between 1960 and 2008, only 13 of the world’s 101 middle-income countries sustained the growth rates needed to reach high-income status. 11
World Bank and the Development Research Center of the State Council, P. R. China. (2013). China 2030: Building a modern, harmonious, and creative society. Washington, DC: World Bank. doi: 10.1596/9780-821395455
In particular, narrowing disparities in human capital is critical for India to sustain high rates of growth. To narrow these disparities dramatically, India may need to re-think how it delivers health care, education, and social protection services that are directly linked to human capital development.
INDIA’S RECENT GROWTH: FAST BUT UNEQUAL
Since the early 2000s, India’s remarkable economic growth has propelled the country into the ranks of the world’s middle-income nations. Between 1991 and 2014, India’s per capita income increased almost five fold, from US$323 to US$1,582. 12
World Development Indicators.
World Development Indicators.
At the same time, large variations in the economic performance of India’s states led to greater divergence between them. While almost all states recorded faster GDP growth between 2005 and 2015 compared to the previous decade, richer states grew faster than poorer ones and inequalities widened.
This divergence is mirrored in the extent of structural transformation between the states. While many of the high-performing states—such as Tamil Nadu, Karnataka, and Goa—saw services contribute more than 80 per cent to total growth between 2012 and 2014, agriculture still accounted for nearly 50 per cent of GDP growth in states such as Madhya Pradesh. 14
CSO and World Bank staff calculations.
At the individual level, while growth lifted millions out of poverty, it has not been inclusive. Gross national income (GNI) per capita grew at an average of 7.3 per cent per year in purchasing power parity (PPP) terms, but the income of a typical household grew by only 1.9 per cent per year. The incomes of the bottom 40 per cent grew only slightly faster, at 3.2 per cent. 15
WDI, NSSO, and World Bank staff calculations.
India’s rapid productivity growth reflects large pockets of excellence within the country. Compared to its income per capita and levels of education, India has a high level of technological capability. 16
Hausmann, R., Hidalgo, C. A., Bustos, S., Coscia, M., Simoes, A., & Yildirim, M. A. (2013). The atlas of economic complexity: Mapping paths to prosperity. Cambridge, MA. The MIT Press.
World Intellectual Property Organization.
India’s globally competitive firms, sectors, and universities have emerged as the vanguard of these pockets of capability. The fact that half of the revenues earned by Sensex companies come from outside India underlines the global competitiveness of India’s top firms. A look at just the space sector shows what India is capable of—ISRO has launched satellites for 12 countries, competing with the European Space Agency. India’s capabilities in the IT sector are also well recognized, and the top echelon of its higher education institutes enjoys a globally acknowledged reputation. In 2016–2017, the Times Higher Education rankings showed 31 Indian universities among the top 980 world-wide, in contrast to 9 in Thailand, 2 in Indonesia and none in Vietnam. 18
The World University Rankings. Retrieved from https://www.timeshighereducation.com/world-university-rankings
While these pockets of excellence prove that India has the capabilities for knowledge-based growth, its widening disparities loom large when such pockets are contrasted with the full spectrum of the country’s firms, workers, and students.
Take education, the building block of a modern knowledge economy. Although great progress has been made in providing access to primary education, the quality of education a typical student receives is a far cry from that imparted at the better institutes. Even students in the well-performing states of Himachal Pradesh and Tamil Nadu ranked towards the bottom of the global scores in the Program for International Student Assessment (PISA) in 2009. 19
Walker, M. (2011). PISA 2009 plus results–performance of 15-year-olds in reading, mathematics and science for 10 additional participants. Australian Council for Educational Research.
Pratham. (2017). Annual Status of education report (rural) 2016. ASER Centre.
Possibly of even greater concern is the fact that as much as half of India’s children are stunted and do not develop the cognitive skills that will enable them to tap their full human potential. 21
Steckel, R. H. (2009, January). Heights and human welfare: Recent developments and new directions, explorations in economic history. Elsevier, 46(1), 1–23; Case, A., & Paxson, C. (2008). Stature and status: Height, ability, and labor market outcomes. Journal of Political Economy, 116(3), 499–532.
Maccini, S., & Yang, D. (2009). Under the weather: Health, schooling, and economic consequences of early-life rainfall. American Economic Review, 99(3), 1006–1026.
WHY DOES INEQUALITY THREATEN THE SUSTAINABILITY OF INDIA’S GROWTH?
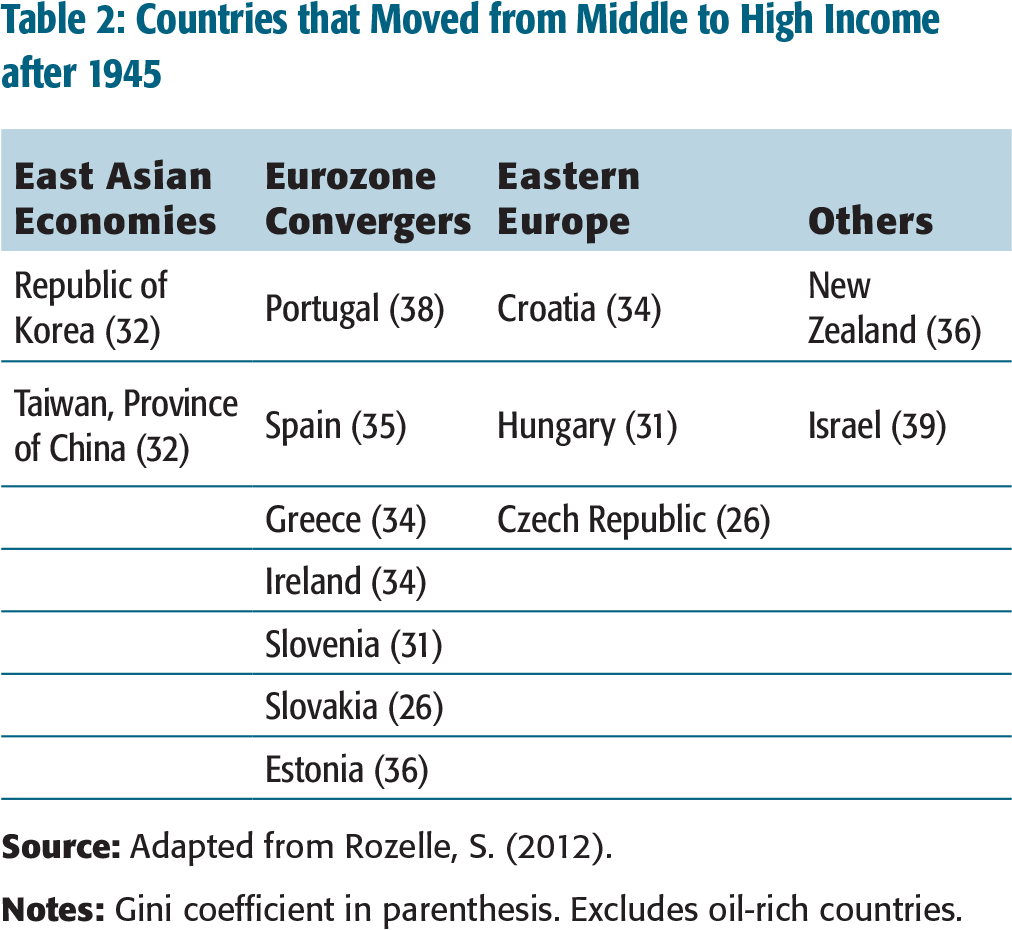
A key observation about countries that have successfully escaped the middle-income trap is that they tended to display low levels of inequality (Table 2). Indeed, excluding oil-rich countries, no country has transitioned beyond middle-income status while maintaining high levels of inequality. 23
Ferreira, F., & Ravallion, M. (2008). Global poverty and inequality: A review of the evidence (Policy Research Working Paper 4623). The World Bank.
Countries that Moved from Middle to High Income after 1945
What may explain this observation? First, to be competitive, India will need not just masses of workers but masses of ‘educated’ workers. The jobs of the future will require highly skilled knowledge workers. Creating a large labour force with the foundations to secure well-paying, high-productivity jobs requires providing high quality education and health care for all Indians, and consequently reducing disparities based on caste, gender, location, or socio-economic status.
Second, in a democracy, inequality is associated with demands for income redistribution, what has often been called ‘populist policies’ which can lead to economic distortions that dampen growth. Because tomorrow’s income inequality is today’s inequality of opportunity, reducing disparities in human capital can also contribute to reducing pressures for inefficient redistribution in the future.
Finally, inclusive growth leads to the emergence of a large middle class. This has both social and economic implications with both factors contributing to the expansion of investment. On the one hand, a middle class increases social cohesion, and on the other, it creates a large consumer base that boosts local businesses and powers domestic demand. Middle-class consumers are willing to pay for a greater variety of goods and higher quality products, inducing a virtuous cycle of investment, innovation, and rising living standards. 24
Murphy, K. M., Shleifer, A., & Vishny, R. W. (1989). Income distribution, market size and industrialization. Quarterly Journal of Economics, 104(3), 537–564.
HOW CAN INDIA REALIZE ITS GROWTH PROMISE?
Over the next three decades, India will be one of the few countries to have an expanding labour force. Projections show that out of 12 emerging Asian economies, only 5, including India, will have a labour force that will be larger in 2030 when compared to 2010. 25
Kim., J. (2010). Past and future of the labor force in emerging Asian economies (ADB Economics Working Paper no. 218).
Given that most large economies are witnessing a decline in labour force, a growing pool of labour will be a significant asset. However, with the rapid introduction of labour-saving technologies, especially in the manufacturing sector, this labour will need to be better qualified to complement such technologies. While the demand for traditional services, such as hospitality and health care, that are less susceptible to automation is likely to increase, these too will increasingly require skills of a higher order.
Economic growth that stems from a growing population will therefore need to be replaced with growth that stems from higher productivity. This will call for firms to adopt more sophisticated technology and for workers to expand their skill sets to command higher wages. Currently, however, India has a large ‘tail’ of low productivity firms.
Increasing the low participation of women in India’s labour force will also provide additional opportunities. All told, transforming this mass of people into a vast pool of human capital, making India’s workforce the world’s workforce of choice, will be key to drive the country’s growth over the next three decades.
Three Key Priorities
For India to realize its potential the priority will be investments in human capital. Interventions in three key areas can be considered: health care, education, and social protection.
Health Care: Pre-natal health, child birth, and early childhood nutrition and development can directly influence intellectual abilities for a lifetime. For example, lack of micronutrients such as iodine can lead to lower IQ levels, limiting an individual’s ability to acquire skills; lack of vision correction prevents children from learning to read, stunting their overall academic progress. Investments in nutrition and maternal health, as well as adequate tracking of outcomes will therefore be essential for progress in this area. Importantly, improvements in sanitation can be the largest contributor to reducing stunting in India.
Education: The focus should be on early childhood education and improving the quality of basic education. This should build socio-emotional skills, and promote critical thinking and problem-solving skills that enhance productivity across many occupations. Without basic health and education, workers will not be able to benefit from the expansion of technical and higher education.
Social Protection: While caution against inefficient income redistribution is warranted, there are many examples of efficient redistribution in a modern social protection system such as social insurance and conditional cash transfers, like those that have proven successful in Brazil and Mexico. These countries introduced cash transfers that were linked (initially in a direct manner) to keeping children healthy and in school, and saw significant increases in enrolment and eventually declining inequality. As India moves away from price subsidies to more efficient forms of social protection via direct benefits transfer, emphasis could be placed on ensuring that higher transfers are provided to families where children are the most vulnerable.
Rethinking the Delivery of Public Services
The three areas mentioned above—health care, education, and social protection—are all forms of services that need to be delivered through (and often by) the public sector to all India’s citizens. While important initiatives have been put in place to improve service delivery—most notably the Swachh Bharat Abhiyan initiative, which can have significant impact on children’s health—the current levels of performance suggest a more significant re-thinking of how public services are delivered in these three areas and beyond, in order to decisively narrow disparities and sustain growth.
The 2004 World Development Report argues that direct accountability of service providers to citizens is often the most effective means of ensuring that services are adequately provided to all. Currently, however, just three of the central government’s largest ‘centrally sponsored schemes’ on social protection—the national education and health missions, as well as the Mahatma Gandhi National Rural Employment Guarantee Act (MGNREGA)—account for 5 per cent of the entire union budget. Because states have to (partly) match the central transfers, these also account for a sizeable share of the states’ budgets. As these schemes are implemented locally, and states share their costs, states too have ‘skin in the game’. However, since much of the funding comes from the central government and is tied to specific allowed expenditures, the direct route of accountability is dampened.
One option that may be considered for strengthening the direct accountability of public service providers to citizens is to restructure schemes into a performance-based pact with the states. States—and within states, local governments—would be provided the resources to deliver services. But, rather than directing the types of expenditures that can be financed under the scheme, the centre and states would agree upon targets for service quality and outcomes. The states would then have the autonomy to decide how to best deploy the funds to achieve these targets. The centre would transform its role to one of producing and widely disseminating high-quality, trusted, and standardized performance data so that citizens can hold their local governments directly accountable. Only in extreme cases, where states consistently fail to meet their agreed-upon targets, greater intervention from the centre may be warranted.
FULFILLING THE PROMISE
India may well be in the initial years of a take-off towards becoming a high-income, inclusive economy by the 100th anniversary of its Independence. Amid the many pockets of excellence that it can draw upon is its large number of able and committed civil servants. With the right institutional reforms, these civil servants can deliver the health care, education, and social services that will not only ensure that India’s labour force of tomorrow will be massive but also massively educated, innovative, and productive.
I am indebted to Janak Raj and Muneesh Kapur of the Reserve Bank of India who have helped me in writing this article. The standard caveat that I am responsible for the views expressed herein applies.
Former Governor
Reserve Bank of India
e-mail:
This outward orientation has been a positive force for the economy, especially as it coincided with a period of global growth. However, it posed complex challenges for monetary policy management in balancing the objectives of price stability, financial stability, and growth. This article aims to highlight those challenges.
The article is organized as follows. It starts with a perspective on India’s deepening economic integration into the global economy over the last 25 years since the beginning of the reform process. It then goes on to a brief narration of the impact of this integration on the macroeconomy. That is followed by an outline of the challenges posed by capital flows, leading finally to addressing the EM response to capital flow management.
INDIA’S INTEGRATION INTO THE GLOBAL ECONOMY
India’s two way current account flows (inflows and outflows: transactions on merchandize trade, services’ trade, and invisibles), taken together, have more than doubled from an average of 26 per cent of GDP during the 1990s to 58 per cent now (average during 2010–2011 to 2015–2016); this ratio peaked at 63 per cent in 2012–2013, but has since declined on the back of weak global growth and even weaker global trade. 27
Database on Indian Economy, Reserve Bank of India.
India’s integration through the capital flow route has been even more striking. Two way capital flows (capital inflows and capital outflows), taken together, have more than tripled from 15 per cent of GDP during the 1990s to 50 per cent now (average during 2010–2011 to 2015–2016), after peaking at 62 per cent in 2007–2008. 28
Database on Indian Economy, Reserve Bank of India.
The overall openness of the Indian economy, as measured by inflows and outflows under current account and capital flows combined, has, thus, more than doubled from an average of 41 per cent of GDP in the 1990s to 108 per cent of GDP in the period 2010–2016. 29
Database on Indian Economy, Reserve Bank of India.
IMPACT OF GLOBAL INTEGRATION ON THE MACROECONOMY
This significant integration into the global economy through both the current and capital account channels has, of course, provided immense benefits to the Indian economy by way of higher output growth and employment. Capital flows have not only helped finance our current account deficit (CAD) but some, such as FDI flows, have also provided critical technical and management know-how. Real GDP growth accelerated from 5.6 per cent during the 1980s to an average of 6.9 per cent per annum in the post-reform period (1992–2016). The growth in per capita real income was even more striking: rising from an annual average of 3.2 per cent during the 1980s to 5.1 per cent during 1992–2016. 30
Database on Indian Economy, Reserve Bank of India.
CHALLENGES POSED BY CAPITAL FLOWS
Even as capital flows help finance the CAD, large capital inflows, and outflows, especially the volatility associated with such flows, pose serious and complex challenges for macroeconomic and monetary management. If not managed properly, the costs of integration can outweigh the benefits.
Monetary policymaking in emerging economies has confronted growing challenges since the financial crisis owing to the ultra-accommodative unconventional monetary policies in major advanced economies. Interest rates have been at record lows; policy rates are close to zero or even negative in the major reserve issuing currencies. Thanks to the unprecedented QE policies, even yields at maturities of 10 years or more are negative in some major countries. This environment of record low/negative interest rates in the major advanced economies has provided an even greater incentive for capital to flow into emerging economies, heightening the challenges for their central banks.
Large capital flows, well above the economy’s absorptive capacity, can lead to sustained appreciation of the domestic currency. This can, in turn, result in loss of external competitiveness, weaker exports, higher imports, and ballooning of the CAD beyond sustainable limits. The widening of the CAD may initially attract more capital flows or the central bank may run down its foreign exchange reserves to finance the higher CAD. Eventually though, the CAD correction could end up being disruptive, leading to sharp exchange rate depreciation, and typically an overshooting, with all its attendant implications. The concomitant large currency depreciation can then feed into higher domestic inflation and force the central bank to tighten monetary policy. Monetary tightening might also become imperative to make domestic-currency-denominated assets more attractive to foreign investors. Either way, higher interest rate and loss of confidence can lead to output and employment losses.
Management of the situation might call for capital controls, but such controls, even if temporary, could lead to a further loss in external investors’ confidence in the domestic economy and worsen the situation. It was exactly this scenario that played out in India during 2013 with the gradual widening of the CAD to almost 5 per cent of GDP in 2012–2013 (along with weakness in other fundamentals such as high fiscal deficits and high consumer price inflation) from a sustainable level of 2 per cent or below till 2008–2009. 31
Database on Indian Economy, Reserve Bank of India.
CAPITAL FLOW MANAGEMENT: EMERGING MARKET RESPONSE
The above discussion on the implications large capital inflows implicitly assumes that the central bank adopts a (largely) hands-off approach. That is typically not the case. In practice, central banks in major emerging economies can, and indeed do, pursue a host of policies to minimize the adverse impact of volatile capital flows, but then these might entail significant costs, evidencing that no policy option is totally benign.
First, the central bank can intervene in the foreign exchange market to absorb ‘excess’ capital flows in order to prevent nominal appreciation of the domestic currency. But large purchases of foreign currency (if not sterilized) can lead to growth in credit and money supply, well above the requirements of the economy, and in turn manifest as credit and asset price bubbles, overheating, high inflation, and thereby a real appreciation of the currency. It is paradoxical that the central bank strategy aimed at preventing nominal appreciation of the currency ends up resulting in real appreciation, thereby hurting exports and employment. Even as the volatility in the exchange rate may be restrained as intended, an unintended consequence of this strategy is that the resultant stability might encourage domestic entities to borrow much more in less expensive foreign currency and on top of that leave such borrowings unhedged, with macroeconomic and financial stability implications down the road. Thus, intervention per se might not be effective in the presence of large capital inflows.
Second, to address the money supply implications, the central bank may decide to sterilize its foreign exchange interventions through offsetting liquidity operations. In India, the RBI typically uses multiple instruments to neutralize the liquidity conditions. These instruments have included: repo/reverse repo operations under its liquidity adjustment facility (LAF), open market sales/purchase operations, issuances of government securities under the market stabilization scheme (MSS), and modulations in cash reserve ratio (CRR). These sterilization operations can help to keep domestic monetary and liquidity conditions in line with the requirements of the domestic economy, and help foster macroeconomic and financial stability. But, this is not costless. The LAF operations can impact the balance sheet of the RBI, the MSS operations impact the government’s budget, and the CRR (since it is currently unremunerated in India) impacts commercial banks’ income. Moreover, the sterilization operations can raise domestic interest rates higher than warranted by domestic macroeconomic conditions, thereby entailing adverse impact on growth. And, in a curious variant of the Dutch disease, the higher interest rates may attract even more flows, restraining which was, in fact, the intent behind the original policy initiative.
Third, the central bank and the government can follow a cautious approach to capital account liberalization so as to restrain capital flows. In India, this approach has been consistently pursued since the early 1990s through a fairly liberal regime with regard to non-debt flows, but continued restrictions, albeit declining in scope and intensity over time, on debt capital flows, especially of the short-term variety. Such an approach may contain build-up of imbalances and contribute to domestic stability, but again its costs need to be recognized. Corporations which can borrow cheaply abroad might lose some competitiveness, if forced to borrow domestically. Moreover, this might also pressurize the domestic banking system beyond its carrying capacity, exposing it to more sectoral and group risks: indeed, the Indian banking system’s current woes are at least, in part, due to its overexposure to the domestic infrastructure sector, which might have been forced to borrow more from the domestic banking system in view of capital account restrictions on foreign borrowings. The alternative of allowing the domestic infrastructure companies (with earnings mainly in local currency) to borrow abroad in foreign currency without any restrictions is, of course, not a benign option either since it can expose them to large foreign exchange risk.
CONCLUSION
Globalization is a double-edged sword for emerging economies. It can confer huge benefits but also impose ruthless costs. Illustratively, if the higher growth and employment that India experienced during the Great Moderation is a demonstration of the positive side of globalization, the exchange rate volatility and the consequent macroeconomic costs in the context of the taper tantrums are evidence of the negative impact of globalization on emerging economies.
The challenge for policymakers in emerging markets, especially for central bankers engaged in monetary policy formulation is to make judgement calls that minimize the costs and maximize the benefits.
All views are personal.
Chief India Economist
J. P. Morgan.
e-mail:
Yet, by itself, the prospect of Fed tightening should not pose an insurmountable threat to emerging markets. First, given how long it has been coming, much of it is already believed to be ‘in the price’ and should not be disruptive, unless the Fed is perceived to fall behind the curve. Second, to the extent that US normalization is precisely because growth prospects appear more sustainable, emerging market exports should gain, in theory. Third, the sooner US rates normalize, the lower the perceived mispricing of asset prices.
So rate normalization, by itself, should not spook emerging markets. But worries will mount, if rate normalization is accompanied by accentuated trade protectionism around the world. In recent years, exports have come under pressure as the frenzied globalization of the 2000s has been replaced by ‘de-globalization’ with export and global growth getting uncoupled. Any protectionism will simply accentuate these pressures. Think, for example, of the proposed border adjustment tax (BAT) that may be part of a larger corporate tax reform bill in the USA later this year. The move to a destination-based tax would result in firms not being able to offset imports against their tax liability. This would be tantamount to a tariff on imports. Economic theory suggests that there are no real effects from BATs because the US dollar would appreciate in tandem, to completely offset the tax. So the landed cost of exports would be the same, and there would be no impact on export volumes from emerging markets. The theoretical underpinnings emanate from the fact that any BAT should not, by itself, affect savings (S) and investment (I) behaviour. Consequently, the capital account should remain untouched, and therefore the current account must remain untouched. This, however, can only happen, if the dollar appreciation completely undoes the tax increase. To be sure, there are several nuances (whether exports are priced in local currency or priced to market) that should impact the outcome. Despite those caveats, however, the ‘neutrality’ argument, while compelling in theory, is unlikely to play out in practice for both theoretical and practical reasons.
For starters, it only captures the static equilibrium and not the transition dynamics, which can be very rocky. Second, the assumption that S and I remain completely untouched appears unrealistic, in a general equilibrium context. Because the BAT is only expected to happen as part of a larger—and more fundamental—corporate tax reform packages, it is unrealistic to assume that corporate S and I behaviour are unmoved. Is not the whole point of the corporate tax reform package to induce more corporate investment at home? And so if the capital account were to change, so must the current account. Put differently, any currency adjustment would only partially offset the tax hike, pushing up the cost of imports. This should put further pressure on Emerging Market (EM) exports to the USA, for example.
A SELF-REINFORCING EQUILIBRIUM?
The risk, therefore, is that over the next year or two, tighter monetary conditions around the world may be accompanied by greater trade protectionism. While the odds of a BAT, in particular, remain low, it is very possible—even likely—that other forms of protectionism are likely to emerge, and not just in the USA.
The broader point, therefore, is that emerging markets may have to bear the brunt of higher global interest rates, but will not necessarily experience the benefits of the stronger growth that necessitates those higher rates. That could constitute a debilitating one–two punch.
What’s more, these impulses may be self-reinforcing. Think of protectionist tendencies as being tantamount to an adverse supply shock, which pushes the supply curve back and reinforces any price pressures that may be emerging. If anything, that will induce central banks to normalize even faster.
But a faster pace of normalization, to the extent that it interferes with growth dynamics and job creation, could induce more economic nationalism and protectionist tendencies. In a sense, therefore, monetary tightening and protectionism may reinforce each other.
All told, the global environment is fraught with risks facing emerging markets. So how vulnerable and exposed is India?
INDIA’S CLOSED-ECONOMY MISCONCEPTION
India’s increased integration on the financial front is well appreciated, in the aftermath of the Lehman Brothers and taper-tantrum episodes in 2008 and 2013, respectively. Equally, there is an appreciation that (a) the CAD has reduced dramatically in recent years (helped by lower oil prices); (b) the balance of international payments (BoP) remains comfortable; and (c) Forex (FX) reserves have been rebuilt. All told, India remains relatively well insulated from global shocks, both on account of good policy and good luck (oil).
But misconceptions and complacency continue to haunt the real-economy side. The conventional wisdom is that India remains a largely closed economy, where exports are only of marginal significance. In fact, this line of thinking is often used to suggest that India stands insulated from global growth and/or protectionist shocks.
But to believe in the conventional wisdom is to live in the old reality. Over the last two decades, India’s tradable sector has grown at rapid pace—which has brought welcome exposure to global markets and the supply-chain efficiencies, technological transfer, and productivity growth that comes with it—but this has also made India more vulnerable to global growth and protectionist shocks. Not for a moment am I suggesting that this exposure is undesirable. Quite the contrary. We must do everything we can to further our real-sector integration. But it is important to appreciate the new reality so that we can better prepare for the consequences that may arise from global shocks.
MORE OPEN AND VULNERABLE THAN YOU THINK
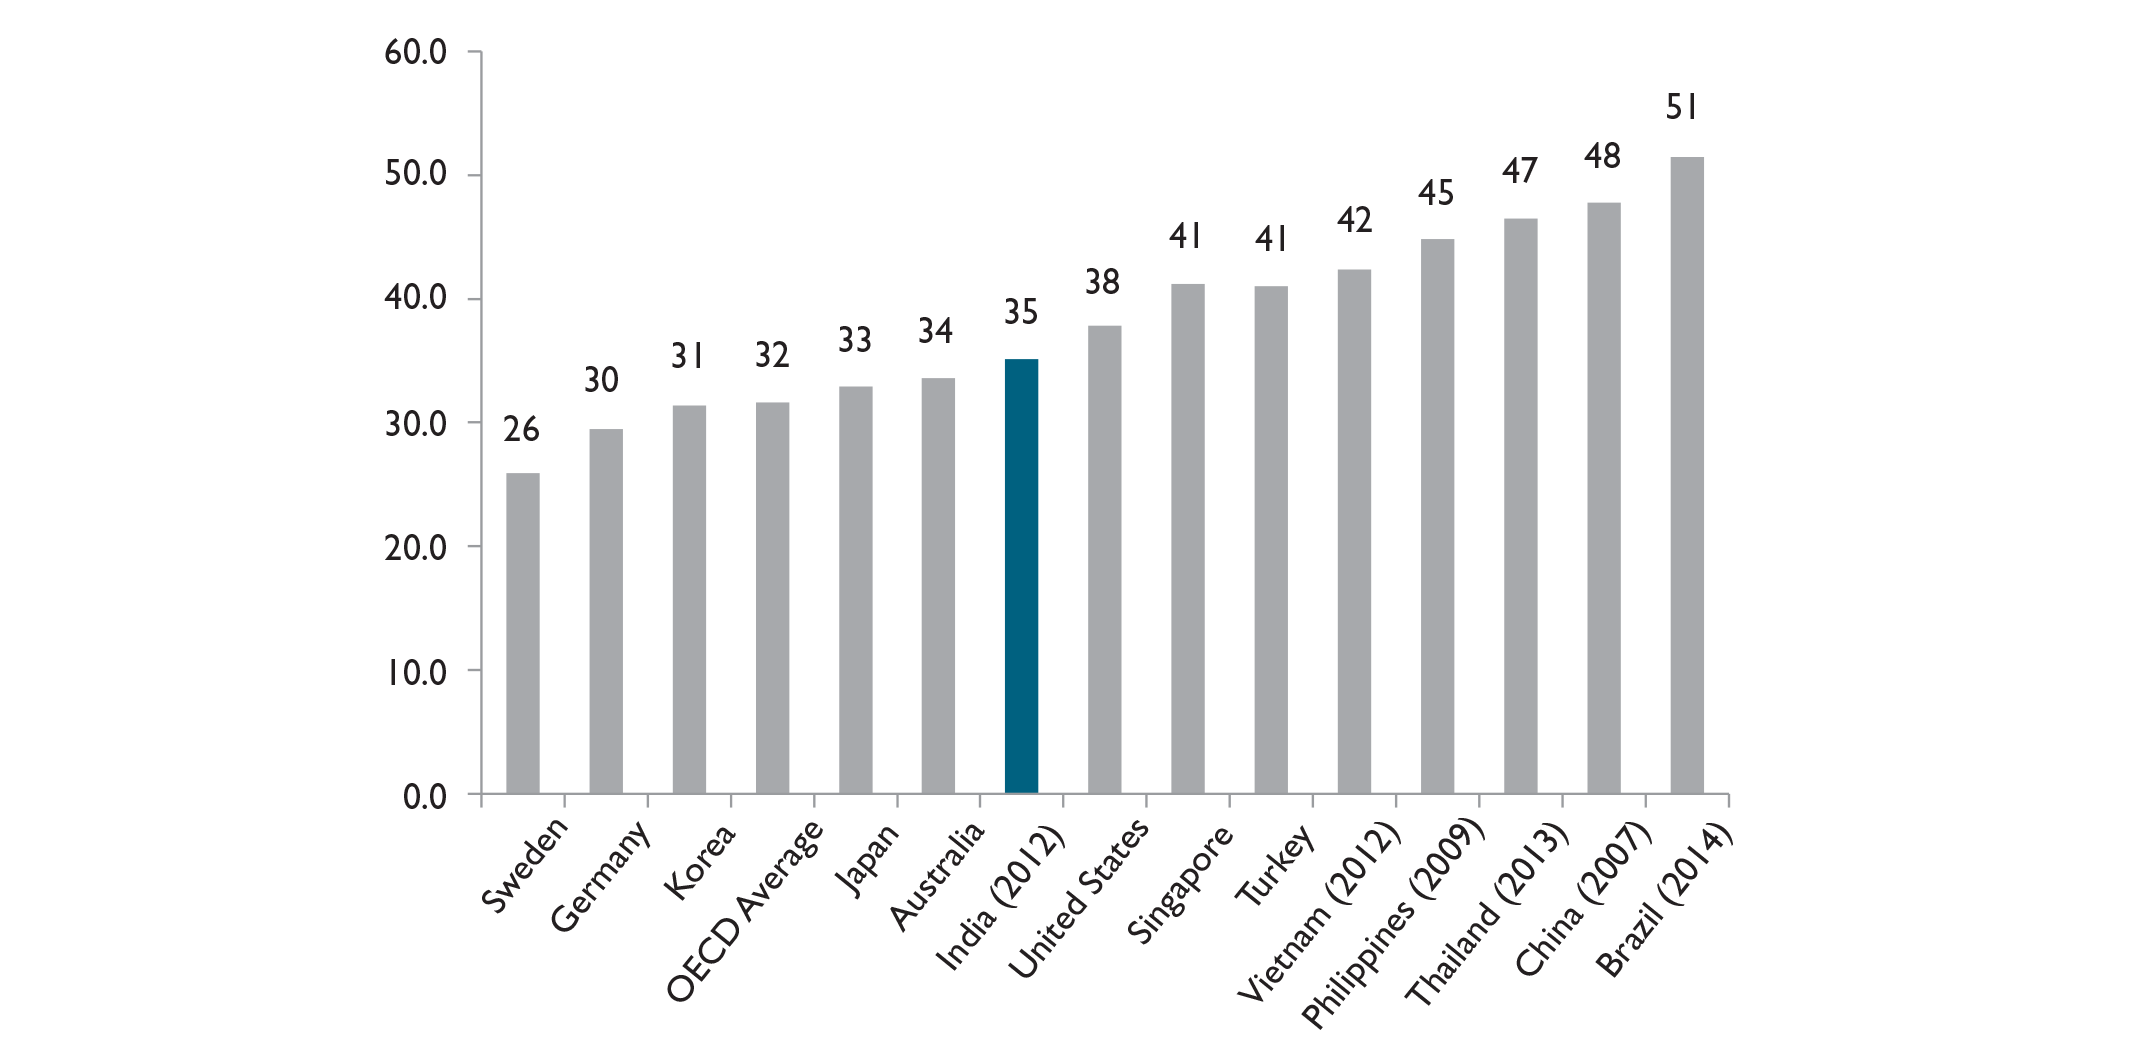
Measuring India’s exposure on the export side is a function of (a) how exports have grown as a share of GDP; and (b) how sensitive they are to changes in partner-country growth. The higher the share of exports in GDP and the more elastic/cyclical they are to changes in global economic conditions, the more vulnerability on the export side.
In India’s case, we find exports as a share of GDP more than doubled from 12 per cent to 25 per cent of GDP between 2000 and 2013. To be sure, India has not been able to dodge the ‘de-globalization blues’ with the share of exports in GDP receding in recent years. Despite that, however, Indian exports to GDP is still at 20 per cent in 2016, twice the level witnessed just 15 years ago, the same as an Indonesia and twice that of a Brazil.
Complementing this openness is the fact that India’s export basket had become progressively more sensitive to global growth impulses, until recently when the relationship between advanced economy growth and exports seems to have broken down around the world. In particular, we estimate the sensitivity of India’s export volumes to global growth across different sub-periods, holding other factors (the real exchange rate, commodity prices, supply bottlenecks) constant, and find that export sensitivity to global growth rose sharply in the 2004–2008 period versus the 2000–2004 period as can be seen from Figure 4. As was the case with all other emerging markets, however, the elasticity began to slow after the global financial crisis (GFC). To be sure, the computed elasticity in the 2008–2011 moderated slightly, but was still higher than the 2004–2008 period. It is only in the last three years that elasticities have slowed very sharply, but this is a phenomenon not unique to India, and symptomatic of a more generalized de-globalization phenomenon underway.
THE QUIET REVOLUTION: FROM TEXTILES TO AUTO PARTS…
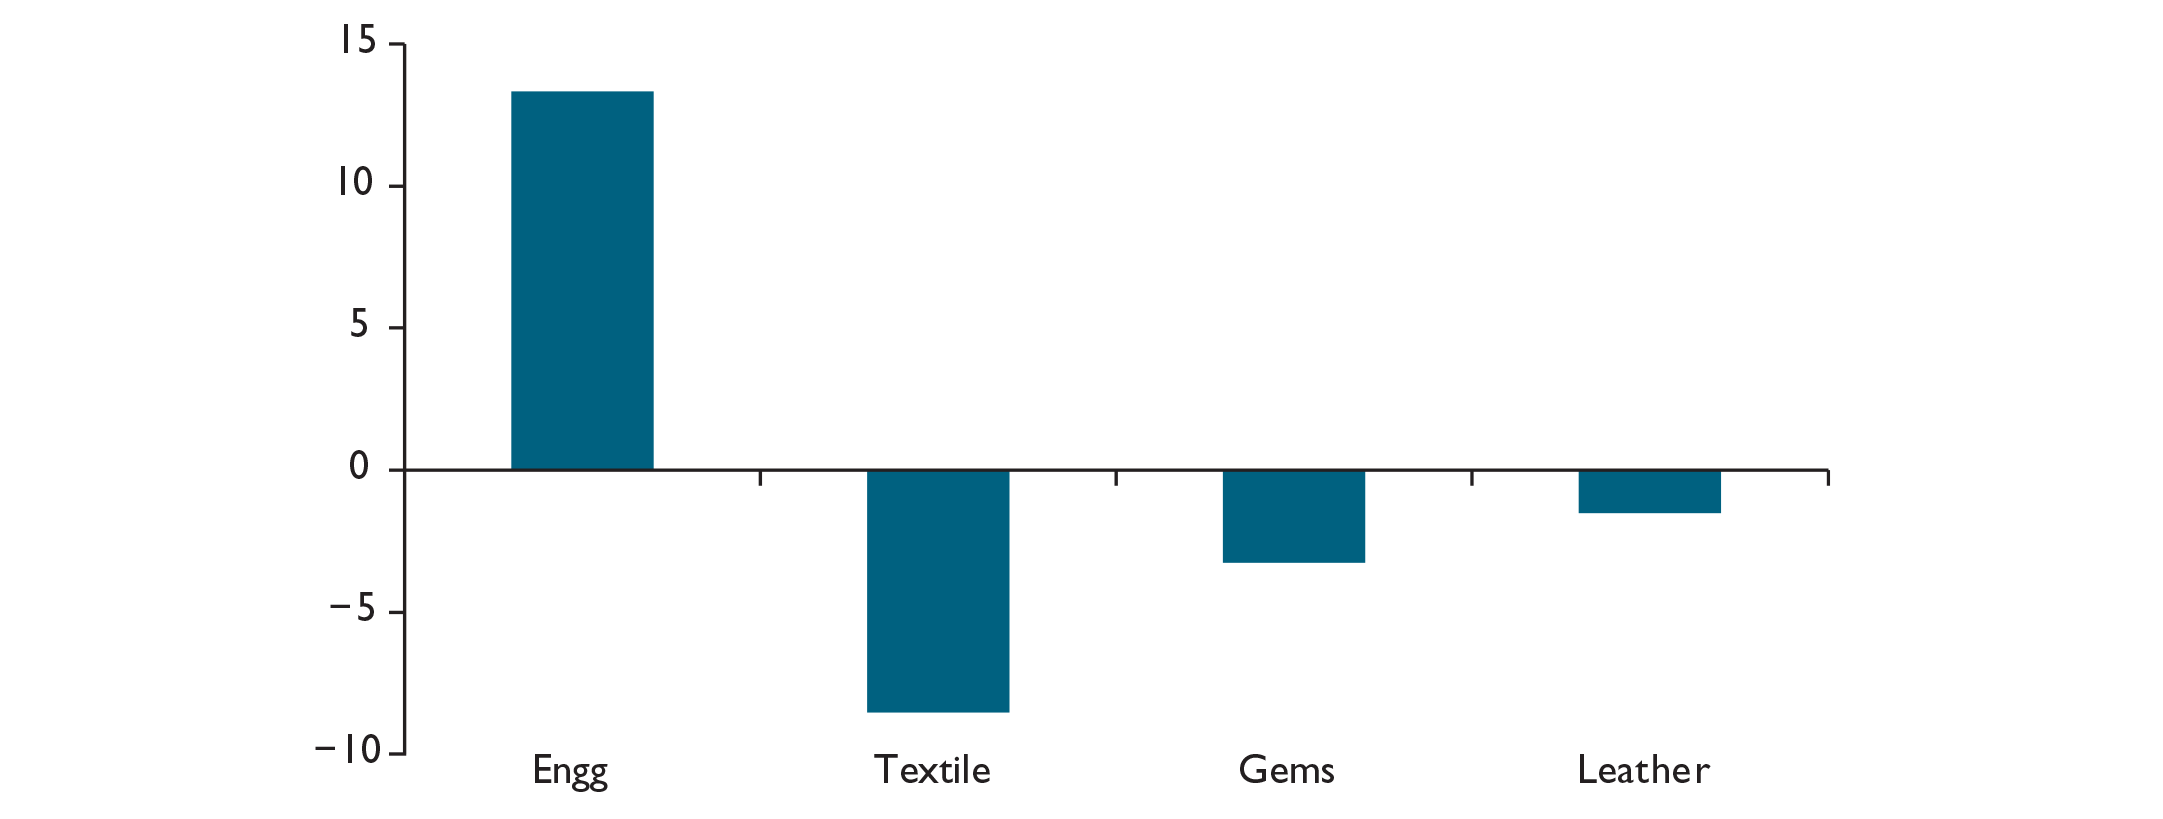
A key question, however, is what caused the increased sensitivity of the Indian export basket to global growth impulses, notwithstanding recent dynamics. The answer: composition. The shift from manufacturing to services is well known. Back in 2003, service exports made up 30 per cent of the total export basket, and by 2016 services have grown to constitute 40 per cent of the basket. But there was also a quiet revolution happening on the manufacturing front. Back in 2003, textile, leather, and gems/jewellery—India’s traditional exports—constituted nearly 60 per cent of the merchandize export basket (ex-petroleum). But their share has secularly fallen, and currently they account for just 40 per cent of the basket. In contrast, engineering goods exports—auto parts, capital goods—have grown at an average annual pace of almost 20 per cent for 13 years, such that its share of the manufacturing export basket has almost doubled from 20 per cent to 35 per cent in just 12 years. 33
Data is from the Ministry of Commerce, Government of India.
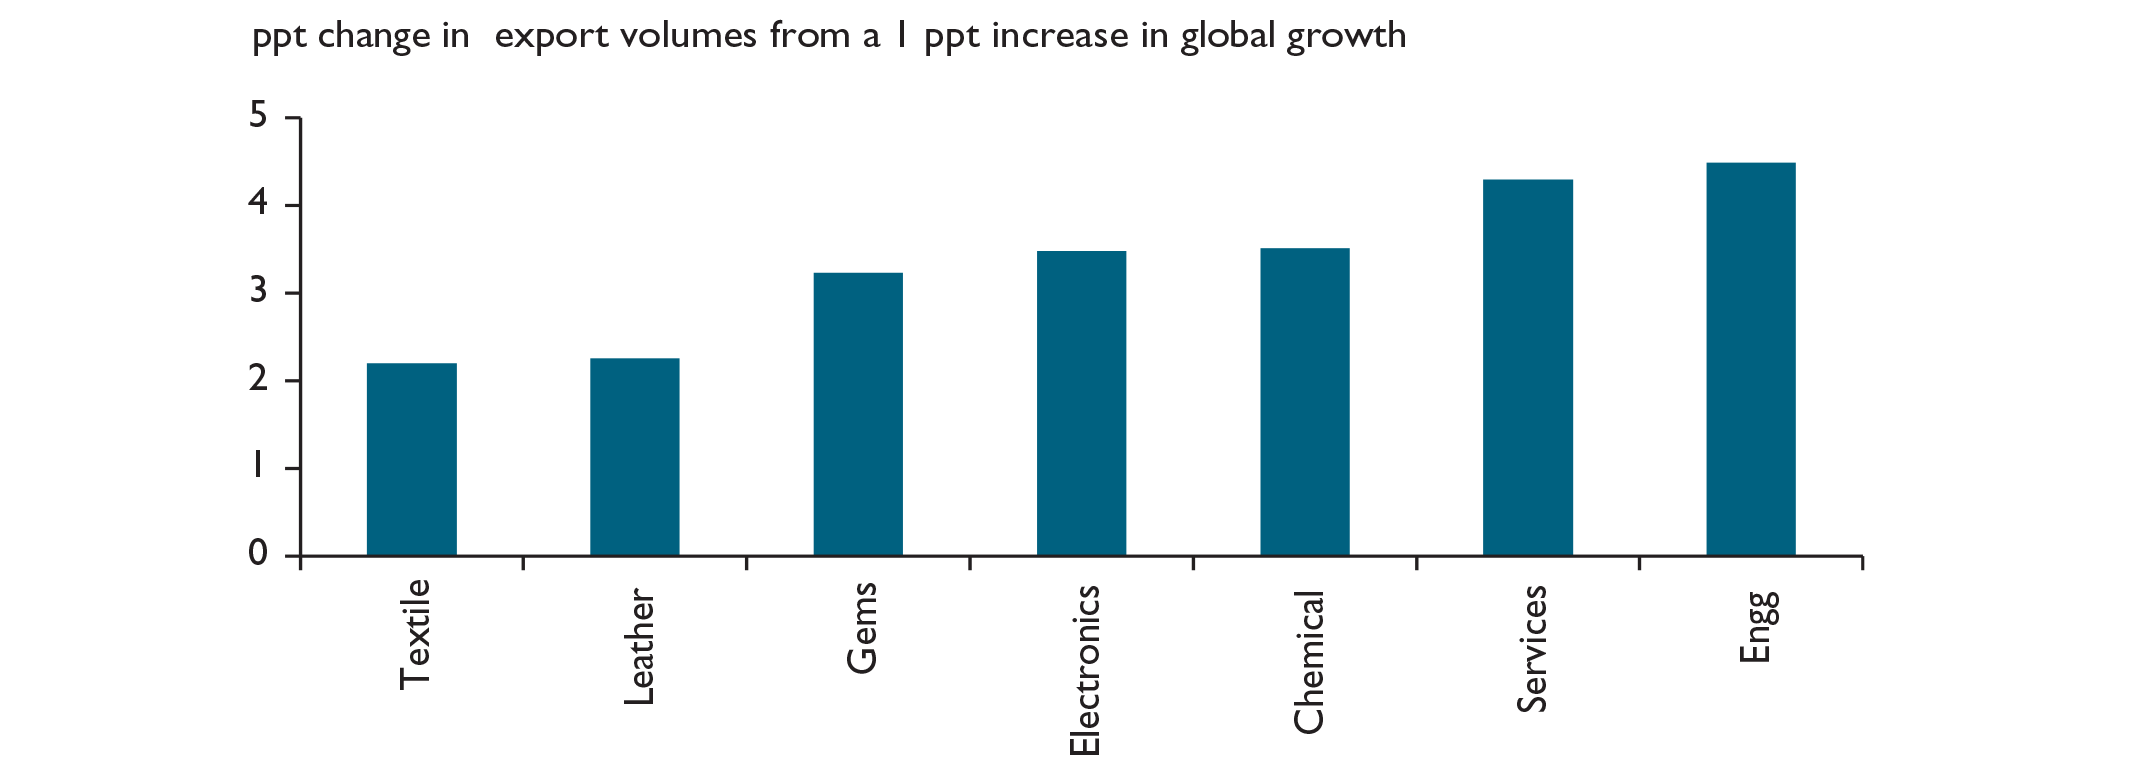
The key, however, is that India’s new-age exports (engineering goods, pharmaceuticals, software services) have a far higher sectoral elasticity to global growth than the traditional exports of leather, gems, and jewellery (see Figure 6). Like the ASEAN countries, therefore, India’s export basket has become more ‘cyclical’ in nature and is impacted much more by global business cycles, surging in the good times and sharply depressed in a down-cycle. So, global growth volatility transmits more directly and acutely into India from this changed composition of exports.
IS INDIA PARTICULARLY EXPOSED TO PROTECTION FROM THE USA?
The aforementioned dynamics reveals India’s sensitivity to global growth. But what about the specific concern about protectionism from the USA. Are Indian exports particularly vulnerable? In a world of supply chains, just looking at a country’s share of exports to the USA is very inadequate. India may export to the Middle East which may, in turn, add some value and re-export to the USA. Therefore, we need a more holistic manner of estimating direct and indirect exposure to the USA. To capture all effects, we estimate how a country’s exports are impacted by a change in US imports, holding constant other proximate drivers (global growth, real exchange rate).
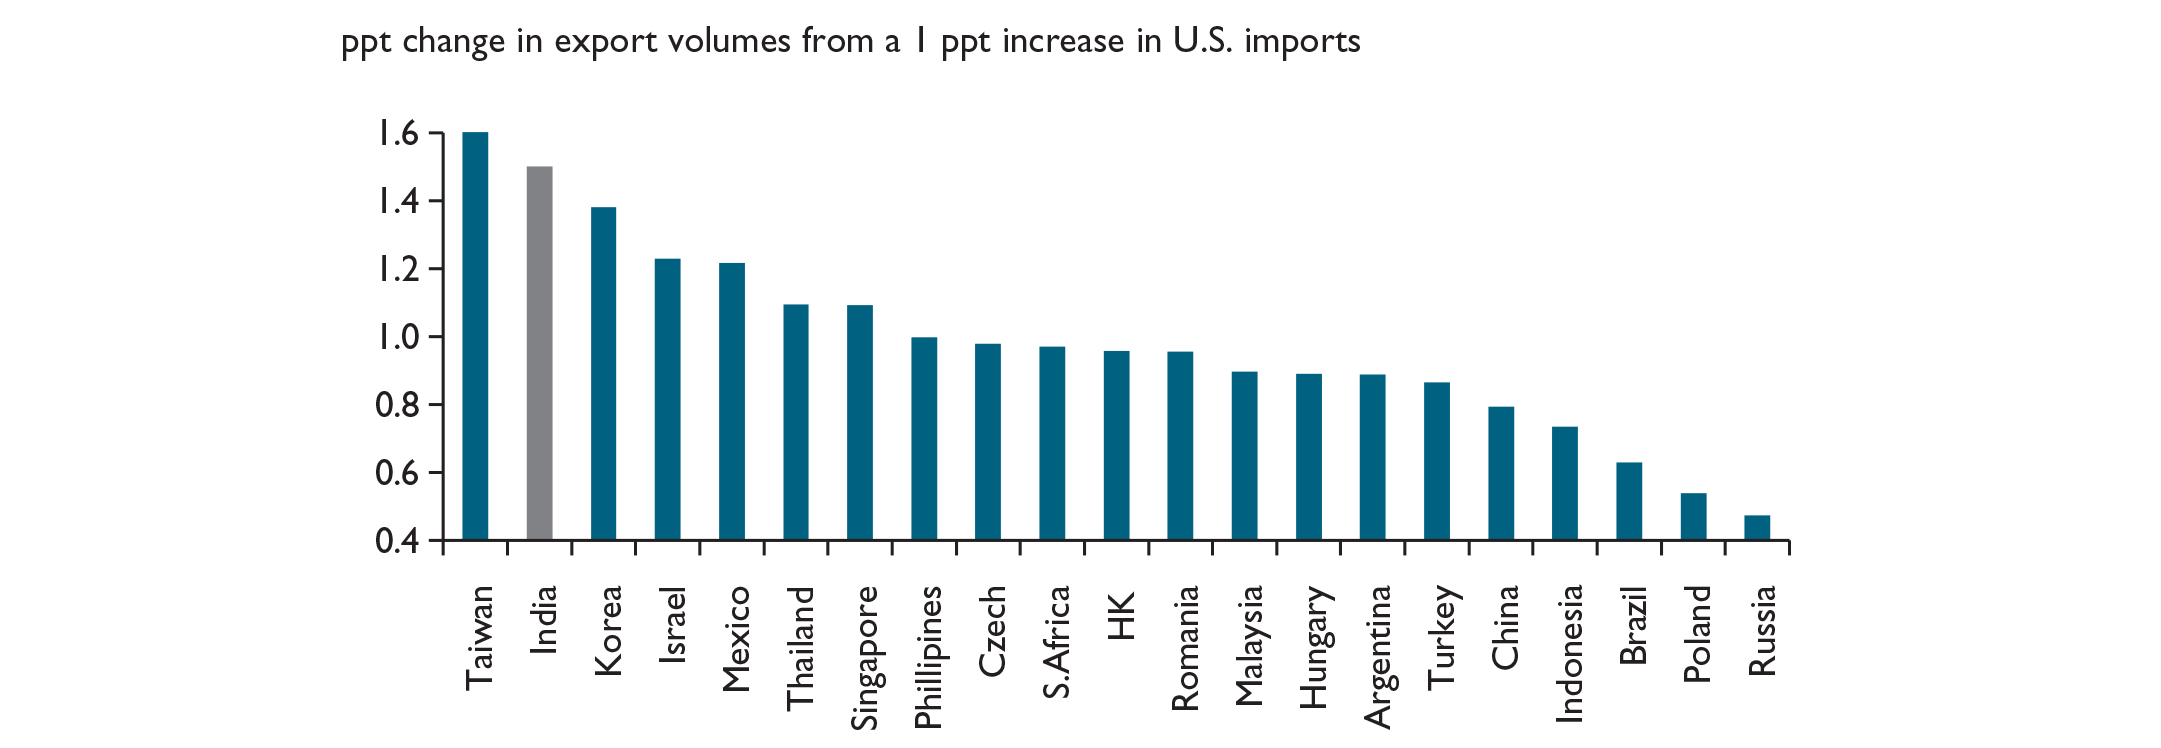
The results are quite stunning. Among the universe of EM countries that we consider, India’s export sensitivity to US import changes is the second highest (Figure 7), suggesting that India’s exports to the USA, both direct and indirect, are particularly vulnerable to the US business cycle and therefore more discretionary in nature. This is perhaps explained by the fact that a significant fraction of India’s exports to the USA are software and business process outsourcing (BPO) services, engineering goods, and pharmaceuticals, all of which have a high computed sensitivity to partner country demand.
This is not to say, however, that the growth impact in India would be the highest. That would also depend on the share of exports/GDP, with several other EMs having a higher share of exports/GDP. In India’s case, however, this high elasticity of 1.5, combined with an exports/GDP ratio of 20, suggest that every percentage point reduction in US imports would depress India’s GDP growth by about 0.2–3 percentage points depending on the import content of exports. 34
Potential Impact of BAT on EM, Morgan Markets, J. P. Morgan.
So India’s growing vulnerability to adverse global growth shocks or increased protectionism stems from the fact that:
India’s export/GDP ratio has doubled over the last 15 years; the changed composition of India’s exports has made the basket more ‘cyclical’; and India’s export sector is particularly vulnerable in the USA.
IS 7 THE NEW 9?
What does all this mean for India’s growth prospects? Here’s the best kept secret in Indian macroeconomics. That India’s much-celebrated 9 per cent growth in the 2000s came largely on the back of surging export growth as global growth lifted and India plugged into the global export market.
Consider this. India could attain 8.8 per cent average growth between 2003 and 2008 because exports were surging at nearly 18 per cent per year in those five years. In contrast, private consumption grew at about 7.5 per cent and, in fact, has averaged about 7 per cent over the last 15 years (see Figure 8).
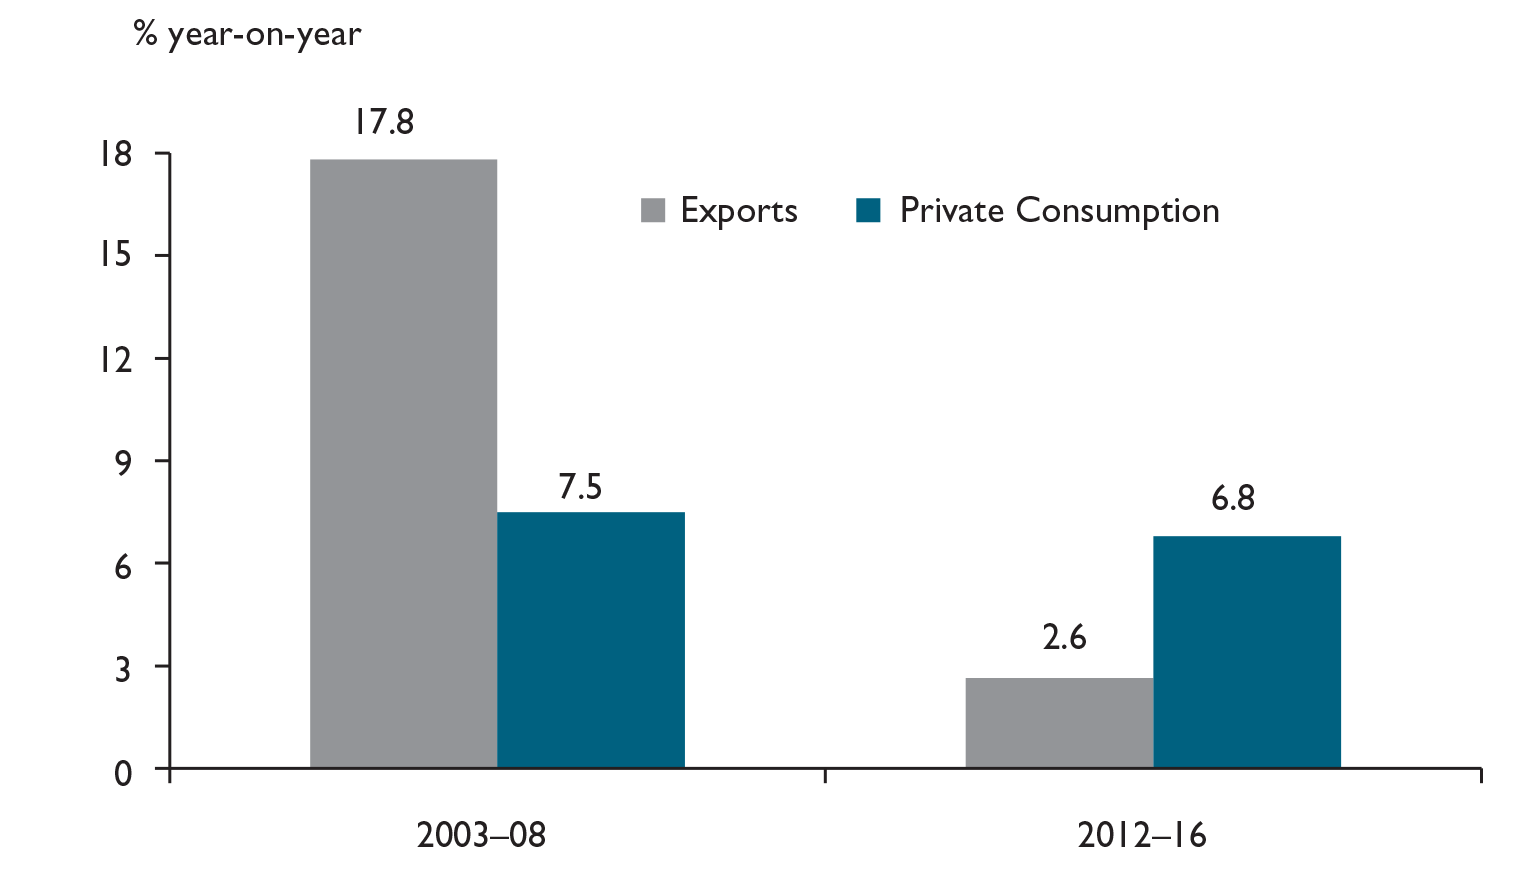
Why does this matter? Because de-globalization can have very real consequences for India’s growth prospects and potential. In the last 5 years, for example, exports have grown at just 2.6 per cent. What if this is the new normal? With exports being 20 per cent of GDP, if exports were to grow at 5 per cent instead of the 18 per cent growth witnessed in the 2000s, and given that the estimated import content of exports is about 25 per cent, that would mean that GDP growth prospects would fall by a full 2 percentage points. In other words, India’s much-vaunted 9 per cent GDP growth witnessed in the 2000s would reduce to 7 per cent in the current environment, if exports were to grow at 5 per cent (twice the run rate of the last 5 years). In other words, in this increasingly de-globalized world, 7 per cent should be considered the new 9 per cent.
WANTED: NEW GROWTH DRIVERS
The corollary of this is that India needs new growth drivers. If exports will not power growth and investment, where will the growth come from? In this global environment, flush with manufacturing capacity, it will take a brave entrepreneur to invest in a new manufacturing facility in India. Cheap Chinese exports would appear a much less risky option to some, especially given the rupee’s appreciation versus the Chinese yuan over the last two years.
Instead, the growth will need to come from public and private investments in physical and human infrastructure, where India stares at a large deficit. But any sustained public investment thrust will necessitate creating commensurate fiscal space. Where will that space come from? Asset sales remain the only sustainable option in the medium term, one that policymakers must take seriously.
Similarly, any private investment in infrastructure will require getting rid of the debt overhang on public sector banks and private sector balance sheets. This, in turn, will require—in some form or another—‘creative destruction’ of capital, the political economy of which is daunting. But we cannot dither any further.
Boosting supply in the Indian context is critical. As the French economist Jean-Baptiste Say once said, supply creates its own demand. If Indian policymakers double down on the generation of physical and human capital, it will generate demand of its own, while simultaneously addressing a key bottleneck in the economy and improving productivity. Just think back to what the golden quadrilateral or rural infrastructure did to boosting asset prices, rural and urban demand, and, most of all, firm productivity and competitiveness. This must be the policy antidote to ‘deglobalization’.
India has benefited enormously from global integration on the real side. The flip side is we are more exposed and vulnerable to current global risks than we might envision. The sooner we accept and prepare for this reality, the sooner we can lay the ground work for a new set of growth drivers in the current global environment.
The views expressed in this article are those of the author and do not necessarily reflect the views and policies of the ADB or its board of governors or the governments they represent.
Economist
India Resident Mission
Asian Development Bank
e-mail:
India too has not been spared from the vagaries of the capital flows as its integration with global markets deepened over time. Dua and Sinha (2007) pointed out that an important reason for the Indian economy remaining unaffected by the Asian financial crisis was its weak linkage with the crisis-affected countries, and the presence of extensive capital controls. 36
Stabilization policies such as intervention in the foreign exchange market and tightening of monetary policy also helped in stymieing the contagion effects.
Dua, P., & Sinha, A. (2007). Insulation of India from the East Asian crisis: An analysis. The Singapore Economic Review, 52(3), 419–443.
Eichengreen, B., & Gupta, P. (2015). Tapering talk: The impact of expectations of reduced Federal Reserve security purchases on emerging markets. Emerging Markets Review, 25(C), 1–15.
We briefly outline the pattern of India’s integration with global capital markets during the last 25 years and the challenges arising out of this greater integration.
INDIA’S PATTERN OF CAPITAL ACCOUNT LIBERALIZATION
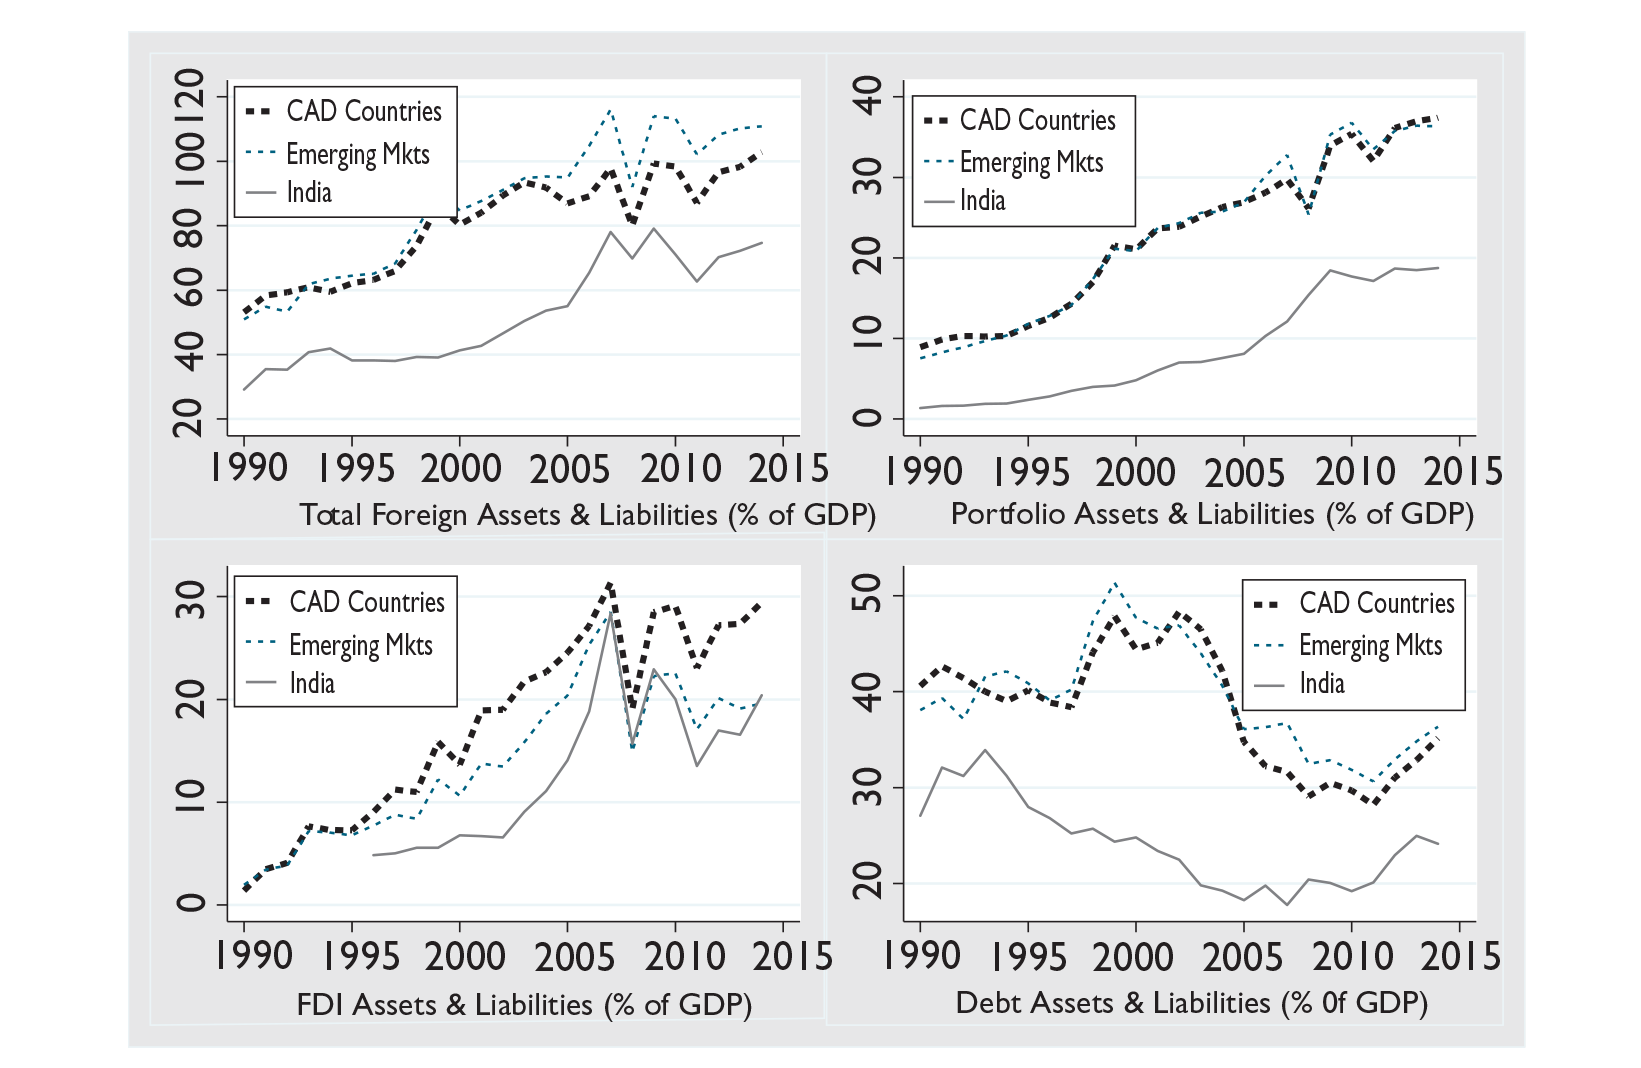
Capital account liberalization in India has taken place in a gradual manner, and has been viewed as a continuous process rather than a one-off event. The extent of liberalization has increased as India made greater progress on related reforms such as deregulation of interest rates, fiscal consolidation, reduction in deficit monetization, as well as enhanced macroeconomic stability as growth rates improved, CAD declined, and inflation moderated. However, India has been relatively conservative in liberalizing the capital account relative to other emerging markets. In Figure 9, a comparison of capital account liberalization, measured by the ratio of the sum of foreign assets and liabilities to GDP, shows India lagging other emerging markets by a considerable margin. Thus, while by 2014, the sum of assets and liabilities had increased to 74 per cent of GDP in India, it averaged more than 110 per cent of GDP in emerging markets. 39
Lane, P. R., & Milesi-Ferretti, G. M. (2007). The external wealth of nations mark II: Revised and extended estimates of foreign assets and liabilities, 1970–2004. Journal of International Economics, 73(2), 223–250.
A decomposition of the capital flows shows that while India kept pace with emerging markets in liberalization of FDI flows, it has lagged behind in the case of portfolio flows and debt flows (Figure 9). This is primarily driven by the hierarchical nature of liberalization followed in India where non-debt flows have been given preference over debt flows, and within non-debt flows, direct investment flows have been the preferred choice compared to portfolio investments.
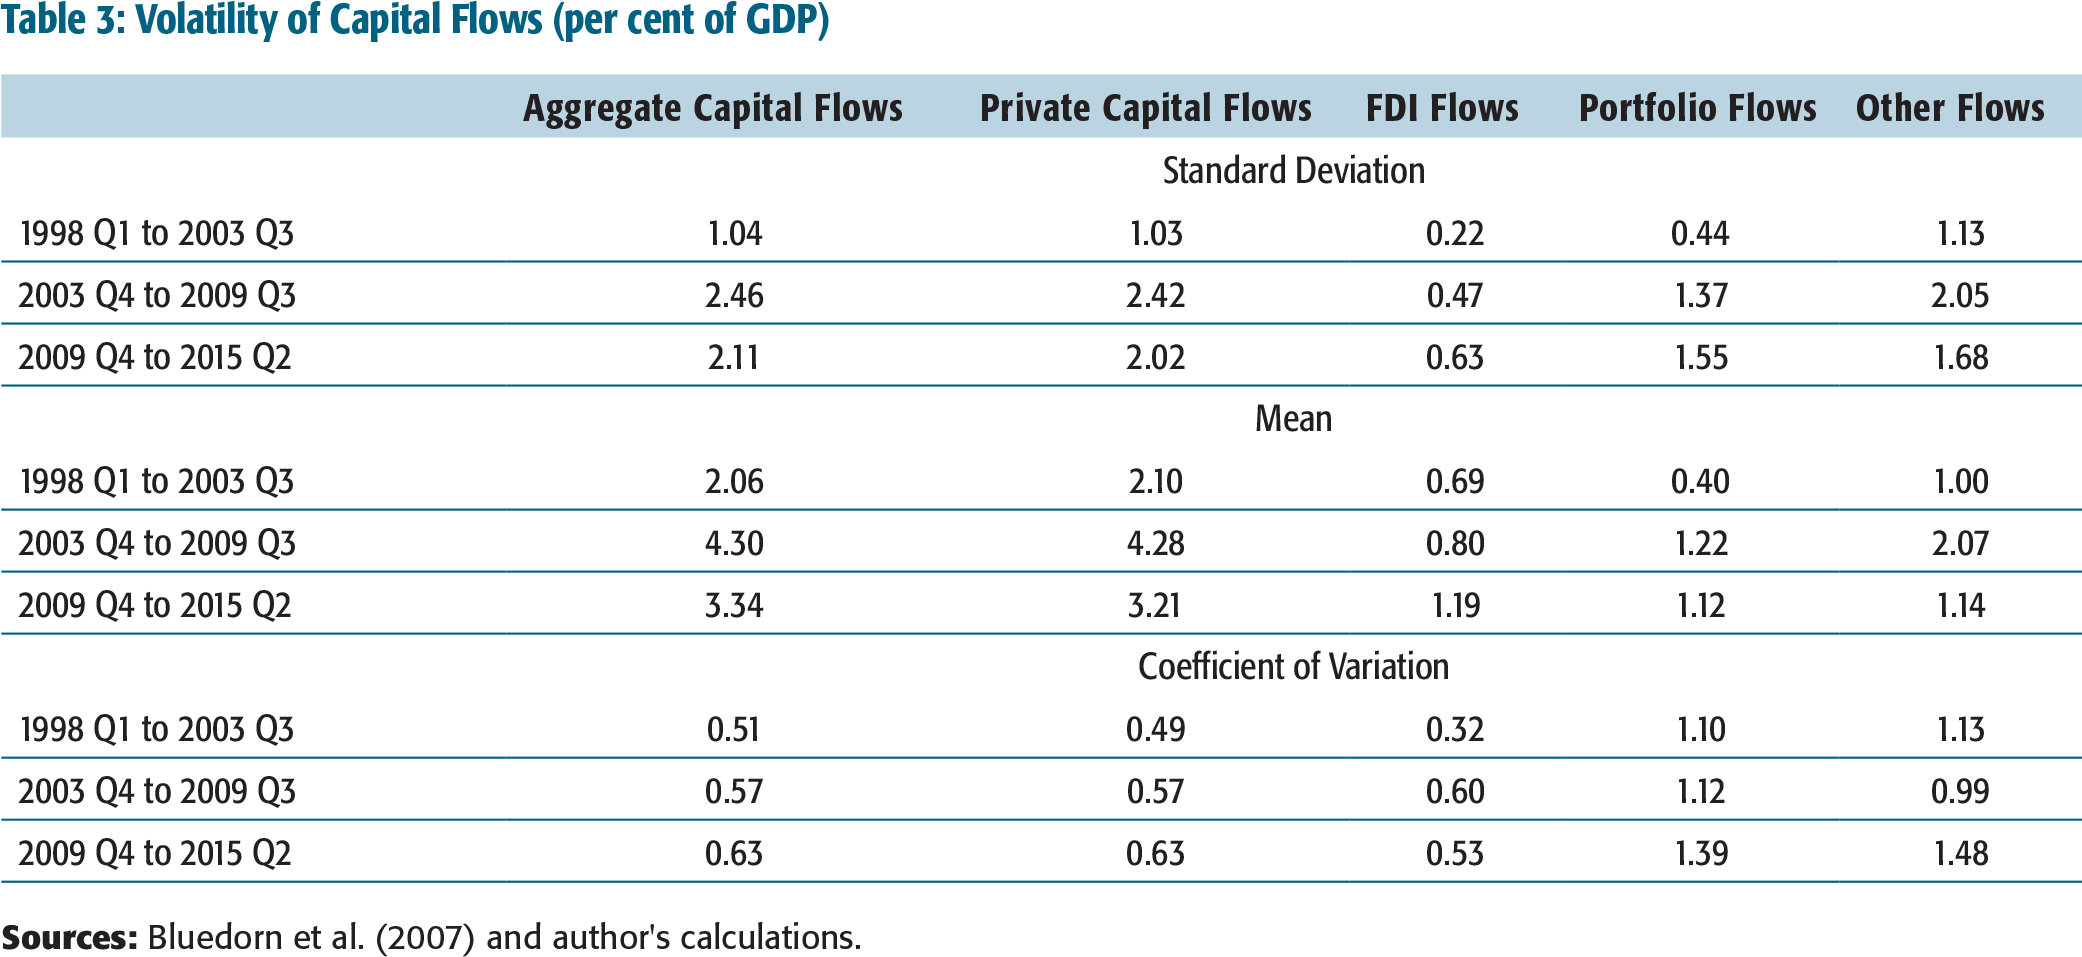
This increase in liberalization was accompanied by greater volatility of capital flows, creating concerns of macroeconomic management. Following Bluedorn, Duttagupta, Guajardo, and Topalova (2013), we evaluate volatility of capital flows (per cent of GDP) to India by looking at standard deviation of different types of net capital flows across three periods: 1998 Quarter 1 to 2003 Quarter 3, 2003 Quarter 4 to 2009 Quarter 3, and 2009 Quarter 4 to 2015 Quarter 2. 40
Bluedorn, J. C., Duttagupta, R., Guajardo, J., & Topalova, P. (2013). Capital flows are fickle; anytime, anywhere (IMF Working Papers 13/183). International Monetary Fund.
Table 3 shows that if one measures volatility by just the standard deviation, then volatility was highest for capital flows in the second period, largely due to heightened volatility of ‘other flows’, which covered bank and other non-bank flows. However, once we normalize by average flows, there is a steady increase in volatility of private capital flows over the period. Among the components, while there was a sharp increase in volatility of portfolio flows, volatility in FDI and other flows moderated a bit in the second period before picking up in the final period. Capital flows volatility during this phase was influenced by investor uncertainty over the advanced economies’ recovery prospects, large swings
Volatility of Capital Flows (per cent of GDP)
DOES SPORADIC USE OF CAPITAL FLOW MANAGEMENT MEASURE WORK?
Emerging economies have tried to counter the volatility of capital flows by adjusting regulations that control their inflow or outflow. While India has steadily moved towards greater opening of the capital account, it has also periodically introduced measures to regulate the flow of foreign capital. 41
For a review of efficacy of capital controls please refer to the following papers: (a) Patnaik, I., & Shah, A. (2011). Did the Indian capital controls work as a tool of macroeconomic policy? (Working Papers 11/87). National Institute of Public Finance and Policy; and (b) Sen Gupta, A., & Sengupta, R. (2016). Capital account management in India. Economic and Political Weekly, 51(12), 103–111.
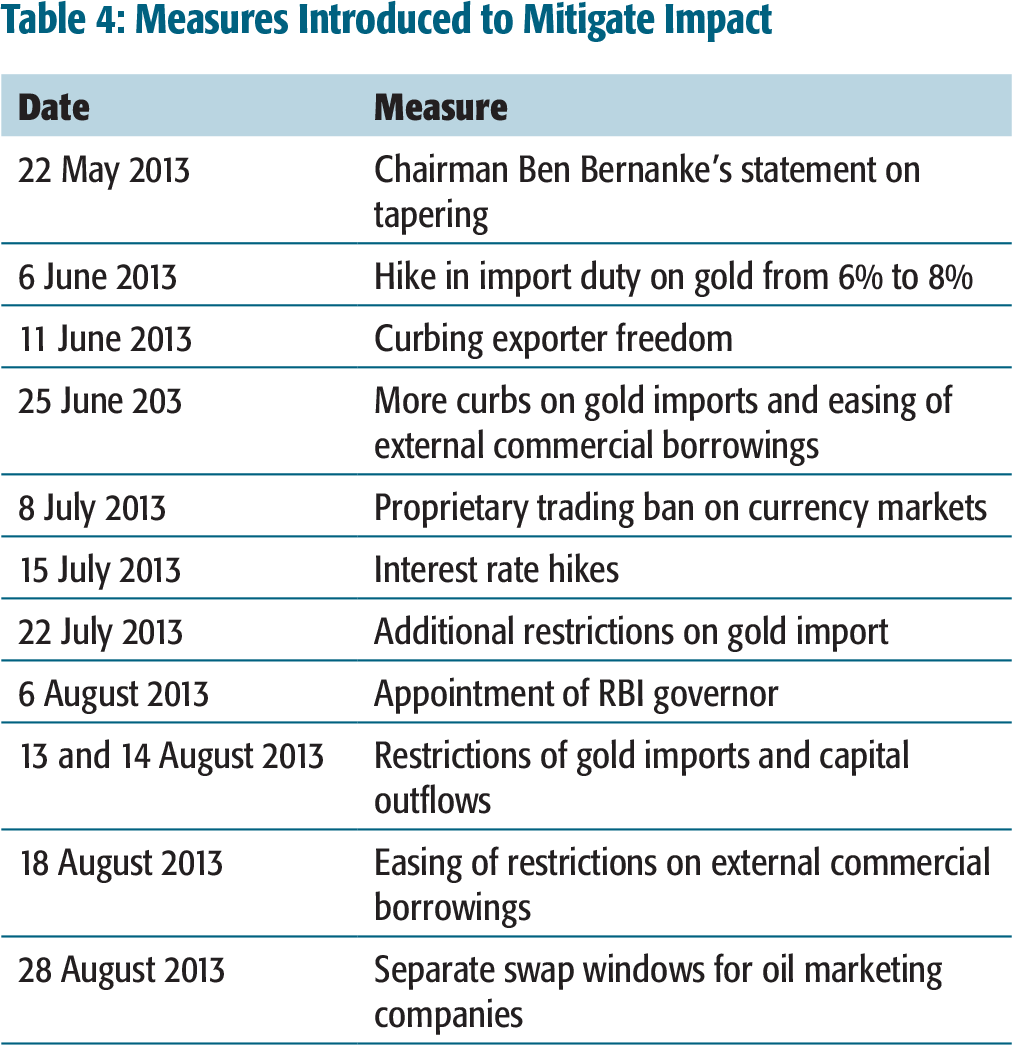
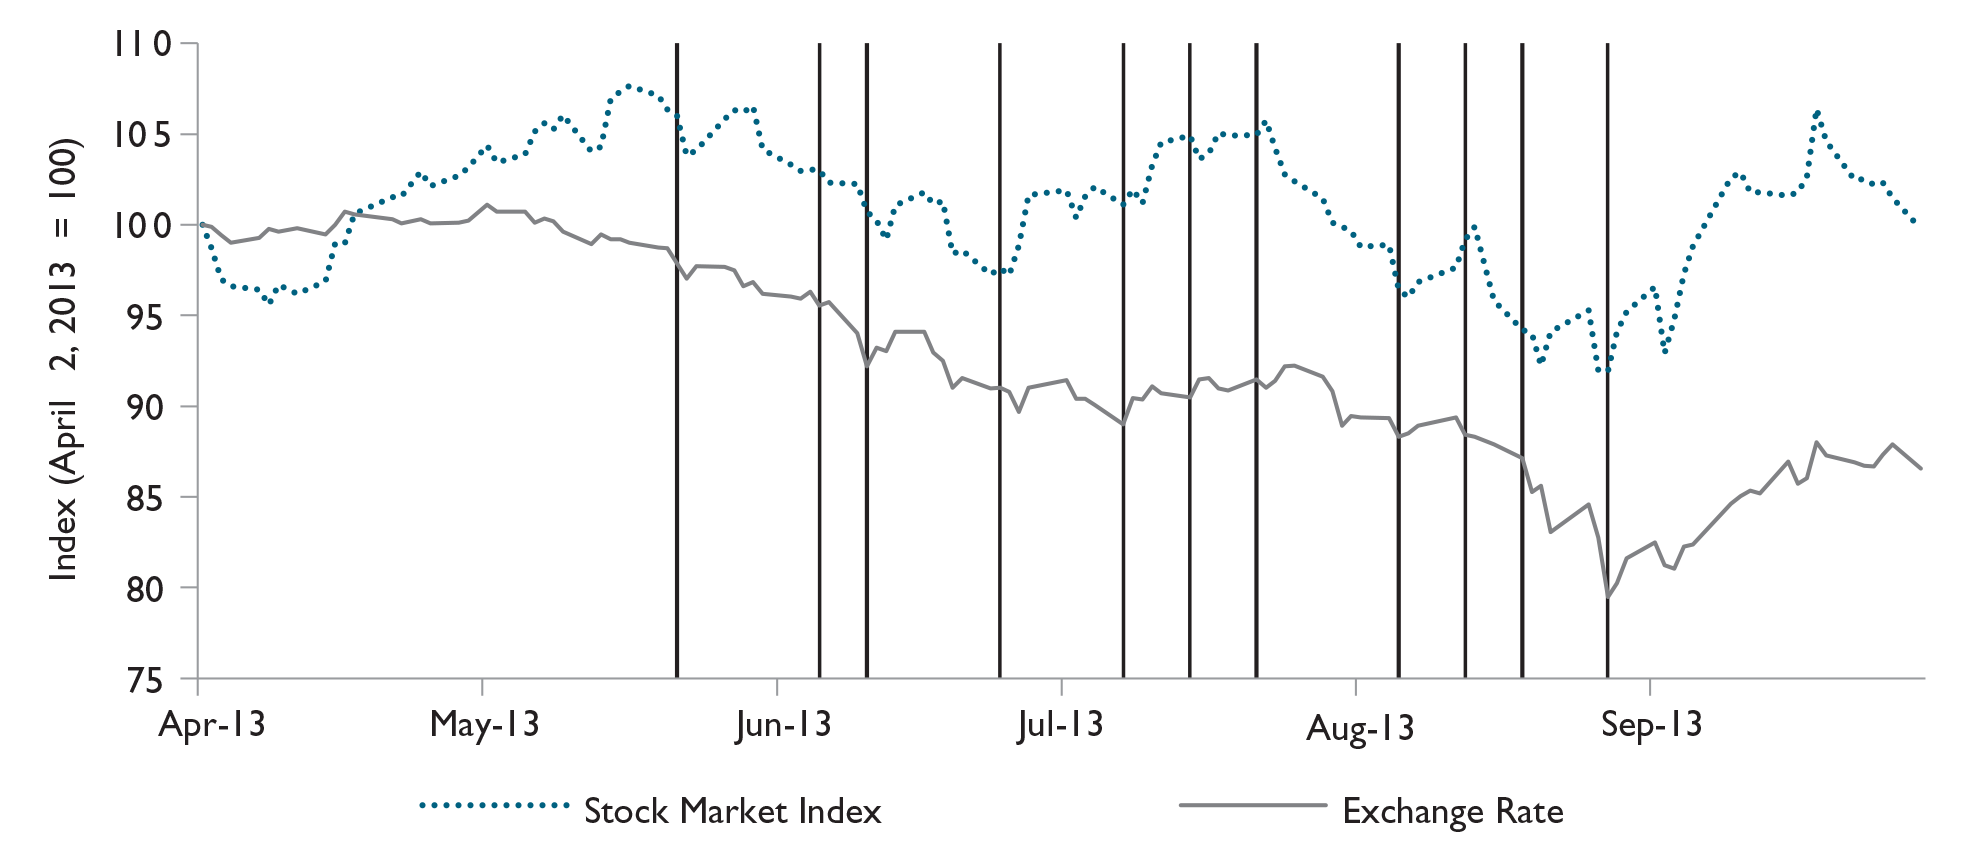
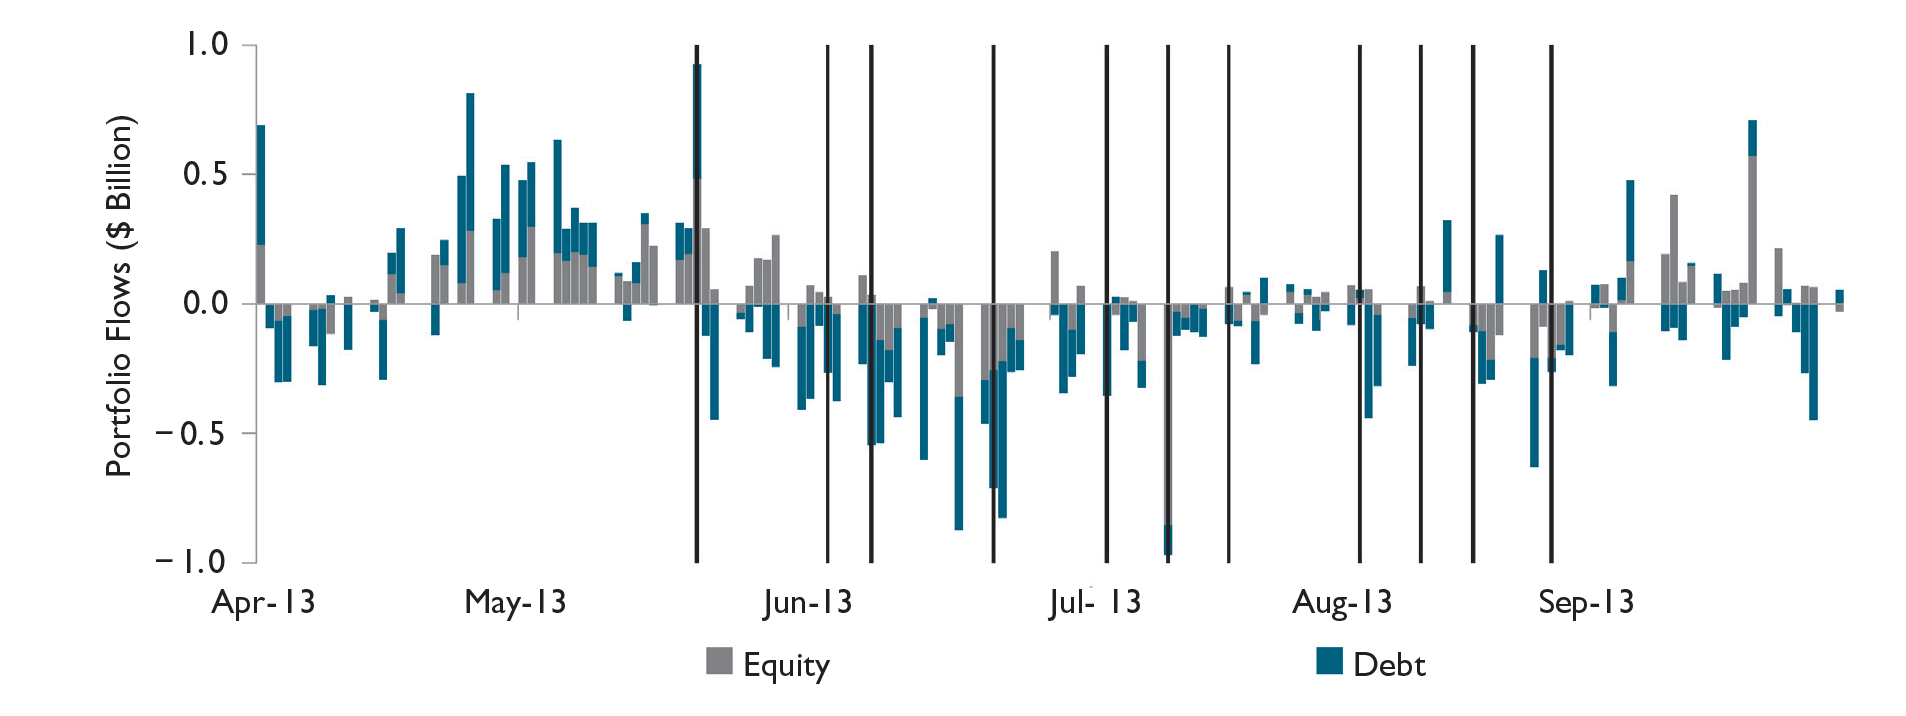
In response, the policymakers initiated a host of policy measures aimed at stemming the outflow of capital, rallying the stock market and halting the decline in the value of the rupee. These measures ranged from restricting outflow of capital, hiking interest rates, restricting import of gold to improve the CAD, opening a separate swap window for oil marketing companies to segregate their demand for foreign exchange, and intervention in the foreign exchange market (Table 4). While Figure 10a traces the movement in the stock market and the bilateral rupee–US dollar exchange rate during the period April–September 2013, Figure 10b highlights the net inflow of equity and debt portfolio investment.
To gauge the effectiveness of these measures, we focus on four variables, namely percentage change in nominal exchange rate, percentage change in stock market index, net portfolio equity inflow, and net portfolio debt inflow. We consider the behaviour of these variables during a period of seven days before the introduction of measure, and compare it with their behaviour over a period of seven days after the introduction of the measure. A capital flow management measure is deemed effective, if there is a significant change in the behaviour of the variable after the imposition of these measures. 42
We use a means equality test to compare the average movement in these variables before and after the imposition of the capital control measures.
Measures Introduced to Mitigate Impact
The results are reported in Table 5. The first and second columns under a measure enacted describe the behaviour before and after the introduction of the measure, respectively. Thus, a positive number in the first or the second column would imply an appreciation of the rupee, rise in the stock market index, or a net inflow of equity and debt investment. The third column calculates the difference in behaviour before and after introduction of the measure. The term in the parenthesis indicates whether the difference is statistically significant or not.
It is evident that the overall impact of these measures are relatively muted. None of these measures had a statistically significant impact on the rupee–dollar exchange rate. Similarly, almost none of these measures elicited a significantly different reaction from the stock market. The only measure, which produced a significant reaction from the stock market, was the imposition of the restriction that 20 per cent of imported gold to be made exclusively available for exporters and another 20 per cent to be retained in customs warehouse. However, the direction of reaction was opposite of what was intended as the stock market index declined even at a faster clip after the imposition of this measure. The policy measures had slightly more success in stemming outflow of portfolio capital. For example, the 200 basis points increase in the overnight lending rate on 15 July 2013, along with tightening of liquidity by changing the reserve requirements, helped to reduce the quantum of portfolio equity and debt outflow. A similar result was observed in the case of measure enacted on 22 July 2013 to restrict gold imports. However, there were also a number of instances where a measure had the opposite impact on capital flows as it might have indicated a sign of panic. For example, the pace of capital outflow increased significantly after the initial increase in the import duty on gold on 6 June 2013 as well as the second round increase in import duty on gold on 13 August 2013, and restrictions on remittances by domestic residents and outward direct investment on 14 August 2013.
Mean Equality Tests to Evaluate Impact of Capital Account Management Measures
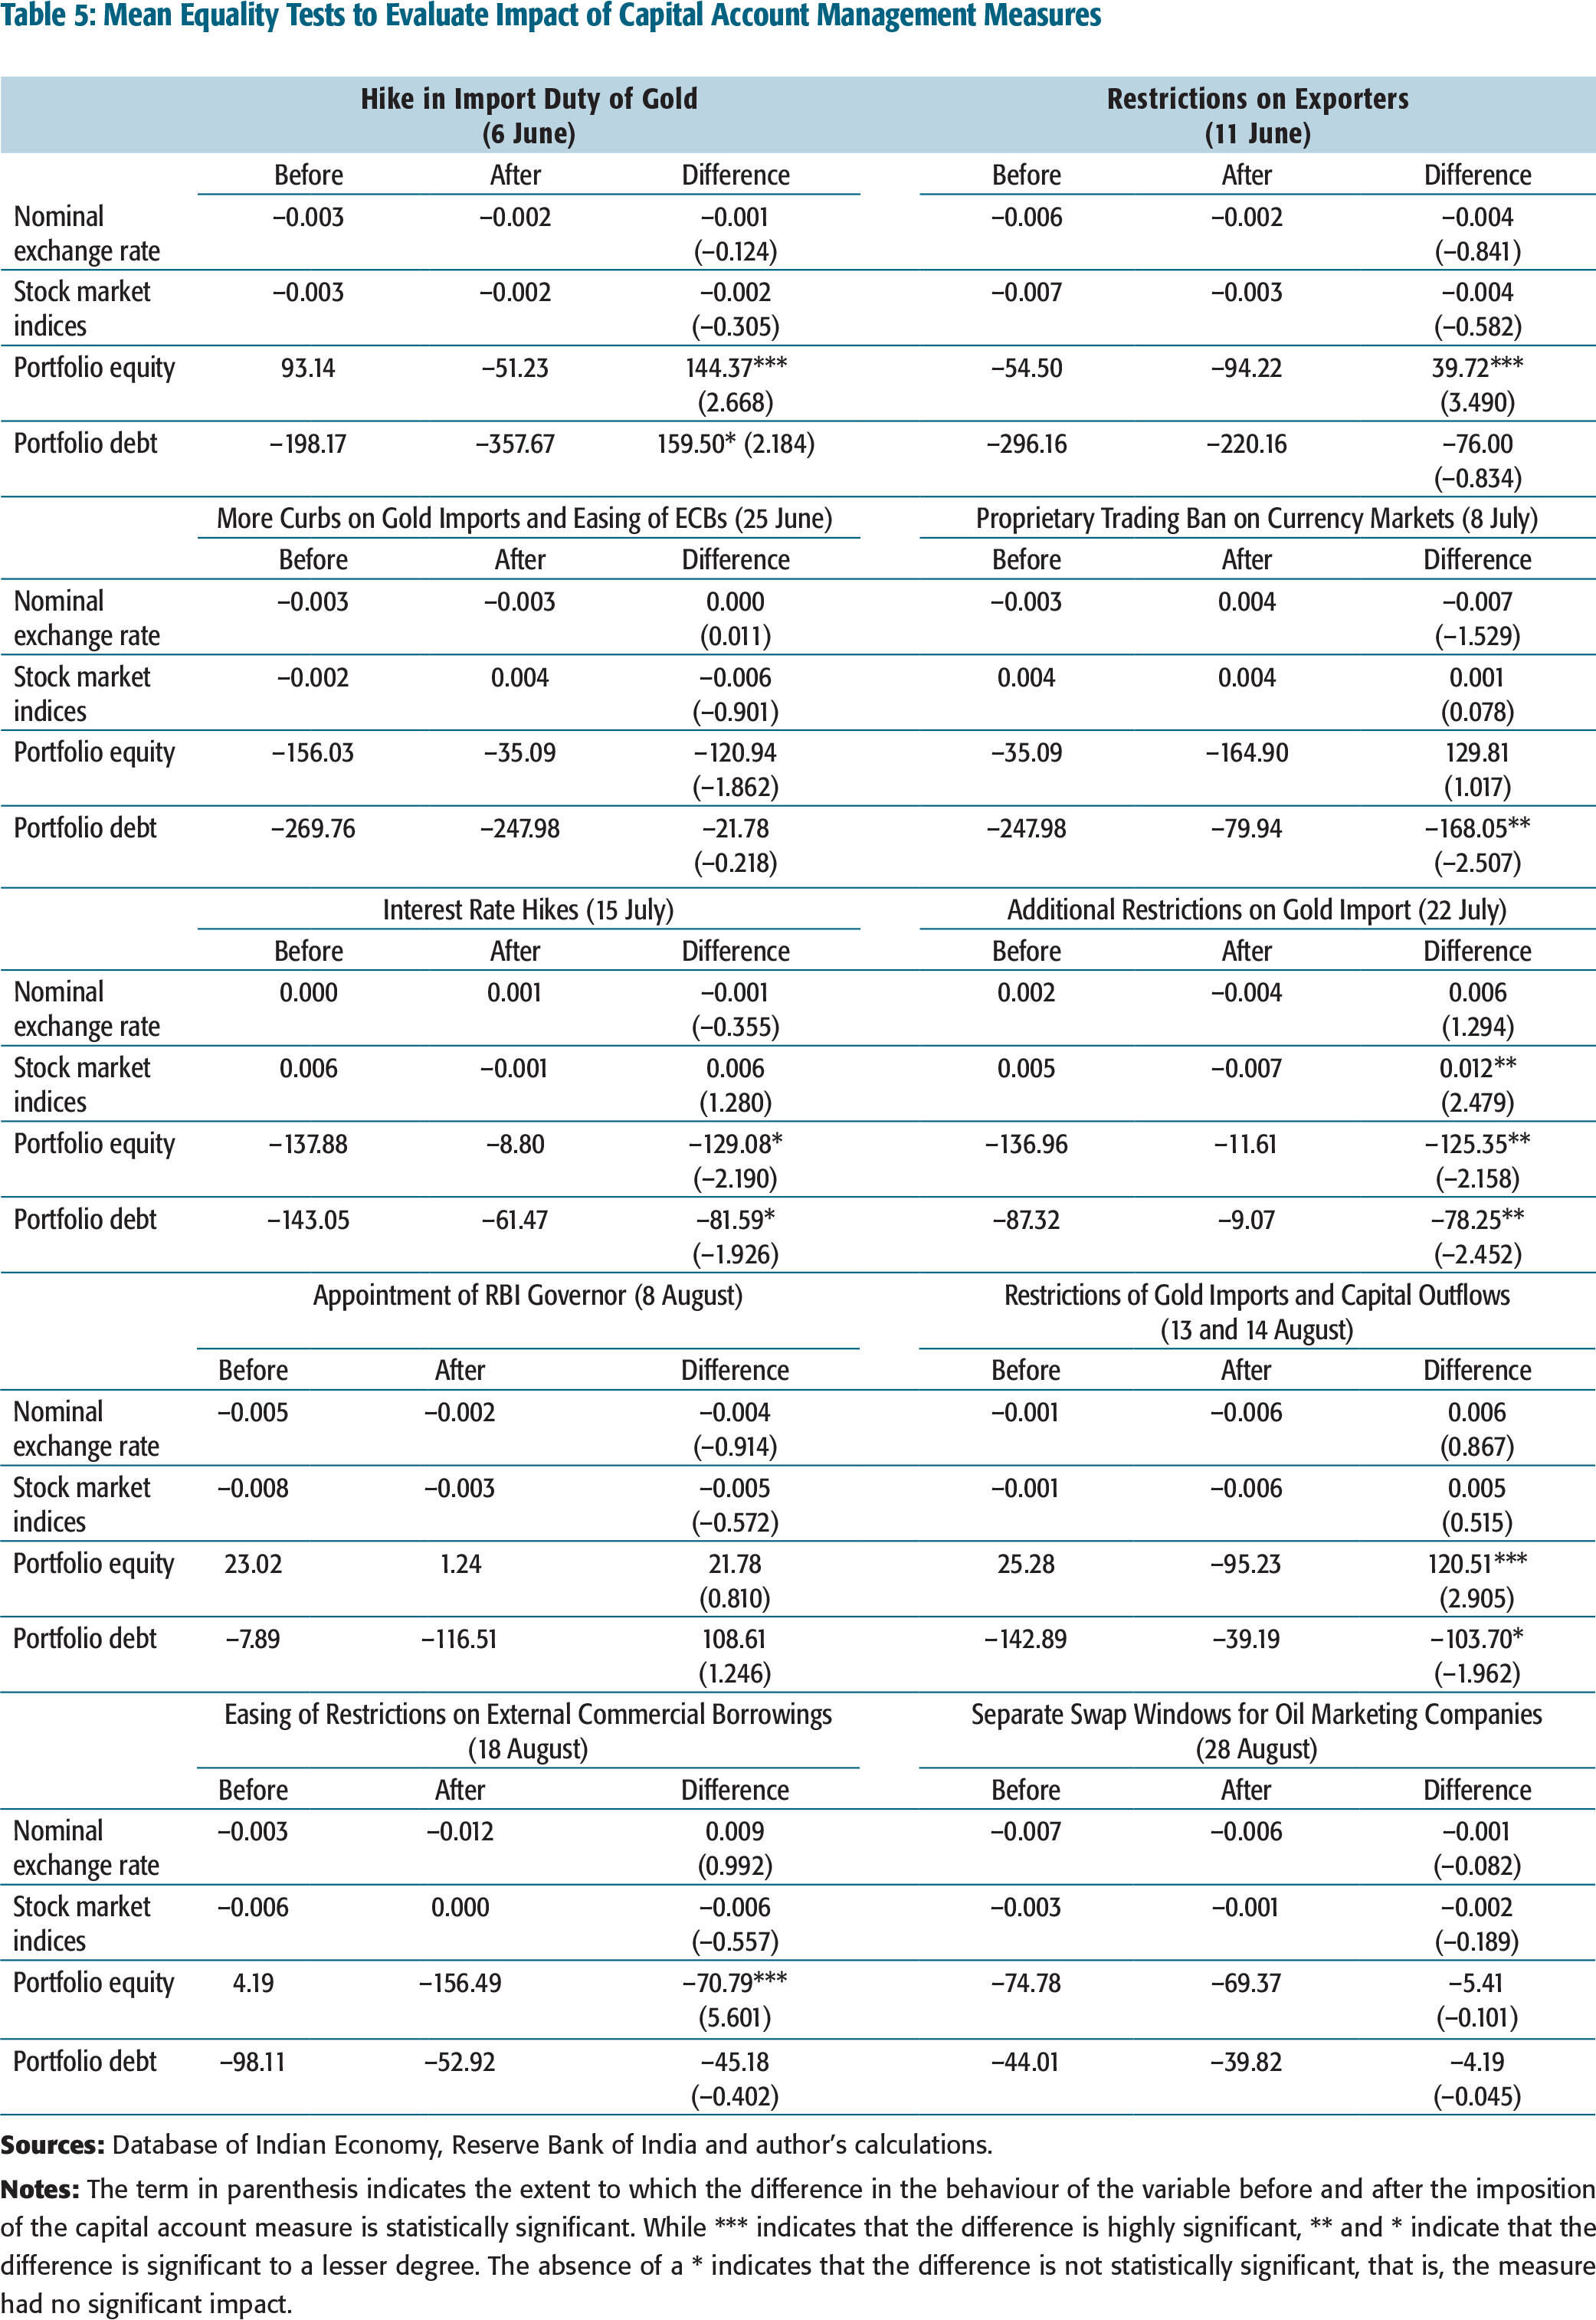
Thus, the evidence suggests that the sporadic measures introduced in mid-2013 to encourage inflows and discourage portfolio outflows had very limited success in achieving their objectives. This is in line with existing studies that find transitory capital account management measures have a relatively limited impact on the magnitude of flows. 43
Magud, N. E., & Reinhart, C. M., & Rogoff, K. S. (2011). Capital controls: Myth and reality: A portfolio balance approach (NBER Working Papers 16805). National Bureau of Economic Research, Inc.; Ostry, J. D., Ghosh, A. R., Chamon, M., & Qureshi, M. S. (2011). Capital controls: When and why? IMF Economic Review, 59(3), 562–580.
MAINTAINING A STRONG RESERVE COVERAGE
Basu, Eichengreen, and Gupta (2015) argued that one of the reasons India was impacted harder by the tapering talk compared to other emerging economies was the decline in effective reserve coverage. 44
Basu, K., Eichengreen, B., & Gupta, P. (2015). From tapering to tightening: The impact of the Fed’s exit on India. India Policy Forum, National Council of Applied Economic Research, 11(1), 1–66.
India’s reserves have increased from being virtually non-existent in the early 1990s to over US$360 billion in October 2016. However, the increase in reserves did not take place in a monotonic manner. There have been periods when reserve holdings have sharply increased interspaced with periods and when reserve holdings have fallen or remain stagnant. We use the Bai and Perron (2004) test to identify the presence of structural beaks in reserve accumulation. We find the presence of five such breaks, implying six phases of reserve accumulation, which are illustrated in Figure 11a, while Figure 11b highlights the corresponding sale and purchase of foreign assets by RBI. 45
Data on sale and purchase of foreign assets is available from June 1995 onwards. A positive (negative) bar indicates net sale (purchase) of foreign asset during that month.
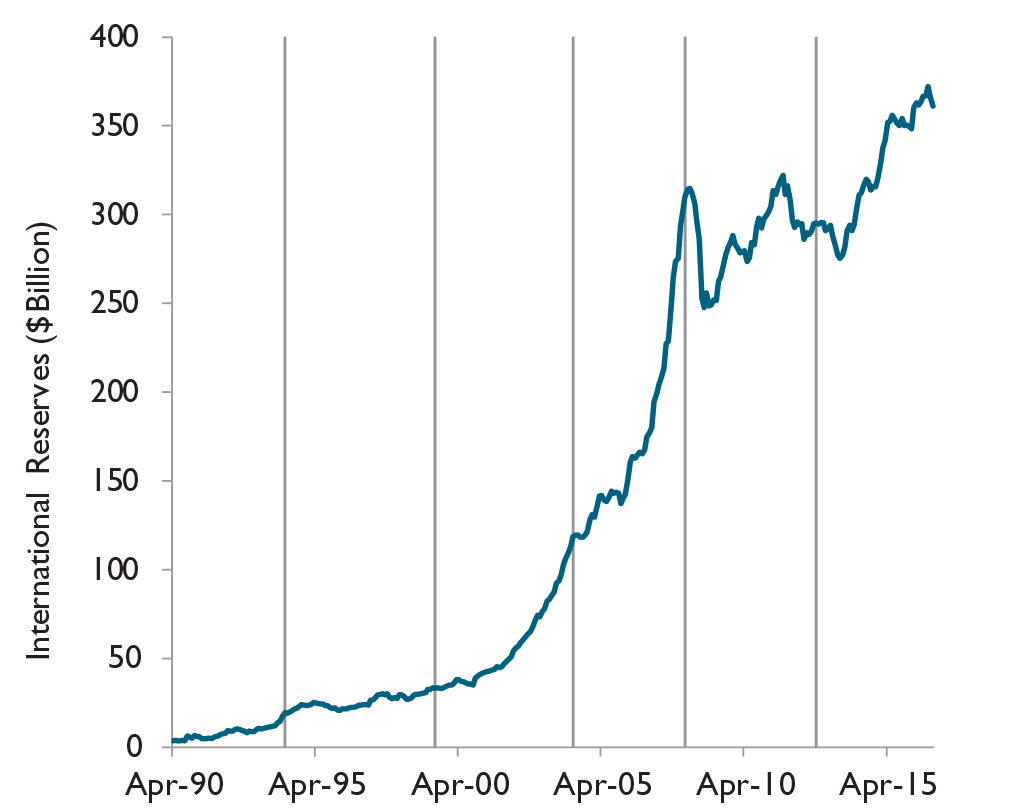
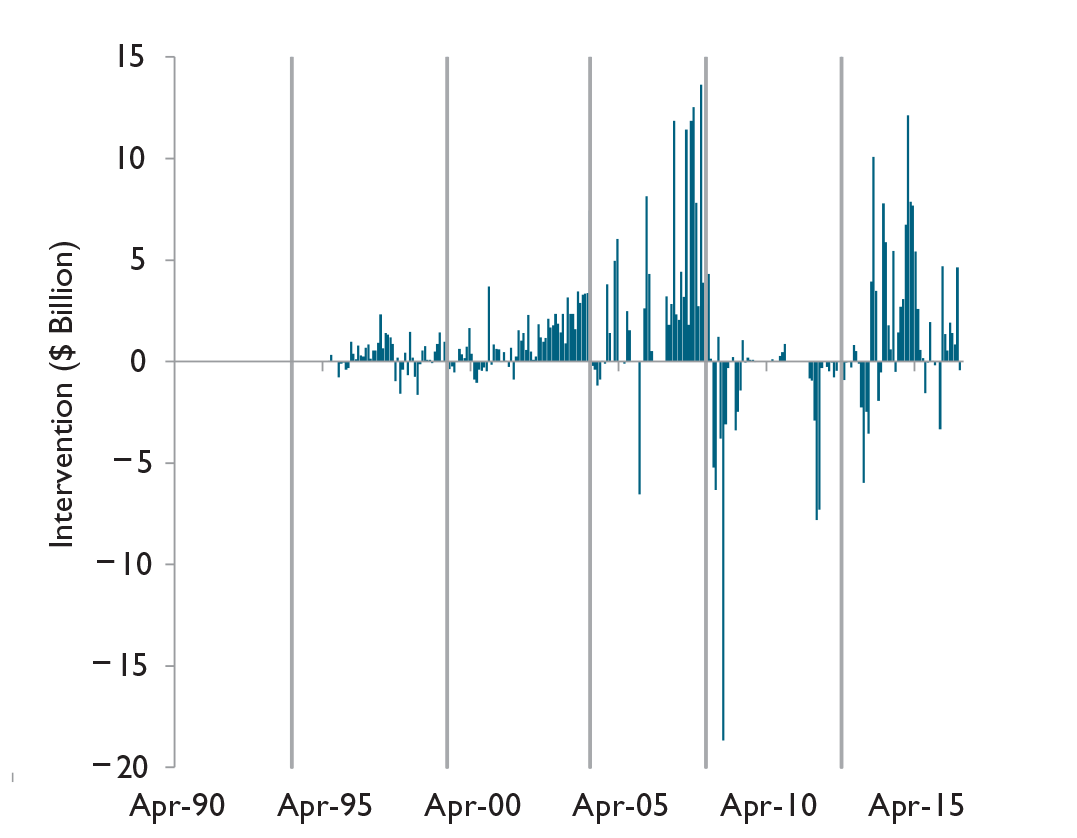
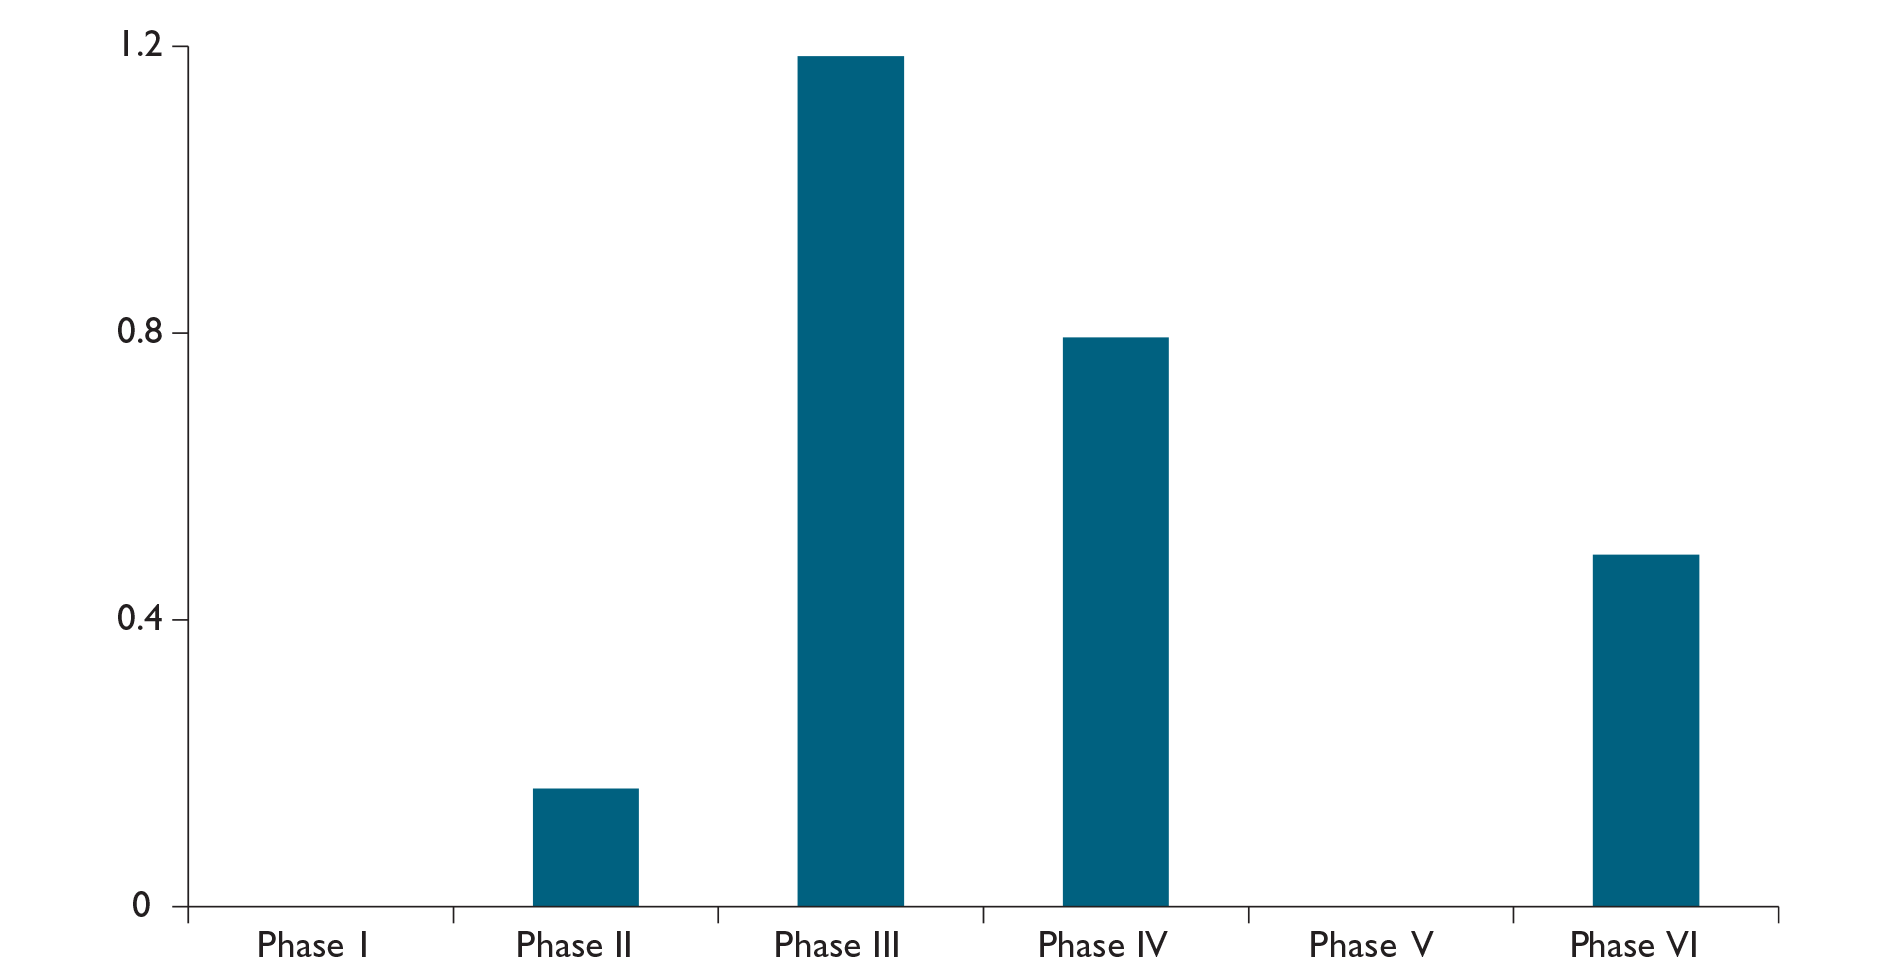
As is evident, a substantial part of India’s reserve was accumulated during Phases III (June 1999–April 2004), IV (May 2004–March 2008), and VI (March 2013–June 2016). Both the sharp rise in reserves as well as the monthly intervention data indicate substantial and sustained purchase of foreign assets during these phases. This was done with a view to prevent a rapid appreciation of the rupee in the face of strong capital inflows. This fear of appreciation stems from the fact that rapid appreciation of the rupee will lead to exports becoming uncompetitive and demand for imports increasing, and lead to balance of payments difficulties. This fear of appreciation leads to central bank to intervene asymmetrically in the foreign exchange market. For example, during periods of strong current or capital account surpluses, there is pressure on the domestic currency to appreciate. The central bank mitigates this pressure by accumulating reserves, as there is a fear of appreciation. However, during periods of large current or capital deficits, the central bank has a hands-off approach as it does not fear depreciation. Pontines and Rajan (2011) and Sen Gupta and Sengupta (2013), 46
Pontines, V., & Rajan, R. S. (2011). Foreign exchange intervention and reserve accumulation in emerging Asia: Is there evidence of fear of appreciation? Economics Letters, 111(3), 252–255.
Sen Gupta, A., & Sengupta, R. (2013). Management of capital flows in India (South Asia Working Paper No. 17). Asian Development Bank.
We find that policymaking has exhibited a fear of appreciation in four of the six phases we are interested in. The strongest resistance against appreciation was observed in Phase III during which India’s reserve holdings grew by 256.2 per cent, followed by Phase IV when reserve holdings grew by 161.4 per cent. In contrast, during Phase V, that is, the period just before the FRB’s signal of tapering its bond purchase, reserve holdings contracted by 5.7 per cent as the RBI sold foreign assets to counter the withdrawal of foreign capital, and mitigate the consequent weakening of the rupee. The RBI sold nearly US$32 billion between September 2008 to May 2009 in the aftermath of the GFC, and another US$24 billion between September 2011 and February 2013, as India grappled with investor uncertainty arising out of the European debt crisis. Moreover, there was no attempt to build up reserves during this period, including in quarters when India received strong capital flows. Consequently, as described in Table 6 India’s reserve adequacy had considerably worsened in March 2013 compared to March 2008.
Reserve Adequacy Measures
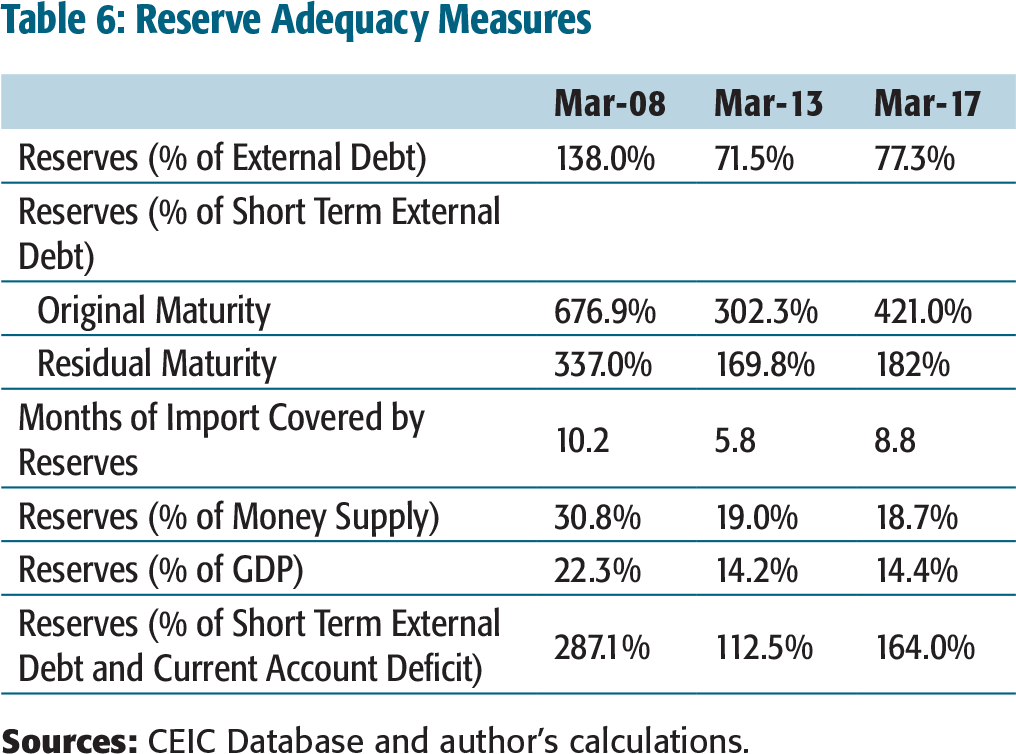
CONCLUSION
Over the last two and a half decades India has significantly raised its integration with the global markets, although there continues to be some elements of discretionary control over some capital flows. This has made India vulnerable to surges and stops of capital flows when investors chose to rebalance their portfolios towards or away from EMs. This was exemplified in the tapering signal episode of mid-2013, when India was one of the hardest hit from capital outflows.
We also find that imposition of sporadic and transitory capital account management measures to stem the outflow of capital and attract more inflows had little impact on the desired outcomes. This is in line with the empirical finding that when a country has significantly liberalized its capital account, transitory or sporadic capital account management measures have relatively limited effect since agents find ways to circumvent these measures.
Finally, greater integration of the capital control also necessitates pursuit of more prudent macroeconomic policies and ensuring adequate reserve coverage. A fall in reserve coverage is taken as a drop in the power of the central bank to intervene in the foreign exchange market to stabilize the economy in the case of a sharp outflow.
Thus, as India increases its integration with global capital markets, it will need to pursue more prudent macroeconomic policy and ensure adequate protection against external vulnerabilities as not doing so entails a significantly higher cost compared to when India was less integrated.
Views are personal.
Senior Vice President and Chief Economist
Axis Bank
e-mail:
Authors calculation based on the former Planning Commissions 12th Five-Year Plan (2012–2017).
Retrieved from dbie.rbi.org.in
While there is ample evidence across countries on the medium term benefits of internationalizing their respective currencies, the proximate cost – benefit trade-offs for India are yet ambiguous. In so far as this process linked to broadening the capital account convertability(CAC), it introduces attendant risks in the domestic economy. As Brad Setser, an American economist, described in a media interview in 2016, ‘There is a fundamental conflict between preserving stability and allowing the freedom and flexibility required of a global currency.’ 51
Financial Times. (2016, December 11). Retrieved from https://www.ft.com/content/e480fd92-bc6a-11e6–8b45-b8b81dd5d080
An important factor in shaping investor confidence is the country’s currency. A stable currency is almost a necessary condition for increasing usage as a transaction instrument. The rupee has been steady after the bout of currency volatility in mid-2013. It is one of the most stable currencies among the emerging markets. Going forward, too, India’s macroeconomic metrics indicate continuing stability. The nominal anchor, inflation, is likely to remain stable at the current levels—close to the desired medium term target—and with an increasingly consistent and credible monetary policy at the helm, is likely to provide systemic stability to economic conditions.
India has many structural advantages. External debt is very low, compared to its emerging markets peers. Capital inflows are increasingly being facilitated, with the initiatives of the government and financial market regulators. The most evident efforts are in the area of equity inflows, via increasingly liberalized FDI facilitation. In FY17, gross FDI flows increased to US$60 billion, up from US$55.6 billion in FY16. 52
RBI Bulletin. (2017, May, Table 34, p. 72).
A brief digression into China’s path for RMB internationalization culminating in its inclusion in the IMF’s Special Drawing Right (SDR) basket might provide insights. To begin with, India lacks many of the tailwinds which favoured China in its efforts to internationalize RMB. India’s share of global trade was around 2 per cent (compared to China’s 14 per cent in 2015), with an overall current account deficit (compared to a surplus). 53
Retrieved from http://pib.nic.in/newsite/PrintRelease.aspx?relid=154454; http://stat.wto.org/CountryProfile/WSDBCountryPFView.aspx?Country=CN; and http://stat.wto.org/CountryProfile/WSDBCountryPFView.aspx?Country=IN&Language=F
China’s efforts to internationalize the RMB started as far back as 2000, with a clear strategy of moving progressively from usage for trade finance, then for investment and finally, over a period of time, as a reserve currency. 54
Norman Chan, Chief Executive, Hong Kong Monetary Authority, HKMA inSight, 18 February 2014.
This brings us back to accessing offshore debt markets, with the consequent interest and currency market risks this entails. Former Governor Dr Raghuram Rajan, in his inaugural statement in September 2013, asserted that India’s growing trade will enable policy to push more invoicing and settlement in rupees. The corollary was that India’s financial markets would need to open up investing these rupees in India. These comments were made in the immediate aftermath of a period of high volatility in India’s currency markets. Therefore, an underlying intent was the development of a deep and liquid foreign exchange market, with instruments designed to allow investors to hedge their risks. There has since been a steady and calibrated broadening of the instruments permitted, particularly to an increasingly broader class of offshore investors.
Indian rupee (INR) transactions are increasingly migrating to offshore markets (see Figure 13). The Bank for International Settlements (BIS) data (which does not include the UAE) shows that the share of Singapore in INR forward trade has increased at 15 per cent Compound Annual Growth Rate (CAGR) in the six years since 2010. The onshore forward turnover was about the same in all the other offshore centres (Singapore, HK, the UK, and the USA) in 2010. This had dropped to 80 per cent in 2016. Although it is a moot question, there are arguments in support of bringing Rupee markets onshore
Therein lies the problem. As Figure 14 shows, India’s futures markets showed a significant increase in turnover post the GFC. However, this was probably due to the advent of a particular exchange (Figure 15), and the volumes dissipated after that institution faced regulatory problems. This has inhibited market liquidity.
On the other hand, functioning offshore non-deliverable forward (NDF) markets offer an opportunity of increasing liquidity in FX transactions. China had a functioning offshore market in HK, which by the 2000s was already an established International Financial Centre. However, since these offshore markets do not require physical delivery of currencies, their role in incentivizing the use of the rupee is questionable. The Gujarat International Finance and Tec-City (GIFT) has started functioning and is gradually becoming more active. Its traded turnover is increasing and more institutions are providing a variety of financial services. India needs to imaginatively think about leveraging GIFT’s capabilities, which are hitherto being used as an offshore financial centre, to increase rupee-denominated transactions.
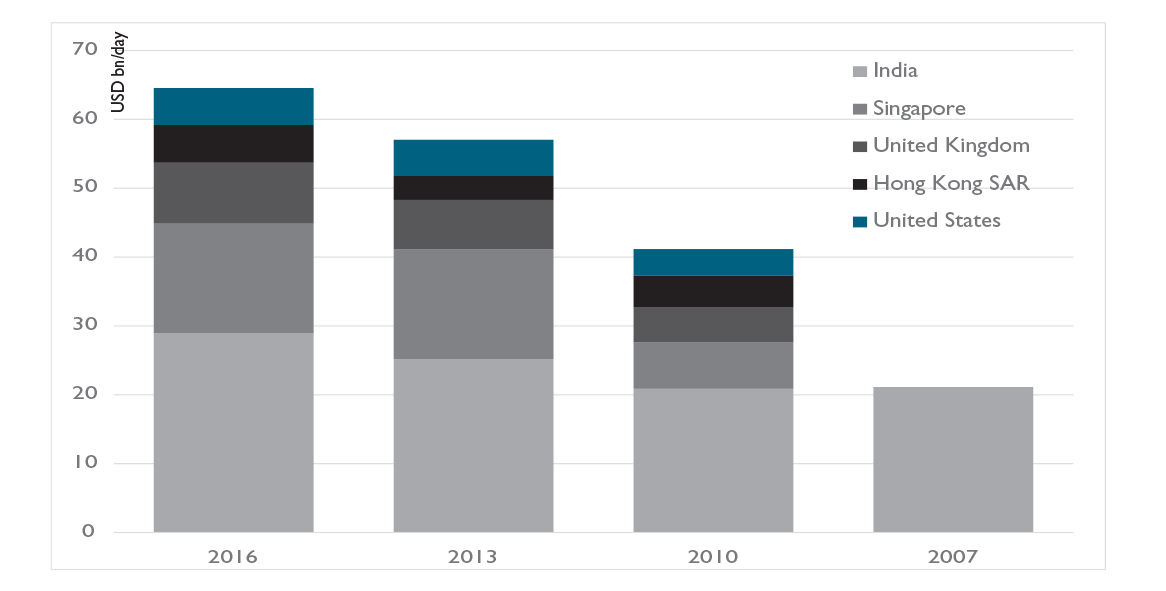
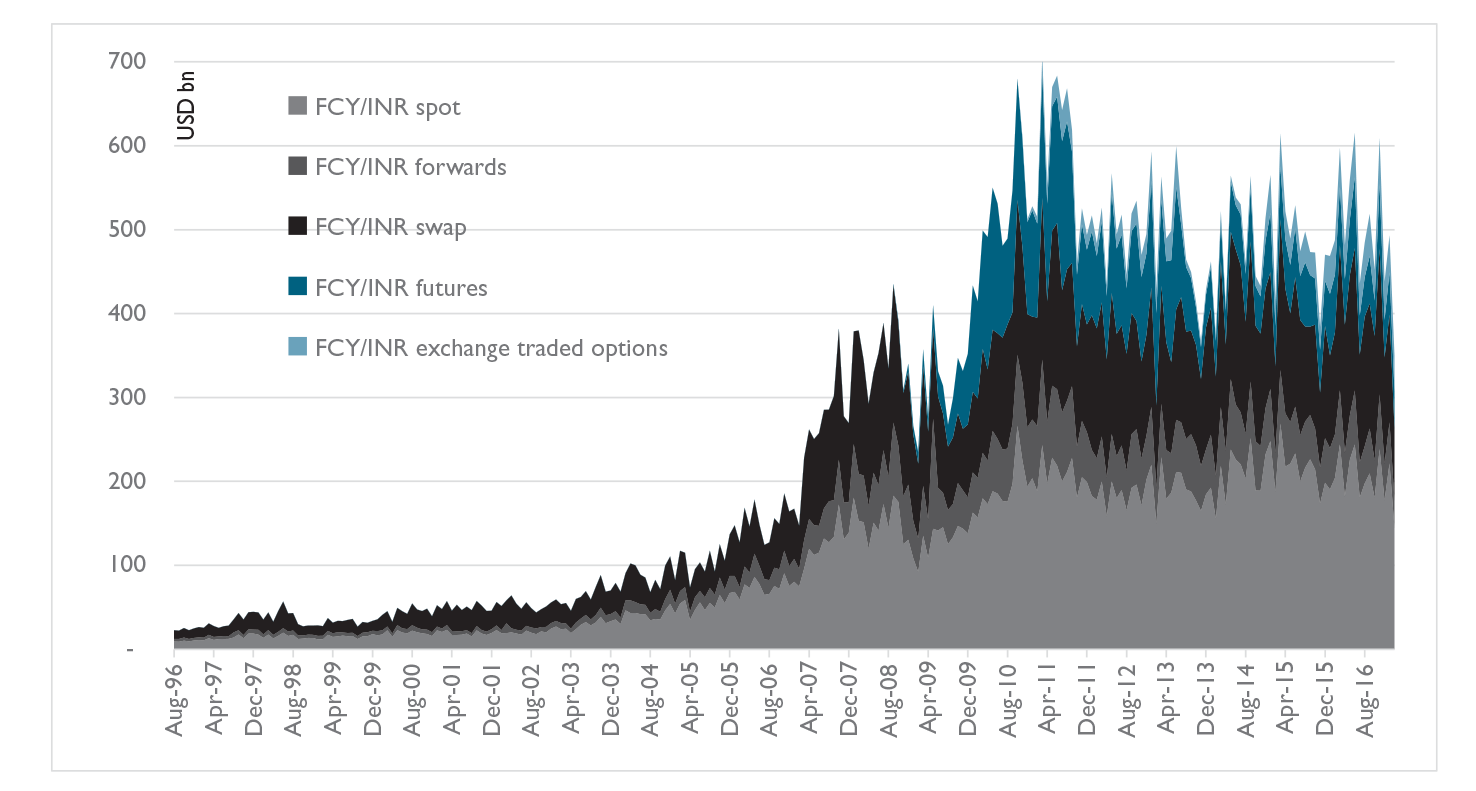
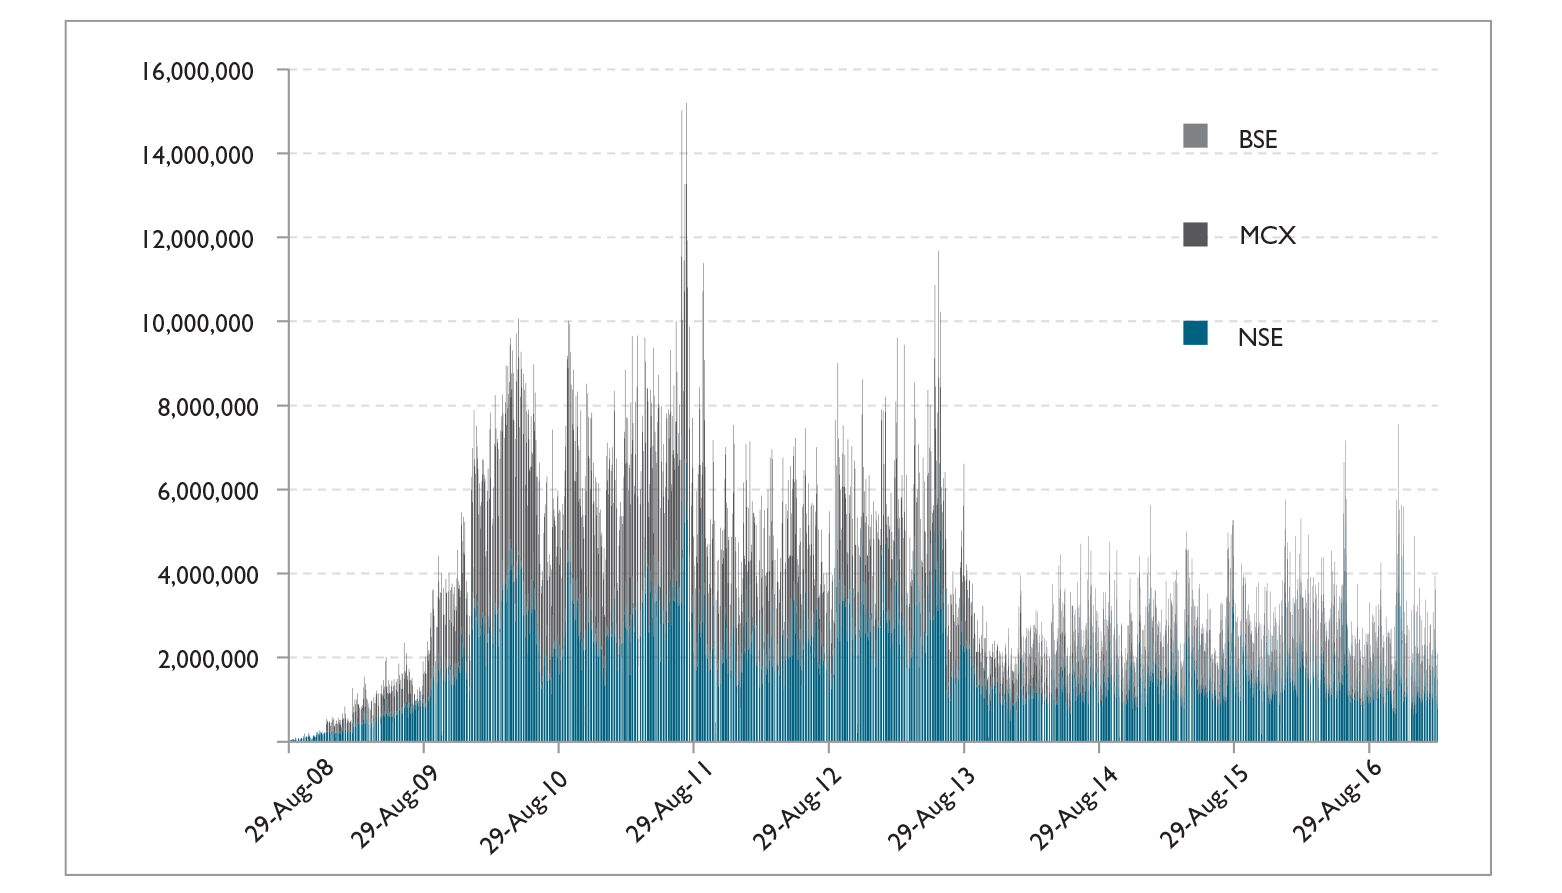
Negotiations with our trading partners with whom we have a net trade surplus to encourage settlement in INR might be a good starting point. One potential approach is to explore tripartite agreements with countries that have a trade surplus. Suppose India has trade surpluses with both countries A and B. In lieu of the foreign currency payments that A and B owe India, rupee equivalents could be parked with Indian bank branches in those countries. If countries A and B also trade amongst themselves, that trade could be encouraged to be settled in the rupees that are parked in those countries.
Another option is to use the official development assistance (ODA) which India provides to many countries. Over FY15 and FY16, this was close to a billion US dollars. 55
RBI Balance of Payments Statistics. Retrieved from dbie.rbi.org.in.
The immediate goal is to get an upgrade of India’s sovereign credit ratings, which have a large role to play in increasing investor confidence, and lies at the heart of attempts to induce greater transactions in the rupee. India’s current sovereign credit rating is Baa3, which is too close to sub-investment grade for comfort. China’s rating, in comparison, is now A1 (having just been downgraded from AA3). 58
Moodys Investors Service. Retrieved from https://www.moodys.com/credit-ratings/India-Government-of-credit-rating-401565# (19 January 2017, Credit Opinion) and https://www.moodys.com/credit-ratings/China-Government-of-credit-rating-599085 (5 June 2017, Issuer in-depth).
Internationalization of the rupee is not a near-term objective. This involves a sustained long-term view which transcends governments and political configurations.
Speech delivered at the Indian Banks' Association Banking Technology Conference, Hotel Trident, Nariman Point, Mumbai, on February 21, 2017.
Deputy Governor
Reserve Bank of India
e-mail:
Acharya, V (2013, September 29) Levelling the Playing Field for Banks. Mint. Retrieved from - http://www.livemint.com/Opinion/NjtFoeZul0EDhlWkOlm60M/Levelling-the-playingfield-for-banks.html
The asset quality review has taken a massive stride forward in bringing the scale of this problem out in the open and stirring a public debate about it. However, relatively little has been achieved in resolving the underlying assets to which banks had lent. Several resolution mechanisms and frameworks have been offered by the RBI to banks to get this going, but the progress has been painfully slow. Most of the assets remain laden with such high levels of bank debt that their interest coverage ratio is lower than one; they have little or no capacity to raise funding for working capital and capital expenditures, or to attract private investors to turn them around. Original promoters—who rarely put in any financing and primarily provide sweat equity—have had somewhat of a field day, facing limited dilution, if any, of their initial stakes nor much of a threat of being outright replaced.
There is a connection between these two outcomes, the lack of a comprehensive recognition of stressed assets by banks and the absence of any resolution. Both stem from the structure of incentives at our banks and the fact that stressed assets have been an outcome of excessive bank lending, en masse, in a relatively short period from 2009 to 2012, and to a concentrated set of large firms in a number of sectors such as infrastructure, power, telecom, metals (iron and steel, in particular), Engineering, Procurement, Construction (EPC), and textiles.
Let me first discuss the bank incentives. Only a bank that fears losing its deposit base or incurring the wrath of its shareholders is likely to recognize losses in a timely manner so as to restore its credibility. In many of our banks, such market discipline is simply not present at the moment. In others, even if some such discipline is at work, the horizon is excessively short—until the end of the CEO’s term. Banks lobby for regulatory forbearance; perhaps some loan prospects have turned sour due to bad luck, but beyond a point, concessions in recognizing losses just ends up being a strategy of kicking the can down the road and leaving them as legacy assets for the next management team to deal with.
The sectoral concentration of losses substantially amplifies this problem. Given the scale of assets that need restructuring, it is natural that the turnaround capital at asset-restructuring companies (ARCs) has been limited in comparison. Some capital is simply sitting on the fence until serious asset restructuring picks up speed. In the meantime, assets put up for sale can raise financing only at steep discounts, implying significant haircuts for bank debt. The loss of capital that would result on bank books and the fear of vigilance actions that such haircuts might trigger have made it almost impossible to get banks to embrace restructuring.
Effectively, there is no right price at which the market for stressed assets clears, if left alone to private forces. Even with an orderly resolution mechanism such as the insolvency and bankruptcy code in place, why would banks rush to file cases? In the unlikely scenario that assets are in fact being sold by banks to investors at steep discounts, ARCs may just asset-strip rather than do the economic turnaround. After all, these investors have waited far too long and now wish to generate quick returns to meet the expectations of their own investors.
All this is playing out to near perfection in our setting and the consequences are pernicious.
At one end, public sector banks are running balance sheets that seem to be in a perennial need of recapitalization from its principal owner, that is, the government, and shying away from lending to potentially healthier industrial credits. Bank credit growth has been steadily declining at the stressed banks. Some private sector banks face such headwinds too.
At the other end, sectors with the most stressed assets have excess capacity relative to current- or near-term utilization and no sight of immediate pickup in economic prospects. Promoters have continued to operate, staying afloat with rollovers from banks which only increase indebtedness, partly disengaged, partly disgorging cash from the few assets that are running.
The end result has been a silent atrophy of the true potential of these assets.
This situation should be a cause for concern. It is reminiscent of weak banks and stagnating growth witnessed by Japan in the 1990s, with repercussions to date, and by Italy since 2010. Japan has experienced, and Italy is in my opinion experiencing, a lost decade.
I believe that we are at crossroads and have an important choice to make.
We can choose status quo, but that would be insanity, ‘doing the same thing over and over again and expecting different results’, as Albert Einstein put it. It would risk a Japanese or an Italian style outcome.
Or we can choose to call a spade a spade as Scandinavia did to resolve its banking problems in the early 1990s and the USA did from October 2008 to June 2009, even if only after letting a significant bank fail. Ireland and Spain, where the recoveries since the GFC have not been as salubrious as in the USA, have nevertheless fared better than Italy; they too first adopted measures to pretend and extend troubled bank assets, but eventually recognized the scale of the problem and dealt with them in a decisive manner.
With our healthy current level of growth and future potential, with our hard-fought macroeconomic stability, with our youth climbing echelons of entrepreneurial success day after day, with our vast expanses of rural India that need infrastructure and modernization, and with our levels of poverty that have steadily declined but still need substantial reduction, we simply do not, as a society, have any excuse or moral liberty to let the banking sector wounds fester and result in amputation of healthier parts of the economy.
How do we embark on a better path? I have been thinking of ways to swiftly resolve bank stressed assets. I have tried to draw on the analysis and documentation of similar episodes in economic history that I just alluded to, which in some cases I have had the good fortune to contribute to and learn from.
Let me mention the key principles to successful restructuring that I have managed to glean:
First, there has to be an incentive provided to banks to get on with it and restructure the stressed assets at a price that clears the market for these assets. If they do not do it in a timely manner, then the alternative should be costlier in terms of the price they receive.
Second, the ultimate focus of restructuring and assessment, as to whether the restructuring package being offered to the bank is at the right price, must be the efficiency and viability of the restructured asset. Generating the best price for the bank at all costs may only result in cosmetic changes and risk serial non-performance of the assets.
Third, not all of the resulting bank losses should simply be footed by the government. As a majority shareholder of public sector banks, the government runs the risk of ending up paying for it all. It should manage the process at the outset to avoid that outcome. Wherever possible, private shareholders of banks should also be asked to chip in. Some surgical restructuring should be undertaken to consolidate and strengthen bank balance sheets so that private capital will come in at better valuations. It might have to accept that it is best to let some banks shrink over time. Divestments should also be on the table. Historically, significant restructuring of stressed assets has almost always involved significant bank restructuring.
Let me now elaborate ‘a’ plan that employs two different models for stressed assets resolution and recognizes the concomitant need for bank resolution. What I enunciate should be viewed as an attempt to address all dimensions of the problem. Its individual parts are, however, not meant to be cherry-picked by or for the constituency favoured by it. That would not work well.
Model I: Private Asset Management Company (PAMC).
This plan would be suitable for sectors where the stress is such that assets are likely to have economic value in the short run, with moderate levels of debt forgiveness. I conjecture based on anecdotal observations that sectors such as metals; engineering, procurement, construction (EPC); telecom; and textiles qualify for this.
In terms of timeline, the banking sector will be asked to resolve and restructure, say its 50 largest stressed exposures in these sectors, by 31st December. The rest can follow a similar plan in six months thereafter.
For each asset, turnaround specialists and private investors, other than affiliates of banks exposed to the asset, will be called upon to propose several resolution plans. Each resolution plan will lay out sustainable debt and debt-for-equity conversions for banks to facilitate the issuance of new equity and possibly some new debt to fund the investment needs. We may have to consider that the sustainable portion of bank debt does not have to be greater than some minimum amount, so as to allow for a large haircut if necessary for economic recovery of the asset. Each plan would lay out cash flow prospects, whether the promoter stays or not, and if yes, with what stake.
Each resolution plan would then get vetted and rated by at least two credit rating agencies to assess the financial health (interest coverage ratio, leverage, etc.), economic health (sector, margins, etc.), and management quality (promoter or the new team). The rating would be for the asset and not just for bank debt in case additional debt is issued under the plan.
Feasible plans would be those that improve the rating of the asset (presently likely to be C or D) such that ‘minimum’ of the two credit ratings is at or above a threshold level, for example, at least just below the investment-grade level. The intention is that the asset should not have a high likelihood of ending up in stress soon after restructuring. Therefore, bank debt forgiveness may have to be high enough and its converted equity stake low enough so that new investors can come in with a controlling stake and have incentives to turn the asset around.
Banks can then choose among the feasible plans. Coordination problems can be reduced by employing RBI’s Central Repository for Information on Large Credits (CRILC) and requiring that all plans with two-thirds approval by outstanding bank credit can proceed. The selected plan would simply be crammed down on any dissenting creditors.
Haircuts taken by banks under a feasible plan would be required by government ruling as being acceptable by the vigilance authorities. Sustainable debt would be upgraded to standard status for all involved banks. The promoters, however, would have ‘No’ choice as to what restructuring plan is accepted, and may potentially get replaced and/or diluted, as per the preference of and depending on the price at which the new managing investors come in.
At expiration of the timeline, each exposure that is not resolved will be subject to a steep sector-based haircut for the bank consortium, possibly close to 100 per cent. The promoter will automatically have to leave. These assets would be put into our new insolvency and bankruptcy code regime. Alternately, they could be put up for sale to ARCs and private equity investors who can turn around the assets, levering them up with fresh finance, if necessary. If designed right, only the worst assets should end up in this scenario. However, the possibility of ending up here would serve as a credible off-equilibrium threat so that banks, even the most exposed ones, cannot hold up the restructuring.
There are ways to arrange and concentrate the management of these assets into a single or few PAMCs, at the outset or right after restructuring plans are approved. These companies would resemble a large private-equity fund run by a team of professional asset managers. Besides bringing in their own capital, they could raise financing from investors against equity stakes in individual assets or in the fund as a whole, that is, in the portfolio of assets. The portfolio approach might help investors diversify risks on individual assets, improve valuations, and attract greater capital. Bank creditors can set up an oversight committee to ensure cash flows are flowing in and out of the asset restructuring company as per the security rights agreed in the restructuring plans.
Let me emphasize that under this model, the asset management company would be entirely private, like the Phoenix structure set up in Spain after 2012 to deal with bank NPAs in machinery, steel, and winery.
Model II: The National Asset Management Company (NAMC).
This plan would be necessary for sectors where the problem is not just of excess capacity but possibly also of economically unviable assets in the short to medium term. Take, for example, the power sector, where projects have been created to deliver aggregate capacity that is beyond the estimated peak utilization anytime soon. Many of these are stalled as they have no fuel inputs and little or no income realization due to lack of credible purchase agreements. Their scrap value is likely to be small and the only efficient use is as an ongoing concern. If input and output requirements are sorted out, and as power consumption needs rise, these projects could eventually provide value. For a country with per capita consumption of electricity that is only one-third of the world average, it is reasonable to expect that a well-run power asset will not end up being a white elephant.
Unlike the first model (PAMC) where asset recovery is likely to be relatively quick, these assets may require a long time to start generating cash flows. In addition, the government should have incentives to clear approvals and purchase agreements to make them viable. For both these reasons, such assets would be best quarantined into a NAMC. The NAMC would perform several functions to get the ball rolling: raise debt, say government guaranteed in part, for its financing needs; possibly raise some more to pay off banks at a haircut, likely steep but softened by payment in the form of security receipts against the asset’s cash flows; keep a minority equity stake for the government; and bring in asset managers such as ARCs and private equity to manage and turn around the assets, individually or as a portfolio. Infrastructure assets that are also long-lived and create externalities (development of townships, improvements in overall productivity, etc.) could be resolved in similar way.
These two models of asset restructuring, one private and the other quasi-government, share many common features with approaches that have been adopted for resolution of stressed assets in history: Sweden (Securum and Retriva) in the early 1990s; in the USA in dealing with the Savings and Loans Crisis (Resolution Trust Corporation); in Japan (post-1998 via its Deposit Insurance Corporation); in Indonesia (IBRA), Malaysia (Danaharta), and South Korea (KAMCO) to deal with the Southeast Asian crisis; and more recently, in Ireland (NAMA), Spain (Sareb), and again the USA (TARP along with Fannie Mae, Freddie Mac and Federal Housing Administration). In fact, the European Banking Authority has proposed a similar structure to deal with the NPAs of European banks.
Before discussing what this would imply for bank balance sheets, let me pose and answer the question: Are these supposed to be ‘bad banks’? The answer is ‘No’. While I have previously used the phrase ‘bad bank’ for such ideas, over time I have come to dislike the title. A ‘bad bank’ conveys the impression that this entity is to operate as a bank but has bad assets to start with. In fact, the idea is not to operate these entities as banks at all. Resolution agencies set up as banks that originate or guarantee lending have ended up being future reckless lenders, notably in the case of Germany which has often aggregated stressed assets of its Landesbanken into bad banks. I would argue that this has also been the story of Fannie Mae and Freddie Mac with respect to housing booms and busts in the USA. It would be better to limit the objective of these asset management companies to orderly resolution of stressed assets with graceful exit thereafter; in other words, no mission creep over time to do anything else such as raise deposits, start a new lending portfolio, or help deliver social programmes. It is essential to keep the business model of these entities simple to make them attractive for private investors with expertise for the main task on hand, asset restructuring.
A moment of reflection clarifies that under both models I proposed, bank balance sheets would be freed up from the overhang of stressed assets and allowed to focus on their healthier activities. The catch is that given the haircuts involved, there will be also be a need to be decisive bank resolution.
Bank Resolution
We keep hearing clarion calls for more and more government funding for recapitalization of our public sector banks. Clearly, more recapitalization with government funds is essential. But few have suggested that the government should adopt measures to economize its total cost. It should ask in return from banks it recapitalizes, significant corrective actions, and wherever possible, injections of private capital for loss sharing with the taxpayers. The expectation of government dole outs might have been set by the past practice of throwing more money after the bad. Take for instance our bank recapitalization plan of 2008–2009 after the GFC: banks that experienced the worst outcomes received the most capital in a relative sense to get back to the regulatory capital norms. We must not allocate capital so poorly, recreate ‘Heads I win, tails the taxpayer loses’ incentives, and sow the seeds of another lending excess.
There are better ways to do it building upon some performance targets already set under the ongoing recapitalization plan. Let me propose five options:
There are many details to work out. But I hope this provides a start. It is going to require being balanced and creative, holistic and uncompromising, in achieving the end goal. Piece-by-piece approach with all discretion given to banks simply has not worked. Sustainable progress in an economy cannot occur when a set of players is allowed to hold up the efficient allocation of capital. Their owning a smaller share of assets can help unlock economic value; their hogging of these assets will only lead to further value erosion.
Time is of the essence, if we are to restore corporate investment and job creation in near future.