
Abstract
Executive Summary
This paper estimates the impact of public investment on private investment in India during 1970-2013 using ARDL procedure developed by Pesaran and Shin (1999) and Pesaran, Shin, and Smith (2001) by incorporating endogenously determined structural break in the model. The base line result implies that a 1 per cent increase in public investment as a ratio to GDP leads to 0.81 per cent and 0.53 per cent decrease in private investment as a ratio to GDP in the long run (about 4 to 5 years) and short run (about 2 to 3 years), respectively, after controlling for economic conditions. To address the concern that the results may be driven by government consumption expenditure, fiscal deficit, or inadequate infrastructure, the analysis was repeated by estimating the investment function after including these variables and similar results were obtained. The investment regression was also estimated for a shorter sample period (1978–2013) to get the same result.
It is observed that the crowding out effect of public investment on private investment has dampened during the post-liberalization period. The results also reveal that a “market friendly” incumbent and an increase in foreign direct investment dampen the magnitude of the crowding out effect of public investment. Formal tests were conducted to examine whether the crowding out effect was driven by political uncertainty and political business cycle channels but no evidence for the same is found.
The results also reveal that public infrastructure (represented by kms of roads per capita) has a positive effect on private investment in the short run. This is similar to the findings by Blejer and Khan (1984) that while public infrastructure investment is complementary to private investment, other kinds of public investment lead to crowding out of private investment. This suggests that public investment should be more focused on goods and services which are enjoyed or consumed by many consumers simultaneously and non-excludable in nature with significant positive externalities.
In this model, a single endogenously determined structural break was included and the possibility of multiple breaks was excluded. There is a scope to increase multiple structural breaks and re-investigate the impact of public investment on private investment in India in future studies.
Studies report mixed results about the impact of public investment on private investment. For example, Blejer and Khan (1984) found that the public infrastructure investment was complementary to private investment in 24 developing countries during the period 1971–1979. Aschauer (1989) reported that in the United States, an increase in public capital crowded in the private capital via an increase in the marginal productivity of capital. Erden and Holcombe (2005) also found a positive correlation between public and private investment for 19 developing countries during 1980–1997. On the other hand, Cavallo and Daude (2011) developed a theoretical framework to evaluate the conditions under which public investment promoted or hindered private investment and found that public investment crowded out private investment in a sample of 116 developing countries during 1980–2006. Similarly, Everhart and Sumlinski (2001) found a negative correlation between public and private investment (consistent with crowding out hypothesis) in 63 developing countries between 1970 and 2000.
Most of the studies on the impact of public investment on private investment use multi-country cross-sectional data and, therefore, the results of these studies are based on the assumption of “homogeneity” in the observed relationship across countries. This could be an unrealistic assumption as there are a lot of variations among countries due to different structural and institutional factors, which, in turn, might be determining the impact of public investment on the behaviour of private investment in a particular country. Also, not many studies consider the mediating role of economic liberalization, market-friendly political platform, and net foreign direct investment in the impact of public investment on private investment. Few studies incorporate structural break in the model when examining the impact of public investment on private investment. With this background, this study attempts to investigate the impact of public investment on private investment in India during 1970–2013 using the Autoregressive Distributed Lag (ARDL) procedure (Pesaran & Shin, 1999; Pesaran, Shin, & Smith, 2001) by incorporating endogenously determined structural break in the model. The ARDL procedure corrects for possible endogeneity of the explanatory variables and reveals the desirable small sample properties of estimators.
We find strong and robust evidence that public investment crowds out private investment in India. Our baseline estimates suggest that a 1 per cent increase in public investment as a ratio of GDP leads to 0.81 per cent and 0.53 per cent decrease in private investment as a ratio of GDP in the long -run (about 4 to 5 years) and short-run (about 2 to 3 years)1, respectively, after controlling for economic conditions. To address the concern that the results might be driven by government consumption expenditure, fiscal deficit, or inadequate infrastructure, we repeat the analysis by estimating our investment function after including these variables and find similar results. We also estimate the investment regression for a shorter sample period (1978–2013) and find the same result. We find that the estimated effect of public investment is smaller in magnitude during the post-liberalization period, indicating that economic liberalization offsets the crowding out effect of public investment on private investment. We also find that a “market friendly” incumbency and an increase in foreign direct investment dampen the magnitude of the crowding out effect of public investment on private investment.
Private investment is also affected negatively by two other channels. The first channel is political uncertainty hypothesis. Political uncertainty is expected to affect private investment negatively because this leads to policy uncertainty. As a result, rational firms prefer delaying the investment, until the political uncertainty is resolved (Julio & Yook, 2012). The second is the political business cycle hypothesis. As per political business cycle theory, incumbent politicians manipulate fiscal and monetary policy instruments to influence macroeconomic performance prior to an election to enhance their chances of re-election (Nordhaus, 1975). Therefore, it is expected that an expansionary fiscal policy would crowd out private investment. We conduct formal tests to know whether the crowding out effect is driven by these channels and find no evidence that they are driving our results.
PRIVATE AND PUBLIC INVESTMENT IN INDIA
Summary Statistics (1970-2013)
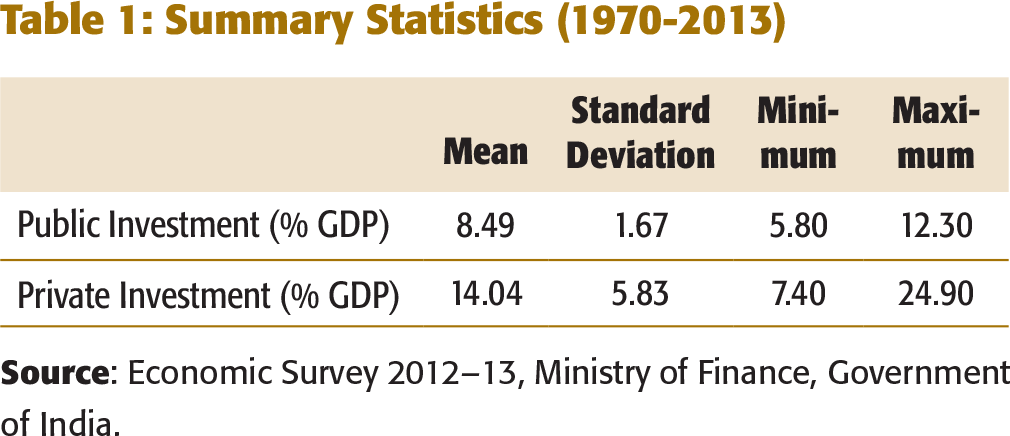
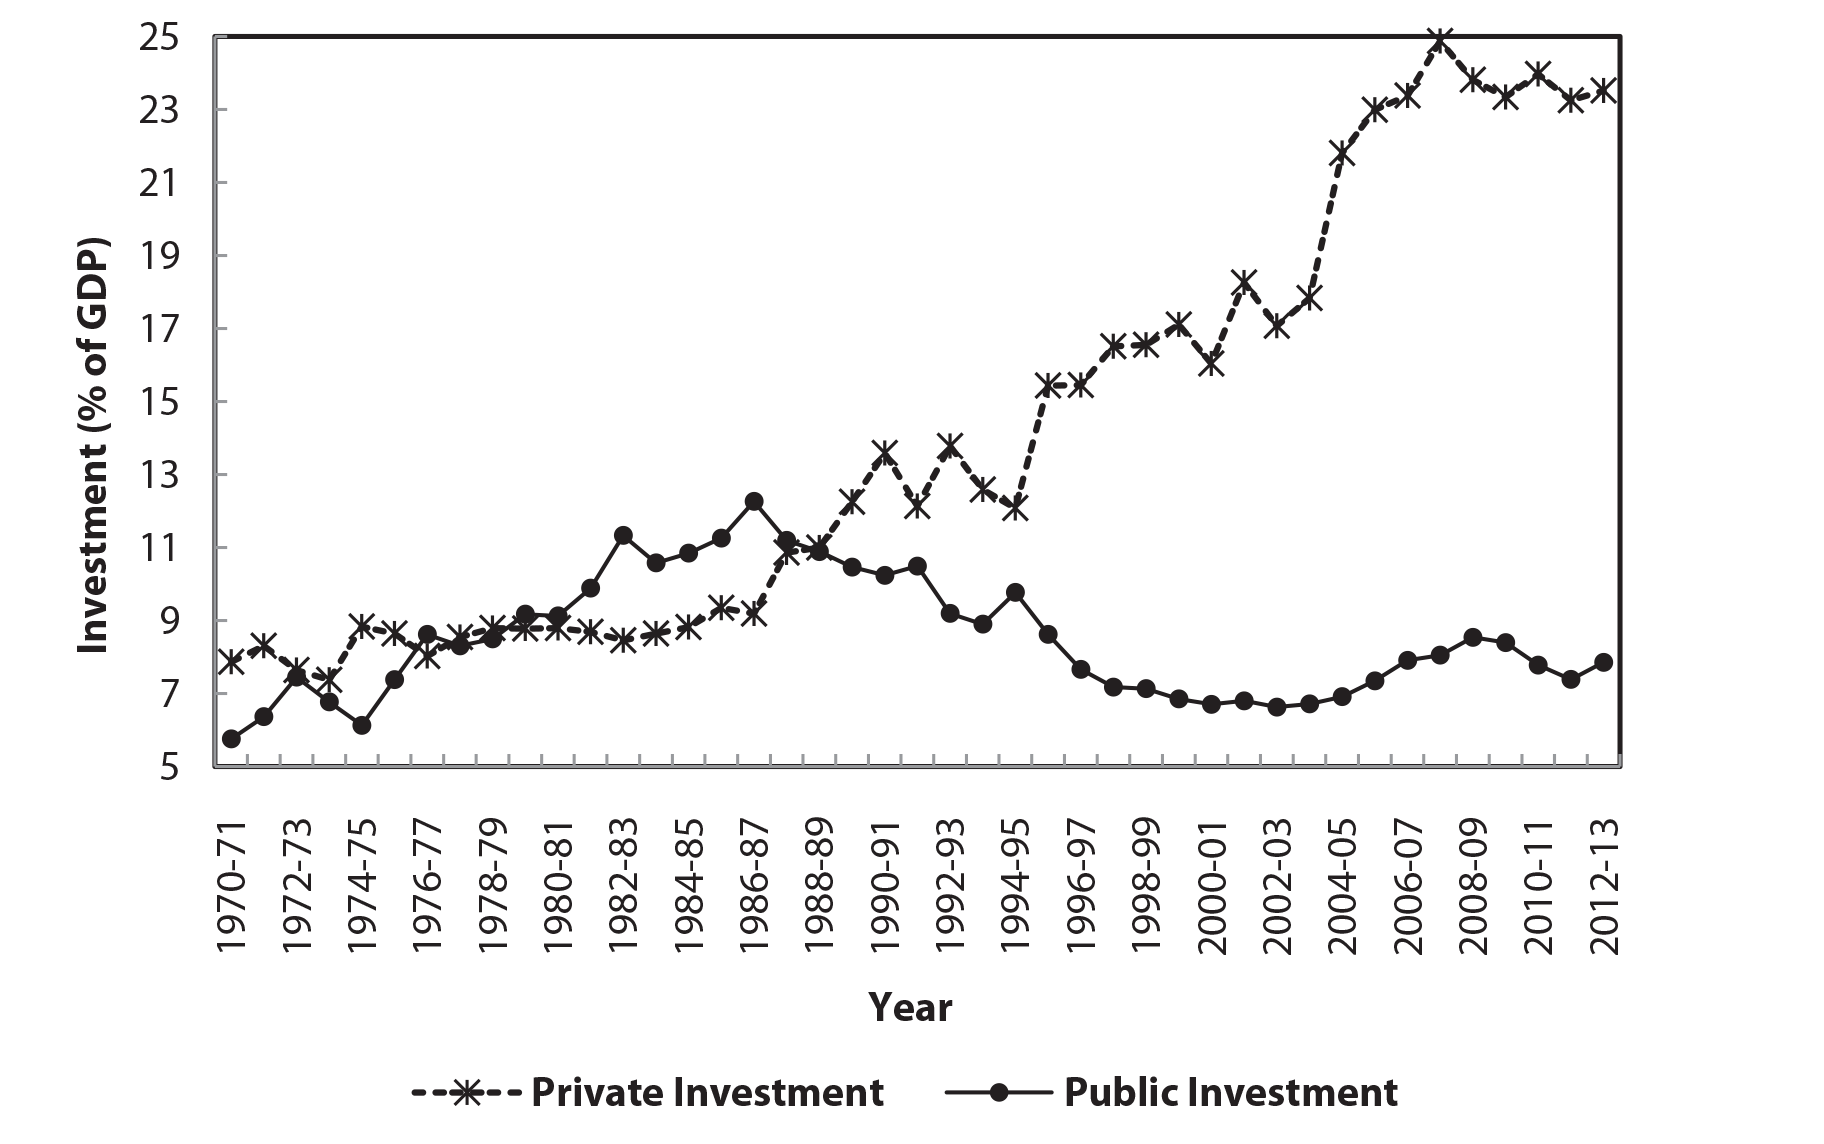
Figure 1 shows the trends in the public and private investment in India during 1970–2013. A pronounced trend is visible in public investment over time. It increased from 5.8 per cent of GDP in 1970–71 to 12.3 per cent of GDP in 1986–87 before starting to decline to 7.9 per cent of GDP in 2012–13. On the other hand, private investment as a percentage of GDP has increased continually during 1970–2013 from 7.9 per cent of GDP in 1970–1971 to 24.9 per cent of GDP in 2006–2007 after which it declined marginally to 23.6 per cent in 2012–13. The crowding out hypothesis predicts that the public investment has a significant impact on private investment. Specifically, there is a negative relationship between public and private investments. If we compare trends in private investment with trends in public investment over time, the downward trend in public investment coincides with the upward trend in private investment since 1986–87. The correlation coefficient between public and private investment as a percentage of GDP in 1970–2013 is also found to be equal to – 0.34. These suggest that the former might have caused the latter.
ANALYTICAL FRAMEWORK
Basing on the above discussion, we formulate a behavioural relationship for private investment. A change in public investment is expected to affect private investment either positively or negatively. An increase in public investment is expected to increase private investment through creating basic infrastructural facilities such as highways, railways, ports, and so on. A few studies (e.g., Aschauer, 1989; Blejer & Khan, 1989; Erden & Holcombe, 2005) have found that an increase in public investment led to an increase in private investment. On the contrary, crowding out hypothesis suggests that an increase in public investment may lead to a decrease in private investment either by increasing interest rate or by utilizing financial and physical resources, which would otherwise be available for the private sector. A number of studies (e.g., Cavallo & Daude, 2011; Everhart & Sumlinski, 2001; Morrissey & Udomkerdmongkol, 2012) provide empirical support to this assertion from crowding out hypothesis.
Private investment also depends on the lending rate. According to Keynesians, given the expected rate of return, a decrease in the lending rate increases investment, which, in turn, increases, economic growth via multiplier mechanism. Peltonen, Sousa, and Vansteenkiste (2012) found the real lending rate as an important determinant of investment in emerging market economies.
Investment also depends on the availability or supply of credit. In contrast to the neo- classical theory, which assumes that firms have access to unlimited supply credit, most developing countries are often characterized by credit constraint. This is due to asymmetric information, directed credit programmes, and controlled interest rates. These imperfections in credit markets prevent firms from borrowing as much as they wish and discourage investment. The removal of such credit constraints increases the availability of funds for investment and is therefore expected to increase investment according to the debt intermediation view (Shaw, 1973). A number of studies report bank credit as a significant determinant of investment (Peltonen et al., 2012; Cavallo & Daude 2011; Athukorala, 1998).
Another important determinant of investment is the relative price of an investment. An increase in the price of capital goods relative to the price of all other goods and services is expected to have a negative impact on investment as it affects their profit. It is found that an increase in the relative price of investment leads to a decrease in private investment (Peltonen et al., 2012; Cavallo & Daude, 2011).
The deposit rate too has an impact on investment. According to McKinnon (1973), in a financially repressed economy, it is difficult for economic agents to find required resources from the external source to make investment on account of non-price credit rationing. Secondly, physical capital is often indivisible. Hence, it becomes necessary for potential investors (savers) to accumulate saving for some time in the form of monetary assets (mostly currency and deposits) before they use it for lum sump investments. As long as the rate of return on deposit is less than the rate of return on physical capital, an increase in deposit rate encourages accumulation of deposits (internal funds) by making deposit accumulation more rewarding, which, in turn, increases the investment subsequently according to McKinnon’s “complementarity hypothesis.” Therefore, an increase in deposit rate leads to an increase in investment. Previous studies (e.g., Athukorala, 1998; Moore, 2010) report that increase in deposit rate leads to an increase in private investment.
Another factor that affects private investment is the accelerator mechanism. As per the accelerator theory of business cycle, an increase in output and sales puts pressure on existing productive capacity. Hence, firms decide to expand their productive capacity and hence investment. A few previous studies (e.g., Athukorala 1998; Julio & Yook 2012; Morrissey & Udomkerdmongkol 2012; Peltonenet al., 2012; ) have reported that the growth rate of GDP has a positive effect on private investment.
On the basis of the above discussions, we specify the empirical private investment function as follows:
Private Investment = ƒ (Public Investment, Lending Rate, Bank Credit, Relative Price of Investment, Deposit Rate, and the Growth Rate)
The independent variables with their expected signs in brackets are given below:
Public Investment (?)
Lending Rate (−)
Bank Credit (+)
Relative Price of Investment (−)
Deposit Rate (+)
Growth Rate (+)
Data and Econometric Procedure
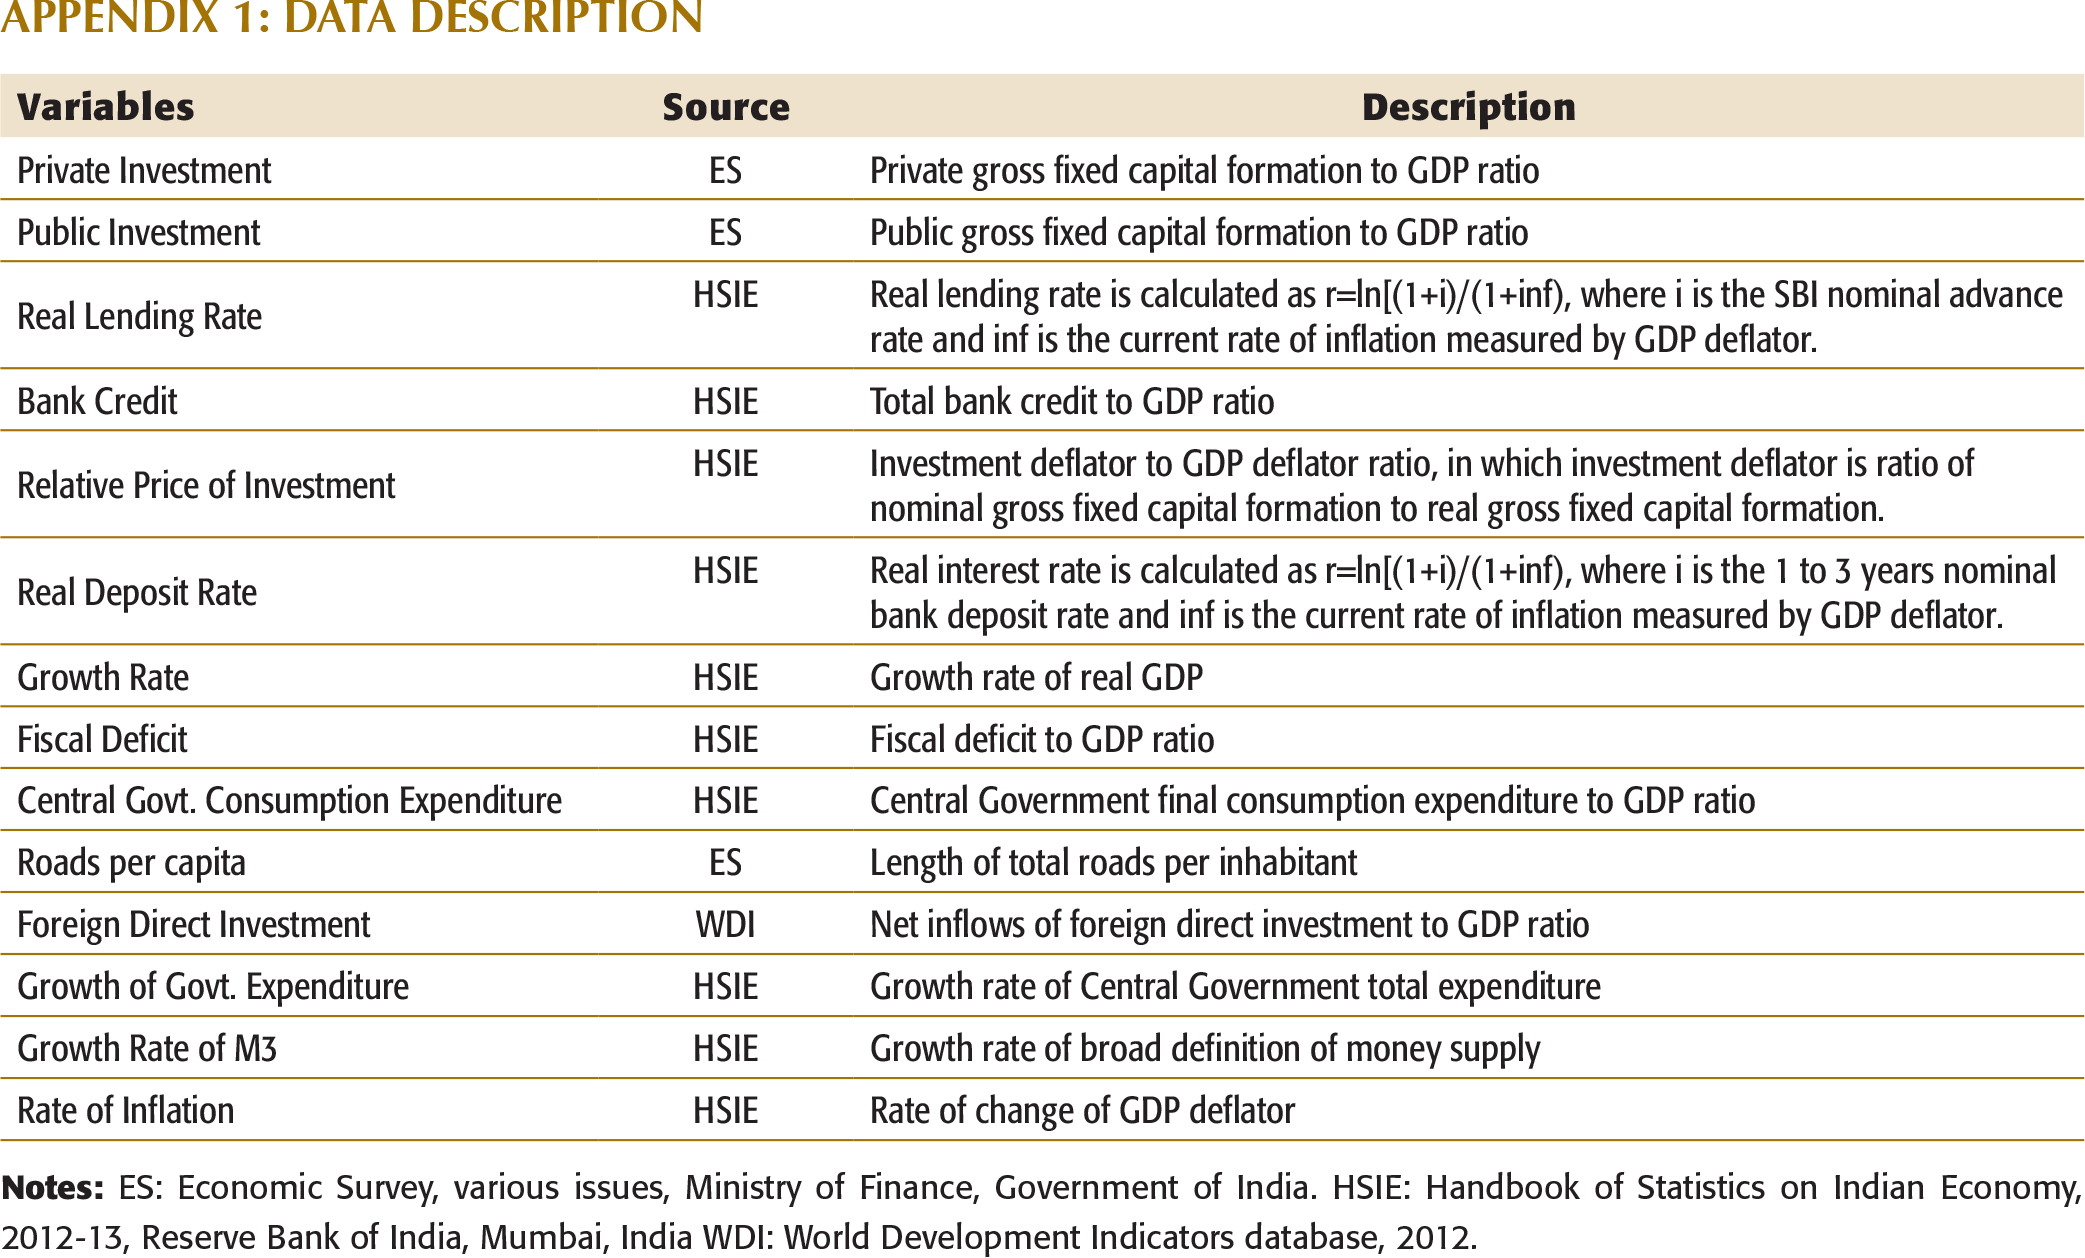
We use annual data for the variables from 1970–1971 to 2012–2013. The dataset, including the definition and sources of all variables, is summarized in Appendix 1.
The assumptions of the classical linear regression model require that both the dependent and independent variables are stationary. In the presence of non-stationary variables, there might be what Granger and Newbold (1974) called a spurious regression. A spurious regression has a high R2, significant t-statistics, but the results are without any economic meaning. Therefore, the first econometric step we have taken is to test if the series are non-stationary by using Augmented Dickey-Fuller (ADF) tests. The Akaike Information Criterion (AIC) determines the appropriate number of first differences of the dependent variable for the ADF test. The null hypothesis of the test is that the un-differenced form of the series is non-stationary or contains a unit root.
ADF Test for Unit Root
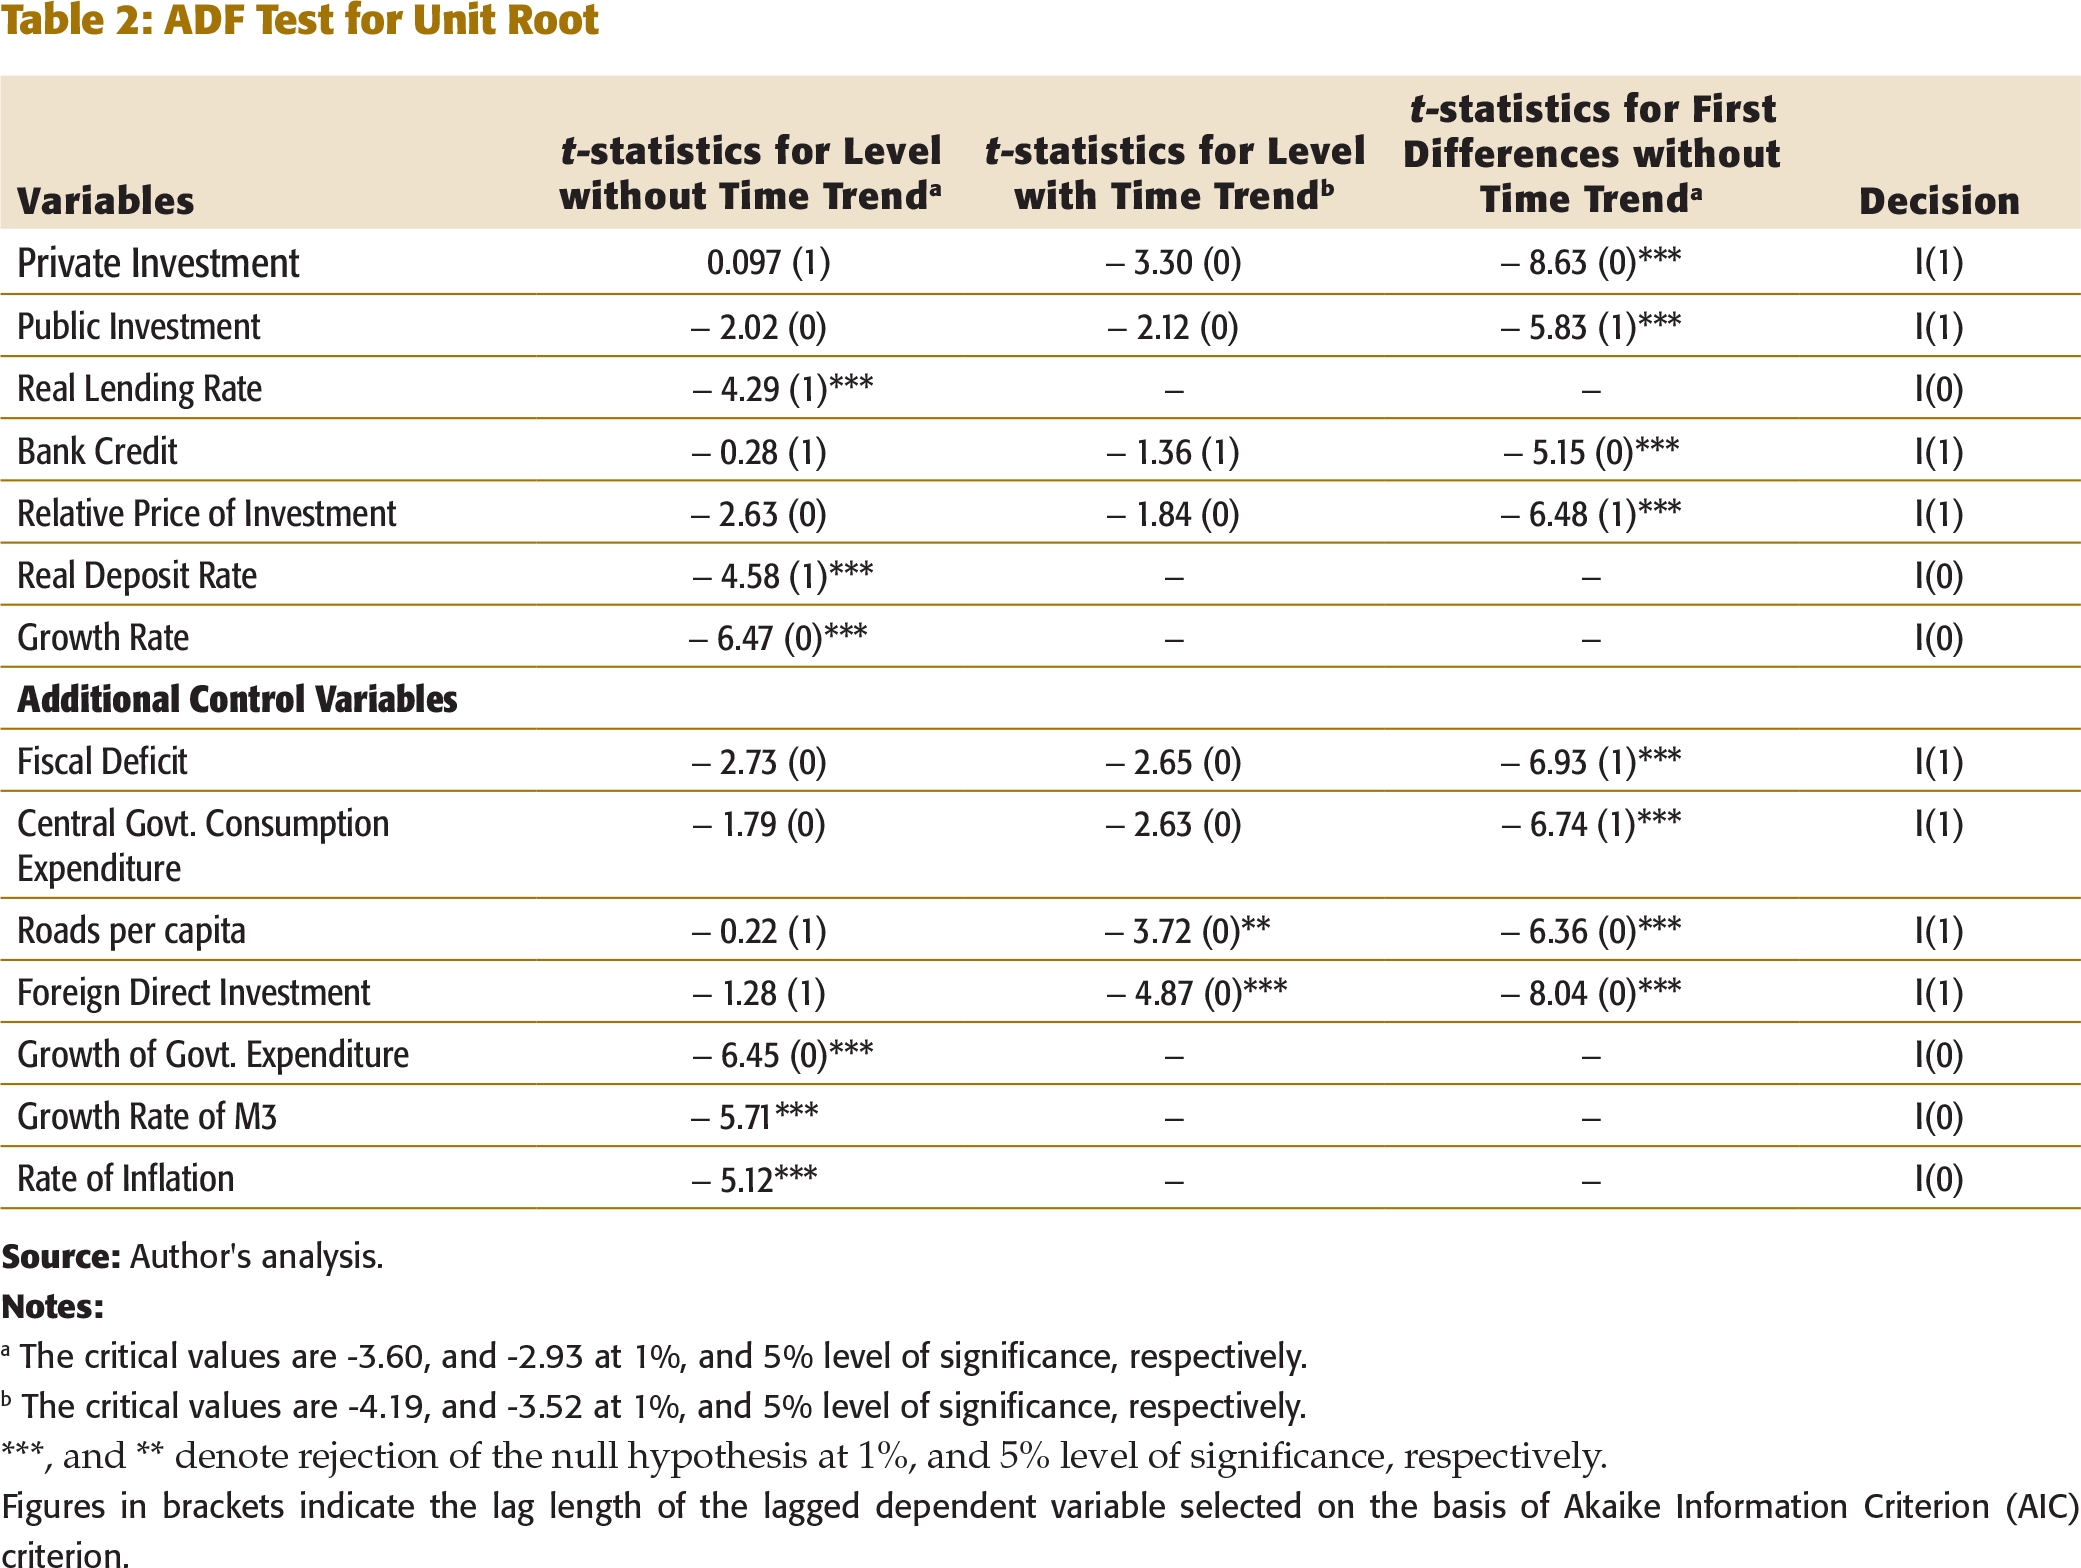
a The critical values are -3.60, and -2.93 at 1%, and 5% level of significance, respectively.
b The critical values are -4.19, and -3.52 at 1%, and 5% level of significance, respectively.
***, and ** denote rejection of the null hypothesis at 1%, and 5% level of significance, respectively.
Figures in brackets indicate the lag length of the lagged dependent variable selected on the basis of Akaike Information Criterion (AIC) criterion.
However, a well-known weakness of the ADF test is that it may fail to reject the unit root hypothesis if the series has a structural break. Perron (1989) showed that the absence of an existing structural break leads to a bias that reduces the ability of the ADF test to reject a false unit root null hypothesis. Figure 1 exhibits a strong possibility of structural breaks in both public and private investment, particularly during the post-reform period. Therefore, it is necessary to conduct the unit root test that allows for the structural break. Zivot and Andrews (1992) unit root test allows one structural break in the series which is determined endogenously. The null hypothesis is that the series has a unit root with one structural break against the alternative hypothesis that the series is stationary with break. There are two advantages of applying the unit root test that allows for the presence of structural break. First, it prevents obtaining a test result that may be biased towards non-rejection of the null hypothesis. Secondly, as it identifies the date of the structural break, it becomes easier to analyse whether a structural break of a series is associated with a particular event such as a change in government policy, a currency crisis and so on.
Zivot–Andrews Unit Root Tests with One Structural Break
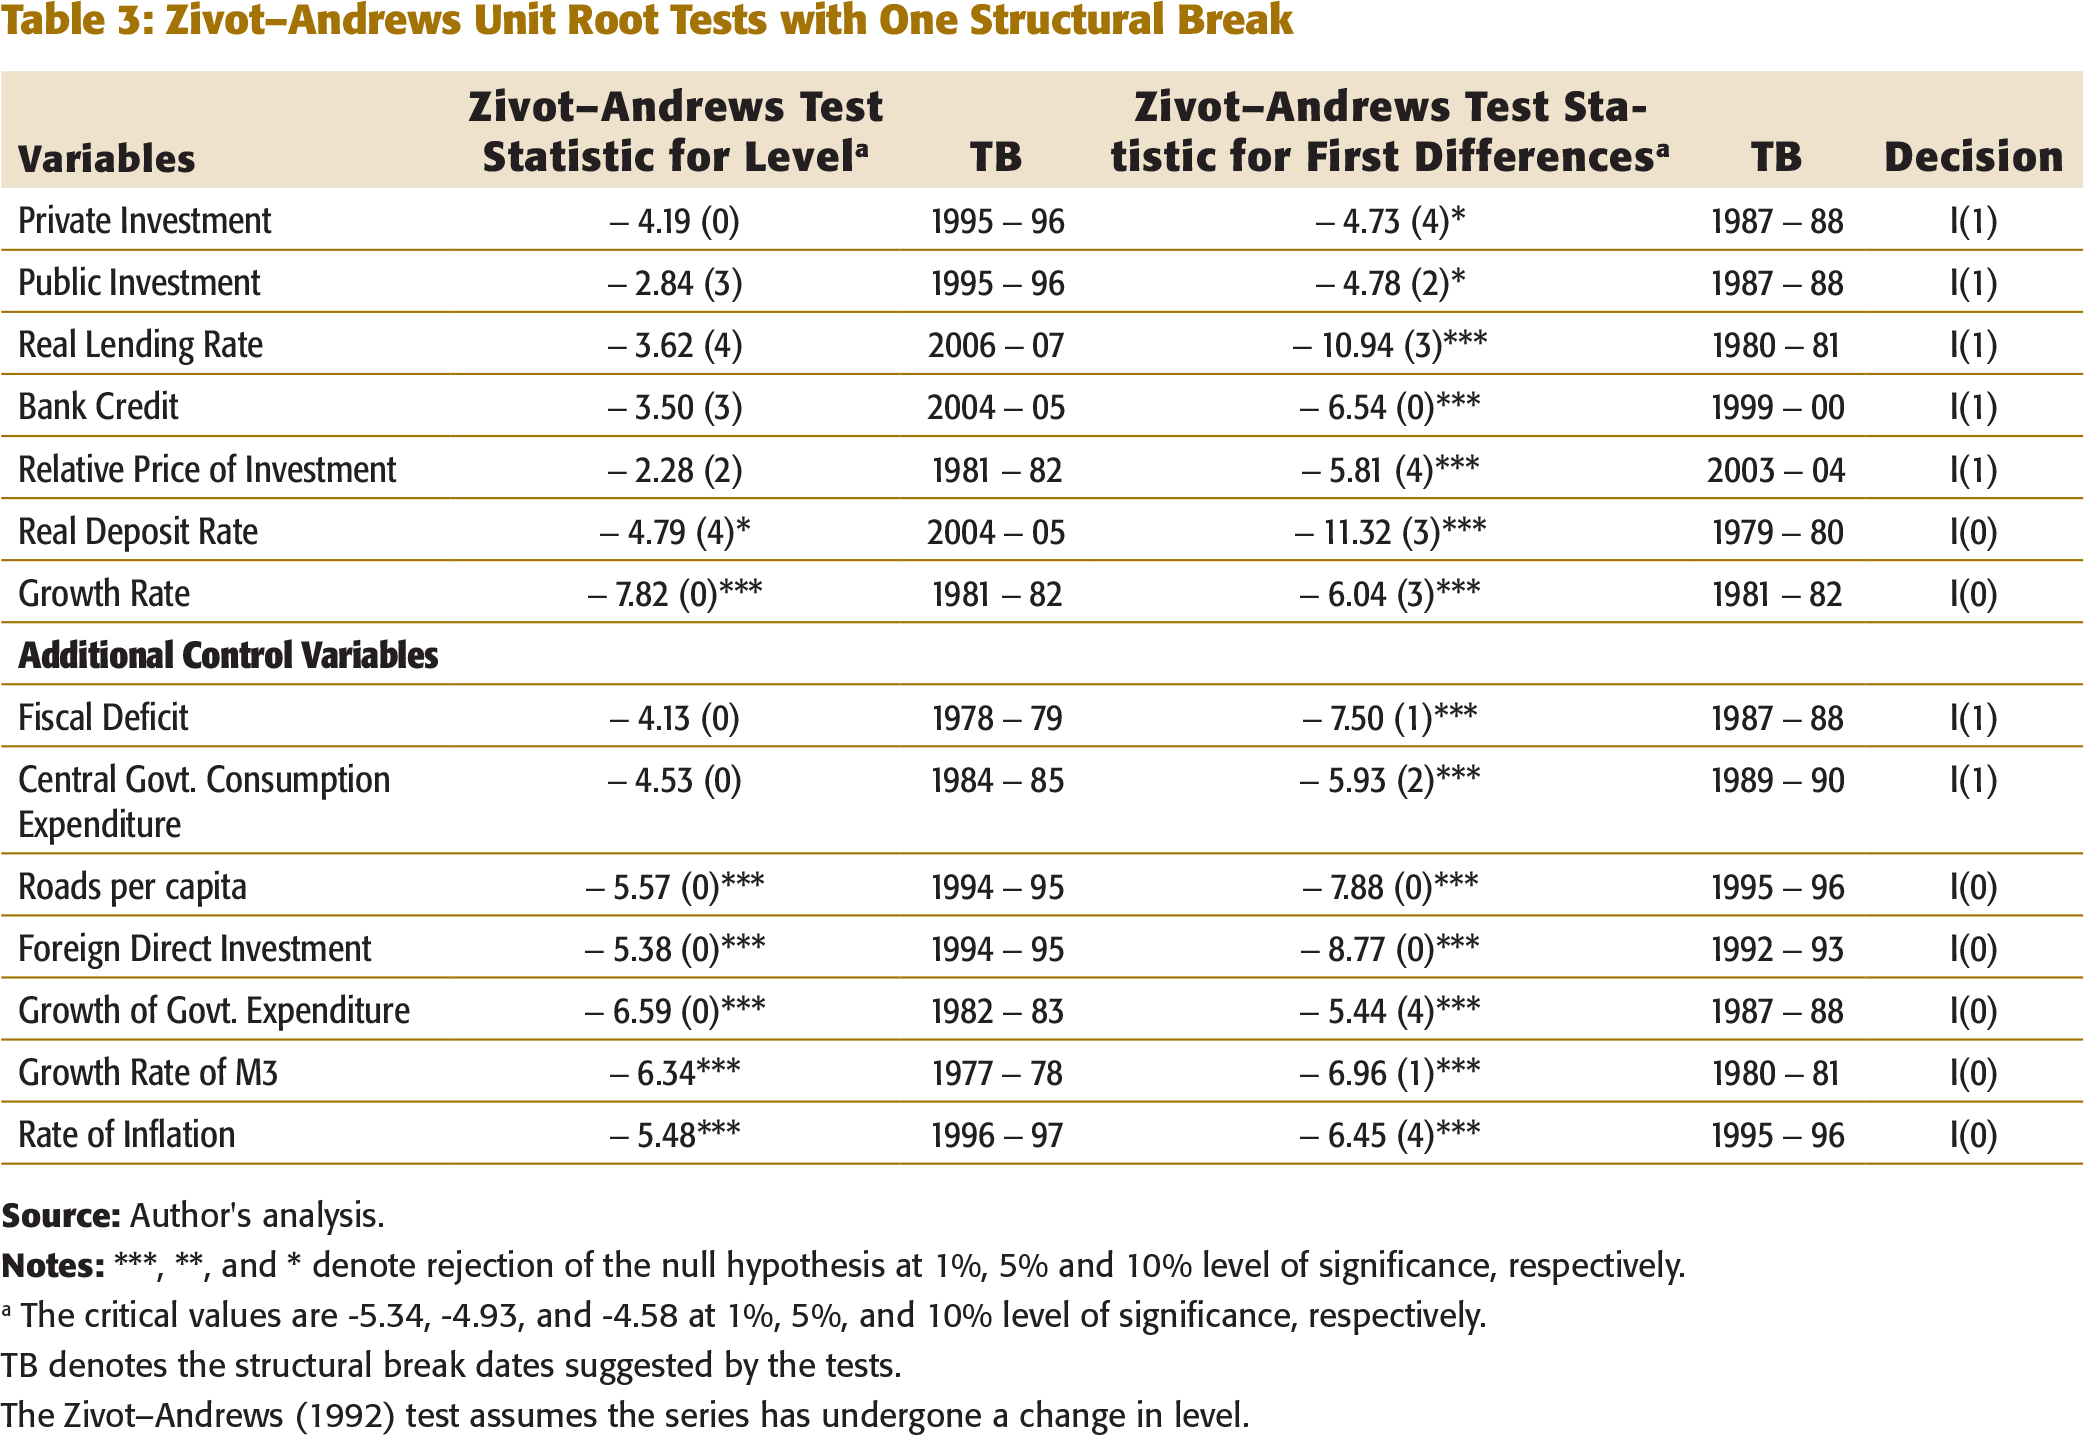
a The critical values are -5.34, -4.93, and -4.58 at 1%, 5%, and 10% level of significance, respectively.
TB denotes the structural break dates suggested by the tests.
The Zivot–Andrews (1992) test assumes the series has undergone a change in level.
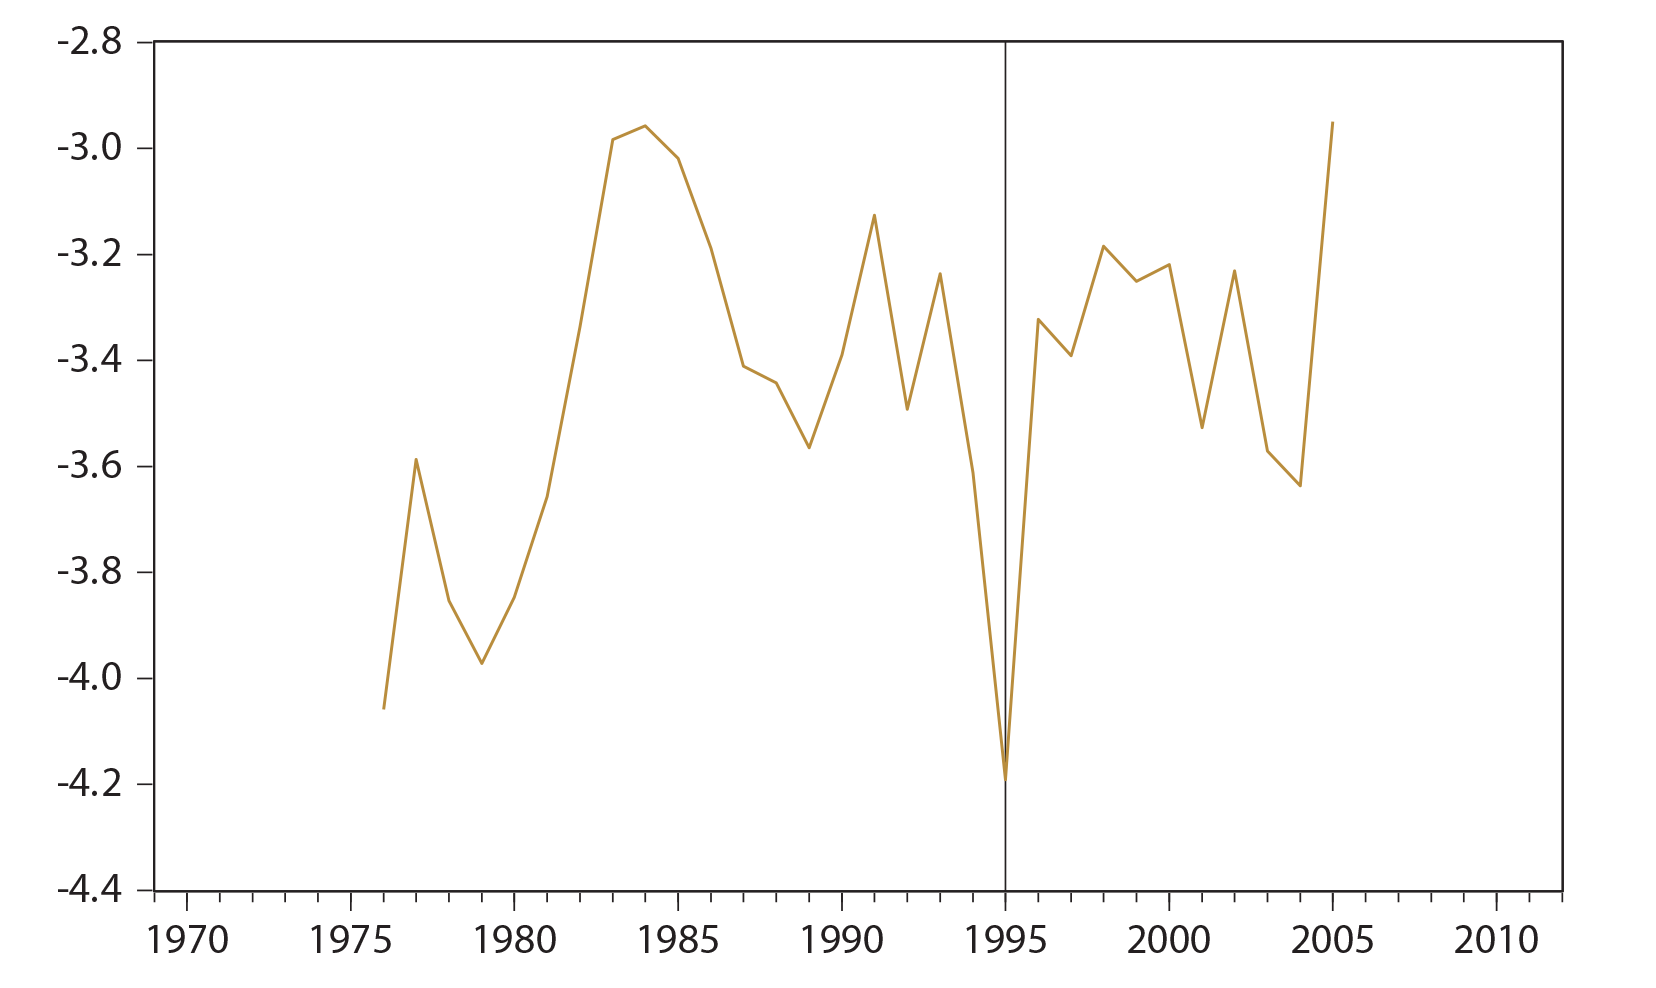
As expected, a structural break in private investment is identified in 1995–96 (see Figure 2 and Table 3), which is due to various structural reforms that were carried out during the first half of the 1990s. The reforms included decontrolling of private investment, opening up the economy to foreign trade and foreign investment, financial sector reforms, etc. According to Parker (1995), “the behaviour of investment in the post reform period can be divided into three distinct phases: the crisis of 1991/92, when private capital formation contracted sharply; the period 1992/93-1993/94, in which investment remained sluggish despite an easing of financial conditions and an improved economic outlook; and the period 1994/95-1995/96 for which there is evidence of a robust and broad based investment recovery” (p. 28). Therefore, we conclude that private investment has undergone a structural break in 1995–96.
As most of the variables are found to be non-stationary, the next step is to test the possibility of one or more cointegrating relationships among variables. There are several approaches to carry out the cointegration test. The most commonly used methods are two-step residual-based procedure (Engle & Granger, 1987) and the system-based reduced rank regression approach (Johansen, 1991). These testing procedures require that all variables to be integrated are of order 1. Since this is not valid for our variables, we use an autoregressive distributed lag (ARDL) procedure developed by Pesaran and Shin (1999) and Pesaran et al. (2001). The main advantage of the ARDL procedure is that it tests the existence of cointegrating relationship when variables are of a different order of integration through the bound testing approach.
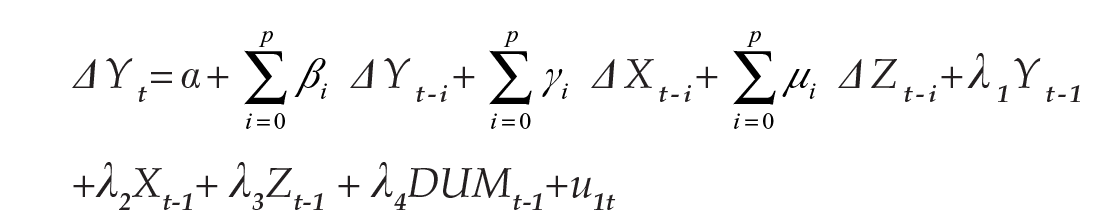
The ARDL framework for a four variable model can be expressed as follows:
DATA ANALYSIS AND RESULTS
Bound Test for Cointegration Analysis
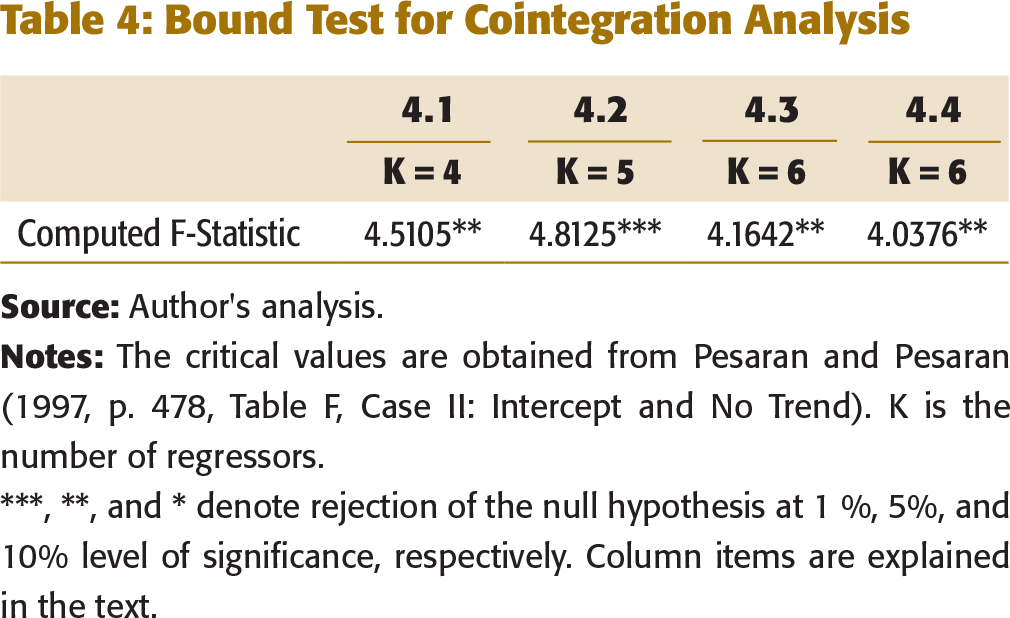
***, **, and * denote rejection of the null hypothesis at 1 %, 5%, and 10% level of significance, respectively. Column items are explained in the text.
Baseline Investment Regression (ARDL Model Long-run Results)
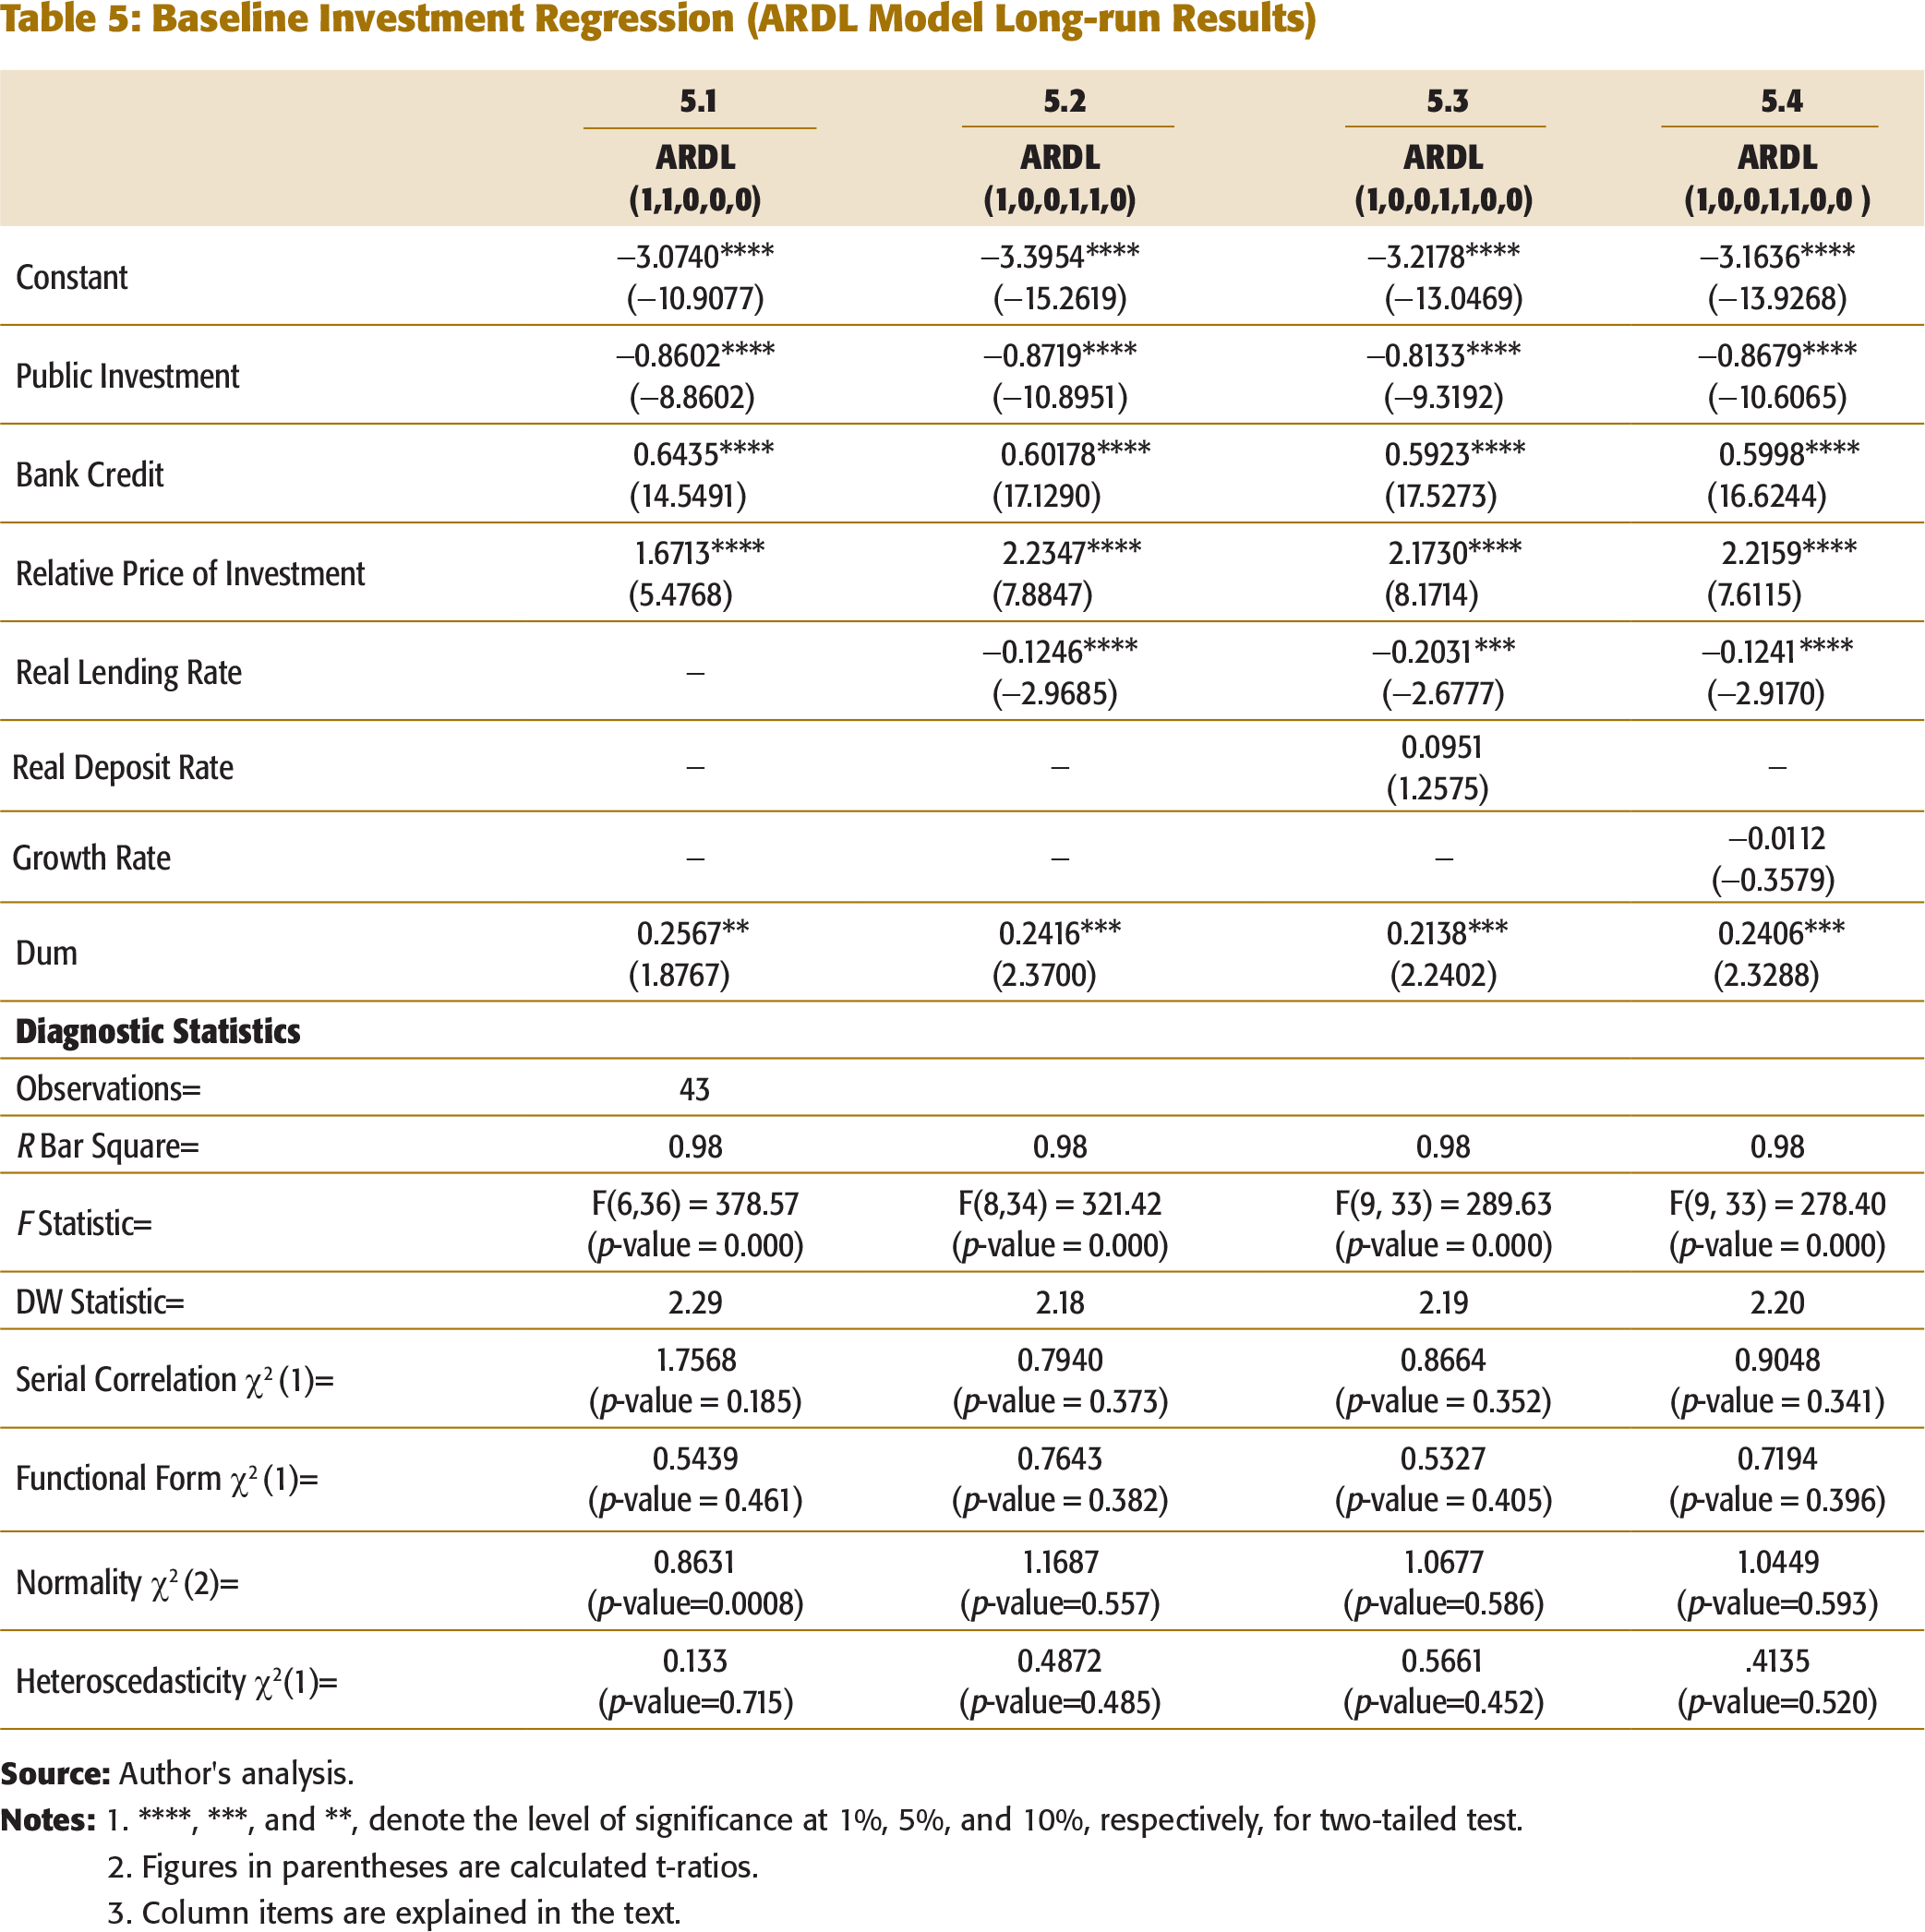
2. Figures in parentheses are calculated t-ratios.
3. Column items are explained in the text.
Baseline Investment Regression (ARDL Model ECM Results)
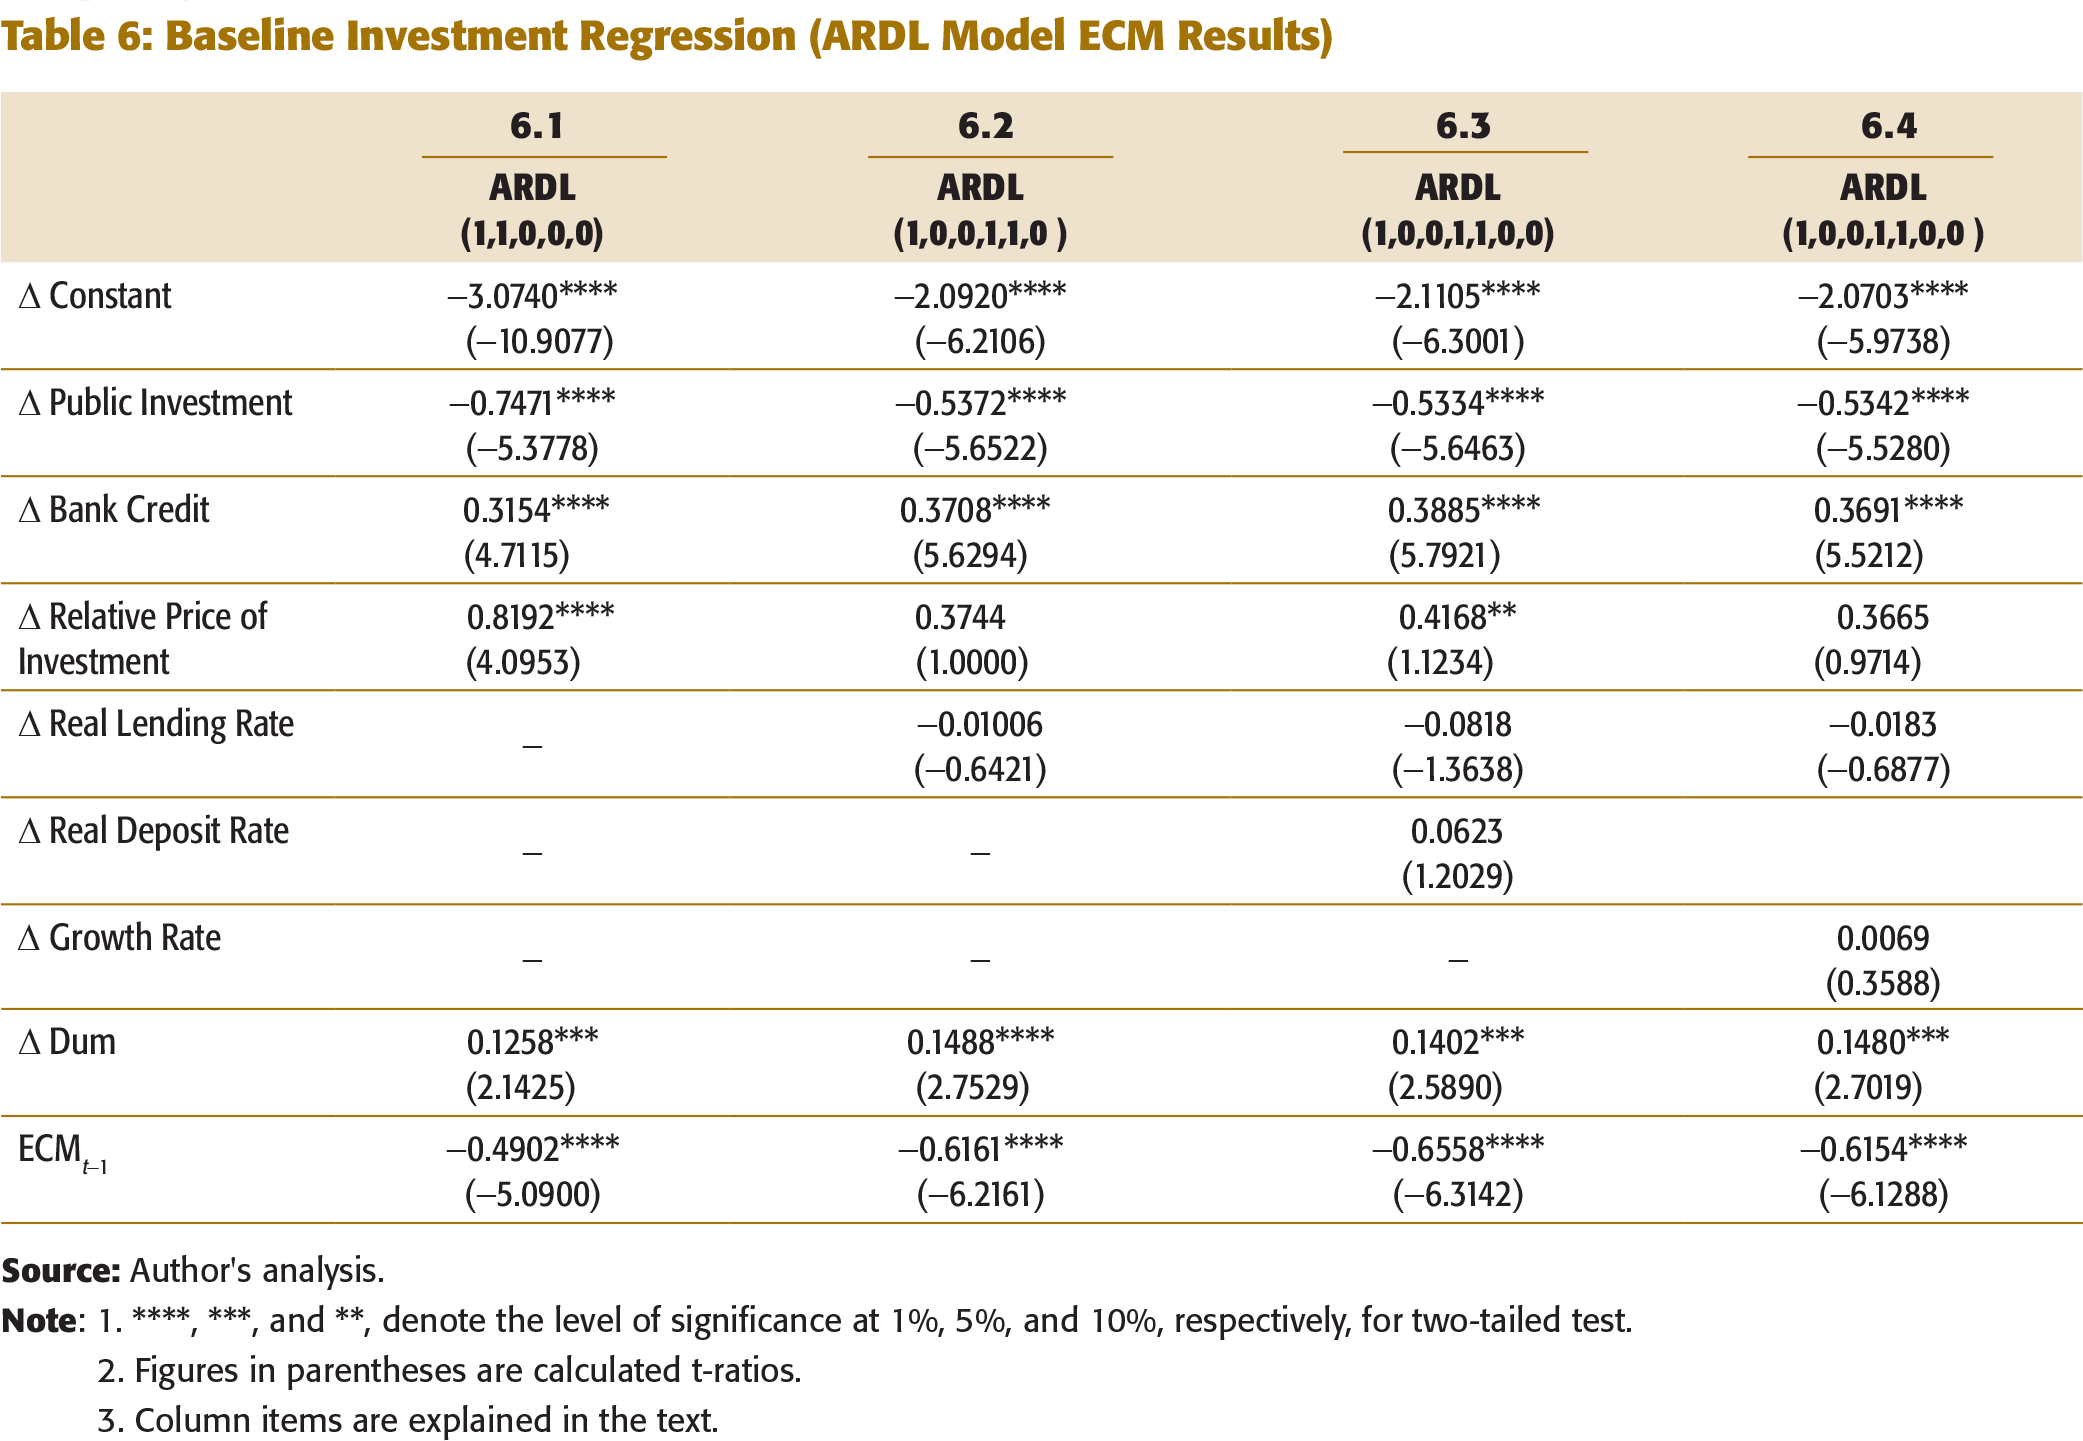
2. Figures in parentheses are calculated t-ratios.
3. Column items are explained in the text.
We also find that the coefficient of the endogenous structural dummy variable (DUM) is positive and statistically significant. This suggests that there was an increase in private investment in 1995–96 due to the various reform measures undertaken with regard to trade and foreign direct investment. For example, total approvals of FDI increased from $4.3 billion in 1994–95 to $11.2 billion in 1995–96. The import duties on capital goods were reduced from 38 per cent in 1994–95 to 29 per cent in 1995–96, respectively (Ahluwalia, n.d.). These reform measures had a positive shock on private investment in India.
The coefficients of error correction term (ECMt-1) are found to be large in magnitude and are statistically significant (Table 6). For instance, the coefficient of ECMt-1 ranges between 0.49 and 0.65 across all specifications. This implies that around 49 to 65 per cent of the disequilibrium (deviation of private investment from their respective equilibrium level) of the previous year’s shock gets corrected this year. This suggests that the disequilibrium in private investment function occurring due to various shocks gets adjusted completely between 2.5 and 3 years.
Furthermore, it is required that diagnostic statistics provide support for our chosen specifications. Table 5 reports the diagnostic test statistics of ARDL models. The high values of R2 for all the specifications show that the goodness of fit is satisfactory. The F- statistics which measures the joint significance of all regressors in the specifications are also significant at 0.01 level of significance. The Durbin-Watson statistics are also close to 2. The diagnostic test statistics also show that all the specifications pass the tests for serial correlation, functional form, normality, and heteroscedasticity.
We also test whether our baseline specification in column 5.3 of Table 5 is driven by reverse causality and is biasing our results. In order to address the endogeneity bias, we use each of the right hand side variables in column 5.3 of Table 5 as alternative dependent variables and test whether there exists a cointegrating relationship between the variables. The calculated F-statistics are equal to 2.70, 2.38, 1.90, 1.95 and 2.99 for public investment, real lending rate, bank credit, the relative price of investment, and real deposit rate, respectively (detailed results are not reported here for the sake of brevity). The relevant upper bound critical value at 5 per cent level of significance is 3.64 (Pesaran & Pesaran, 1997, Table F, Case-II, p. 478). As the calculated F-statistic is less than the critical value, no evidence of cointegration is found when alternative dependent variables are considered. Hence, the right hand side variables in column 5.3 of Table 5 can be treated as long-run forcing variables for the explanation of private investment and reverse causation is absent.
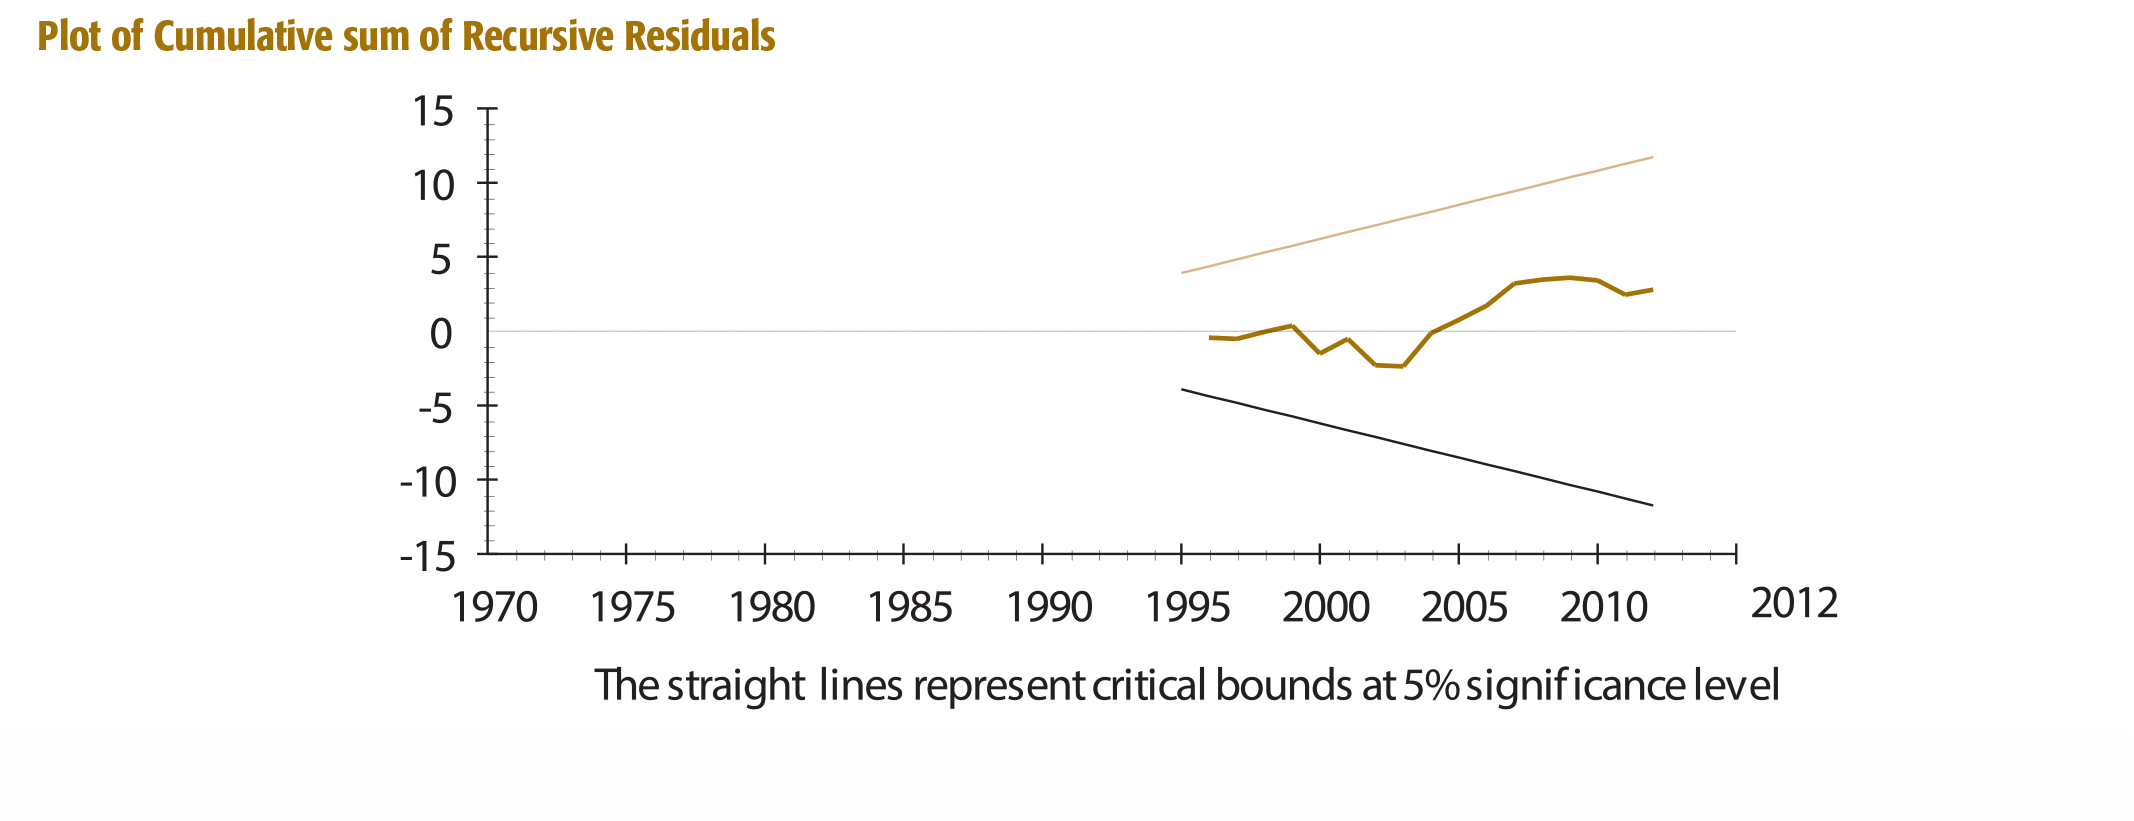
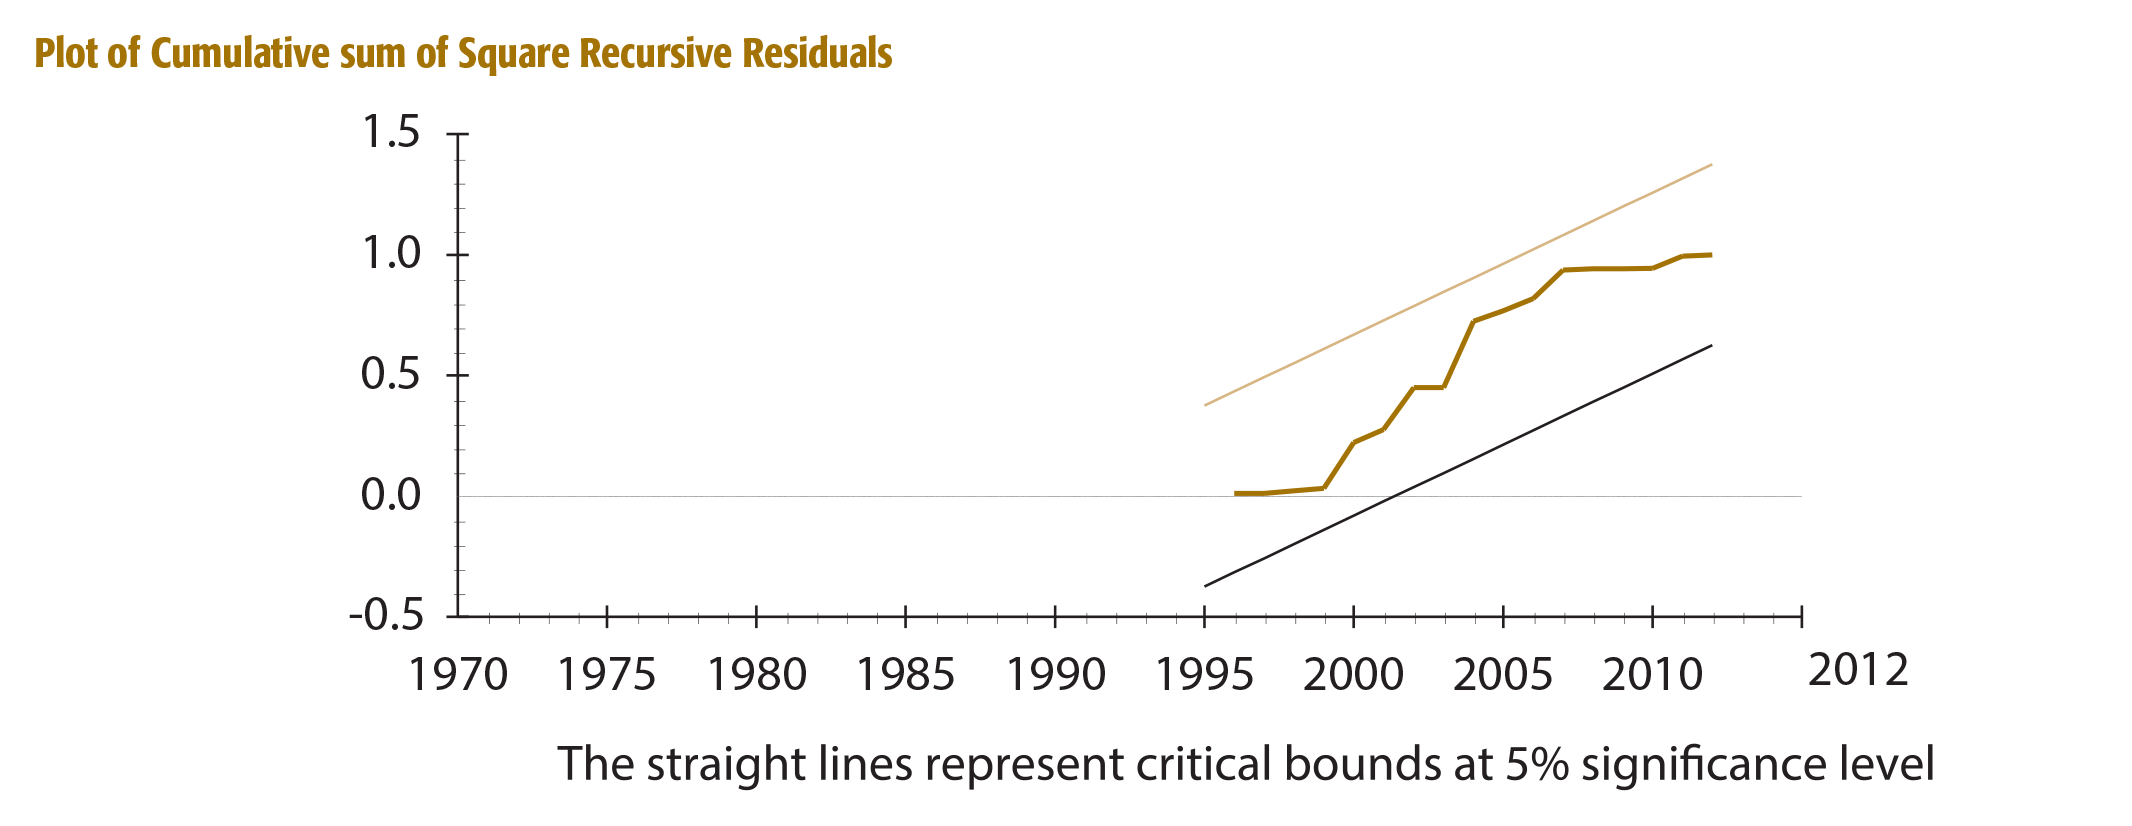
The plot of the cumulative sum (CUSUM) and the cumulative sum of squares (CUSUMSQ) of recursive residuals from our baseline specification against the critical bound of the 5 per cent level of significance show that the specification is stable over time (see Appendix 2).
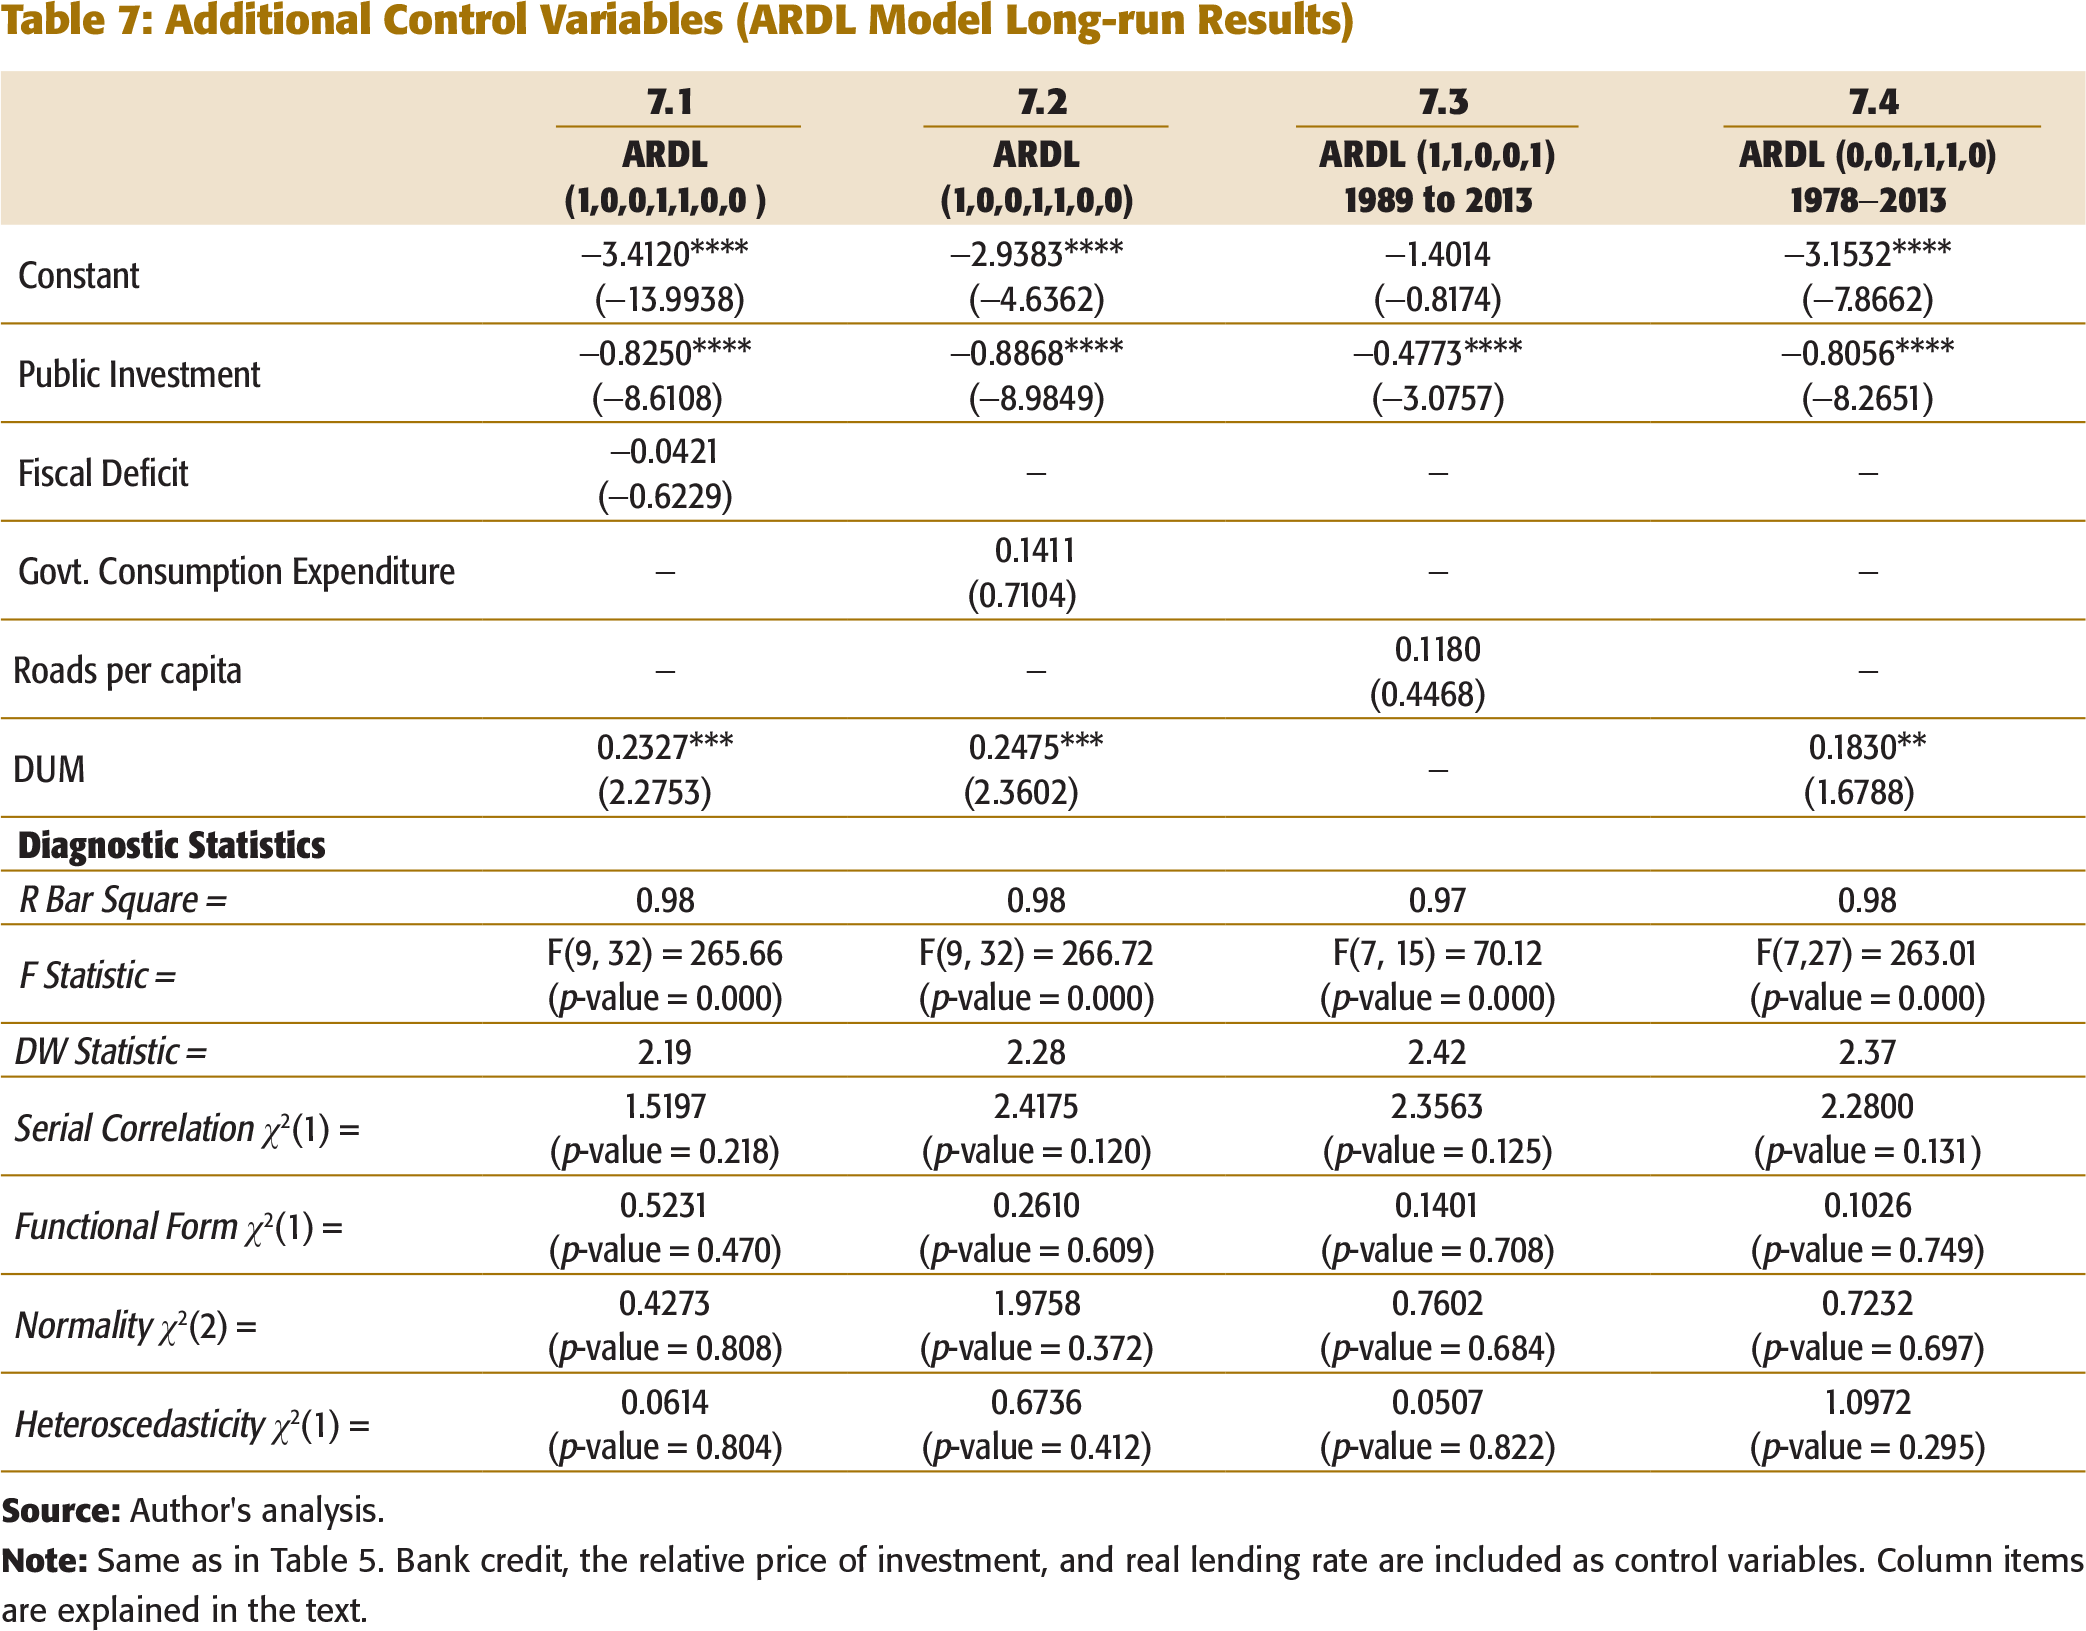
Additional Control Variables and Alternative Sample Period
We perform several checks on the robustness of our results. We start by examining whether the crowding out effect is driven by the central government balance as a share of GDP. Fiscal deficit as a percentage of GDP could be an important variable and could affect the private investment. This is because an increase in fiscal deficit may lead to a decrease in private investment on account of an increase in interest rate or a decrease in availability of loanable funds. Column 7.1 of Table 7 shows that the coefficient of fiscal deficit has the correct (negative) sign but it is insignificant. Hence, the crowding out of private investment is not driven by fiscal deficit.
Next, we examine whether the crowding out effect is driven by government final consumption expenditure. The inclusion of this variable allows us to disentangle whether public fixed investment or other types of expenditure crowds out private investment. Column 7.2 of Table 7 reports that the government consumption expenditure enters the regression with a positive sign but it is insignificant. Moreover, our main finding is robust to the inclusion of government consumption expenditure.
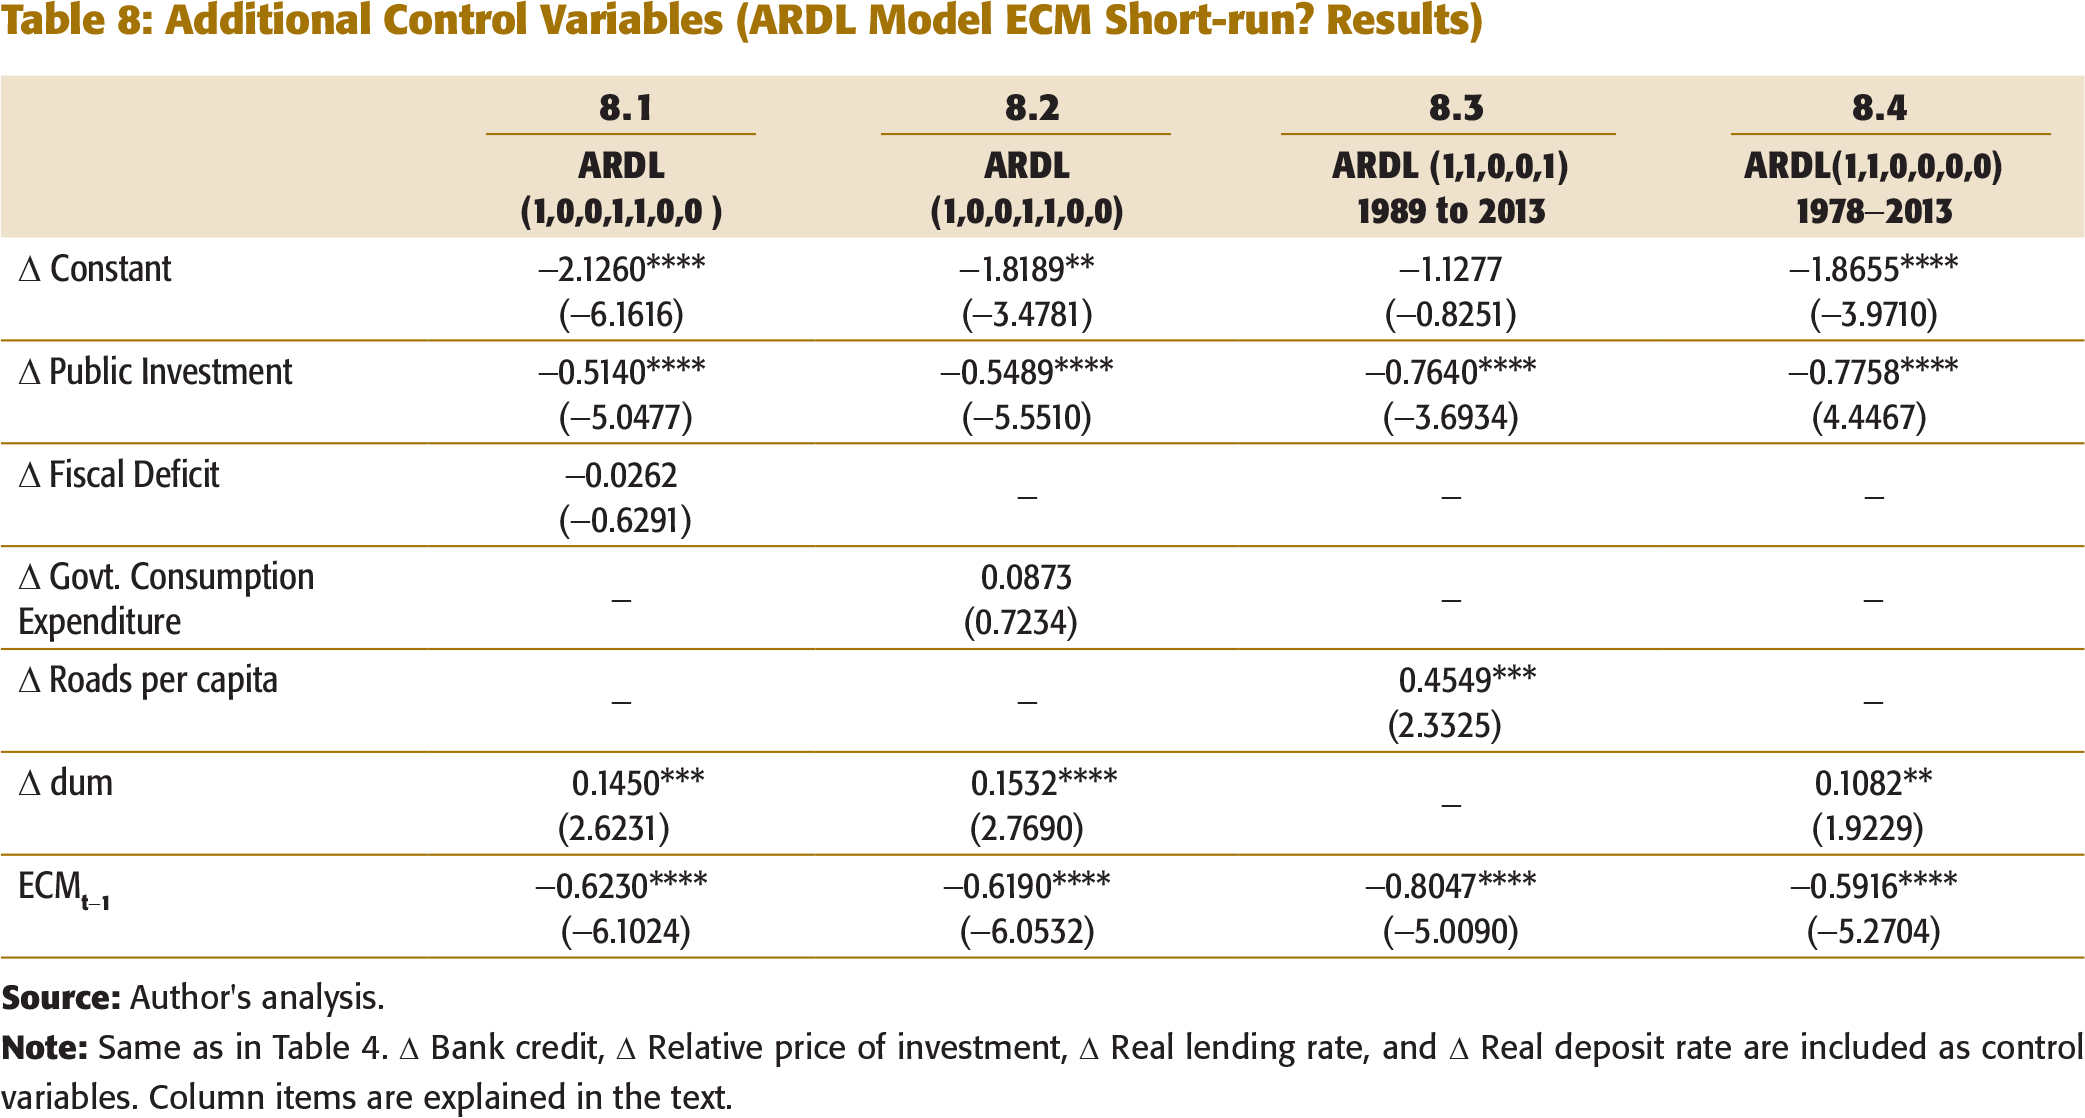
We also test whether the impact of public investment depends on inadequate public infrastructure (or inadequate stock of public capital). Inadequate public infrastructure hinders private investment, but at the same time leads to an increase in public investment. If this is so, then there is a possibility that the crowding out effect might be driven by insufficient public infrastructure. In order to test this, we included kilometres of roads per capita in our baseline specification but no cointegration relationship was found between the variables. After excluding lending rate and DUM from the specification as they were insignificant, we found a cointegrating relationship between the remaining explanatory variables and private investment. The coefficient of the roads per capita has positive signs in both long- and short-run equations (see columns 7.3 and 8.3 of Tables 7 and 8, respectively), but it is significant only in the short run. This suggests that public investment is complementary to private investment in India, but there are distortions in the process of creation of stock of public capital. This is similar to the findings reported by a few previous studies (Blejer & Khan, 1984; Cavallo & Daude, 2011). Blejer and Khan (1984) argued that while public infrastructure investment was complementary to private investment, other types of public investment caused crowding out of private investment.
Additional Control Variables (ARDL Model Long-run Results)
Additional Control Variables (ARDL Model ECM Short-run? Results)
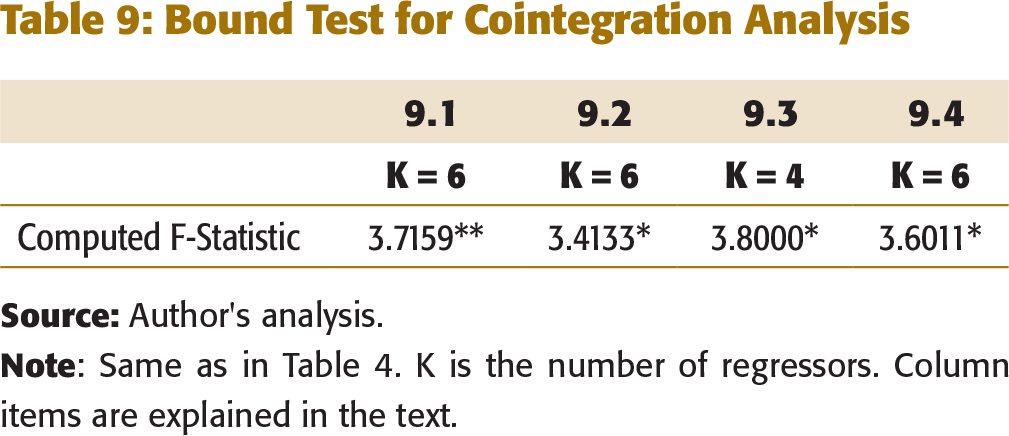
Bound Test for Cointegration Analysis
Interaction with Structural Characteristics
Having shown that public investment systematically crowds out private investment, we now deepen our analysis by incorporating various structural characteristics into the investment function. The impact of public investment on private investment may vary for different political regimes, different level of economic reforms, and different level of foreign direct investment because of the possibility of an interaction between public investment and these characteristics.
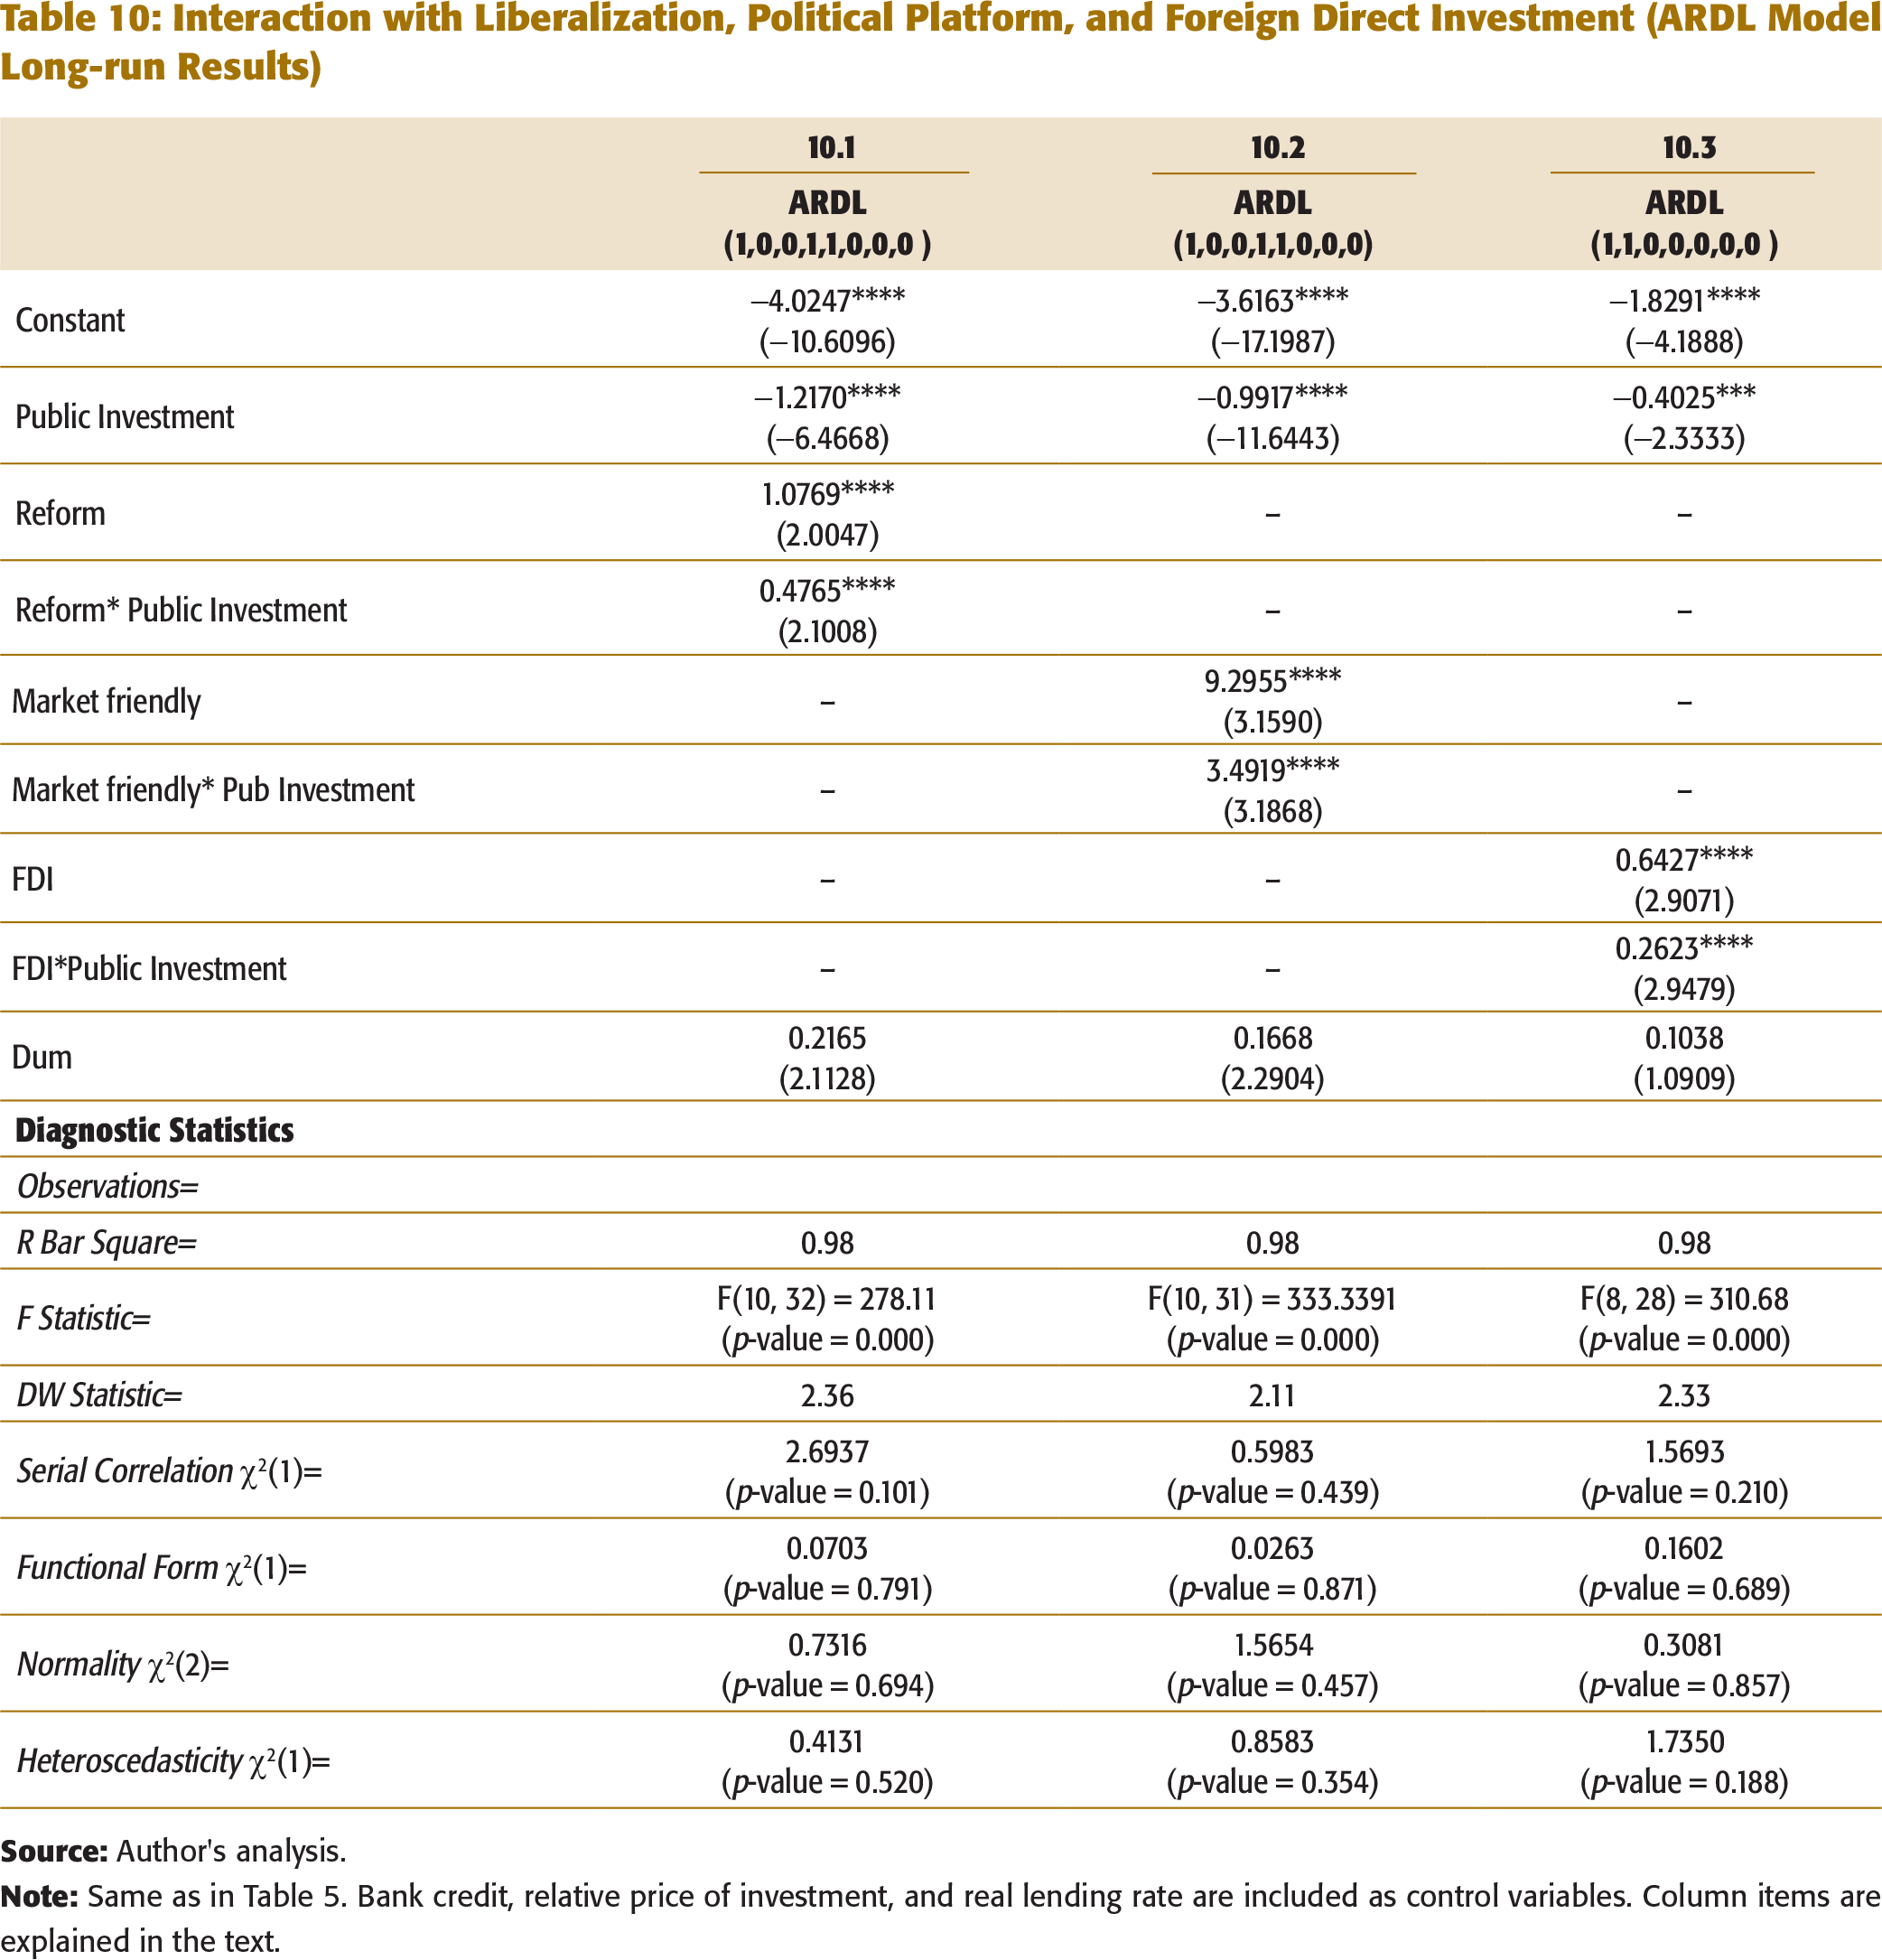
We first examine the differential effect of public investment on private investment by economic liberalization. After the adoption of New Industrial Policy of 1991, the Government of India removed the industrial licensing requirement for various industrial sectors, reduced the number of activities for public sector, and opened up a large number of activities for foreign investors. A number of financial sector reforms like deregulation of interest rates, reduction of cash reserve ratio and statutory liquidity ratio, and the introduction of various financial instruments were also carried out. Such a dramatic shift in policies is expected to have relaxed financing constraints and might have dampened the crowding out effect of public investment. To examine the impact of liberalization on crowding out effect, we include both reform dummy variable and its interaction with the public investment. Reform dummy takes the value of 1 for the period from 1992 to 2013 and 0 otherwise. The interaction term captures the differential effect of economic reform on the magnitude of coefficient of public investment. Column 10.1 of Table 10 shows that coefficient of the interaction term is positive and significant. This suggests that the crowding out effect of public investment on private investment was dampened during the post-reform period.
Interaction with Liberalization, Political Platform, and Foreign Direct Investment (ARDL Model Long-run Results)
Interaction with Liberalization, Political Platform, and Foreign Direct Investment (ARDL Model ECM Results)
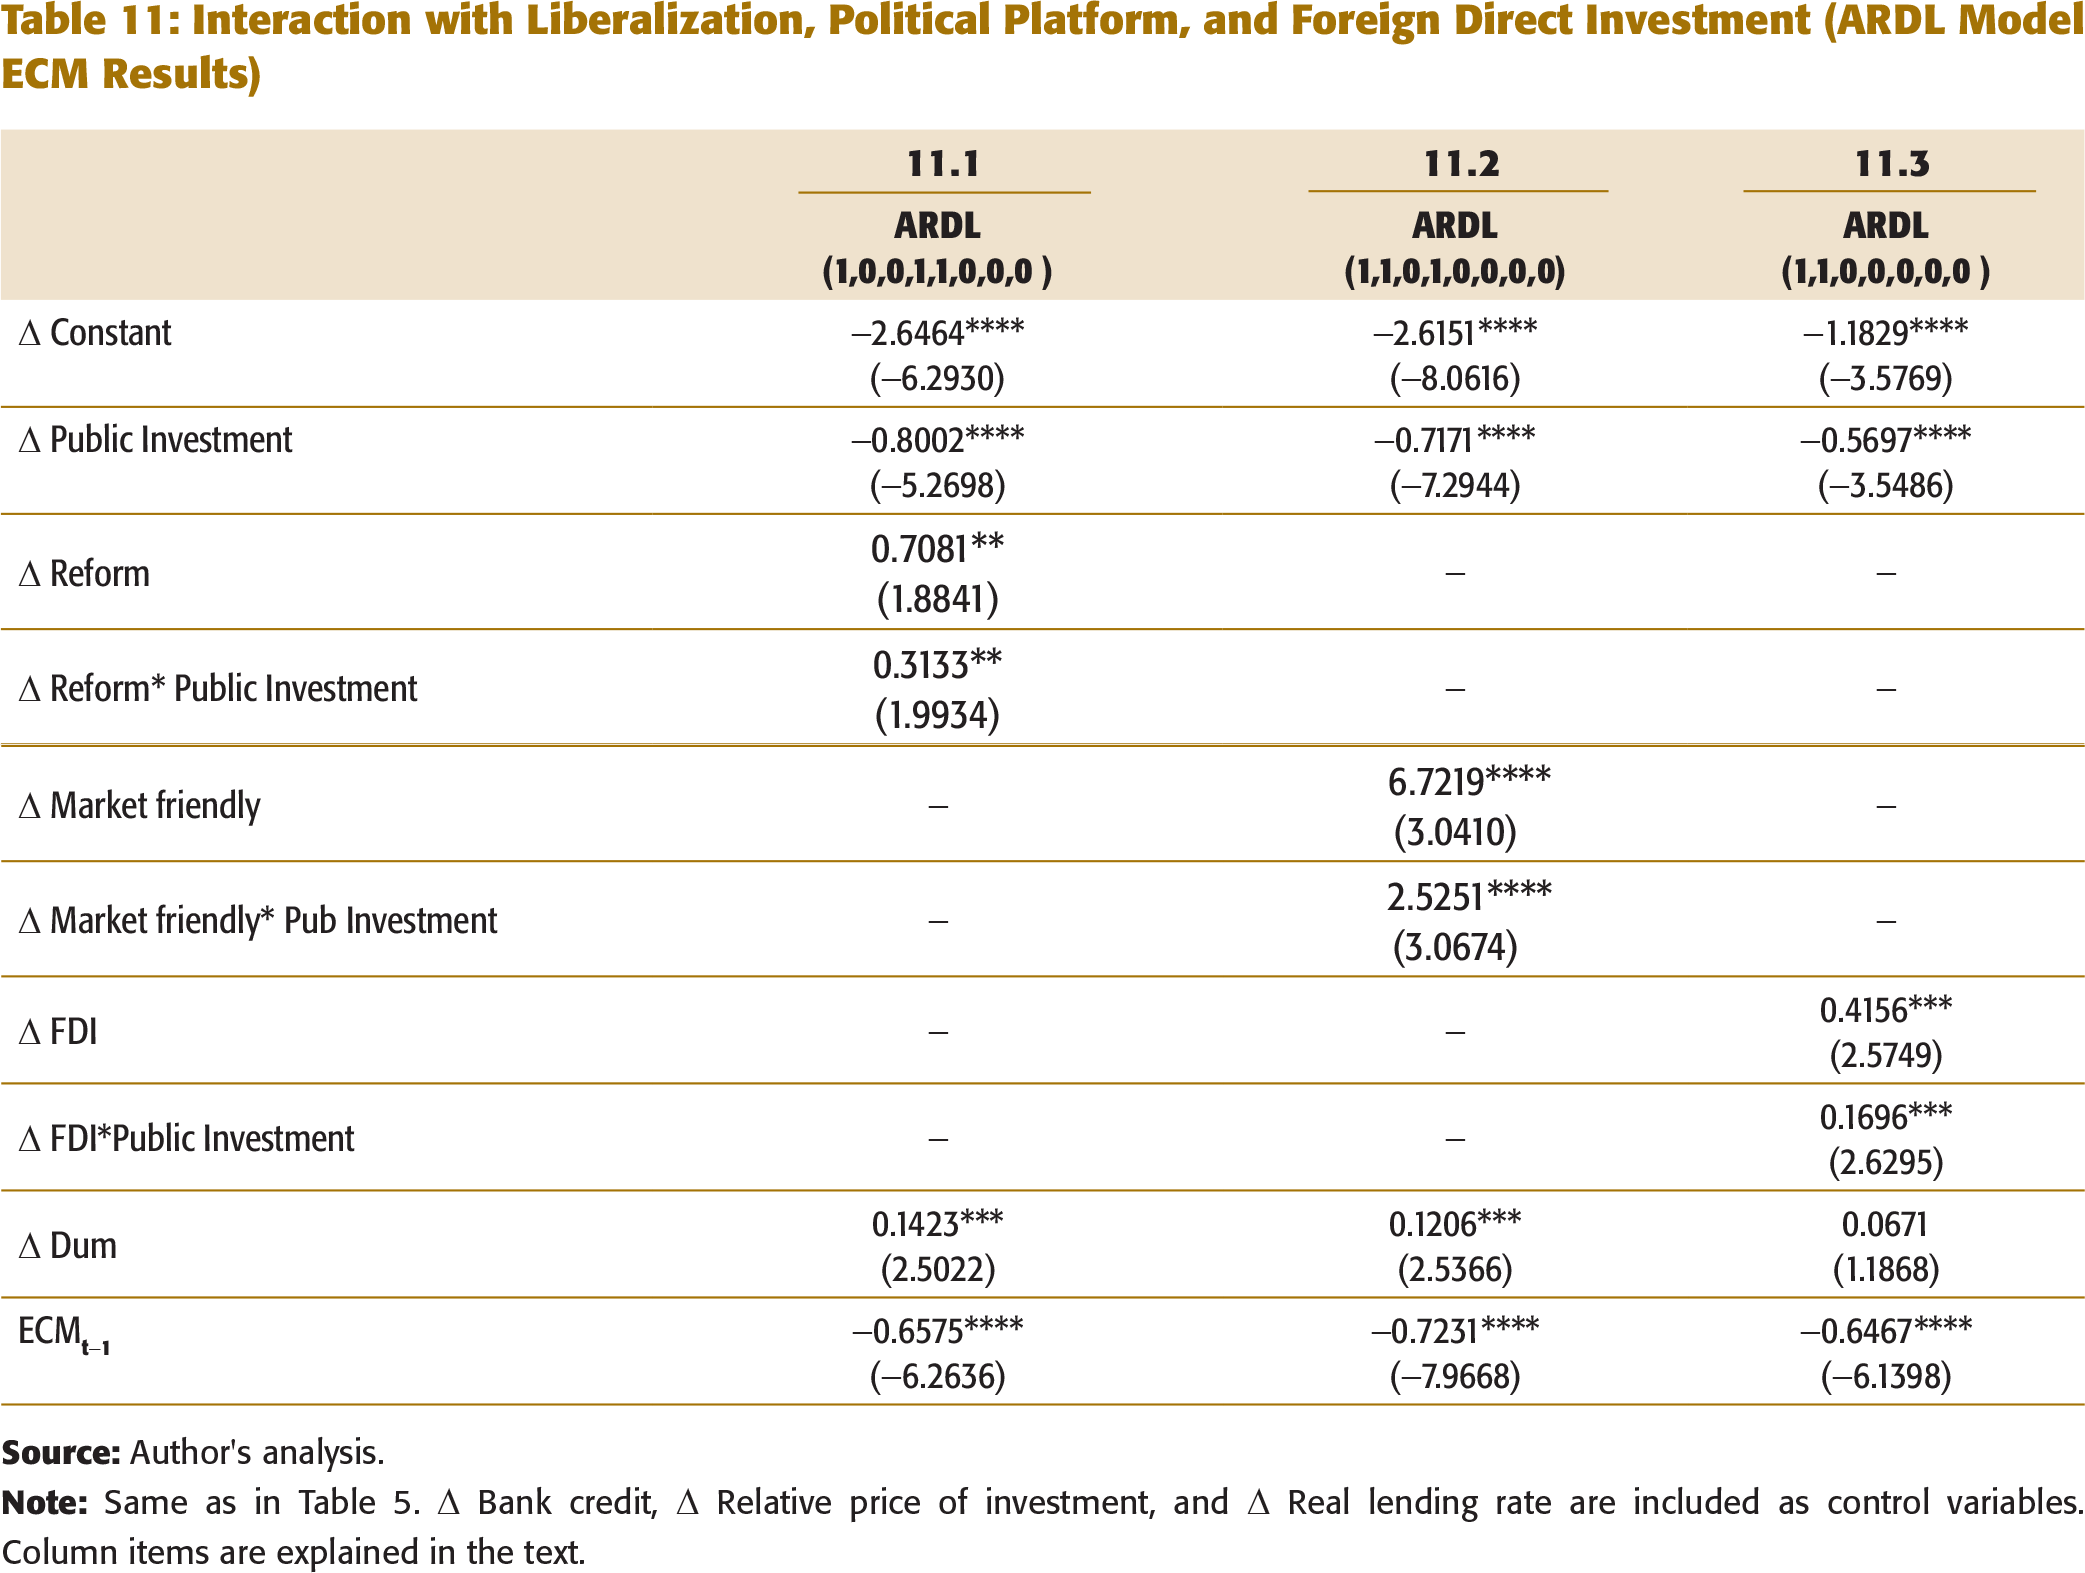
Column items are explained in the text.
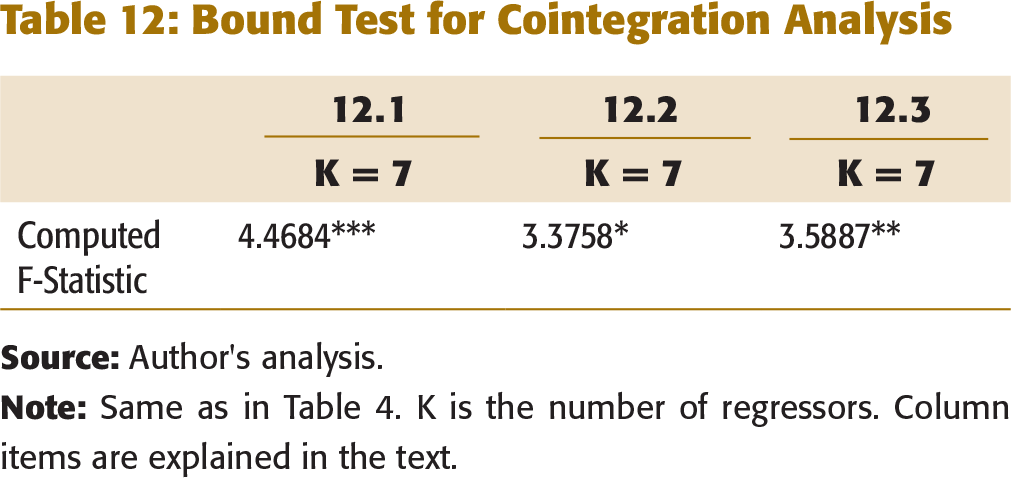
Table 12 reports the cointegration results for each of the model specifications considered in Table 10.
Bound Test for Cointegration Analysis
Alternative Possible Explanations
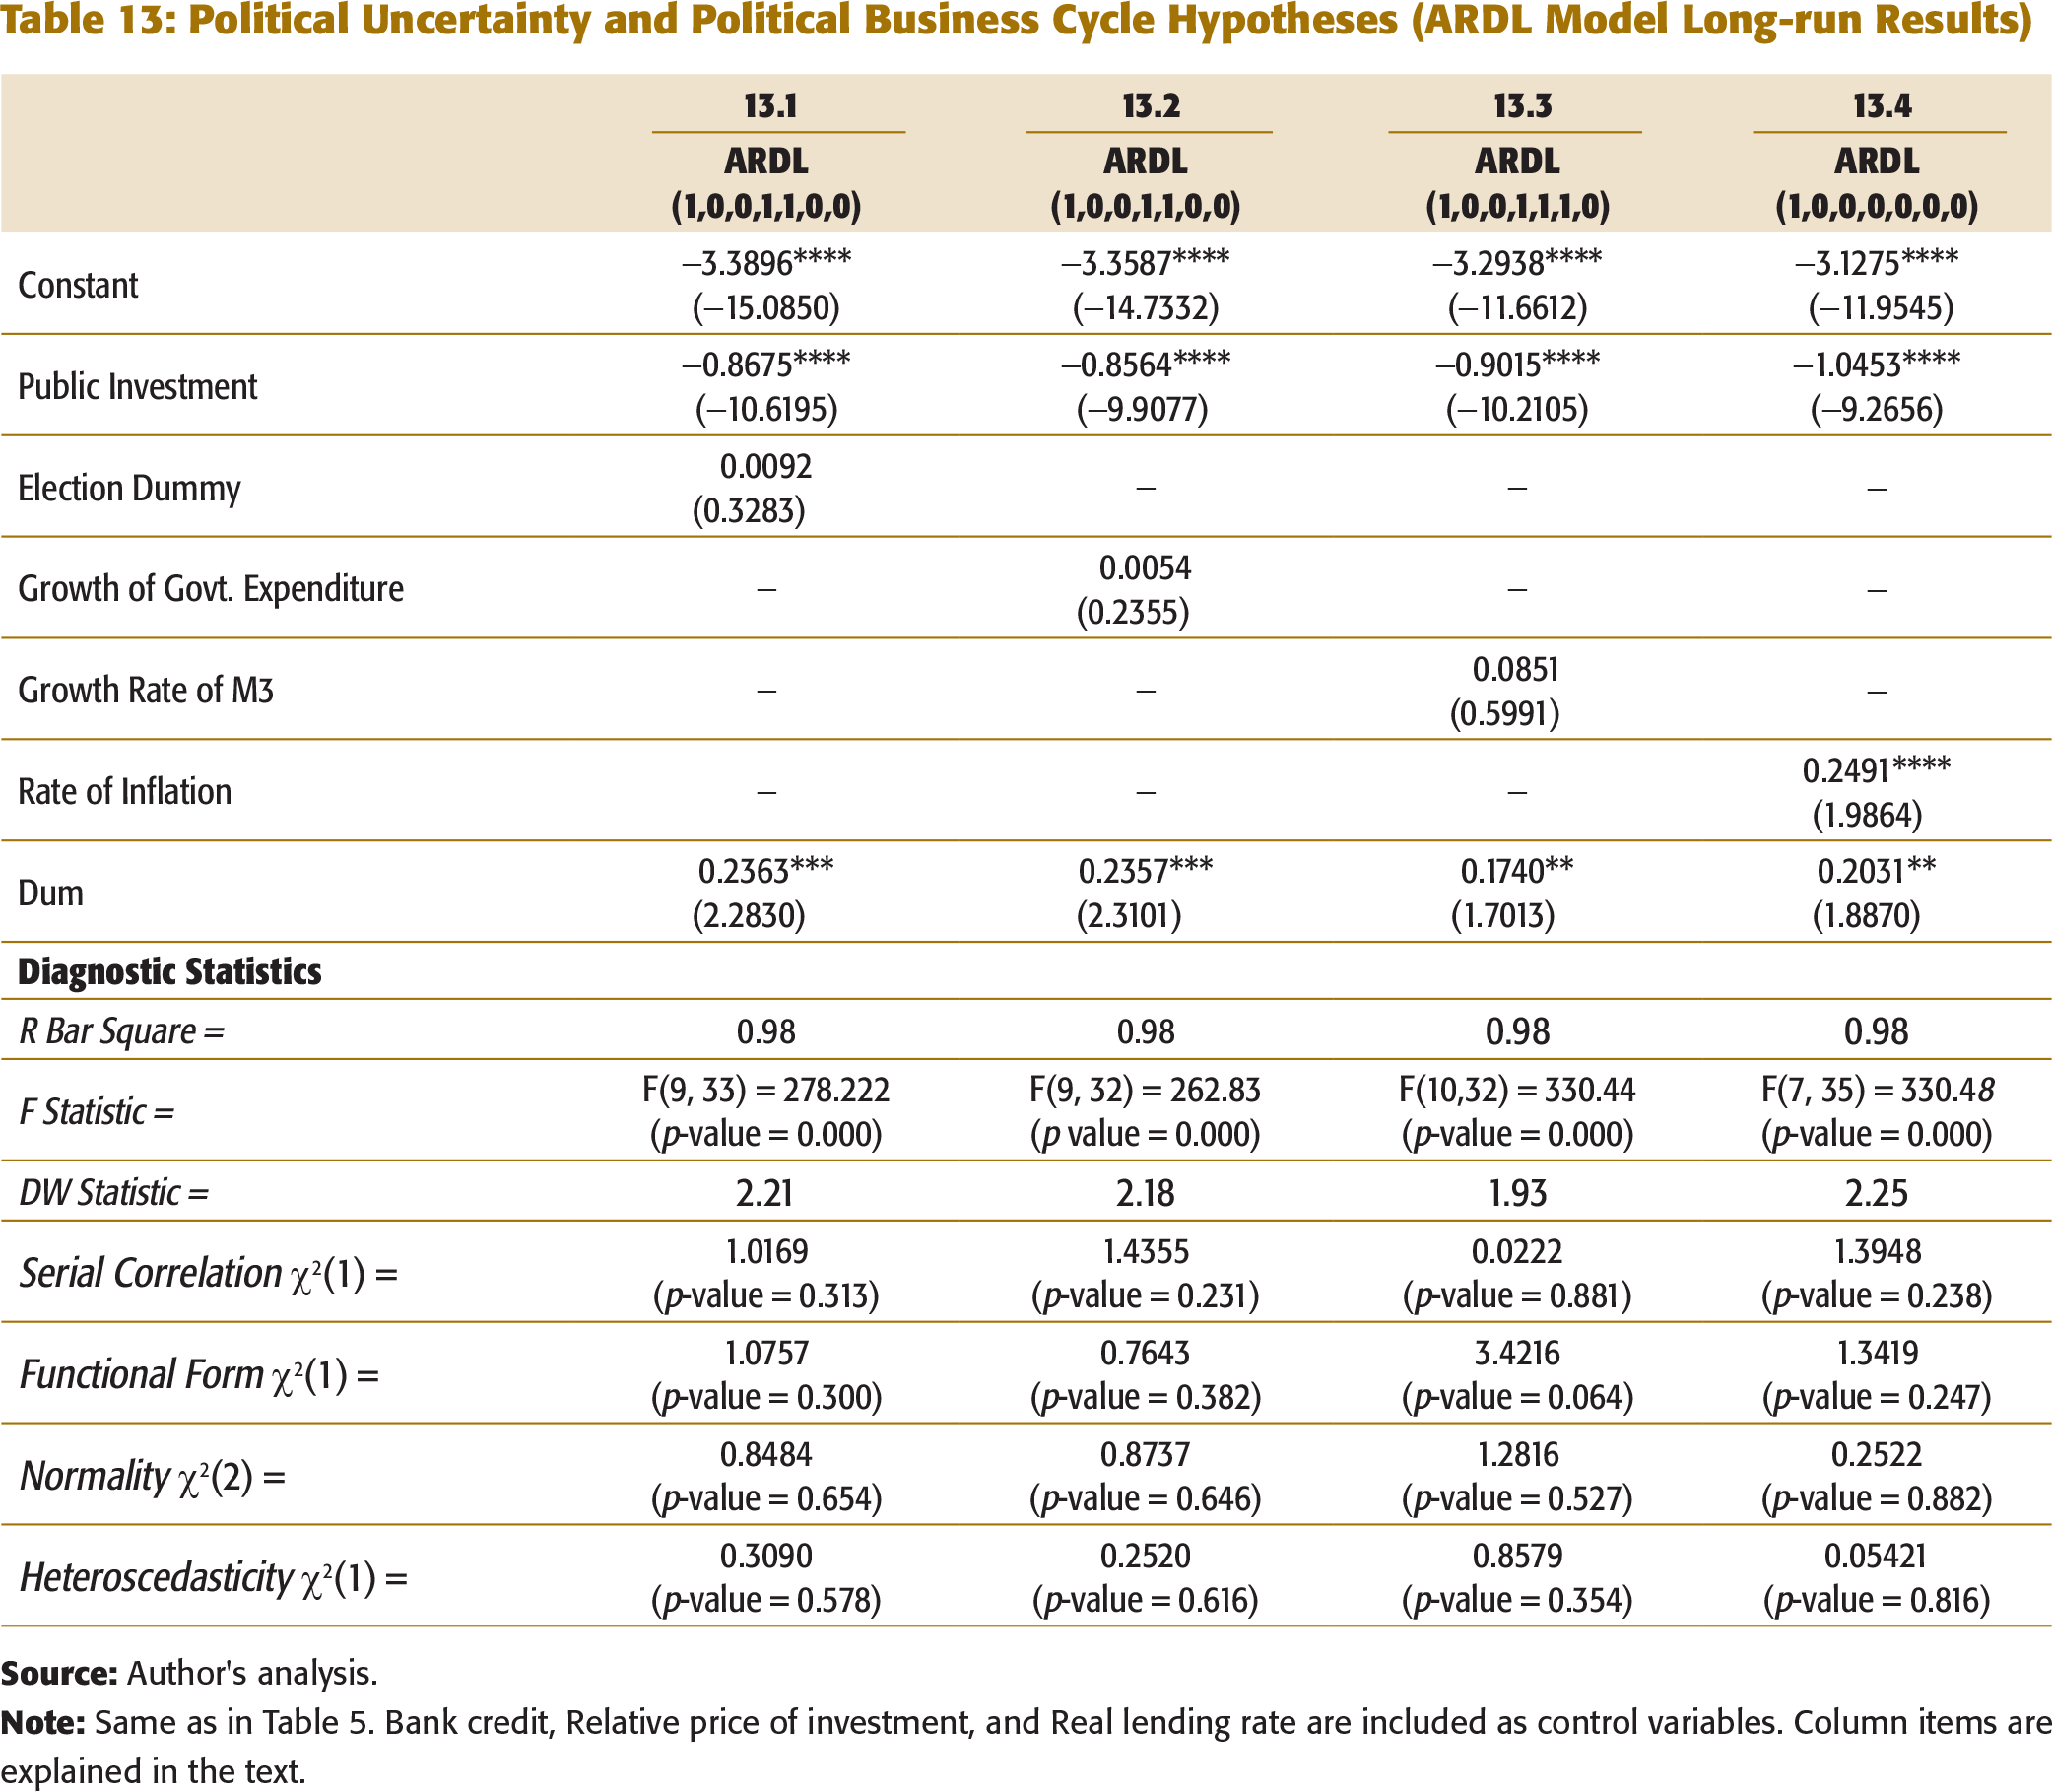
In this section, we examine whether other potential channels may contribute to the crowding out results. First, political uncertainty (i.e. situation in which investors are unsure about which party will win election and form the government) may affect private investment negatively. This is because political uncertainty leads to policy uncertainty as each political party has its own policy preference regarding industry regulation, taxation, and so on. As a result, rational firms prefer delaying investment until the political uncertainty is resolved. Hence, political uncertainty may reduce private investment. Julio and Yook (2012) examined the impact of fluctuations in political uncertainty in corporate investment in 48 countries between 1980 and 2005 in the context of national elections and found that political uncertainty leads to a reduction on investment expenditure by an average of 4.8 per cent in the election years relative to the non-election years. This suggests that uncertainty associated with changes in national leadership causes firms to reduce investment rate.
Julio and Yook (2012) used the timing of election as a measure of political uncertainty. It is based on the assumption that political uncertainty is usually higher during election time as compared to other time periods. Empirical evidence suggests that uncertainty related to political changes is reflected in asset prices. For instance, it is found that stock market volatility is significantly higher during an election period than during non-election periods (Bialkowski, Gottschalk, & Wisniewski 2008; Boutchkova, Doshi, Durnev, & Molchanov, 2011). Similarly, Bernhard and Leblang (2006) found several changes in exchange rates, bond yields, and equity prices during elections. This evidence supports that political uncertainty is more than normal during election years.
Political Uncertainty and Political Business Cycle Hypotheses (ARDL Model Long-run Results)
Political Uncertainty and Political Business Cycle Hypotheses (ARDL Model ECM Results)
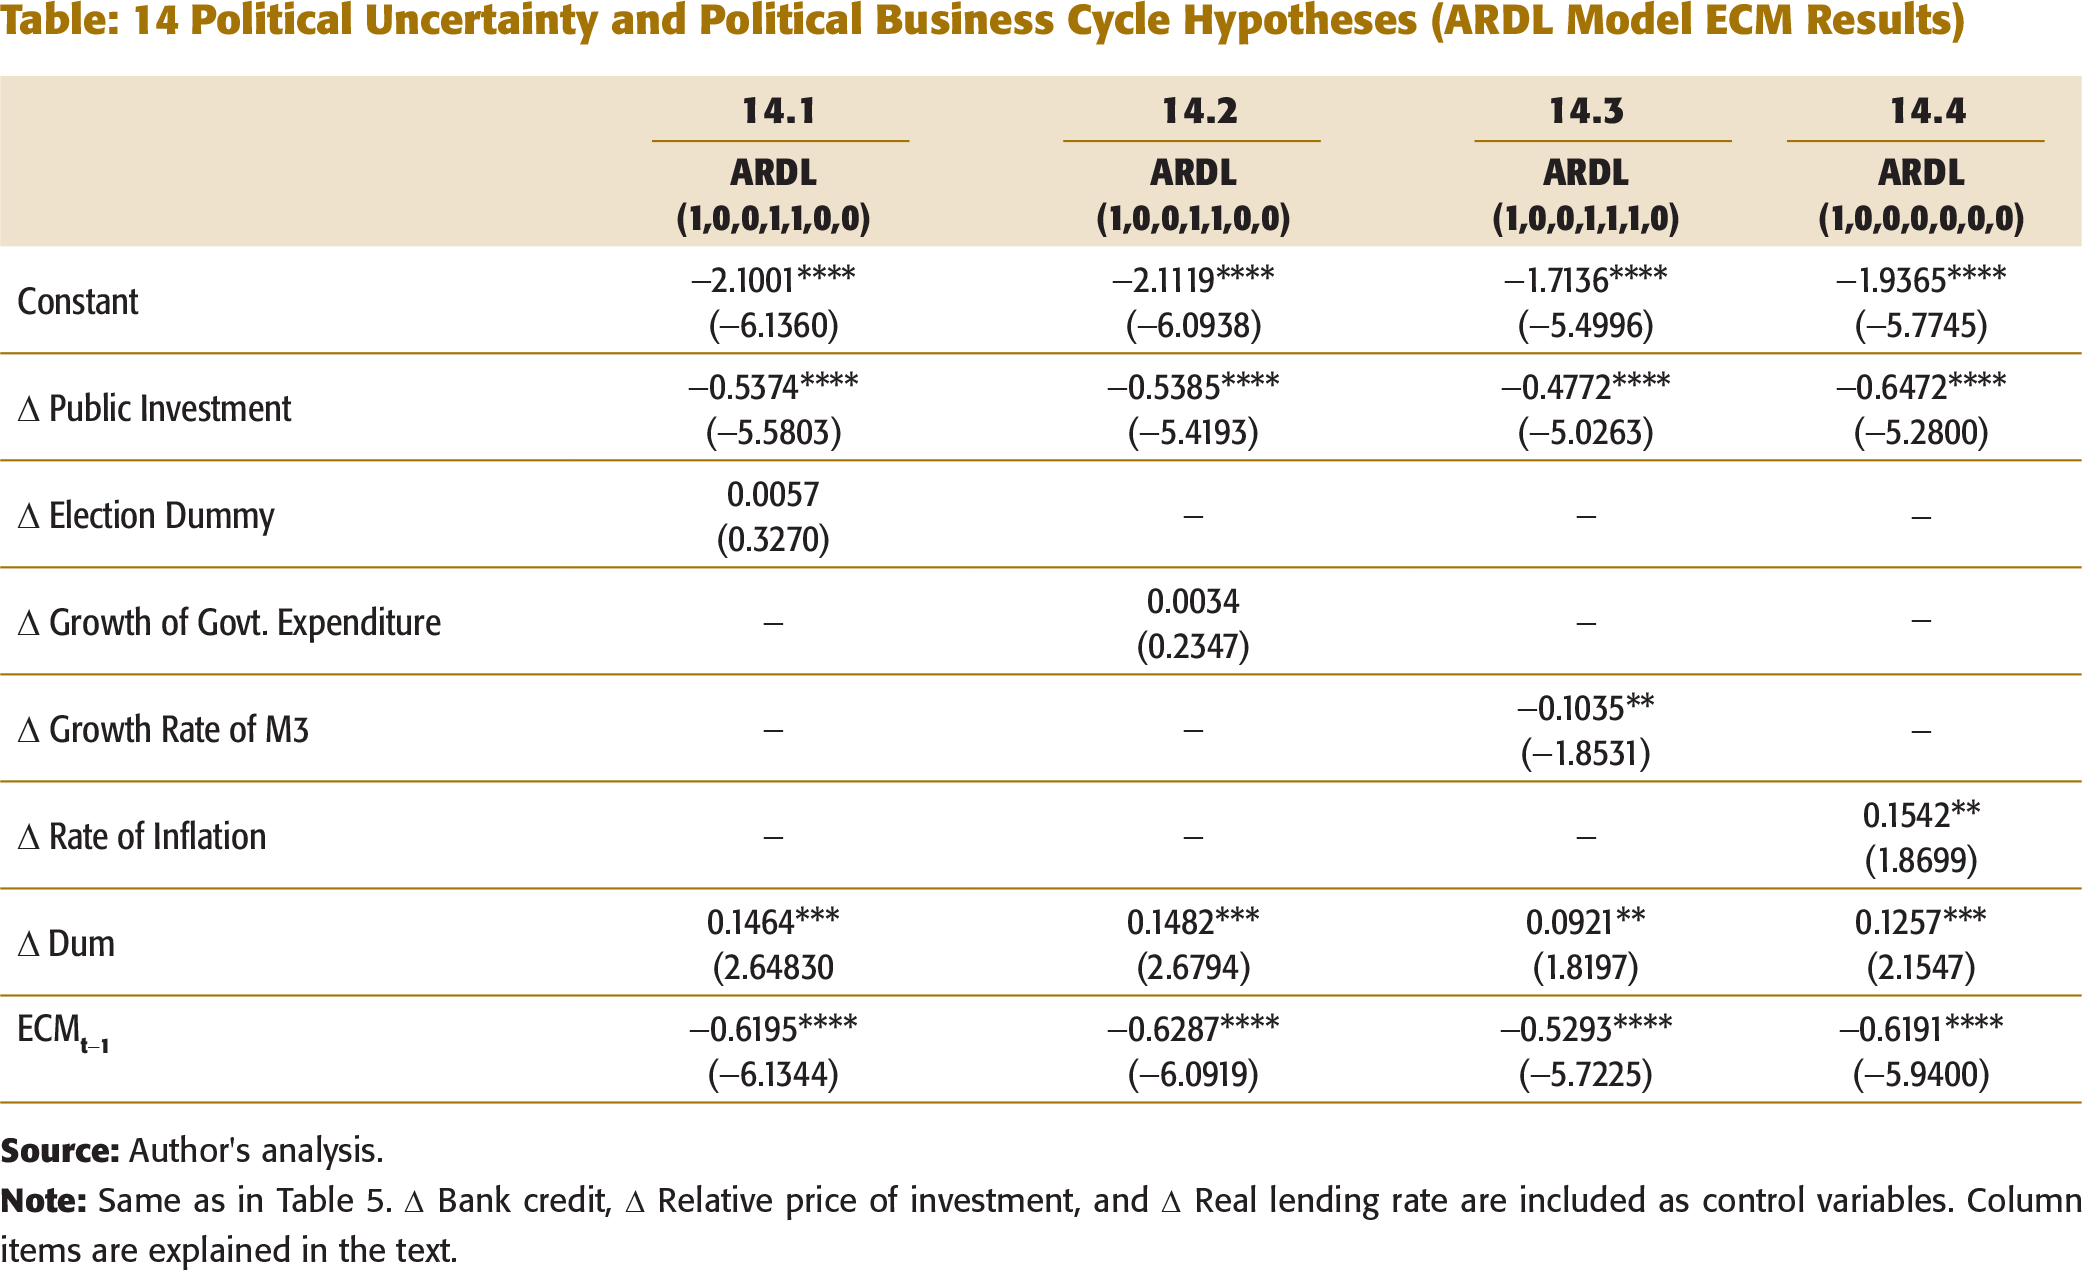
Another factor, which may contribute to crowding out effect of public investment on private investment, is the political business cycle. As per the political business cycle theory, politicians successfully manipulate fiscal and monetary policy instruments to influence macroeconomic performance prior to an election to enhance their chances of re-election (Nordhaus, 1975). The basic idea behind the theory is that voters make their decisions on the basis of the state of the economy at the time of election. Therefore, politicians use expansionary monetary and fiscal policies to exploit the short-run trade-off between inflation and growth. An expansionary monetary policy is expected to increase private investment and an expansionary fiscal policy is expected to crowd out private investment.
We test if political business cycle contributes to this crowding out of private investment. We adopt the approach of Julio and Yook (2012) to test the political business cycle theory and estimate the following specification using data from 1970–71 to 2012–13:

Political Business Cycle Regressions
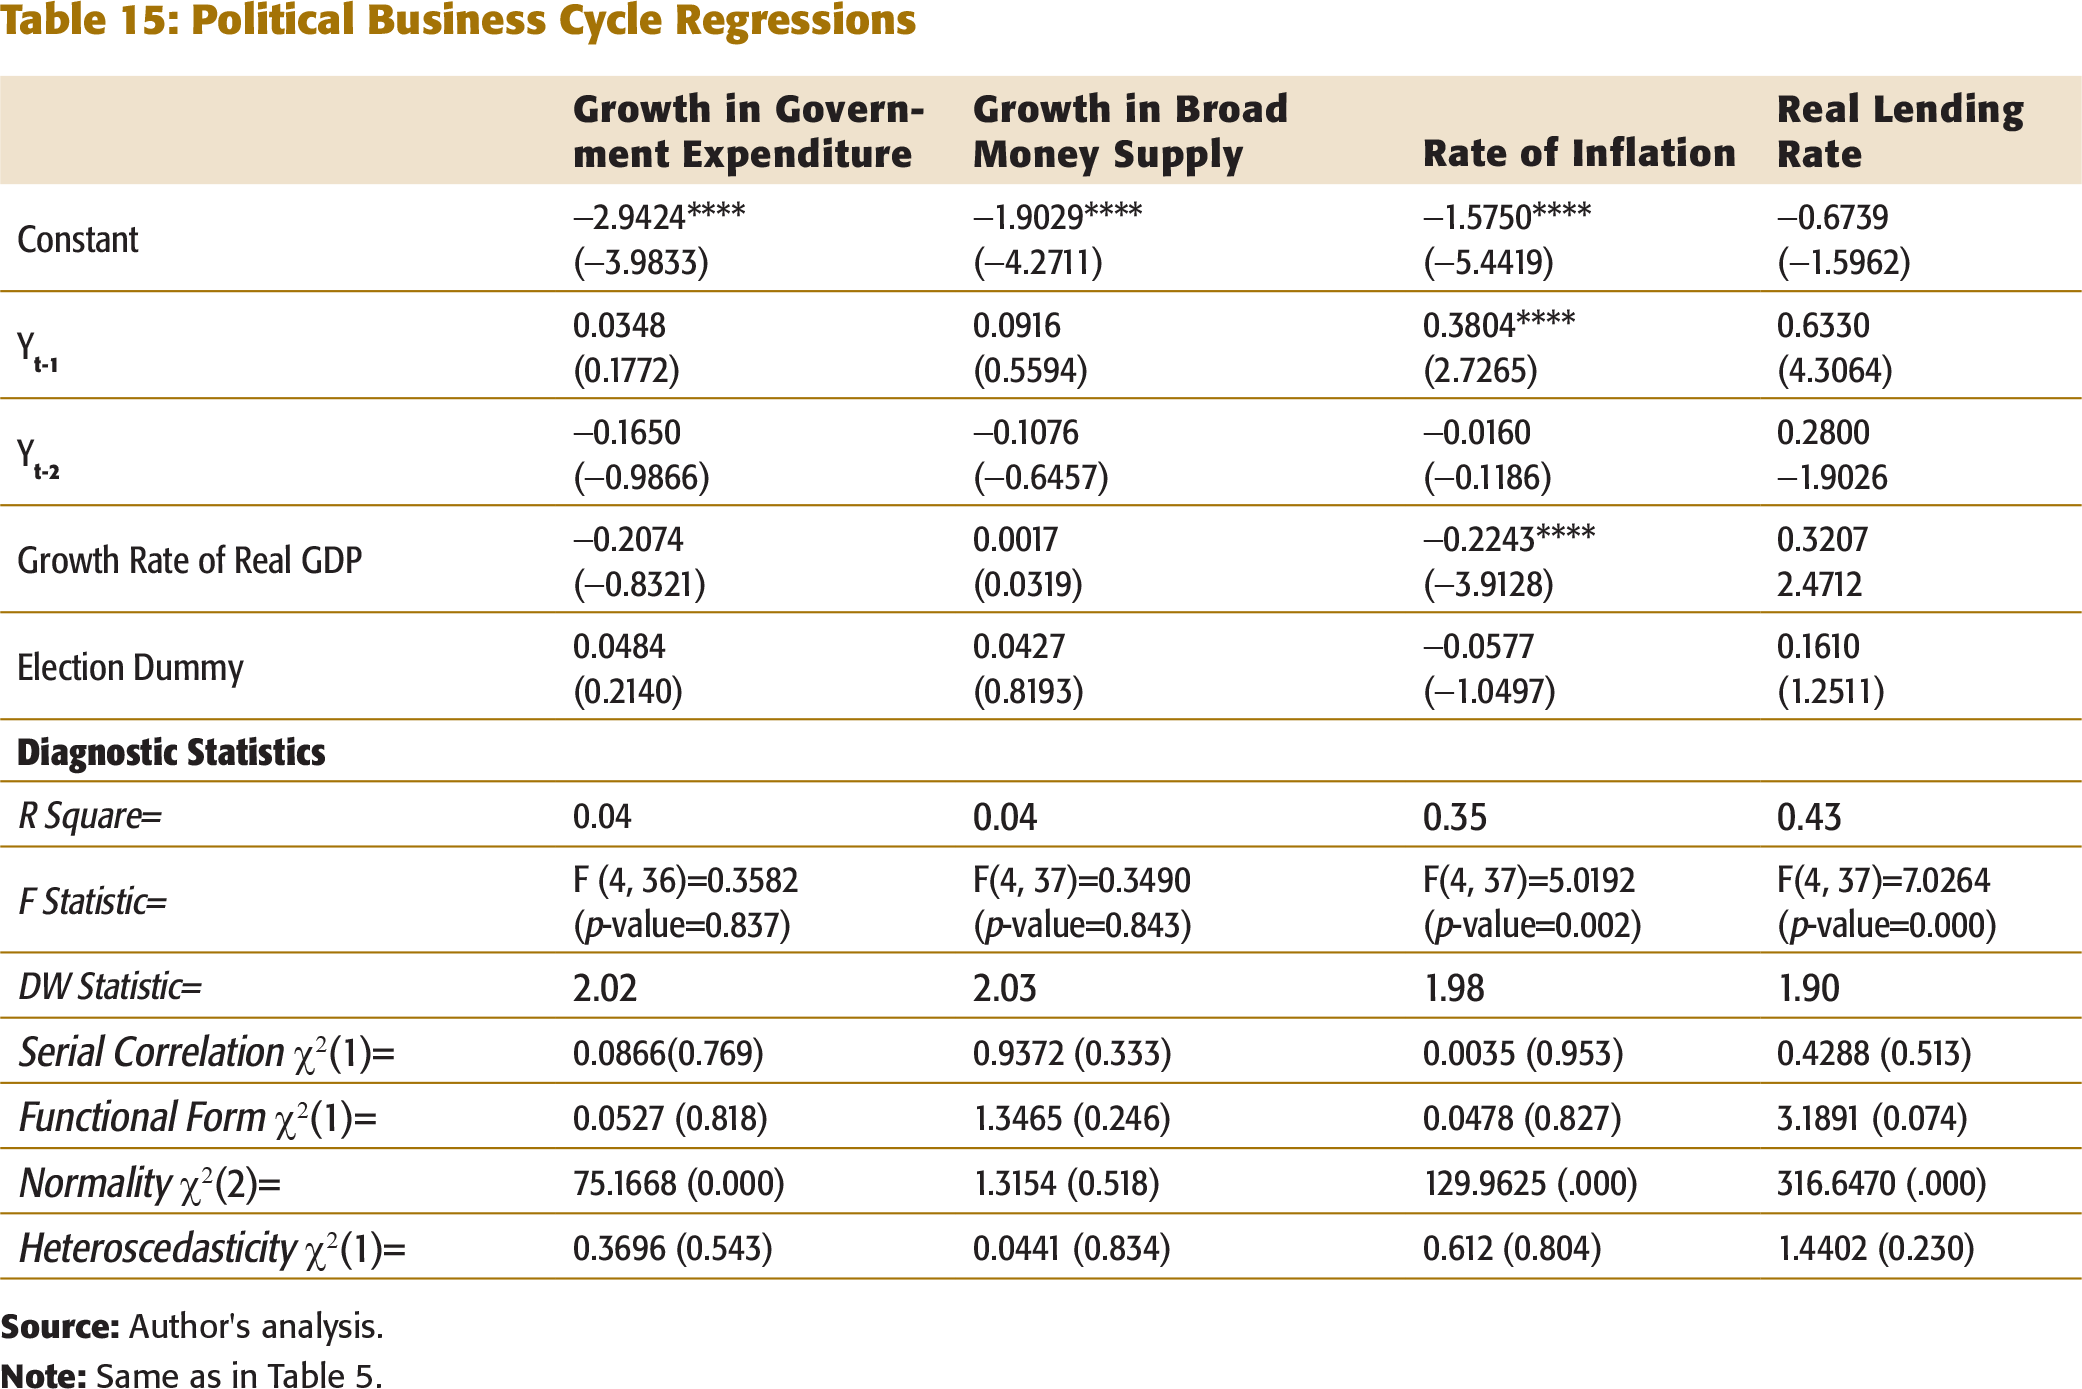
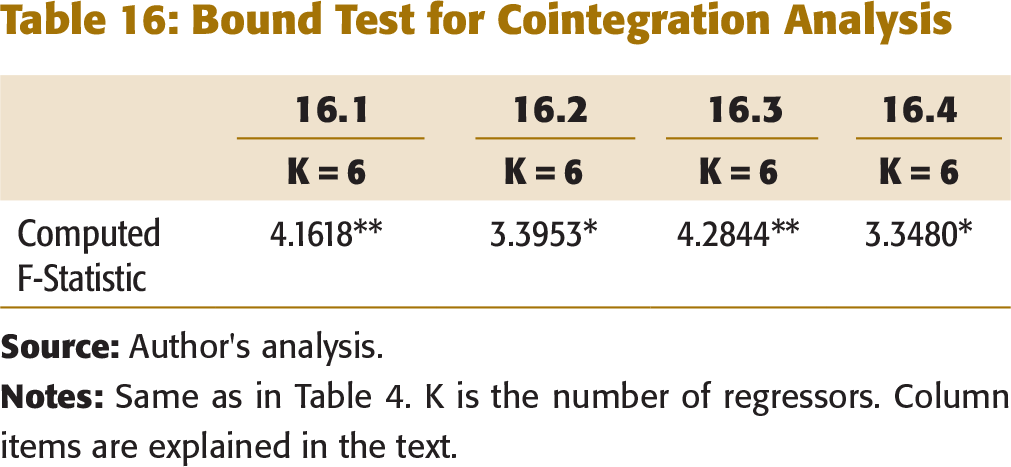
Table 16 reports the cointegration results for each of the model specifications considered in Tables 13 and 14.
Bound Test for Cointegration Analysis
CONCLUSIONS
This study attempts to find out whether public investment crowded out private investment in India during 1970–2013 using ARDL procedure developed by Pesaran and Shin (1999) and Pesaran et al. (2001) in the presence of endogenous structural break. The results of this study reveal that public investment crowds out private investment. Our base line results imply that a 1 per cent increase in public investment as a ratio of GDP leads to 0.81 per cent and 0.53 per cent decrease in private investment as a ratio of GDP in the long run and short run, respectively, after controlling for economic conditions. Moreover, a “market friendly” incumbency is found to dampen the magnitude of the crowding out effect of public investment. The results also reveal that an increase in the ratio of foreign direct investment to GDP offsets the magnitude of the crowding out effect of public investment on private investment.
Further, public infrastructure (represented by the kilometres of roads per capita) is found to have a positive effect on private investment in the short run. However, this complementarity may disappear if public investment projects are not of good quality and/or financing of these public projects have an adverse effect on the availability of bank credit or lending rate. Also, not all types of public investment have the same positive effect. Public investment should in fact be focused more on goods and services which are non-rival and non-excludable in nature with significant positive externalities.
It is important to note that we included a single endogenously determined structural break in our model, excluding the possibility of multiple breaks. There is a scope to increase multiple structural breaks in the analysis and re-investigate the impact of public investment on private investment in India in future studies.
DATA DESCRIPTION
Plot of Cumulative sum of Recursive Residuals
Plot of Cumulative sum of Square Recursive Residuals
ACKNOWLEDGEMENT
The author is grateful to an anonymous reviewer for providing valuable comments and suggestions, which substantially improved this article. He is also thankful to Prof. Sumeet Gupta of the Indian Institute of Management (IIM) Raipur for editing the manuscript.
NOTE
1 Here, long run is a period during which actual private investment is equal to equilibrium private investment (i.e. the predicted private investment from the cointegrating regression) and short run is a period during which actual private investment deviates (either above or below) from the equilibrium private investment due to various shocks and unexpected changes (For a detailed discussion, see Enders, 1995, p. 366). The time span that distinguishes long run from short run can be calculated from the speed of adjustment which can vary across markets. It is argued that “how long is the long run depends on the speed of adjustment of the particular markets considered... the analysis of short-run dynamics is very important because that is where we get estimates of speeds of adjustment. For financial markets with rapid speed of adjustment, the long run is indeed short” (Madala & Kim, 1998, p. 236). The estimate of the speed of adjustment in our investment function varies between 0.49 and 0.65 across all specifications (discussed later). This implies that around 49 to 65 per cent of the disequilibrium of the previous year’s shock—called the equilibrium error—gets corrected in the current year. Hence, the entire disequilibrium/deviation gets adjusted completely between two and three years and the actual private investment returns to equilibrium private investment. Therefore, short run can be thought of as around two to three years and the long run can be thought of as around four to five years.