Abstract
Executive Summary
The economic backdrop of most nations remains dominated by family businesses. Family control is common in publicly traded Indian companies. Such controlling families often hold large shareholdings and for the most part have representation at the top management level as well as on the board. Consequently, an overarching question that emerges is whether and how family ownership, management, and governance affect corporate performance.
This article attempts to discern the relationship between family involvement in business (FIB) and financial performance (FP) of companies included in the S&P BSE 500 Index during the period 2006–2010. In addition, an attempt has been made to examine the difference in accounting and market measures of FP for family companies (FCs) vis-à-vis non-family companies (NFCs). A two-way fixed-effects panel model was used to examine the FIB–FP relationship with fixed effects being dummy variables for each year of the sample and dummy variables for each two-digit National Industrial Classification (NIC) code. Finally, to test for the ‘reverse causation’ between FIB and FP, the instrumental-variable—two-stage least-squares (IV-2SLS) regression was applied.
The results confirm that FCs are a predominant form over a number of industries in a large sample, S&P BSE 500 Index. In addition, founding families are often involved in the actual management of the companies. Controlling for company-specific, industry affiliation, and corporate governance variables, the cross-sectional longitudinal analyses show that FIB is associated with superior FP. Furthermore, FP is higher for FCs vis-à-vis NFCs. Based on the market performance measure, FC appear to be better performers with higher outside board representations. On further analysis of the profile of independent directors, it was observed that they had a diverse background and expertise. The impact of firm size and unaffiliated blockholdings on FP was found to be significantly negative. Finally, the estimates from the IV-2SLS were found to be consistent with the preliminary results that FIB is associated with better FP.
This article joins the evolving concurrence on the diversity and heterogeneity of family businesses by differentiating between family-owned, family-managed, and family-governed companies. It distinguishes itself from previous studies on the subject, as it uses different typologies based on the extent of FIB as well as presents multiple theoretical perspectives rather than a mono-theoretical view to empirical findings in the present study. Keeping this distinction in perspective is imperative for family business researchers, practitioners, and policymakers.
Keywords
The public company model has long been considered the optimal paradigm for larger firms in terms of value creation and efficient allocation of resources (Berle & Means, 1932; Fama & Jensen, 1983). Nevertheless, both theoretical and empirical evidence show that widely held companies, controlled by professional managers, constitute an exception rather than a norm. Recent studies have demonstrated that among the world’s listed companies, a high percentage of corporate stock is concentrated in the hands of only one or a few owners, who are most commonly the members of a family (Claessens, Djankov, Fan, & Lang, 2002; Faccio & Lang, 2002; La Porta, Lopez-De-Silanes, & Shleifer, 1999). In today’s global economic system, family firms are generally acknowledged as the pervading players in both industrialized and developing countries. 1
According to IFERA (2003), the figures for various countries are: USA (95%), Italy (93%), Cyprus (80%), Finland (80%), Greece (80%), Sweden (79%), Australia (75 %), Spain (75%), the Netherlands (74%), Belgium (70%), Portugal (70%), the United Kingdom (70%), France (60%), and Germany (60%). Amongst Asian countries, India, with 67% share of family businesses, ranks first, followed by Philippines (66%), Thailand (66%), Singapore (63%), Malaysia (62%), Indonesia (61%), Hong Kong (62%), South Korea (58%), Taiwan (35%), and China (13%), as reported by Credit Suisse (2011).
Beginning with the seminal work of Becker (1981), economists have viewed families as entities that provide and organize multiple activities. Families take decisions that maximize the welfare of the family. However, the joint maximization of family and business objectives often entails gains in one aspect at the expense of the other. A large part of the debate has, therefore, focused on the study of the relationships between family ownership/control/management and firm performance (e.g., Anderson & Reeb, 2003; Barontini & Caprio, 2006; Sraer & Thesmar, 2007; Villalonga & Amit, 2006). An understanding of variations among families and their involvement in business, and how such variations affect and, in turn, are affected by the survival, growth and performance of family enterprises is imperative (e.g., Colli, 2012; James, Jennings, & Breitkruz, 2012; Yu, Lumpkin et al., 2012). Based on a comprehensive review of the most-cited articles on family enterprises between 1996 and 2010, De Massis et al. (2012) observed that there is a western skew in our current knowledge about these firms. These authors called for more research on the under-represented areas of Asia, Africa, and Latin America.
Despite an increasing interest in family business issues, little research has been undertaken on those of India’s family firms. In general, there have been a few studies of the Indian business families and family businesses (e.g., Dutta, 1997; Jain, 2005; Parikh, 2001; Piramal, 1998; Ramachandran, 2006; Rastogi & Agrawal, 2010; Sharma & Rao, 2000; Tripathi, 1981, 1984, 2004; Veliyath, 2004). Furthermore, empirical studies on Indian family businesses and performance are scant (Akbar, 2008; Chittoor & Das, 2007; Singh, 2008). The effect of insider ownership on the corporate performance and governance has been an upcoming topic of research, as in India, owners are de facto promoters as well as managers (e.g., Khanna & Palepu, 1999; Pattanayak, 2008; Phani et al., 2004; Sarkar & Sarkar, 2003, 2009; Selarka, 2005). Lately, Saravanan (2009), Pandey, Taylor, and Joshi (2011), as well as Swamy (2012) have explored differences between family and non-family controlled firms with regards to performance and corporate governance characteristics. Although the evidence is sometimes mixed, there are indicators from the literature that having family involvement in firm ownership and management may significantly reduce certain costs, potentially enhancing firm performance. However, much remains to be done. The field’s theoretical foundation and system of classification need additional development.
This article attempts to discern the relationship between family involvement in business (FIB) and financial performance (FP) of companies included in the S&P BSE 500 Index during the period 2006–2010. It aims to contribute to the existing literature in three ways. First, as prior research provides only limited guidance on how to define and ascertain family business, the study uses four alternative definitions to identify FIB. 2
The current study has used a very restrictive operational definition of family business in the Indian context.
THEORETICAL FOUNDATIONS
Theoretical research on family business has concentrated on applying mainstream theories of the firm to explain how family firms may be different from non-family firms and their impact on FP. Researchers using the strategic management approach have begun to rely on two theoretical frameworks: the resource-based view (RBV) of the firm and the agency theory (Chrisman, Chua, & Sharma, 2005). The RBV approach has the potential to help identify the resources and capabilities that make family firms unique and allow them to develop family-based competitive advantages. Owing to close matching of owners’ and managers’ motivations and little information asymmetry, the popular perception of a family firm negates agency problems (Westhead & Howorth, 2006). While agency problems can arise in transactions between any two groups of stakeholders, researchers applying agency theory to family firms have concentrated primarily on relationships between owners and managers, and secondarily between majority and minority shareholders (Chrisman, Chua, & Sharma, 2005). The heterogeneity among firms within a particular industry and the success factors of the outperforming firms are the focus of these two research streams.
Other researchers propose that family business could be accurately described by stewardship theory as an alternative perspective that can usefully complement the agency framework in explaining entrepreneurial, organizationally centred behaviour (Corbetta & Salvato, 2004a; Naldi et al., 2007). Consistent with the stewardship theory, many business leaders and managers behave as stewards and follow a righteous path aimed at obtaining beneficial results for the whole organization (Davis, Schoorman, & Donaldson, 1997; Donaldson, 1990; Donaldson & Davis, 1991; Miller, Le Breton-Miller, & Scholnick, 2008; Zahra, 2003, 2010). Stewardship theory is potentially apt to address family business dynamics and explain differences in organizational performance (Eddleston et al., 2010; Eddleston & Kellermanns, 2007).
LITERATURE REVIEW AND HYPOTHESES
Family Business Definition
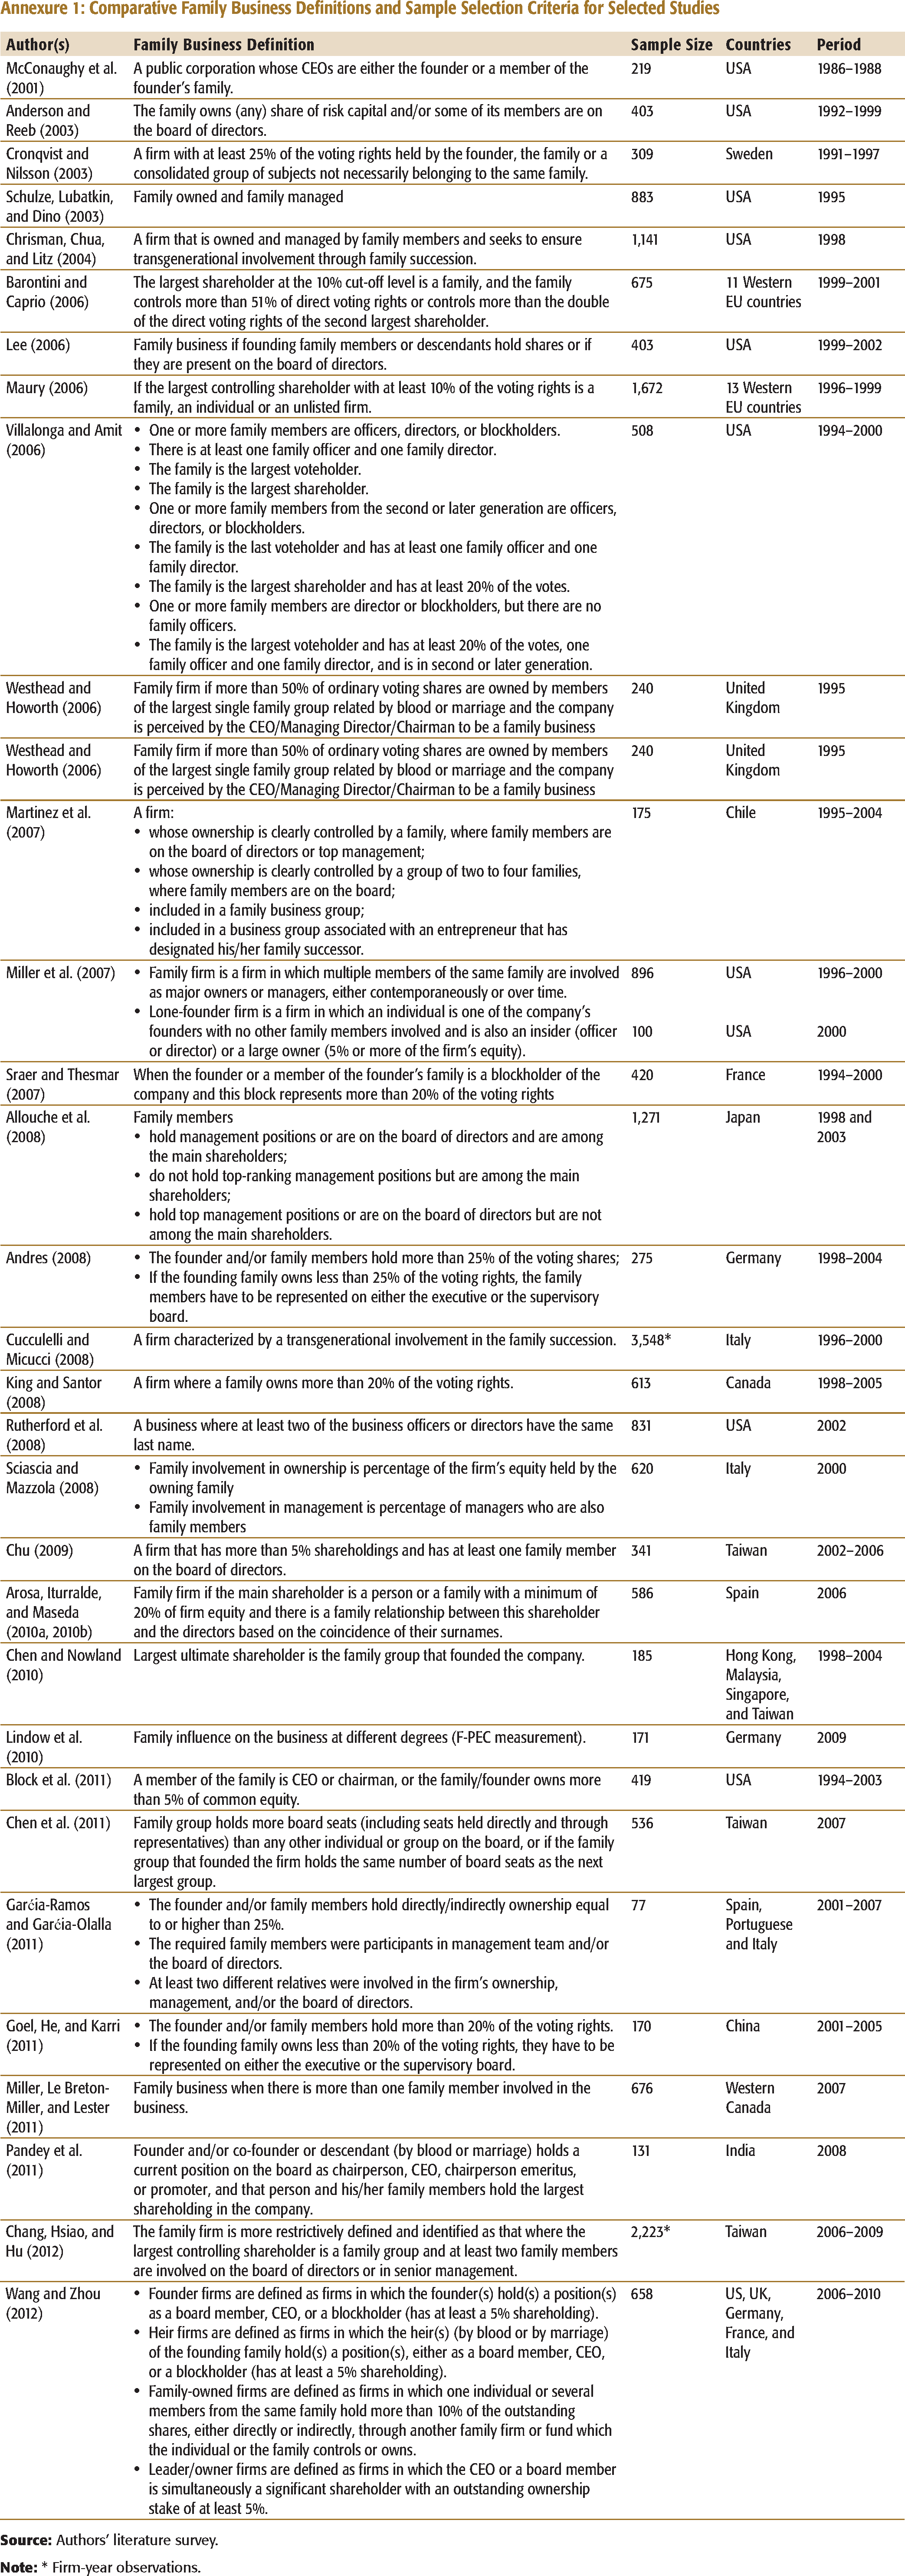
Although many years have gone by since the scientific community recognized defining the family firm as the first and most obvious challenge facing family business researchers, this question is still open (Handler, 1989). In fact, there is no commonly acknowledged definition that integrates the different disciplinary approaches (e.g., Barry, 1989; Bennedsen, Nielsen, Pérez-González, & Wolfenzon, 2007; Chrisman, Chua, & Sharma, 2005; Donckels & Fröhlich, 1991; Donnelly, 1964; Habbershon & Williams, 1999; Lansberg, 1999; Lansberg, Perrow, & Rogolski, 1988; Littunen & Hyrsky, 2000; Litz, 1995; Van den Berghe & Carchon, 2003; Westhead & Howorth, 2006). The rational organization of this research area and the definition of its boundaries and concepts have not been completed yet (Zahra & Sharma, 2004). This is obvious if we compare the manifold definitions used in the reviewed studies, which are given in Annexure 1. In general, a broad definition of family firms used in the United States and other western countries is where the founder or a member of his or her family is an officer, director, or blockholder in the company. In Asia, family firms are generally defined as companies that are part of a family business group or companies where the founding family is the largest shareholder (Claessens, Djankov, & Lang, 2000).
Most authors define family business with reference to the involvement approach, which takes into account the structural and organizational factors of firms (Chrisman, Chua, & Sharma, 2005). This approach is based on the identification of four core dimensions: family ownership, family control, managerial role of family members, and generations involved in the business (Miller & Le Breton-Miller, 2006).
Another approach to defining the family business is the intention-based approach (Chua, Chrisman, & Sharma, 1999; Churchill & Hatten, 1987). This method focuses on the family’s vision of the business, and describes its essentials in terms of the purpose of the family in maintaining control, its corporate behaviour and vision for transgenerational value creation, and the idiosyncratic resources derived from its involvement in the business (Chrisman, Chua, & Litz, 2003; Zellweger & Astrachan, 2008; Zellweger, Nason, & Nordqvist, 2011). However, this approach is seldom used in studies applied specifically to the evaluation of FP (Westhead & Howorth, 2006).
A third definition approach, which combines some elements of both the involvement and the intention-based approaches, applies the Family Influence on Power, Experience, and Culture (F-PEC)
Family Involvement in Business and Financial Performance
Studies of listed companies generally report that family ownership and control are positively and significantly related to accounting performance but have a less statistically robust association with market performance (e.g., Allouche, Amann et al., 2008; Amran & Ahmad, 2009a, Amran 2009b, 2010; Anderson & Reeb, 2003; Andres, 2007; Barontini & Caprio, 2006; Bertrand, et al., 2008; Chu, 2009; Corstjens, Maxwell, & Heyden, 2004; Kim, 2006; Lee, 2004, 2006; Martinez, Stohr, & Quiroga, 2007; Maury, 2006; Miller, Le Breton-Miller, Lester, & Cannella, 2007; Pandey et al., 2011; Singh & Gaur, 2009; Sraer & Thesmar, 2007; Villalonga & Amit, 2006). Block, Jaskiewicz, and Miller (2011) established a particularly positive impact in the context of young and large-sized family firms. However, these results could be partly biased by the different definitions of family business employed in a single analysis. No robust evidence was found, for example, to confirm superior FP for family firms due to ownership (Lerkkasemsan, 2006; Saravanan, 2009; Yeh, Lee, & Woidtke, 2001). Miller et al. (2007) verified that only lone-founder firms were significantly better performers. According to Yeh (2005), corporate value conspicuously decreased if the largest shareholders enhanced their voting right. Jara-Bertin, Lopez-Iturriaga, and Lopez-de-Foronda (2008) established that firms in which the largest shareholder was a family, a second family shareholder reduced firm value. Other studies reported that the presence of second large shareholder enhanced performance (Andres, 2008; Lehmann & Weigand, 2000; Sacristan-Navarro, Gómez-Ansón, & Cabeza-Garcia, 2011). In line with the argument of Berle and Means (1932), ownership concentration will align the interests between principal and agent, and mitigate the amount of agency costs. The desire of protection of family name and long-term focus are characteristics of family stewards. Based on what precedes, the following hypothesis can be formulated:
The role of family members in the firm’s management and their impact on performance present complex and mixed results. As regards accounting performance, listed family firms perform better when a family member serves as a CEO (founder or descendant). The presence of a hired CEO is largely non-significant (e.g., Anderson & Reeb, 2003; Andres, 2008; Barontini & Caprio, 2006; Chen, Gray, & Nowland, 2011; He, 2011; Maury, 2006; Sraer & Thesmar, 2007). Founding-family-controlled firms are better performers in terms of value and operating efficiency (Cronqvist & Nilsson, 2003). Gonzàlez et al. (2012) observed that family firms exhibited better FP on average when the founder was involved in operations, although this effect decreased with firm size. According to Navarro and Anśon (2006), Spanish companies managed by heirs showed lower levels of accounting performance than others. Similar results were also reported by Pandey et al. (2011) in a study of 131 listed BSE companies. Moving on to market performance, studies established that firms managed by family CEOs significantly underperformed (Bennedsen et al., 2007; Bloom & Van Reenen, 2007; Chittoor & Das, 2007; Lauterbach & Vaninsky, 1999; Morck, Stangeland, & Yeung, 2000; Pérez-González, 2006). Peng and Jiang (2006) found mixed results in an analysis of large, publicly listed corporations across eight East and Southeast Asian countries. The presence of descendants in active roles turned out to be non-significant (Anderson & Reeb, 2003; Andres, 2008; Maury, 2006) or even to have a negative impact (Villalonga & Amit, 2006) on performance. The role of outsiders is again controversial, as it showed either a positive (Anderson & Reeb, 2003) or a null (e.g., Andres, 2008; Barontini & Caprio, 2006; Sacristan-Navarro et al., 2011; Villalonga & Amit, 2006) relationship with market performance.
Conforming to Jensen and Meckling (1976), the involvement of family in management will most likely generate better performance since an alignment of managers’ and shareholders’ incentives is automatically produced. Furthermore, it is expected that there will be a positive relation between the founder CEO and firm performance as proposed by Villalonga and Amit (2006). Accordingly, the hypotheses can be specified as follows:
With respect to family representation on the board of directors, Anderson and Reeb (2003, 2004) found that some family influence on the board provided benefits to minority shareholders but too much influence created potential for moral hazard conflicts. Other studies confirmed these results, with Yeh and Woidtke (2005) observing that a higher proportion of family-affiliated board members was associated with weaker firm performance. On the contrary, family members sitting on the board as non-executive directors seemed to have a positive and significant influence on all kinds of performance (Barontini & Caprio, 2006; Lee, 2006) or at best no impact at all (Block, Jaskiewicz, & Miller, 2011; Maury, 2006). Furthermore, the performance seemed to be better in firms where the founding family was active, either in the executive or the supervisory board (Andres, 2007; Villalonga & Amit, 2006). Other family business studies on the effectiveness of boards of directors frequently focused on their composition (e.g., Baysinger & Hoskisson, 1990; Fama & Jensen, 1983) with smaller boards being considered as more desirable (e.g., Amran, 2011; Amran & Ahmad, 2010; Corbetta & Salvato, 2004b; Garćia-Ramos & Garćia-Olalla, 2011). With regards to the value of outsiders as members of boards of family businesses, there are inconclusive empirical researches with some studies supporting their inclusion because of their objectivity, impartial views, and professional competencies (Corbetta & Salvato, 2004b; Finkelstein & Hambrick, 1996; Garćia-Ramos & Garćia-Olalla, 2011; Johannisson & Huse, 2000; Voordeckers, Van Gils, & Van den Heuvel, 2007; Ward & Handy, 1988) while others refuting it on the grounds of uncooperative interaction between families and directors (Caselli, Giuli, & Gatti, 2008; Chen & Nowland, 2010; Ford, 1988; Klein, Shapiro, & Young, 2005; Westphal, 1998, 1999). A stream of literature supports the conjecture that inside members promote the effectiveness of the family business board of directors due to knowledge of the firm and its environment, access to the firm, as well as authority and definable interest (Ford, 1988; Jonovic, 1989). This leads to the following hypothesis:
From a theoretical point of view, it is possible to find an isolated, independent effect of any single component of FIB on FP. The review of extant literature (e.g., Basco & Perez-Rodriguez, 2009, 2011; Braun & Sharma, 2007; Lindow, Stubner, & Wulf, 2010; Miller et al., 2007; Villalonga & Amit, 2006), however, puts forth the possibility that the components of family involvement (ownership, management, and governance) act in a complementary manner, and, therefore, the relationship between the components of FIB and FP is likely to be critically affected by these complementarities. Integrating the basic components of FIB as the key characteristics distinguishing family business that are likely to influence FP emanates the ensuing hypothesis:
Financial Performance of Family vis-à-vis Non-family Companies
There is sufficient evidence of a better economic performance of family firms compared to non-family firms (e.g., Aguiló & Aguiló, 2012; Allouche et al., 2008; Cassia, De Massis, & Kotlar, 2012; Coleman & Carsky, 1999; Gallo, Ariño, Máñez, & Cappuyns, 2000; Maury, 2006; McConaughy, Matthews, & Fialko, 2001; San Martin-Reyna & Duran-Encalada, 2012; Shyu, 2011). Pieces of evidence from France, Germany, the United Kingdom and the United States over the period (1993–2002) confirm that family firms fare better on both accounting and market performance measures (Corstjens, Peyer, & Heyden, 2006). Their strong support network system, shared family aspirations and values, as well as long-term commitment to the business make them more decisive than non-family firms (Ceja, Agulles, & Tápies, 2010; Daily & Dollinger, 1992). Furthermore, FCs tend to have a wider range of values besides pure pecuniary outcomes. Common examples of such non-pecuniary outcomes are independence, tradition, and continuity (e.g., Anderson & Reeb, 2003; Corbetta & Salvato, 2004a; Sharma, Chrisman, & Chua, 1997; Sorenson, 1999; Ward, 1997). There are findings to the contrary as well, with some authors reporting non-family firms growing faster than family firms (e.g., Birley, 2000; Daily & Dollinger, 1993; Gallo, Tapies, & Cappuyns, 2004; Gomez-Mejia, Nunez-Nickel, & Gutierrez, 2001), while others putting forth no significant difference between the two (Chrisman, Chua, & Litz, 2004; Tanewski, Prajogo, & Sohal, 2003). Extending the proposition that family firms have lower agency costs (Morck, Schleifer, & Vishny, 1988) and bring in unique family resources to provide an advantage in terms of wealth creation (Habbershon & Williams, 1999) suggests the subsequent hypothesis:
Overall, a number of previously published researches confirm the heterogeneity of family enterprises by differentiating between family-controlled, family-managed, and family-governed firms. However, some combinations of involvement of family in business seem to work better than others suggesting a more nuanced understanding of the relationship between FIB and FP. In the Indian context, as discussed, family business research is largely descriptive. As such, there is less empirical research on the performance effects of family involvement in ownership, management, and governance. The results presented in this article have addressed this gap in the literature and extends understanding of FIB–FP link for companies on the S&P BSE 500 Index.
DATA AND METHODOLOGY
Sample Selection and Data Sources
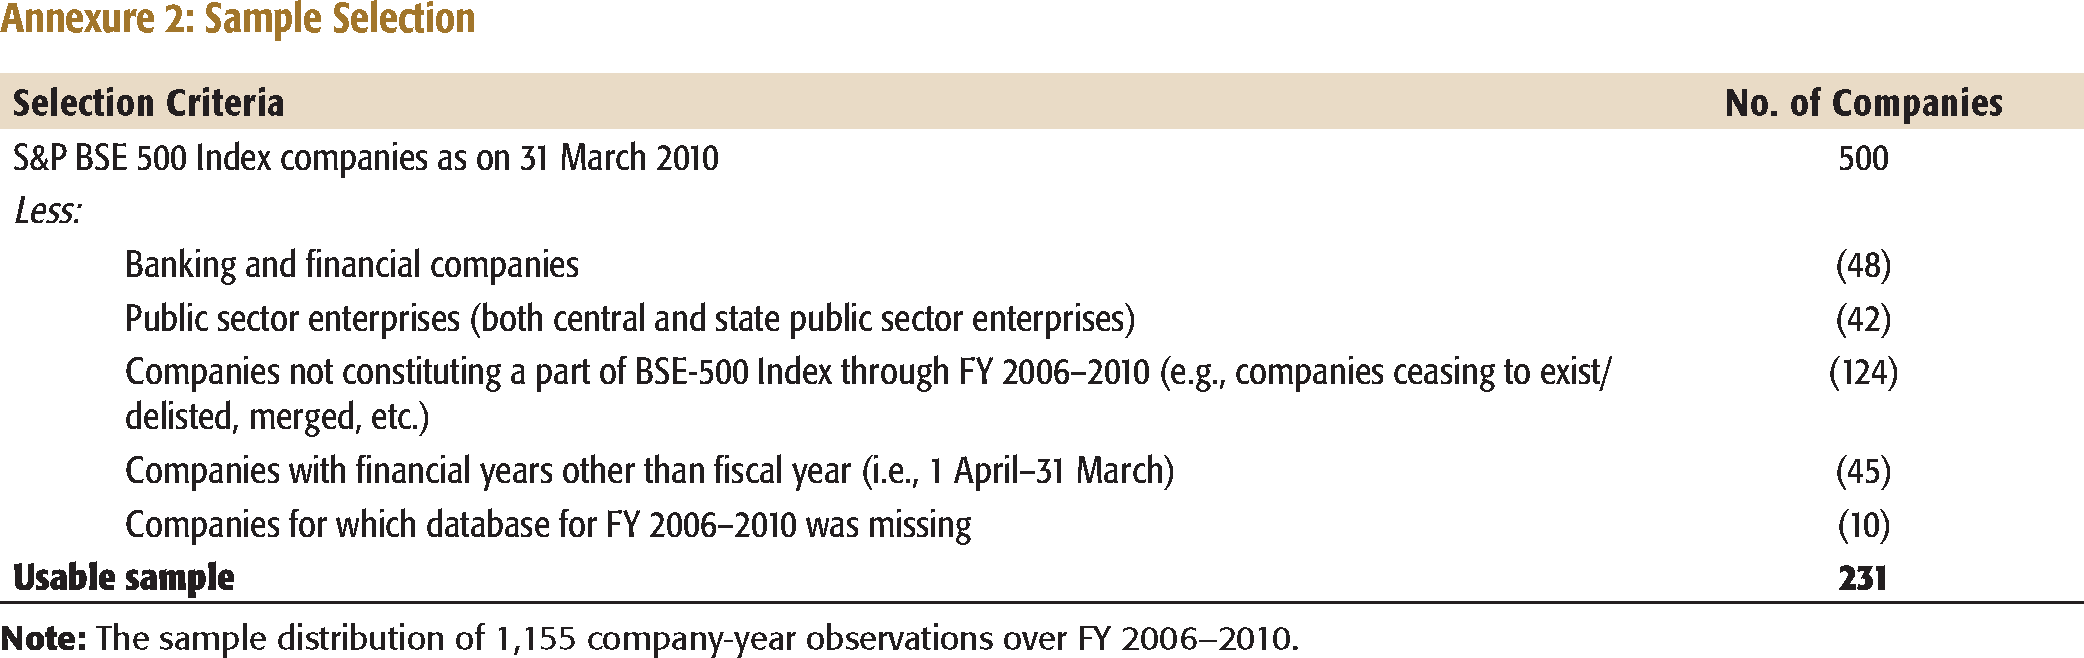
The sample included a subset of companies comprising the S&P BSE 500 Index as of 31 March 2010 for five financial years from 2006 to 2010. 3
The Bombay Stock Exchange Limited (BSE) constructed S&P BSE 500 Index, consisting of 500 scrips with effect from 9 August, 1999. The companies under the Index have been selected on the basis of their market capitalization, volumes of turnover and other fundamental factors. The Index represents nearly 93 per cent of the total market capitalization on BSE and covers all 20 major industries of the economy.
The primary data sources included the annual reports of companies, corporate database (Prowess) maintained by the Centre for Monitoring the Indian Economy (CMIE) and the reports filed by companies with the BSE 4
as part of the listing requirements. Furthermore, information about FIB including corporate histories for each company in the sample was accessed from the individual company website and other related sources.Variable Selection and Description
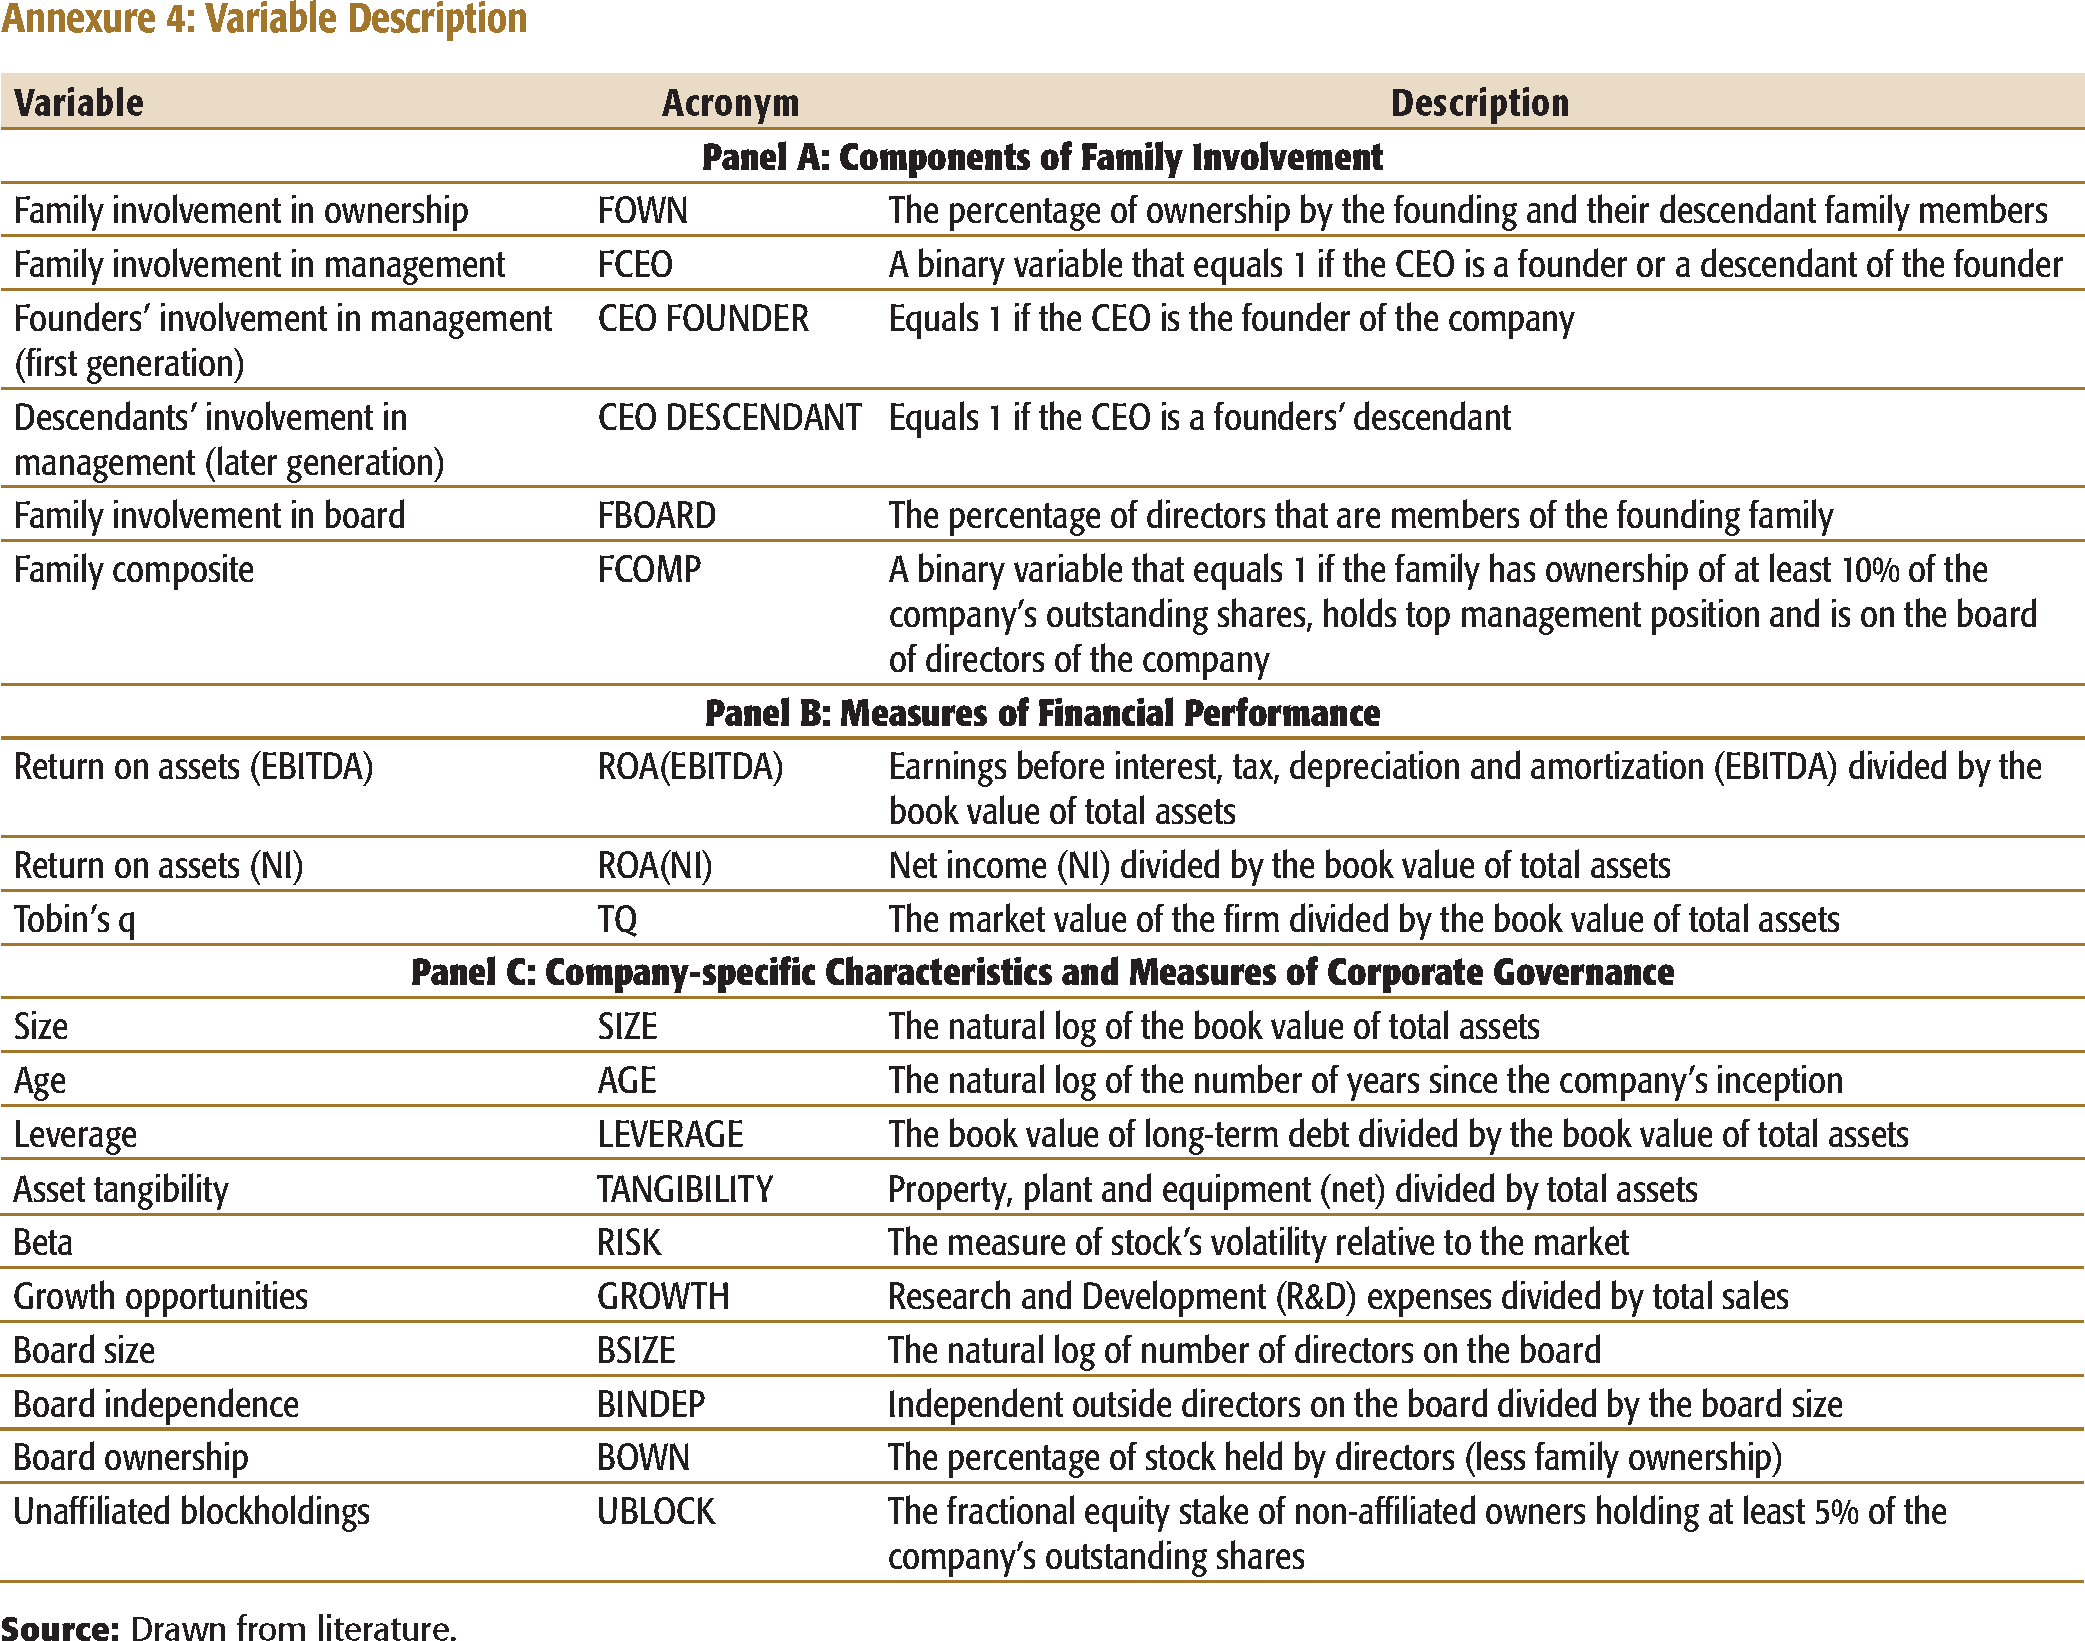
The variables used to investigate the FIB-FP relationship have been discussed in the following.
Measures of the Components of Family Involvement
Various models have been used to comprehend the nature of family and business overlaps (e.g., Gersick, Davis, Hampton, & Lansberg, 1997; Tagiuri & Davis, 1982). Different typologies based on the extent of family involvement in ownership and management of the firm (e.g., Sharma & Nordqvist, 2008) and further involvement in governance and its plans for succession are often added (e.g., Garćia-Castro & Sharma, 2011; Handler, 1989) as integral components that are likely to influence FP. Given the lack of consensus, three factors—ownership, management, and governance—were used to empirically determine the possible combinations between these factors that lead to superior FP. Thus, FIB has been measured as:
Family involvement in ownership (FOWN): It is the percentage of ownership by the founding family and its descendant family members.
5
As proposed by Anderson and Reeb (2003), family ownership denotes fractional equity ownership of the founding family, that is, the founder, his/her immediate family members including descendants, as well as second/third cousins/relatives.
Family involvement in management (FCEO): It implies the family CEO and is a binary variable that equals 1 if the CEO is a founder or a descendant of the founder. To explore the generation of family involvement (i.e., succession) in the company’s management, variables that denote CEOs as founders (CEO Founder) and descendants of founders (CEO Descendant) have also been included.
Family involvement in board (FBOARD): It connotes the percentage of directors that are members of the founding family.
Family composite (FCOMP) variable: It equals 1 if the company satisfies all of the three indicators above and has family ownership percentage of at least 10 per cent of all shares.
The four alternative measures provide a richer picture of the multifaceted nature of FIB. The first three criteria have been used in a number of previous family business studies exploring single components of FIB independently. The fourth measure is relatively new and it best captures the configuration of three components of FIB, especially in the Indian context wherein most of the publicly listed companies were once family businesses. 6
The founding family composite measure was first defined by Mishra, Randøy, and Jenssen (2001) in their study of 120 Norwegian firms as 1 if the firm satisfied at least 1 of the 3 indicators, namely, the presence of founding family in ownership (at least 10% of all shares), management, and board.
Financial Performance and Control Variables
Management literature recognizes two distinct dimensions of FP. Accounting-based measures reveal historical operation-oriented information, while market-based measures reflect anticipatory market-oriented information (Keats, 1988). According to Shook et al. (2004), since accounting profitability and market performance have little empirical overlap, it is imperative to use multiple indicators to improve the quality of construct measurement. Accordingly, the present study considers both return on assets (ROAs) and Tobin’s q (TQ) as the primary FP measures. ROA is a well-understood and common measure used in several family business studies (Mazzi, 2011; Zattoni, Gnan, & Huse, 2012). ROA is computed in two ways. First, as earnings before interest, tax, depreciation, and amortization (EBITDA) divided by the book value of total assets to represent operating returns. Second, as net income (NI) scaled by the book value of total assets as an indicator of how efficient the management is at using its assets to generate earnings. According to Anderson and Reeb (2003), both EBITDA and NI measures of ROA give a complete measure of profit on the company’s total assets. The market measure is an approximation of TQ and is defined as the ratio of the market value of the firm to the book value of total assets, where the market value is measured by the sum of the market value of equity and the book value of total liabilities (Chung & Pruitt, 1994; Perfect & Wiles, 1994). This measure has been used extensively in similar studies by, for example, Morck et al. (1988), McConnell and Servaes (1990), Yermack (1996), McConaughy et al. (1998), and Khanna and Palepu (2000).
The control variables used in this study were derived through a review of prior literature, whereby a set of 18 company-specific and corporate governance variables were initially identified. The exploratory principal component analysis with varimax rotation was conducted to identify fewer yet meaningful variables. 7
The criterion of minimum salient loading of variables on components has been considered. Accordingly, the minimum absolute magnitude of 0.50 for component’s loadings is taken for the rotated factors. The Kaiser–Meyer–Olkin (KMO) measure of sampling adequacy has been used to gauge the appropriateness of factor analysis approach. The decision for the extraction and retention of significant components has been taken by keeping in view the statistical criterion of latent roots, greater than or equal to unity, as recommended by Guttman (1940), Kaiser (1958), and Bentler (1968). The Bartlett’s multivariate test of sphericity (1950, 1951) revealed that the correlation matrix R obtained was positive definite. Furthermore, the predictor variables under investigation did not suffer from serious degree of multicollinerarity.
The examination is based on industries with five or more companies and where FCs have more than 50 per cent of the companies in the industry.
According to Cohen (1988), the value of adjusted R2 indicates a medium relationship between outcome and the predictor variables.
The three sets of variables, namely, company specific, corporate governance, and industry effect that were controlled for are as follows: 10
10. This per cent differential has been calculated as: Return = coefficient estimate divided by the average measure of FP; for example, for ROA (NI), the differential is calculated as 0.419/0.8369 = 50.06 per cent. Similar analysis has been repeated using TQ as a market performance metric.
The company-specific variables included:
Size (SIZE)—the natural log of the book value of total assets.
Age (AGE)—measured as the natural log of the number of years since the company’s inception. Leverage (LEVERAGE)—computed by dividing long-term debt by total assets. Asset tangibility (TANGIBILITY)—equals the ratio of property, plant and equipment (net) over total assets. Beta (RISK)—the measure of stock’s volatility relative to the market. Growth (GROWTH) opportunities—measured as the ratio of research and development (R&D) expenses to total sales. Proxies for various governance devices were:
Board size (BSIZE)—the natural log of number of directors on the board. Board independence (BINDEP)—the percentage of independent outside directors on the board. Board ownership (BOWN)—the percentage of stock held by the directors (less family ownership). Unaffiliated blockholdings (UBLOCK)—equals the fractional equity stake of non-affiliated owners holding at least 5 per cent of the company’s outstanding shares. Dummy variables were included to denote each two-digit NIC code (NICDUM).
The detailed definitions and acronyms of the variables used in the study are summarized in Annexure 4.
Data Analyses
Multivariate analyses to examine the FIB–FP relationship included a two-way fixed-effects panel model. To decide between pooled OLS regression and fixed effect model, the Redundant Fixed Effects Tests—Likelihood Ratio test was employed. The statistic values and the associated p-values strongly rejected the null hypothesis that the fixed effects were redundant indicating the presence of strong cross-section and period effects. Therefore, the pooled OLS model was found to be unsuitable for the present analysis. Furthermore, to determine whether the fixed-effect or random-effect model is appropriate, the Hausman specification test was invoked. The P value of chi-square was significant (p = 0.000), and, therefore, the fixed-effect model was accepted. The fixed effects were dummy variables for each year of the sample and dummy variables for each two-digit NIC code. The robust regression method of moments (MM) estimators were applied to deal with the presence of outliers. Furthermore, serial correlation and heteroskedasticity were controlled by using the Huber/White/Sandwich Estimator (clustered) for variance to the fixed-effect model. The regression equation employed for the multivariate analysis is in the form:
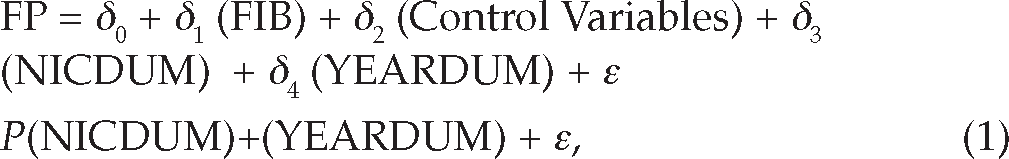
where,
FP= ROA (EBITDA), ROA(NI), and TQ;
FIB = the percentage of ownership by the founding family (FOWN), a binary variable that equals 1 if the CEO is a founder or a descendant of the founder (FCEO), the percentage of directors that are members of the founding family (FBOARD), and composite variable that equals 1 if the company satisfies all of the three indicators and has ownership percentage of at least 10 per cent of all shares (FCOMP).
Control Variables = SIZE, AGE, LEVERAGE, TANGIBILITY, RISK, GROWTH, BSIZE, BINDEP, BOWN, and UBLOCK;
NICDUM = 1 for each two-digit NIC code in the sample;
YEARDUM = 1 for each year of the sample period.
The present analysis potentially suffers from an endogeneity problem; specifically, the issue is whether FIB improves FP or strong FP prompts FIB. To the extent that FIB is potentially a function of superior FP, the study followed Himmelberg, Hubbard, and Palia (1999) and used instrumental-variable regressions, that is, two-stage least squares (IV-2SLS) to estimate the relation between FIB and FP. The model for IV-2SLS is specified as:

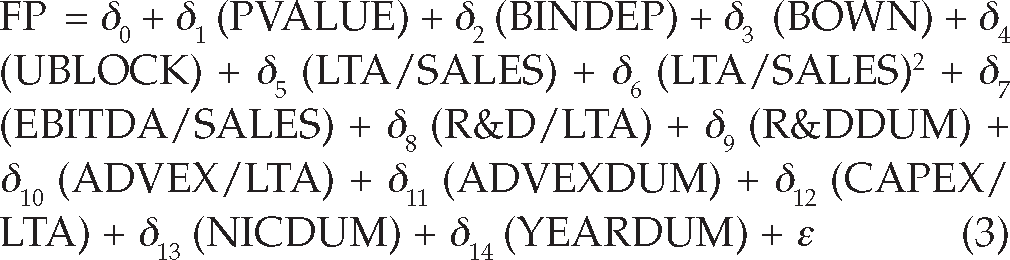
where,
FP, SIZE, RISK
P value = the predicted value of regressing FCOMP on the SIZE, SIZE2, and RISK;
LTA/SALES = long-term assets divided by net sales;
EBITDA/SALES = EBITDA divided by net sales;
R&D/LTA = R&D expenses divided by long-term assets;
R&DDUM = 1 when the company does not report R&D expenses;
ADVEX/LTA = advertising expense divided by long-term assets;
ADVEXDUM = 1 when the company does not report advertising expenses;
CAPEX/LTA = capital expenditures divided by long-term assets.
The software packages, SPSS (version 20), EViews (version 7), and STATA (version 12) were used to carry out the data analysis in the present study.
Descriptive Statistics
Descriptive Data for the Sample Companies
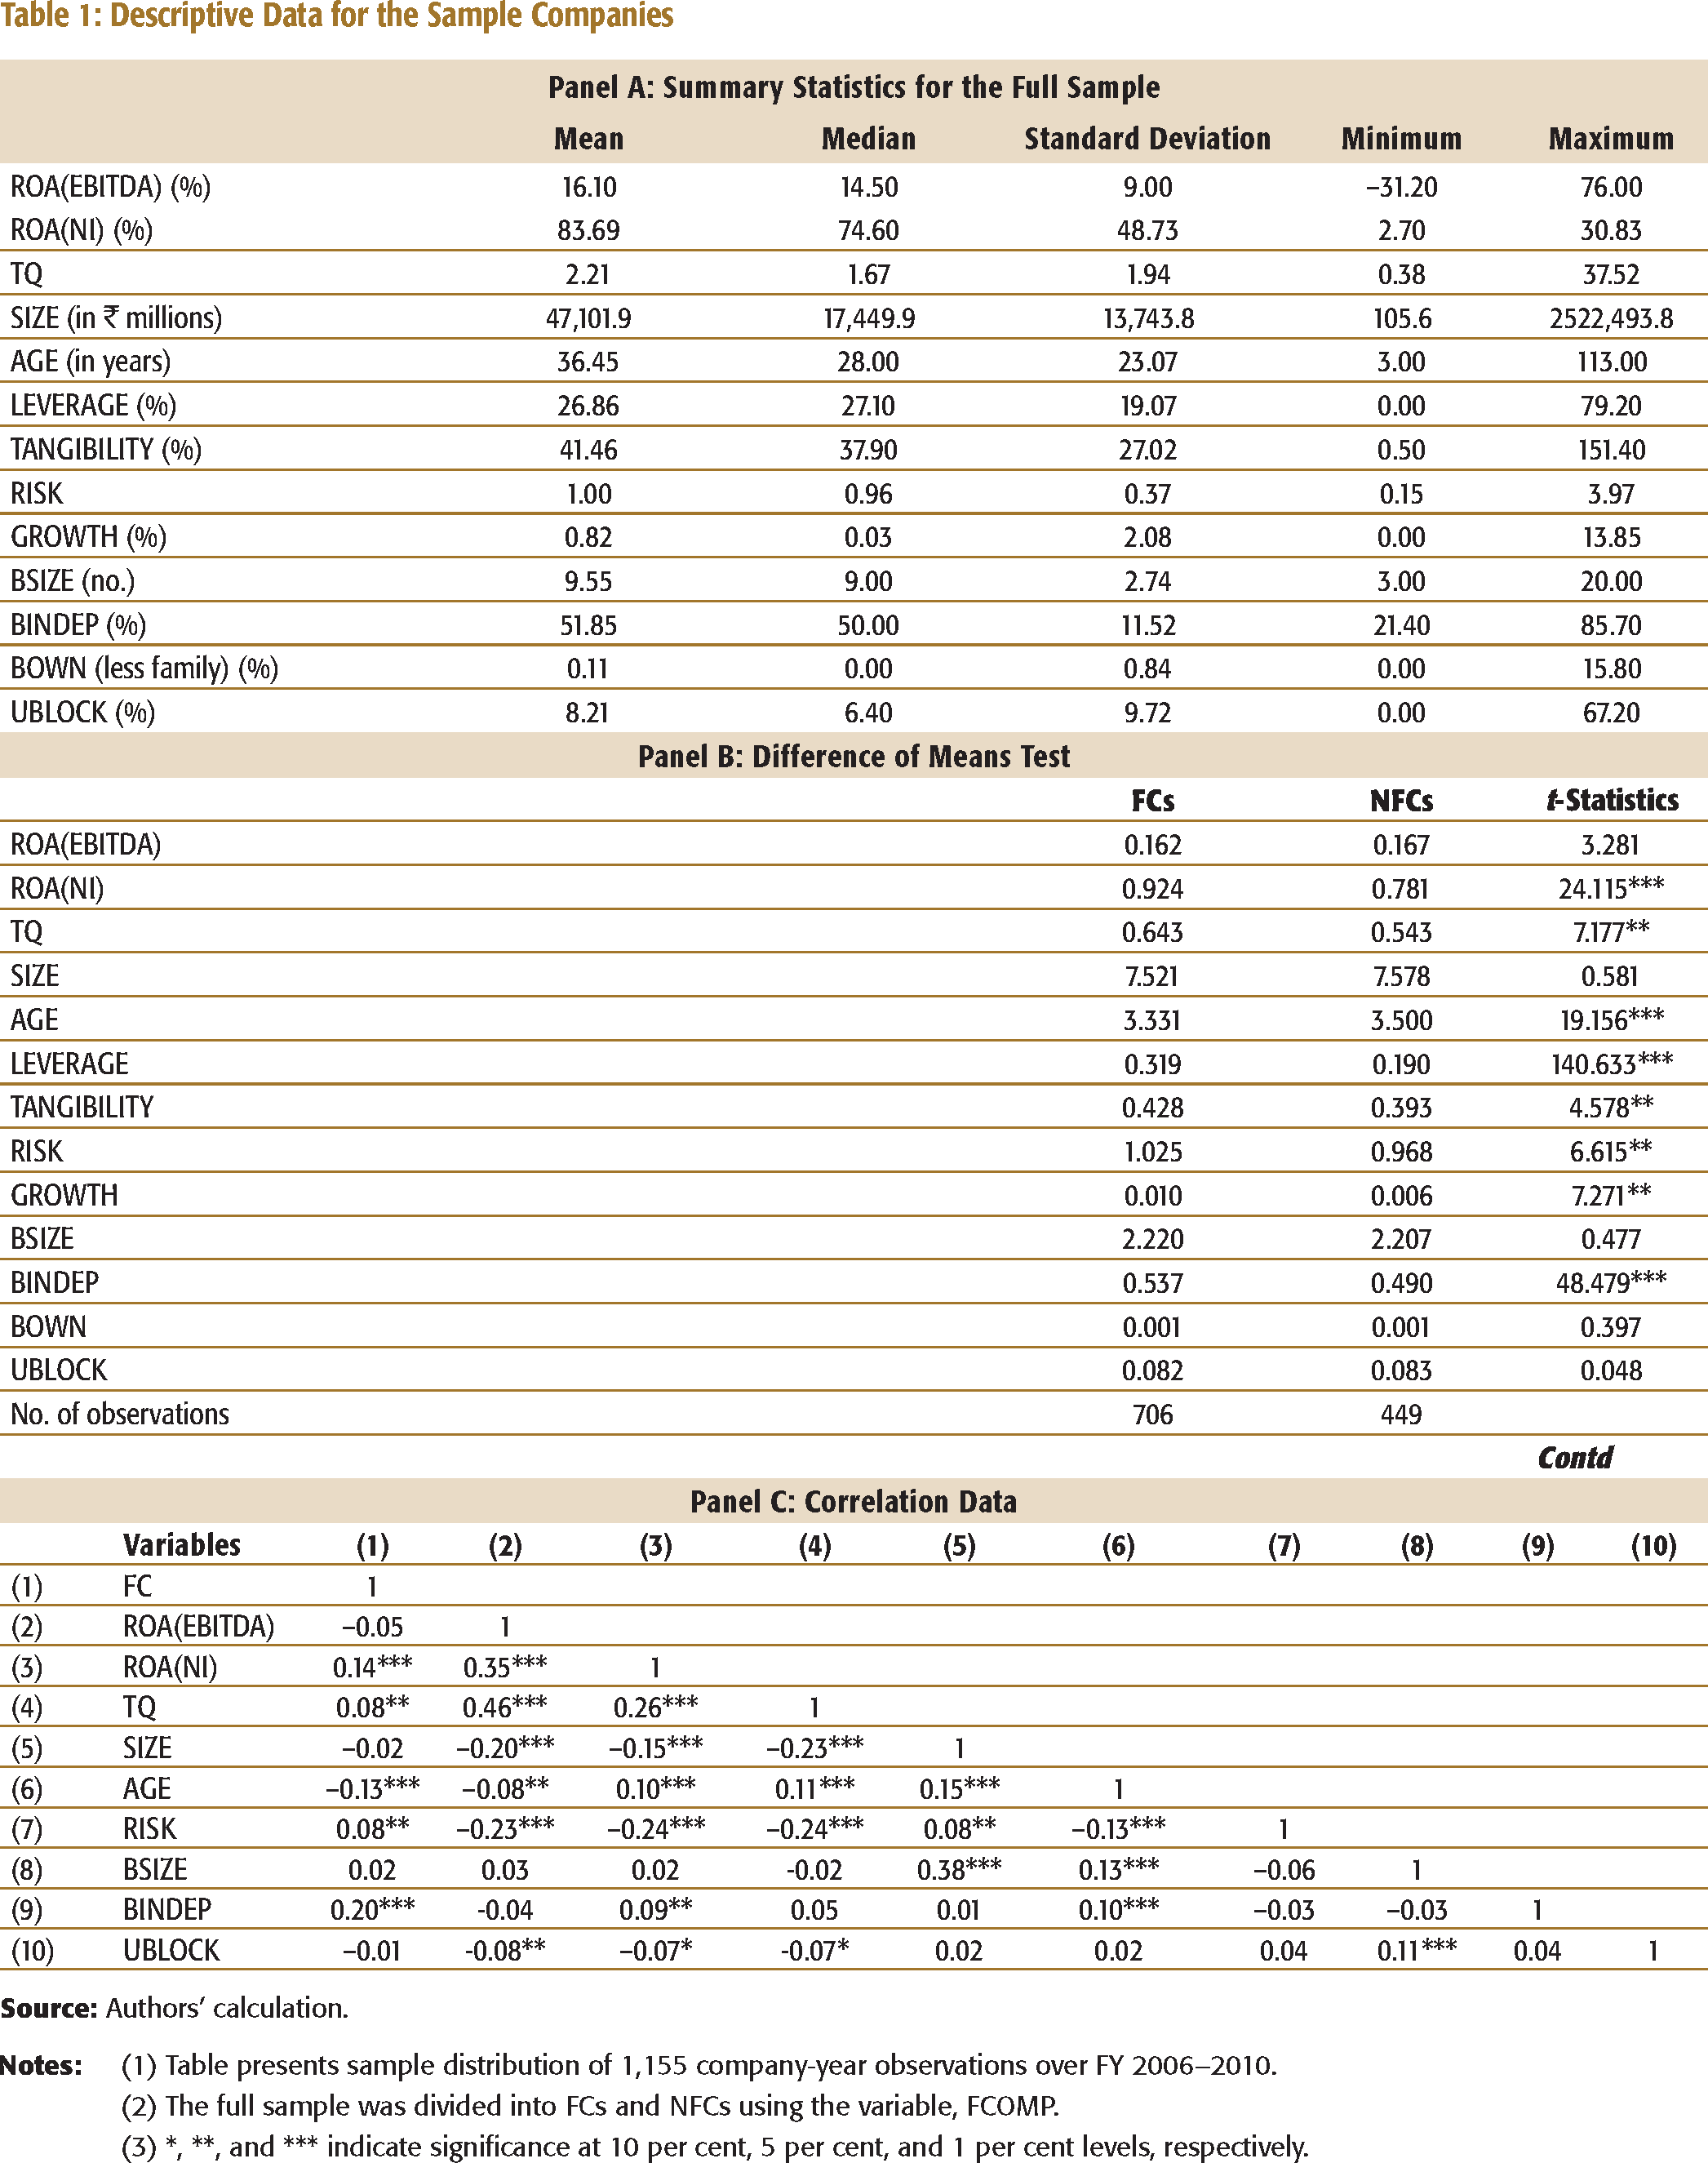
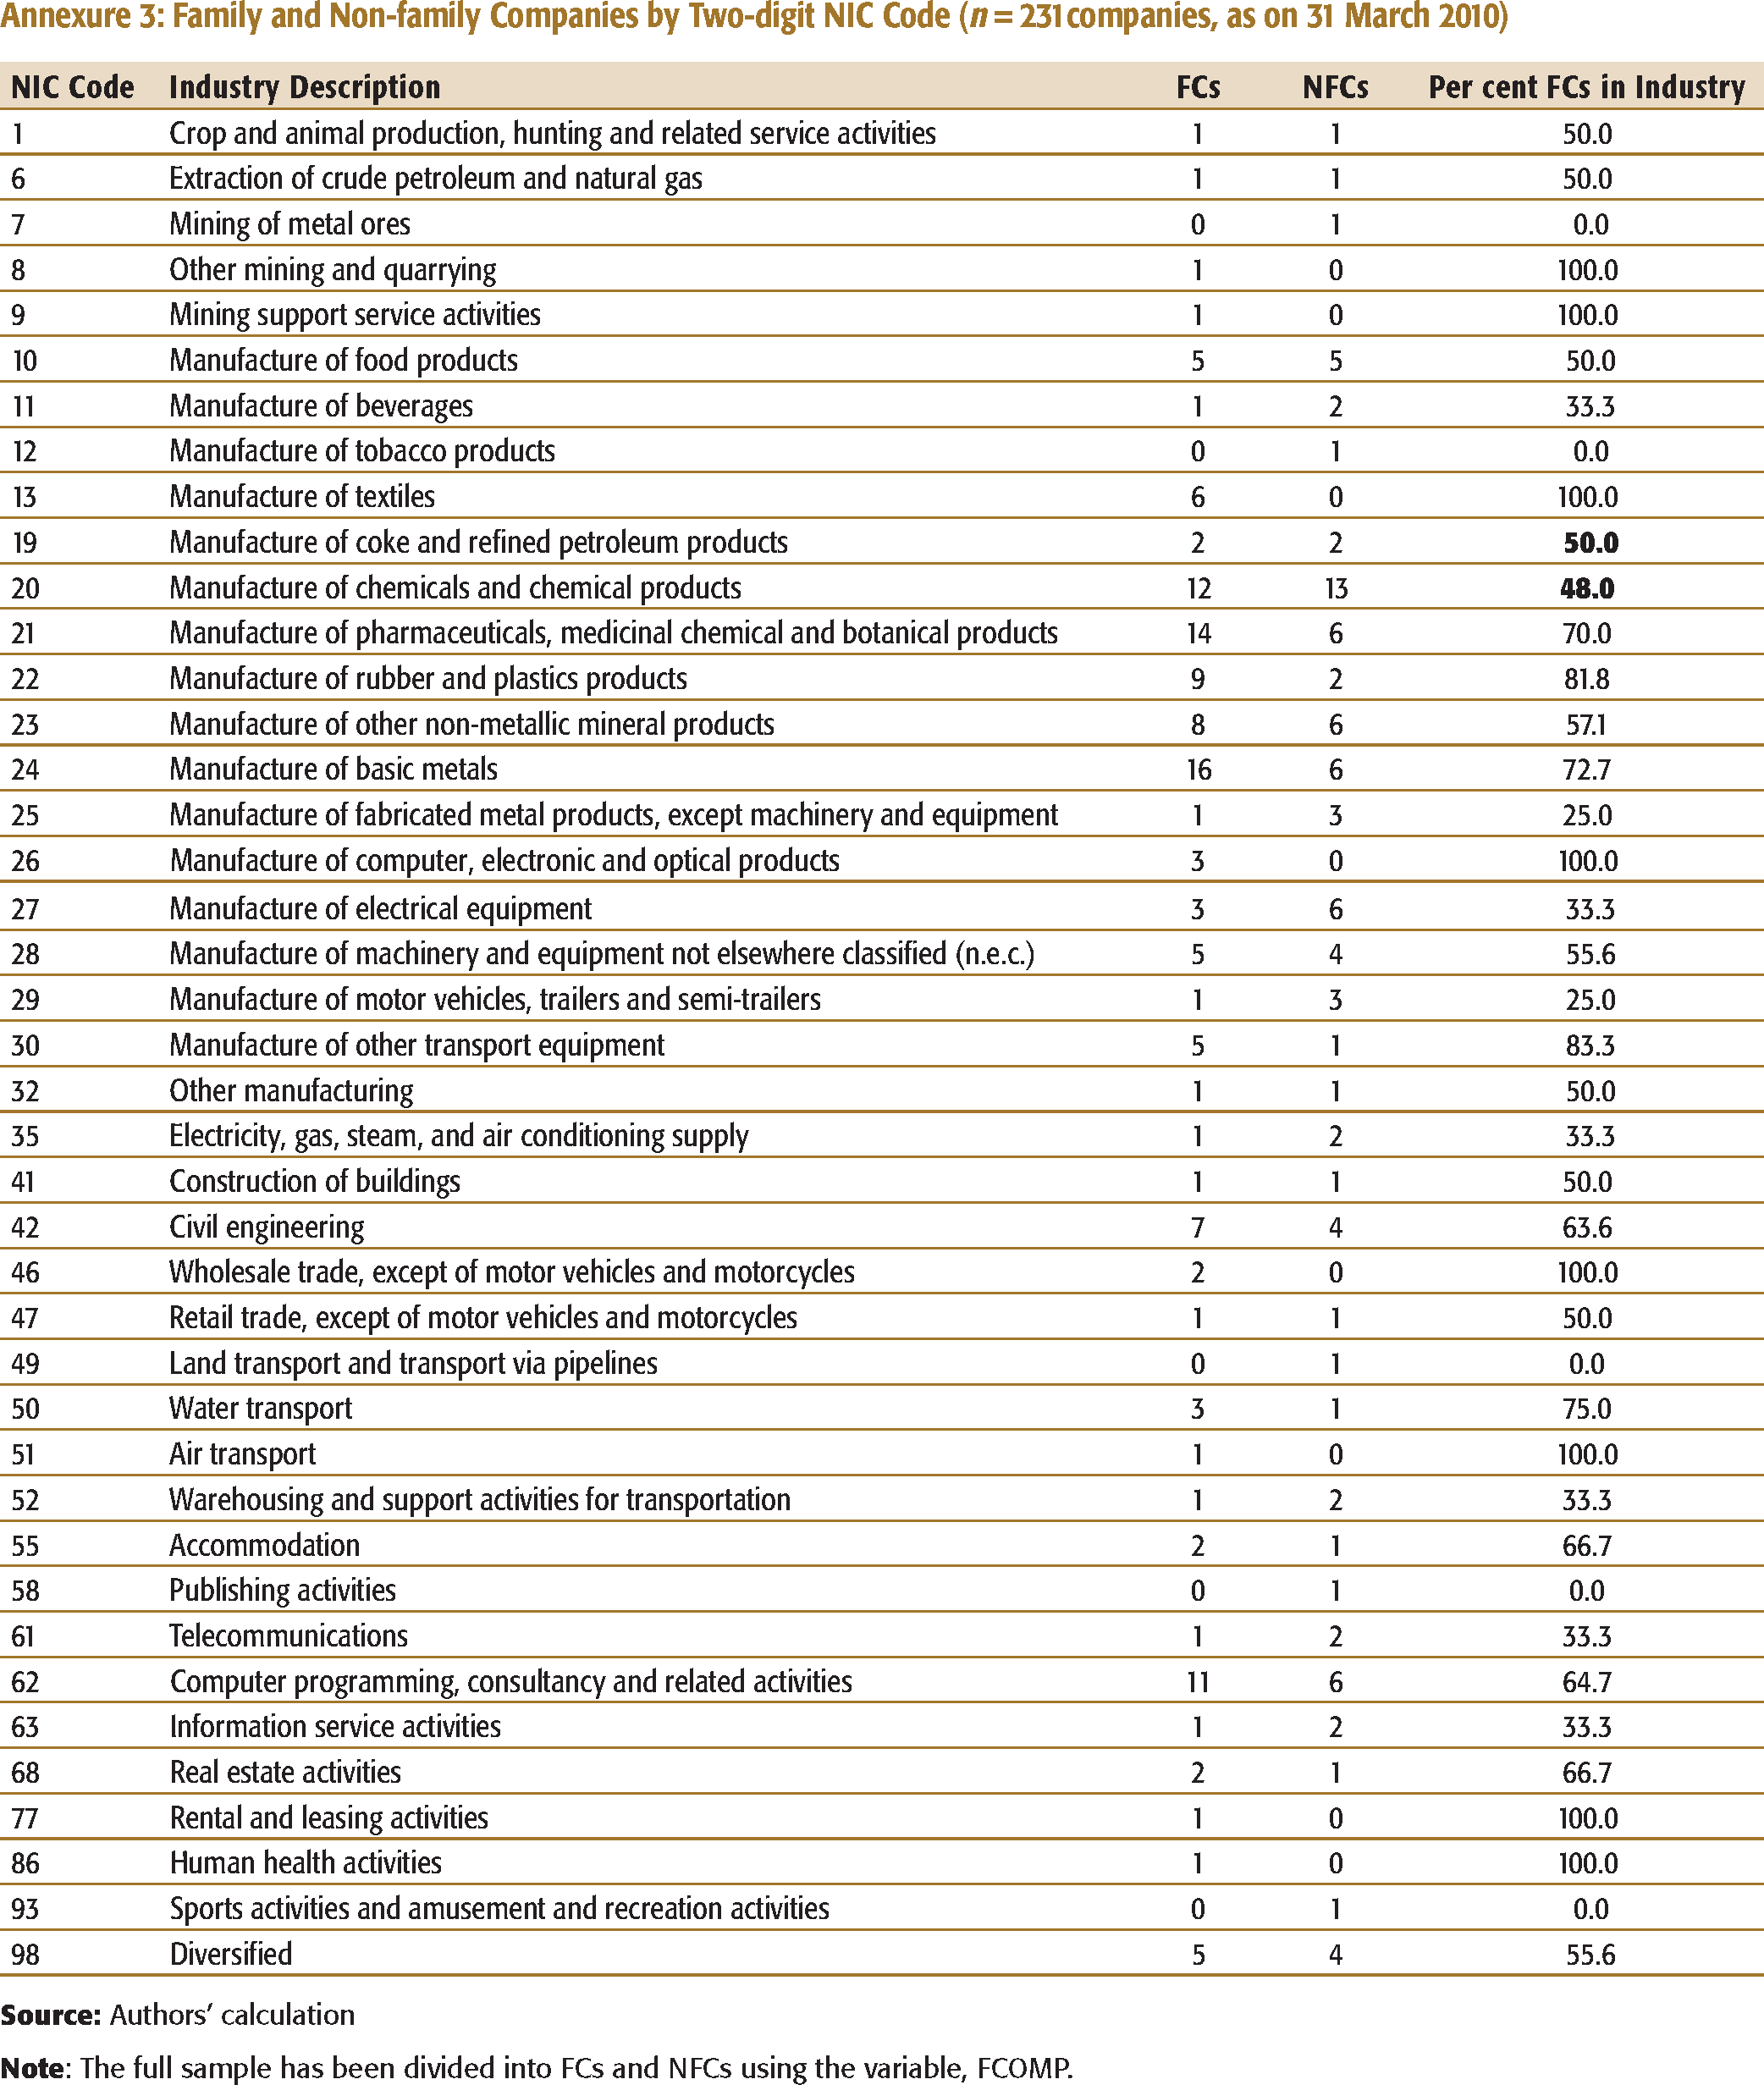
(2) The full sample was divided into FCs and NFCs using the variable, FCOMP.
(3) *, **, and *** indicate significance at 10 per cent, 5 per cent, and 1 per cent levels, respectively.
EMPIRICAL RESULTS AND DISCUSSION
Financial Performance and Family Involvement in Business
Table 2 highlights the impact of FIB measures on accounting metrics of FP using the fixed-effect regression analysis for the full sample (columns 1–4) along with FCs (column 5) and NFCs (column 6). Time period and two-digit NIC code dummies, together with company-specific characteristics and corporate governance attributes, have also been included in the analysis. Results for the first four regressions show positive but insignificant effect of FIB on ROA (EBITDA). Added, three variables with significant negative coefficients are SIZE, LEVERAGE, and UBLOCK. For FCs, LEVERAGE (b = –0.130; p < 0.01) and UBLOCK (b = –0.138; p < 0.01) bear a significant and negative relation to ROA (EBITDA). On the other hand, BOWN (b = 0.387; p < 0.05) has a significantly positive impact, implying that the accounting performance increases with the percentage of stock held by the directors (less family ownership). The adjusted R2 = 16.8 per cent.8 The results on NFCs (adjusted R2 = 15.5 per cent) show that SIZE (b = –0.051; p < 0.05), LEVERAGE (b = –0.184; p < 0.01), and GROWTH (b = –2.051; p < 0.01) have a significant negative influence on ROA (EBITDA). None of the governance attributes enter the equation significantly. An analogous analysis for the second accounting measure shows a positive and significant effect of FBOARD (b = 0.419; p < 0.10) with adjusted R2 = 26.80 per cent. FP of family-run companies is 50 per cent more than that of the non-family ones.10 Similar to earlier results for the first four regressions, SIZE, LEVERAGE, and UBLOCK enter the equation significantly but with a negative sign. However, TANGIBILITY and BINDEP show a significantly positive relationship. A standalone analysis of FCs for ROA (NI) replicate the findings of ROA (EBITDA) with adjusted R2 = 26.1 per cent. However, for NFCs, SIZE, GROWTH, and UBLOCK have a significant negative relation with ROA (NI).
The relation between FIB and market performance has been tested next (cf. Table 3). Each measure of FIB is positive on TQ; however, significant coefficients exist for FCEO (b = 0.267; p < 0.10) and FCOMP (b = 0.193; p < 0.10). The result is also suggestive of the fact that TQ is about 12 per cent (FCEO) and 9 per cent (FCOMP) higher for FCs vis-à-vis NFCs. Concerning the control variables, it can be observed that TQ is at a significant level negatively related to SIZE, TANGIBILITY, and UBLOCK, at the same time as positively related to BOWN for all the four regressions. A stand-alone FCs (column 5) and NFCs (column 6) analysis indicates a significant negative coefficient for SIZE. Furthermore, for FCs (adjusted R2 = 48.6%), a significant negative coefficient is reported for TANGIBILITY (b = –0.516; p < 0.10) and UBLOCK (b = –0.525; p < 0.10), while a positive one was identified for AGE (b = 1.223; p < 0.05). On the other hand, results for NFCs (adjusted R2 = 52.6%) show significant positive coefficients for BOWN (b = 3.664; p < 0.05), indicating the influence of board ownership on performance.
Accounting Measures of Performance and Family Involvement in Business
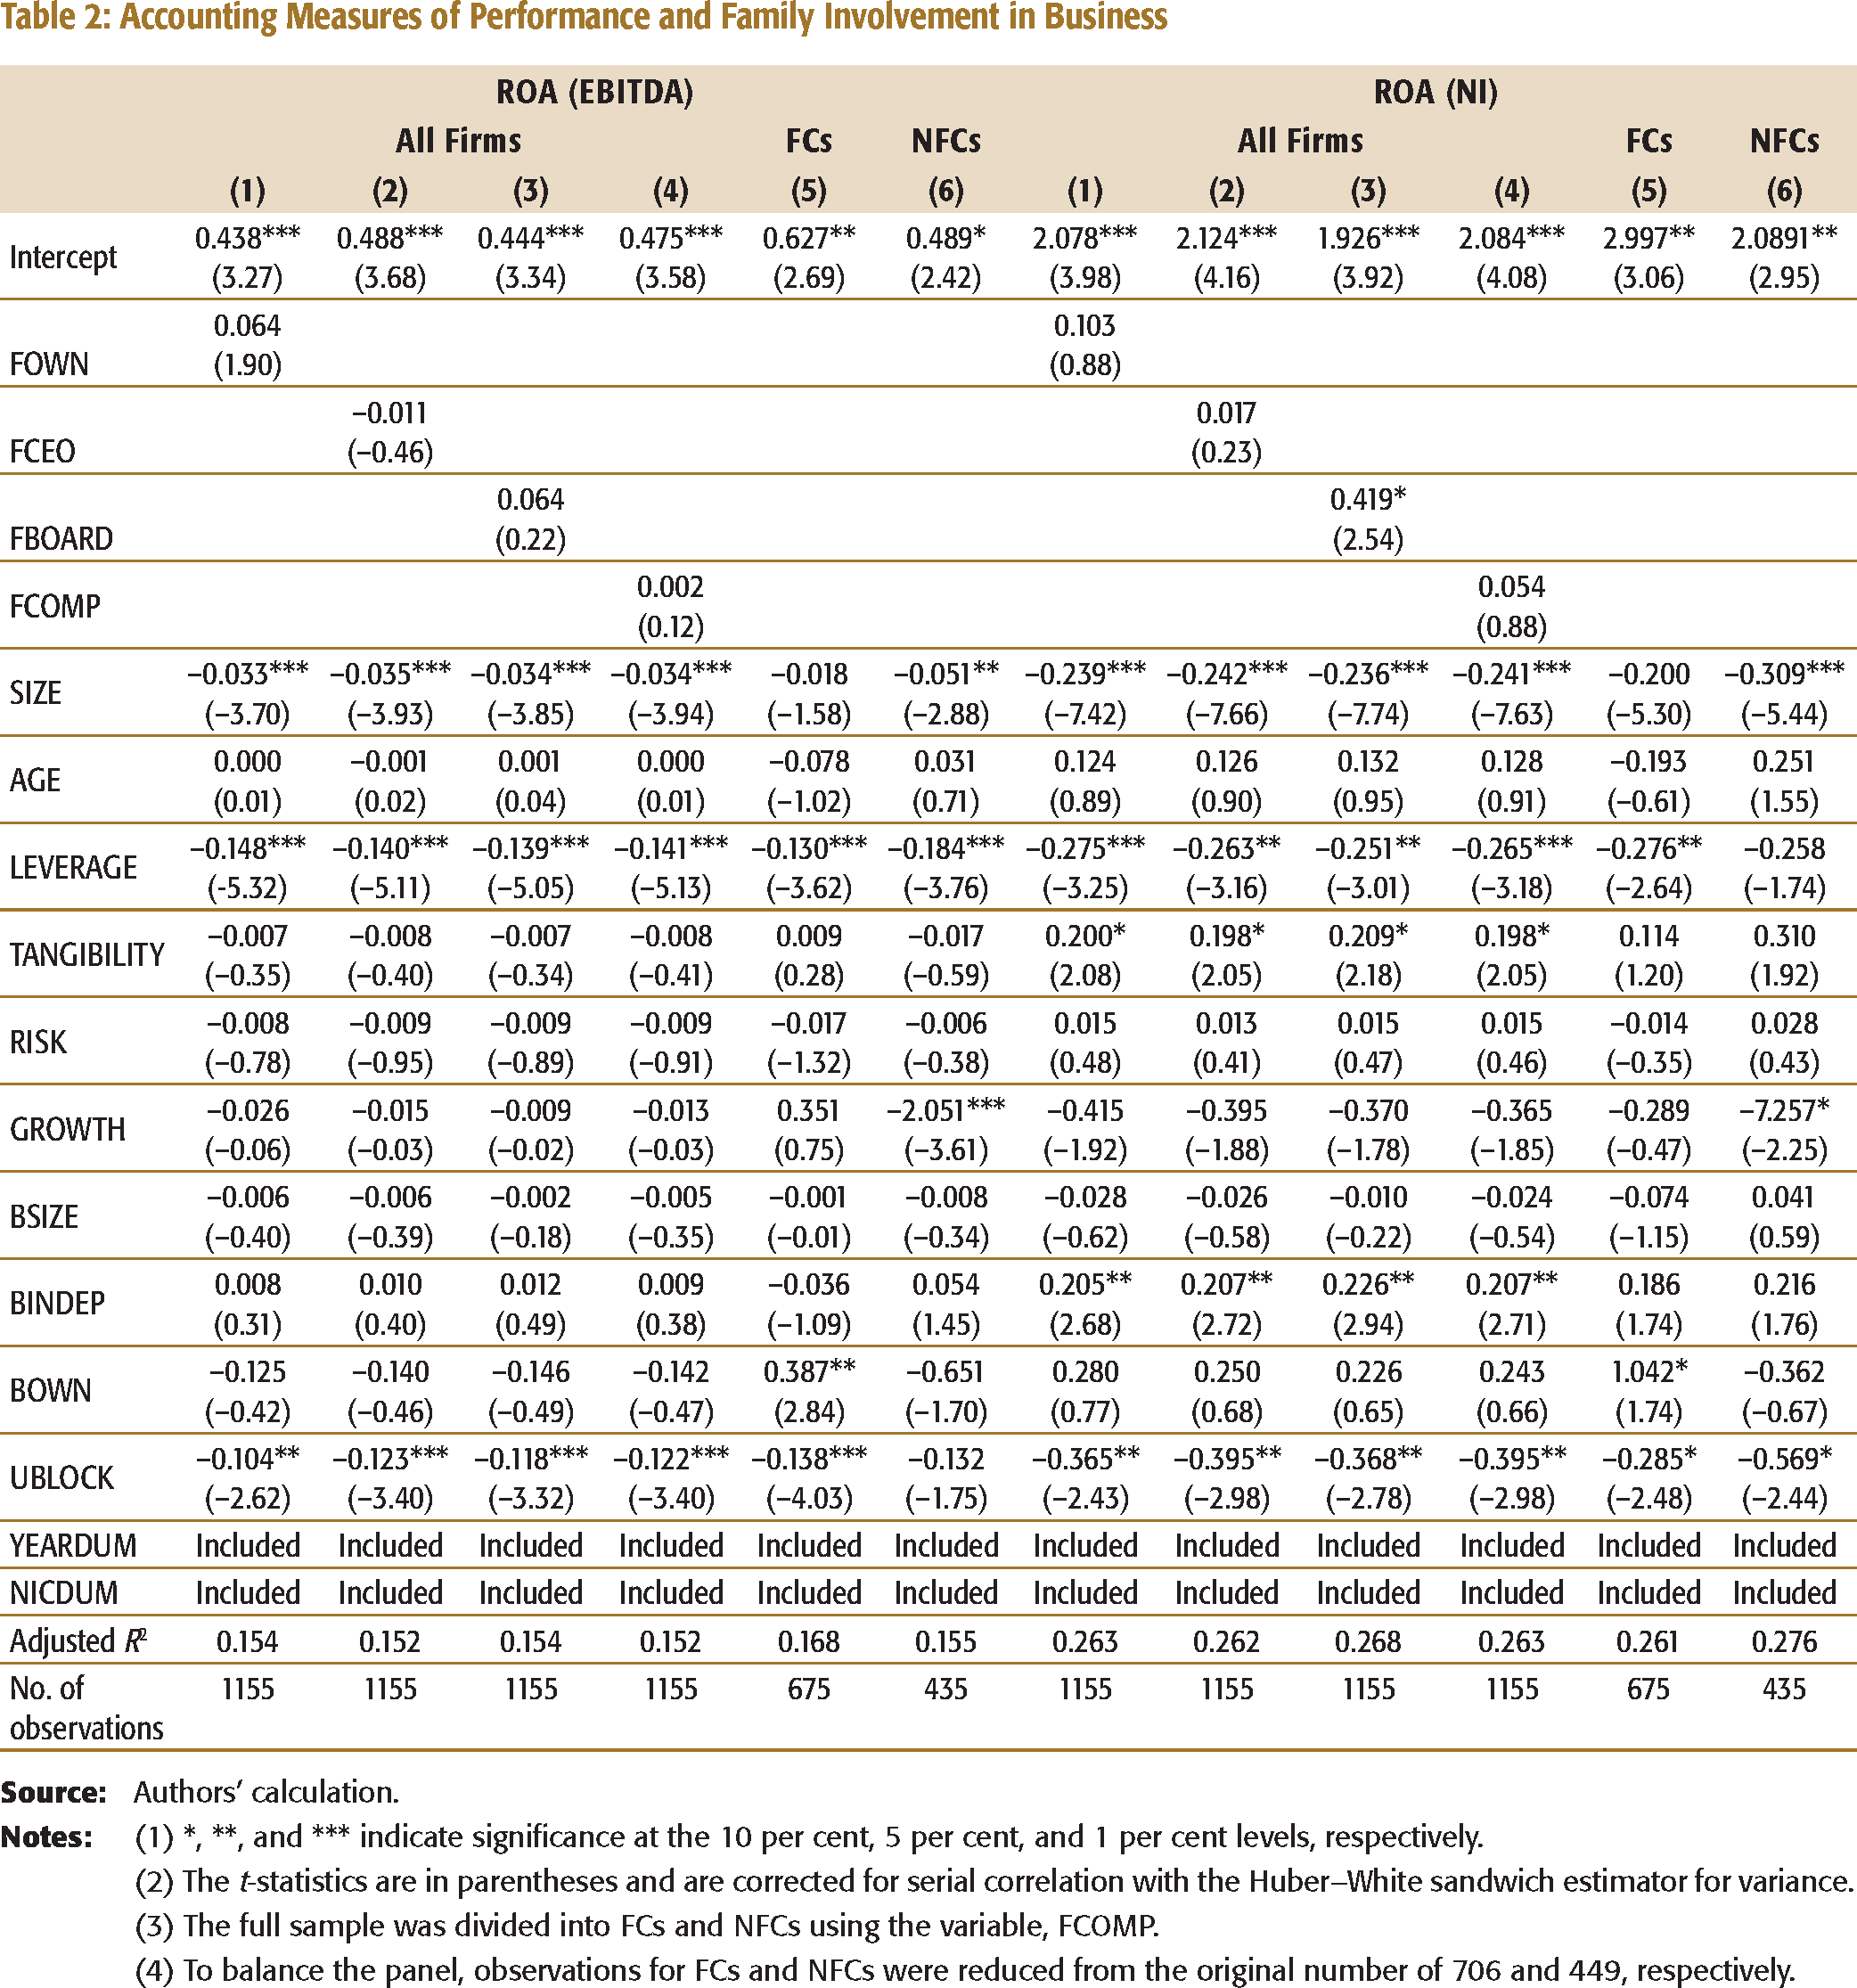
(2) The t-statistics are in parentheses and are corrected for serial correlation with the Huber–White sandwich estimator for variance.
(3) The full sample was divided into FCs and NFCs using the variable, FCOMP.
(4) To balance the panel, observations for FCs and NFCs were reduced from the original number of 706 and 449, respectively.
Market Measures of Performance and Family Involvement in Business
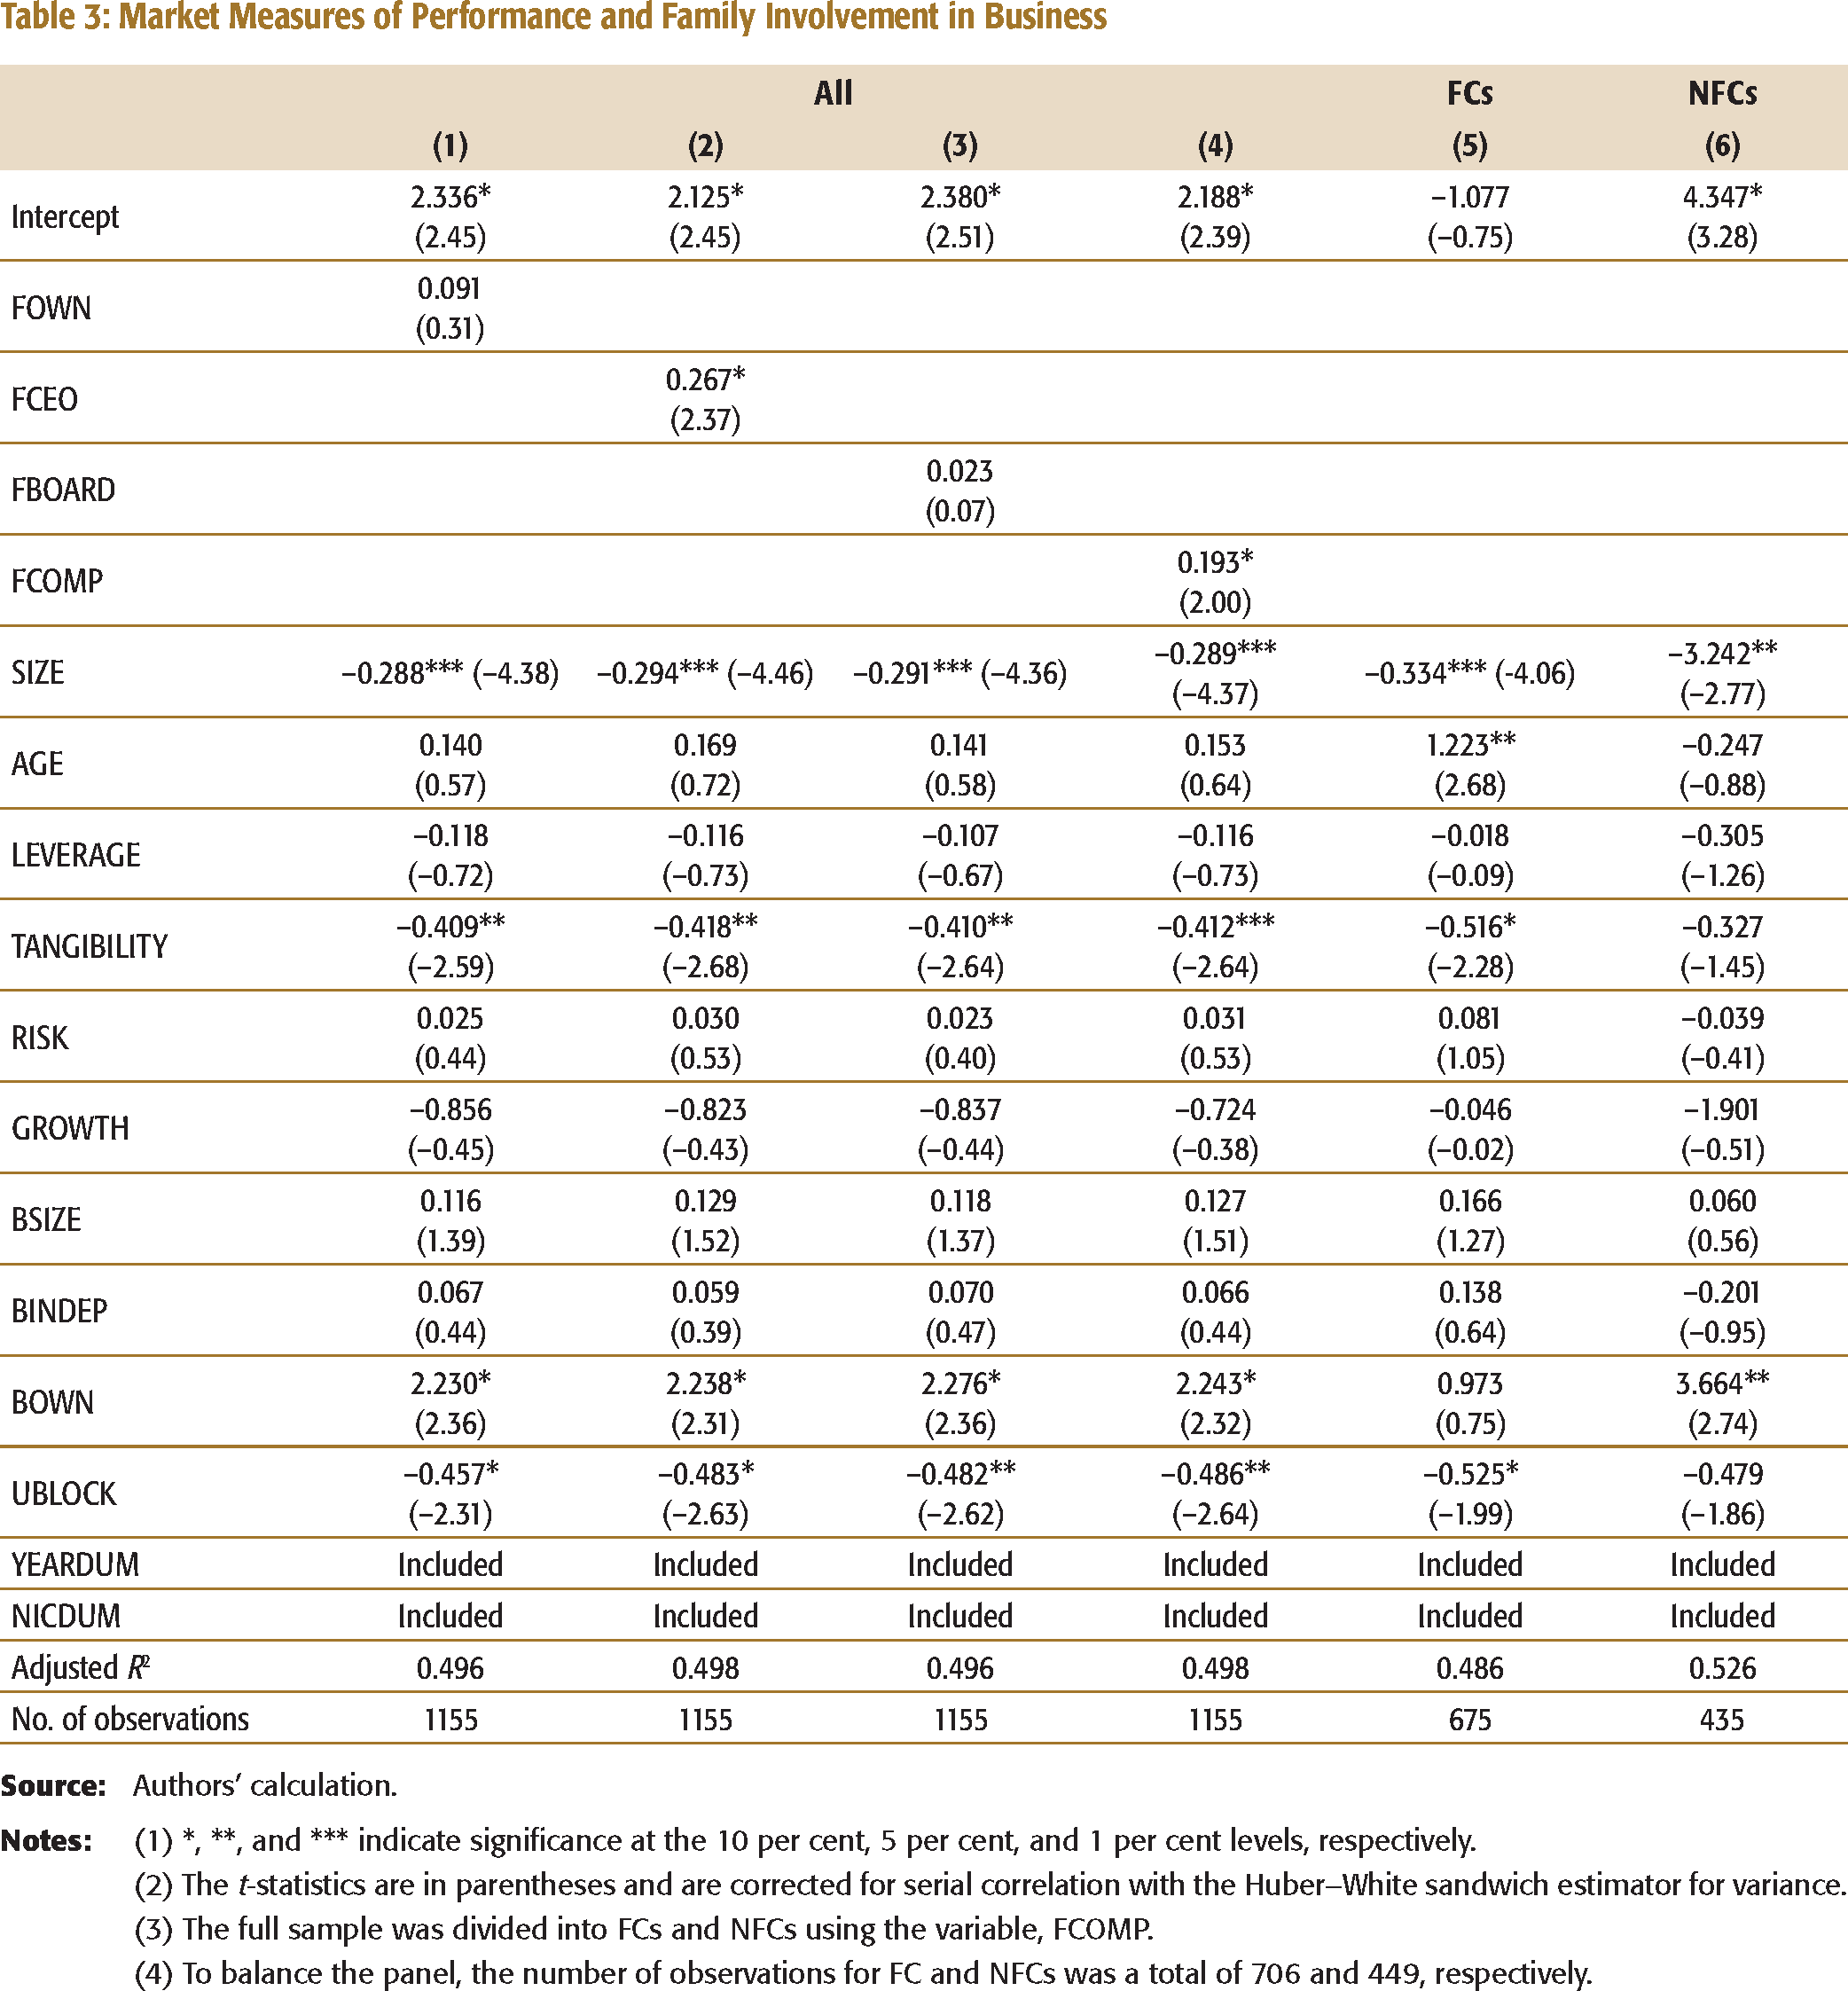
(2) The t-statistics are in parentheses and are corrected for serial correlation with the Huber–White sandwich estimator for variance.
(3) The full sample was divided into FCs and NFCs using the variable, FCOMP.
(4) To balance the panel, the number of observations for FC and NFCs was a total of 706 and 449, respectively.
Performance and Generation of Family Involvement in Business
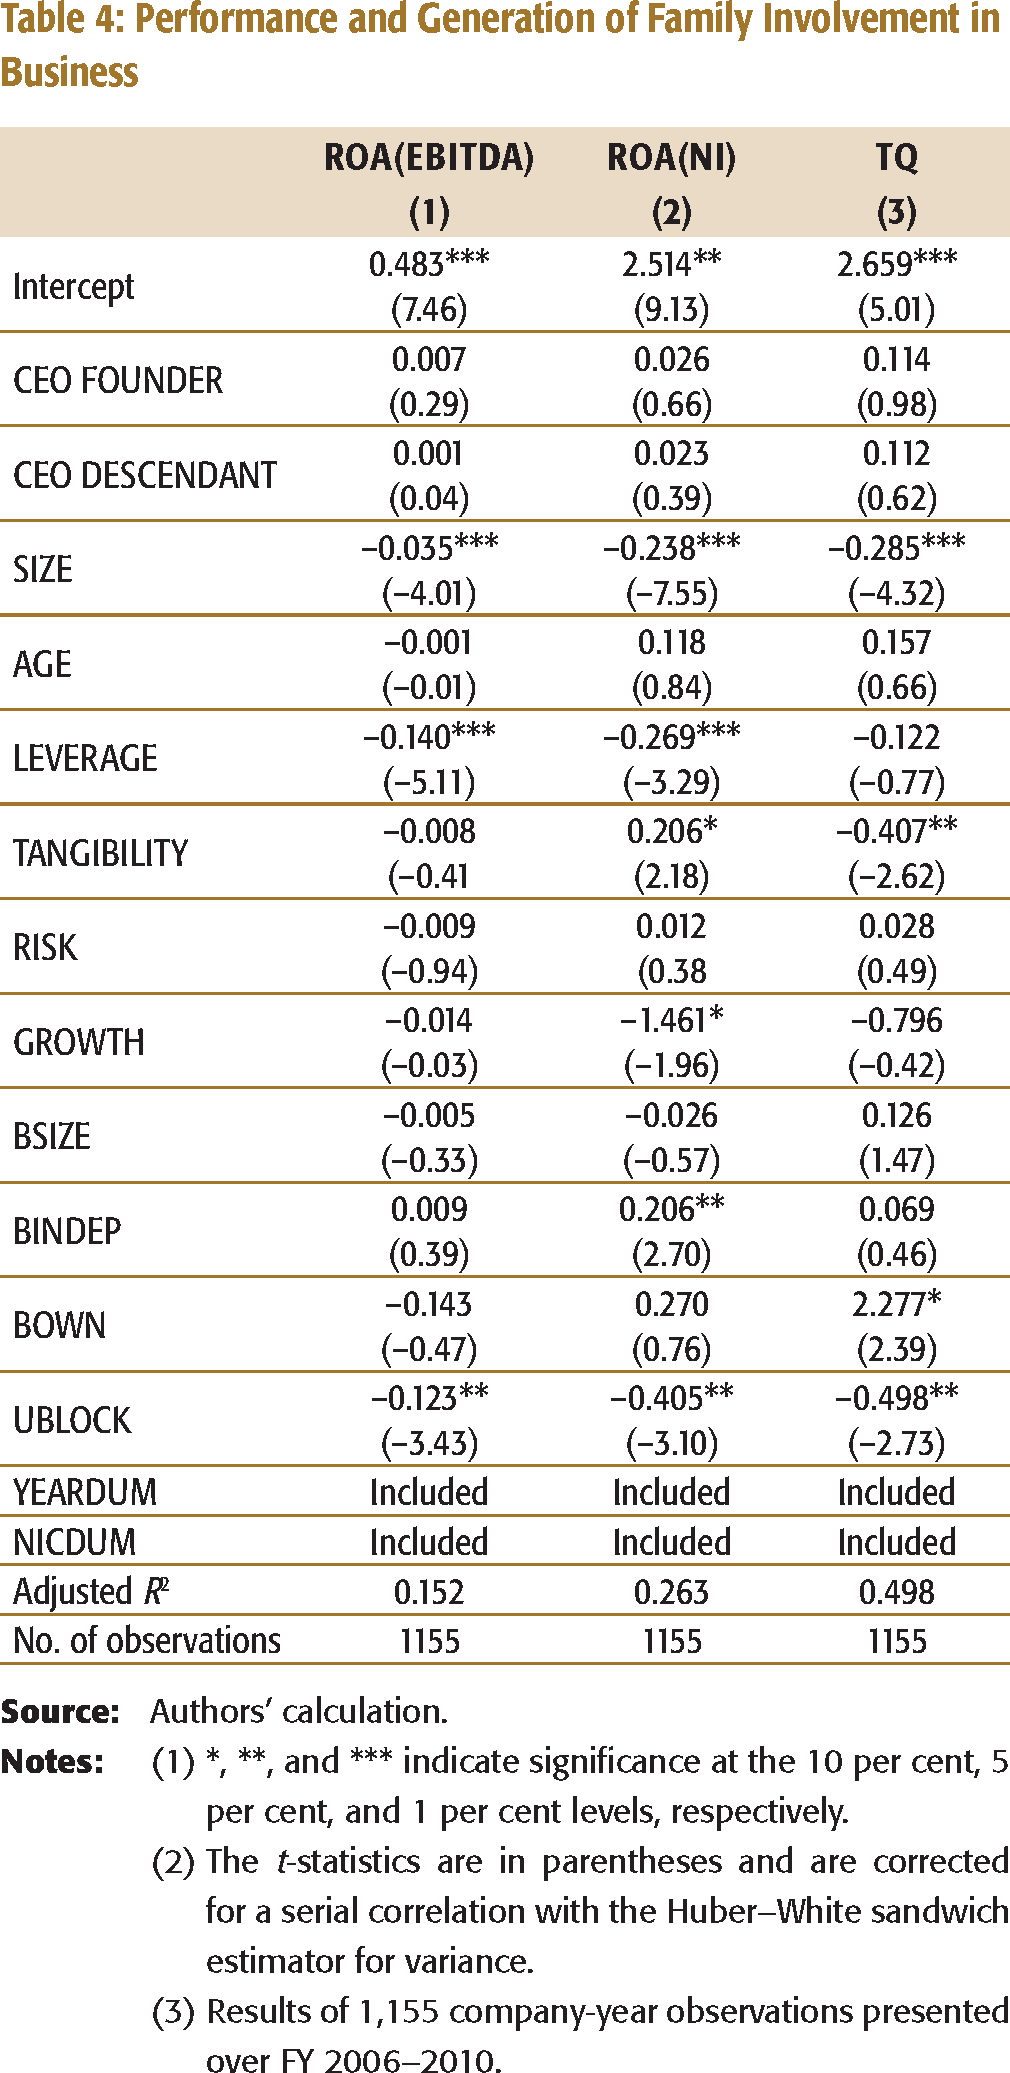
(2) The t-statistics are in parentheses and are corrected for a serial correlation with the Huber–White sandwich estimator for variance.
(3) Results of 1,155 company-year observations presented over FY 2006–2010.
Endogeneity of Family Involvement in Business and Financial Performance
Instrumental Variable Regression—Performance on Family Involvement
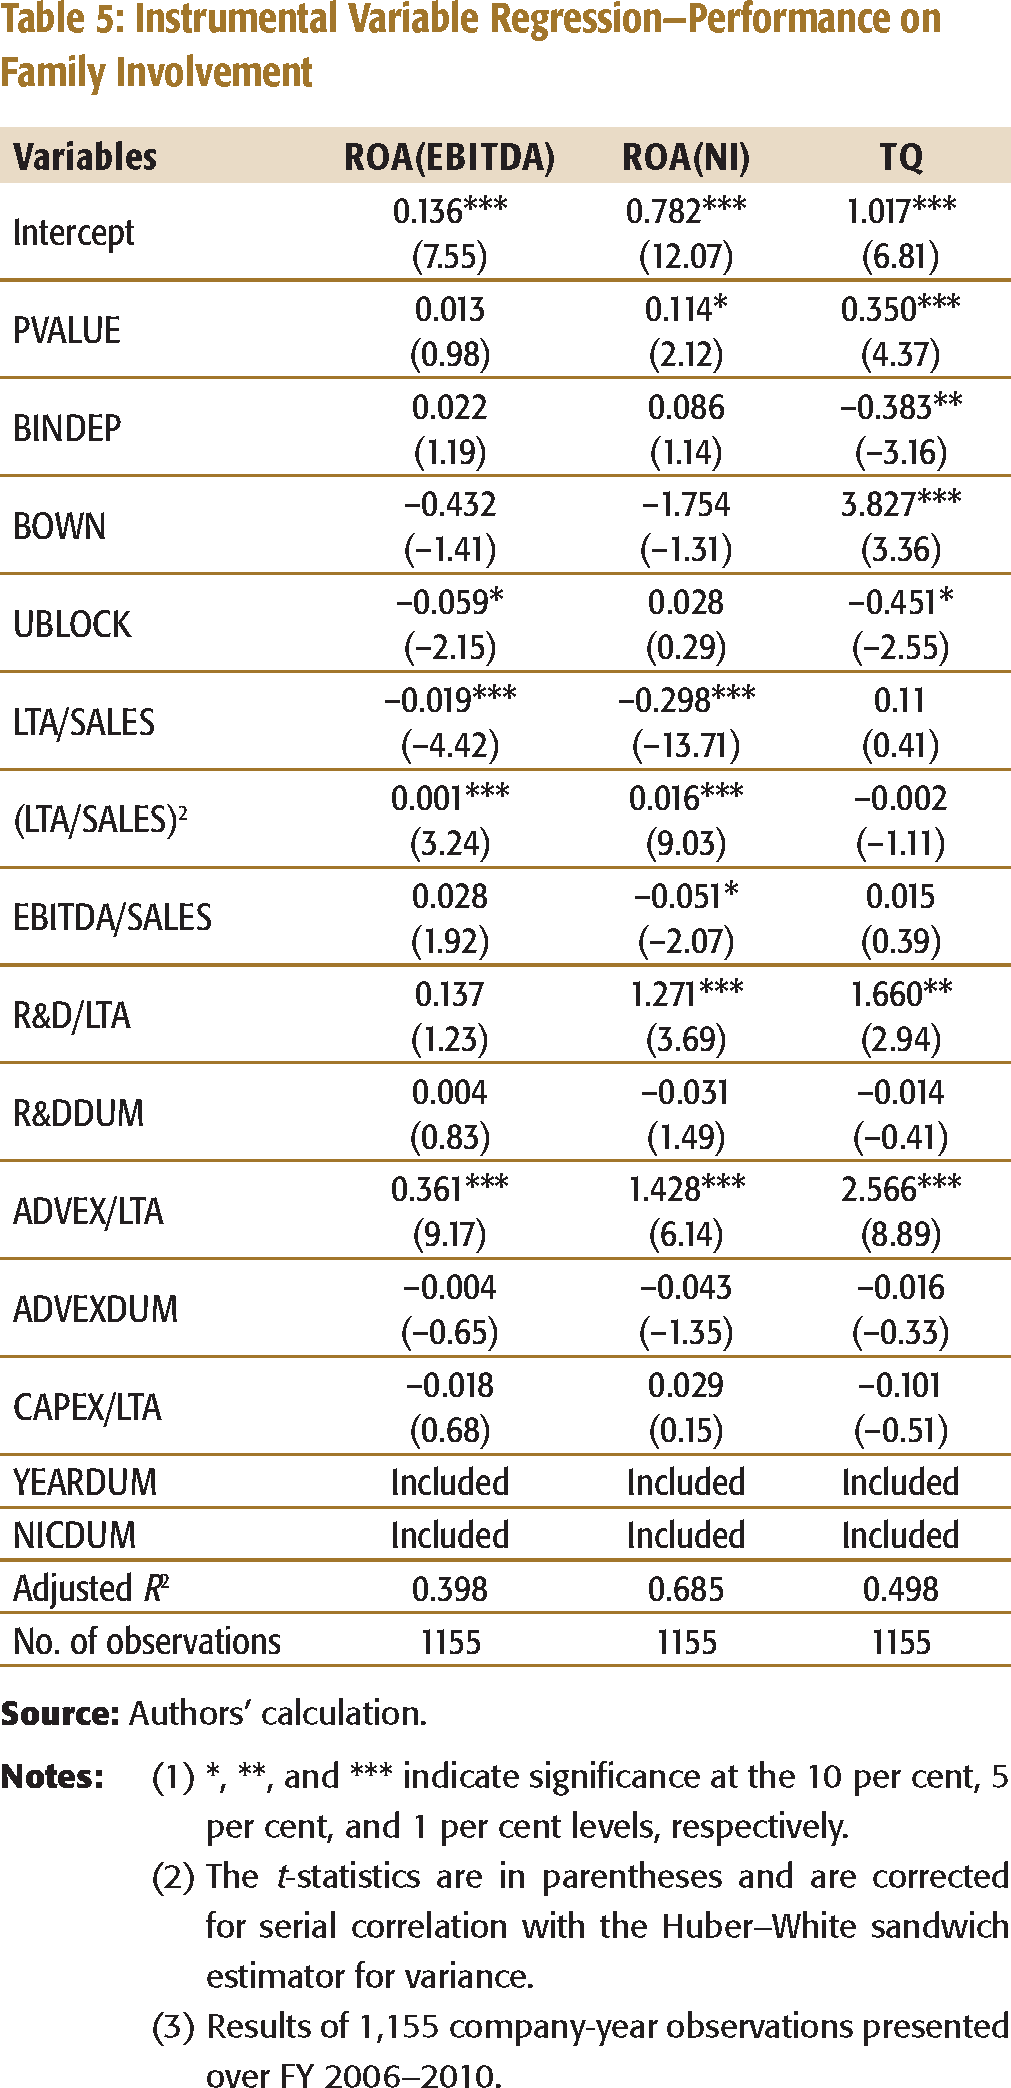
(2) The t-statistics are in parentheses and are corrected for serial correlation with the Huber–White sandwich estimator for variance.
(3) Results of 1,155 company-year observations presented over FY 2006–2010.
Robustness Check
While the above tests are suggestive of FIB–FP relationship, additionally, two analyses were carried out to check the robustness of the results. First, the sensitivity of the results was checked using an alternative FP measure, namely, return on equity (ROE). The results were similar, although less significant than those obtained by using ROA. Second, the econometric analysis to assess the endogeneity problem was repeated using other FIB measures. The results were very similar.
CONCLUSION AND IMPLICATIONS
The economic backdrop of most nations remains dominated by family businesses. Family control is common in publicly traded Indian companies. Such controlling families often hold large shareholdings and for the most part have representation at the top management level as well as on the board. An overarching question that emerges is whether and how family ownership, management, and governance affect FP. This article is an attempt to provide a definitive answer to such a question, as it endeavours to unravel the relationship between FIB and FP of companies included in the S&P BSE 500 Index during the period 2006–2010.
The study provides several insights into the family businesses in the Indian context. First, the FCs are the predominant form over a number of industries in a large sample, S&P BSE 500 Index. In addition, founding families are often involved in the actual management of the companies. Therefore, the premises of the Berle and Means (1932) of the corporation, where the CEO is not an owner and ownership, is dispersed do not apply to corporate India. Second, the cross-sectional longitudinal analyses show that the FIB is associated with a superior FP. Both accounting and market performance are higher for FCs vis-à-vis NFCs. Such results reinforce that continuing FIB, in itself, is not necessarily a less effective organizational structure, as posited by Anderson and Reeb (2003). Plausibly, FIB reduces agency problems without leading to severe losses in decision-making efficiency. Furthermore, it seems that a family brings to a company a unique bundle of resources that might affect its performance, as proposed by Habbershon and Williams (1999). As a result, it is unlikely that the so-called agency costs would increase in the FCs under study. Third, based on the market performance measure, FCs appear to be better performers with higher outside board representations. Family members do not dominate the board, while non-family board members are primarily independent, and furthermore, most of them are professionals with experience. The results, thus, support the stewardship theory suggesting that families seek independent directors to serve on the board for their counsel and advice. Finally, firm size and unaffiliated blockholdings have a significant negative impact on FP, consistent with the argument that smaller companies and the ones with a lower fractional equity stake of non-affiliated owners have better performance.
This study joins the evolving concurrence on the diversity and heterogeneity of family businesses by differentiating between family-owned, family-managed, and family-governed companies. Keeping this distinction in perspective is imperative for family business researchers, practitioners, and policymakers. The application of multiple and combined theoretical perspectives (agency, resource-based, and stewardship) rather than a mono-theoretical view presents an appropriate and adequate epistemological underpinning to empirical findings in the present study. The need to consider family-in-business and its dynamics necessitates the adoption of such an approach. Results of the present study, however, should be interpreted with caution due to certain limitations. First, this research is focused on relatively large, publicly traded companies, suggesting that the results may not extend to smaller companies. In reality, most family businesses are small or medium-sized and unlisted. In smaller businesses, the family is perhaps more likely to identify with the business, suggesting less need for formal governance mechanism. Furthermore, what works for one family in a specific situation may not necessarily work for another family in a different situation. Second, the effect of FIB on FP is contingent upon a number of other factors, such as family governance structures, control features, corporate strategy, and some other company-specific characteristics not considered in the existent analysis. These factors may explain for the differences found in the present as well as other family business studies. Third, there are limitations in the proxy measures of concepts. This study has focused solely on FP measures. Lastly, the possibility of nonlinearities between FIB and FP has not been tested. The insignificant results for the relation between corporate performance and family ownership could be plausibly explained by these nonlinearities. Notwithstanding these limitations, the study is relevant since it is the first attempt to empirically test the composite approach to the FIB–FP relationship.
Comparative Family Business Definitions and Sample Selection Criteria for Selected Studies
Sample Selection
Family and Non-family Companies by Two-digit NIC Code (n = 231companies, as on 31 March 2010)
Variable Description