
Abstract
Keywords
Globalization and liberalization have led firms from emerging markets like India to become more aggressive and opt for mergers and acquisitions (M&A) to fight the competitive battle. The present study attempts to evaluate the impact of mergers and acquisitions on the returns in the short run using detailed event study methodology.
The notable finding of the research is that a market starts reacting prior to the announcement. The moment the announcement information becomes public, investors start reacting and the stock price jumps high, providing positive abnormal returns (ARs) to the investors. However, post-announcement, a strong correction in the market price of the acquiring company takes place and positive ARs do not sustain.
The findings of the study have the following implications for the investors:
‘Earlier he sells more he gains’ and ‘issuance of stock for M&A is not good news’. An investor can also earn substantial returns if the shares of the acquiring company are purchased two days prior to the announcement day and sold two days after the announcement day. The announcement of cross-border acquisitions provides much higher returns than that for domestic. In addition, the cumulative abnormal returns (CARs) in the case of cross-border acquisitions are permanent, while in the case of domestic acquisitions they are temporary. The announcement of complete acquisitions of the target firm as a wholly-owned subsidiary provides much higher returns than that for partial/majority control acquisitions. In addition, the CARs in the case of complete acquisitions are permanent, while in the case of partial/majority control acquisitions they are temporary. The announcement of acquisitions financed with cash payment provides substantial returns.
This research draws the attention of managers to consider cross-border as well as domestic acquisitions as an option to strengthen their competitiveness. They should think of cash as a mode of payment to finance mergers as issuance of shares is bad news. The management may acquire the target firm as a subsidiary and may absorb it with its own operations later on.
M&A’s rapid growth in recent years calls for research to analyse what drives firms to go for M&A and how it affects firms and markets (Andrade, Mitchell, & Staffird, 2001; Holmstrom & Kaplan, 2001). When an acquisition is announced, a considerable amount of information is revealed about the potential transaction, which can be used to assess the stock market reaction to an M&A announcement. The effects of these announcements appear to be a good indicator of future success. The security returns around the announcement represent investors’ expectation of M&A benefits. Stock market reactions to M&A announcements could help to predict M&A profitability; moreover, short-term effects are of interests for immediate trading opportunities they create. The most statistically reliable evidence on whether M&A create shareholders’ wealth is documented by conducting event studies. The methodology is based on the fundamental idea that stock prices represent the discounted value of firms’ future stream of profits. Hence, the change in the equity value of firms observed due to stock market response to the announcement of M&A may be considered as a measure of the (discounted) additional profits that they are expected to accrue as a consequence of M&A (Duso, Gugler, & Yurtoglu, 2010). Various studies use event methodology to analyse the short-term effects of an M&A (Asquith, 1983; Dennis & McConnell, 1986; Dodd, 1980; Mitchell, Pulvino, & Stafford, 2004; Pettway & Yamada, 1986; Schipper & Smith, 1987; Sicherman & Pettway, 1987; Schipper & Thompson, 1983).
The determinants of performance of acquiring firms have also been extensively studied empirically. Most empirical studies agree that the method of payment, size, and form of the target firm acquired, geography of the target firm, etc., play an important role in explaining acquiring firms’ stock return. In this context, the present study proposes to conduct an empirical research to investigate the short-term performance of M&A. It attempts to gain new insights into the acquirers’ performance. As a result, the study would also provide an insight into the validity of the synergy hypothesis for Indian corporates.
LITERATURE REVIEW
The performance of acquiring firms in the short term has been extensively studied empirically. The purpose of this article is predominantly to assess the impact on shareholders of the acquiring companies. Accordingly, the literature review is primarily focused on studies measuring the implications of M&A on acquirer shareholders’ wealth.
A number of studies suggest that the value of the acquiring firms may increase or decrease after an M&A (Andrade et al., 2001; Berkovitch & Narayanan, 1993; Bradley, Desai, & Kim, 1983; Dennis & McConnell, 1986). Several studies have documented positive returns (Beitel, Schiereck, & Wahrenburg, 2004; Cakici, Hessel, & Tandon, 1996; Doukas, Holmen, & Travlos, 2002; Eckbo & Thorburn, 2000; Fee & Thomas, 2004; Firth, 1980; Kiymaz, 2003; Kohers & Kohers, 2000; Maquieira, Meginson, & Nail, 1998; Markides & Ittner, 1994; Schwert, 1996). Findings of these studies report significant positive ARs for acquirer firms (up to 7%) for different event windows around the announcement.
Many studies report significant negative returns in the range of 1–5 per cent for varying windows especially prior to the announcement to shareholders of the acquiring firms (Beitel et al., 2004; Corhay & Rad, 2000; Datta & Puia, 1995; DeLong, 2001; Doukas et al., 2002; Goergen & Renneboog, 2004; Houston, James, & Ryngaert, 2001; Mitchell & Stafford, 2000; Morck, Schleifer, & Vishny, 1990; Mulherin & Boone, 2000; Sirower, 1997; Walker, 2000). Weston and Weaver (2001) opine that the shareholders of the acquiring firms gain from efficiency enhancing mergers. Moeller, Schlingemann, and Stultz (2004) report that small acquirers experience significantly higher CARs around M&A announcements than do large acquirers.
Despite a plethora of literature on the implications of M&A, the empirical evidence on returns to the shareholders of the acquirer firm is not conclusive. In a review paper on the performance of the acquiring firm, Bruner (2002) suggests that these mixed results make the conclusions regarding the acquirer firms’ performance more complex.
To the best of our knowledge, there has been no in-depth research related to the impact of M&A on the shareholders’ wealth in the short term in India. Investigations using event study methodology have exclusively focused on developed security markets, namely, United States, Canada, Japan, and European nations. Studies of M&A in India are very few. The number of studies on share price performance on the announcement of M&A is limited and is industry specific in the Indian context. Moreover, the studies based on Indian security markets have focused either on specific industries (Anand & Singh, 2008 (banking sector); Chakraborty, 2010 (financial); Rani, Yadav, & Jain, 2011 (pharmaceutical)) or have analysed a very small sample size (Mann & Kohli, 2009). Recently, Kohli and Mann (2012), Gubbi, Aulakh, Ray, Sarkar, and Chittoor (2010), and Barai and Mohanty (2010) have analysed ARs to the announcements of M&A by conducting an event study on a large sample but have not tested the robustness of returns by any non-parametric test. In this context, Ahern (2009) provides evidence that biases are introduced in event study when sample is small and the sample selection is based on some common criterion.
In light of the above, the following issues have been identified for examination:
What is the short-run share price performance of Indian acquiring firms engaged in M&A? What is the impact of method of payment employed on the short-run performance of M&A? Do the forms of the target firm (listed/unlisted) acquired affect the short-run performance of M&A differently? What is the impact of control (the percentage of stake) acquired on the short-run performance of the Indian acquiring firms?
OBJECTIVES
To address the above issues, the following objectives have been identified:
To measure the effect of the announcement of M&A on stock returns of acquiring firms by:
Ascertaining the magnitude and the direction of the ARs for the entire sample. Conducting analysis of the ARs for subsamples on the basis of: Domestic and cross-border M&A Method of payment (cash, stock). Form of the target firm acquired (listed, unlisted). Status of the target firm (remains wholly-owned subsidiary, absorbed with the acquirer’s operations). Stake of acquisitions (partial/majority, com-plete control).
Hypotheses
To achieve the above stated objectives, the following hypotheses have been formulated:
DATA DESCRIPTION
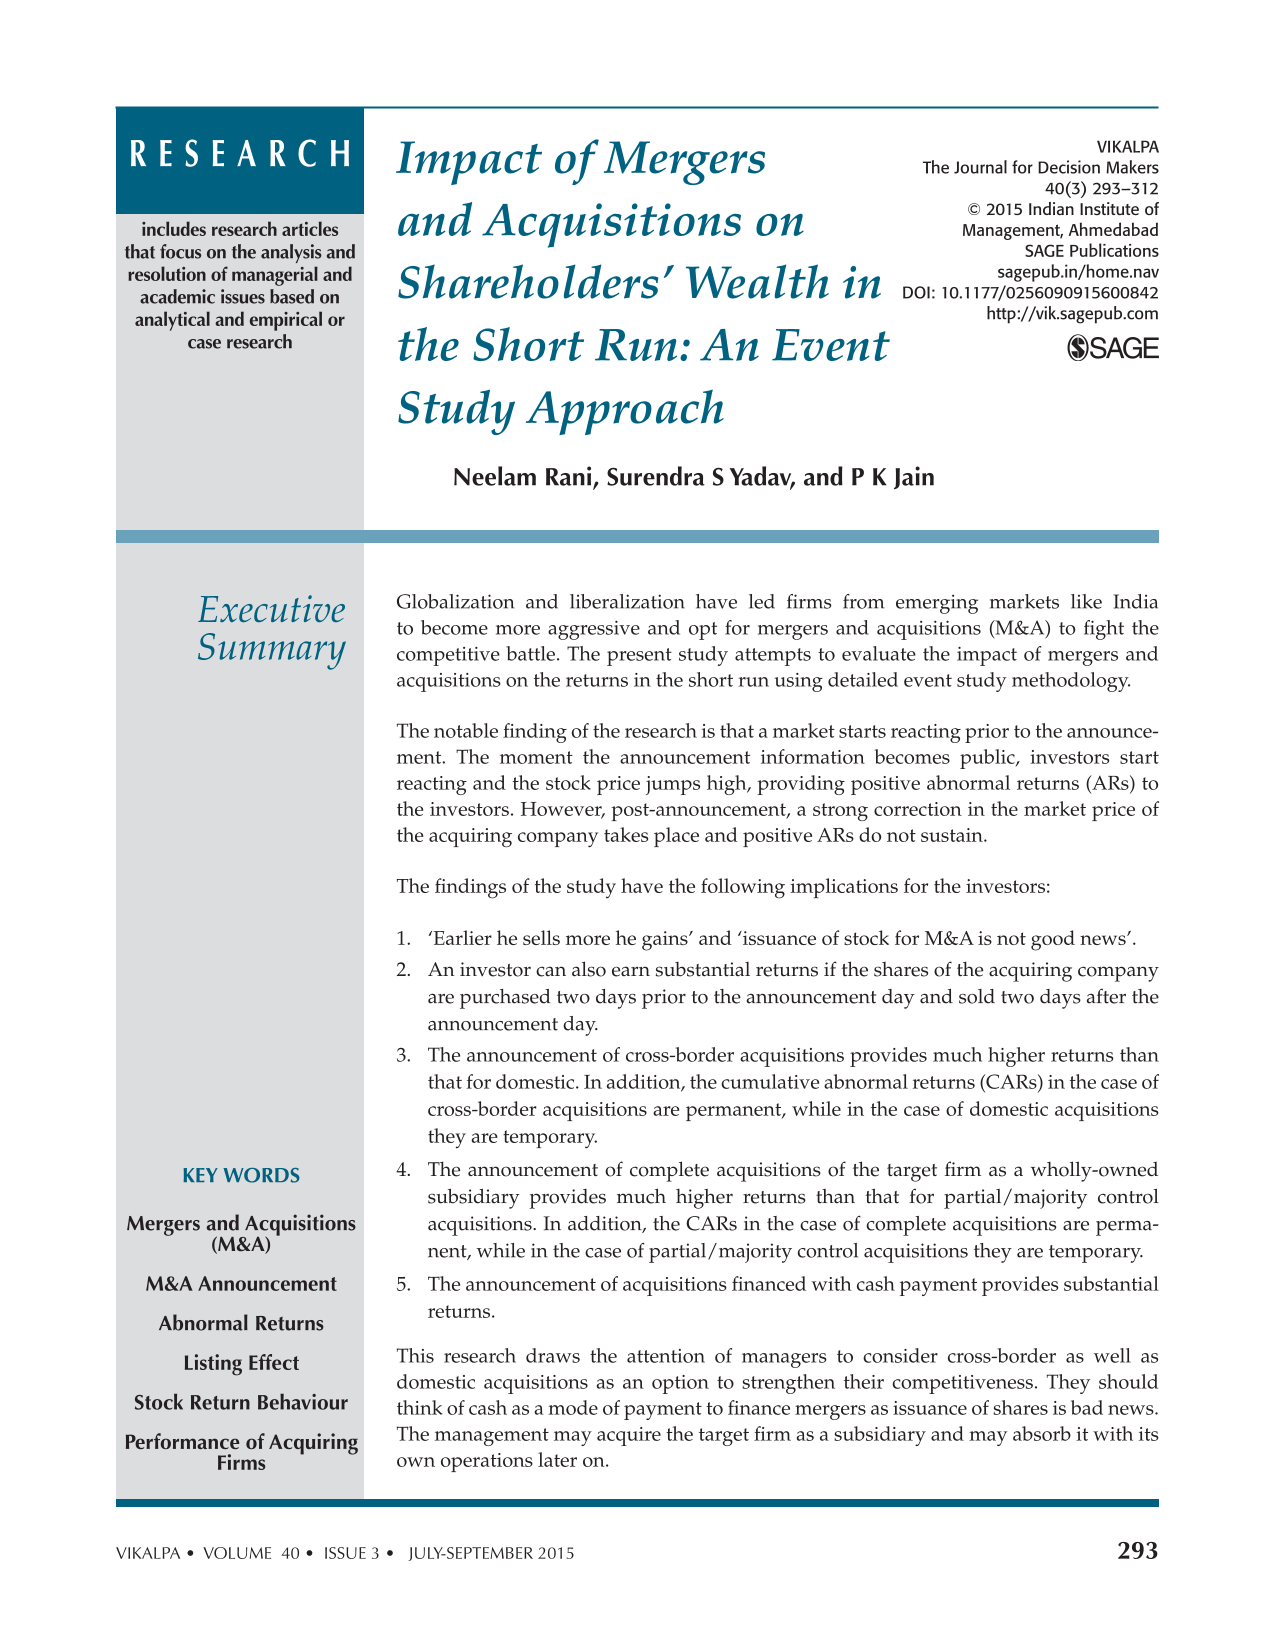
The study is confined to the analysis of acquiring companies that undertook the move of M&A and are listed on the Bombay Stock Exchange (BSE). It covers a period starting from 1 January 2003 to 31 December 2008. There were 5,504 M&A announcements during this period.
Table 1 provides the year-wise sample distribution of M&A. It has been observed that the maximum announcements happened in the year 2006 (21%) followed by 2007 (20.6%) and 2006 (20.5%). However, the maximum number of completed M&A happened in the year 2007 (21.9%) followed by 2008 (21.8%) and 2006 (19.4%). Table 1 also reveals that a substantial number (38.6%) of acquisitions announcements are withdrawn subsequently.
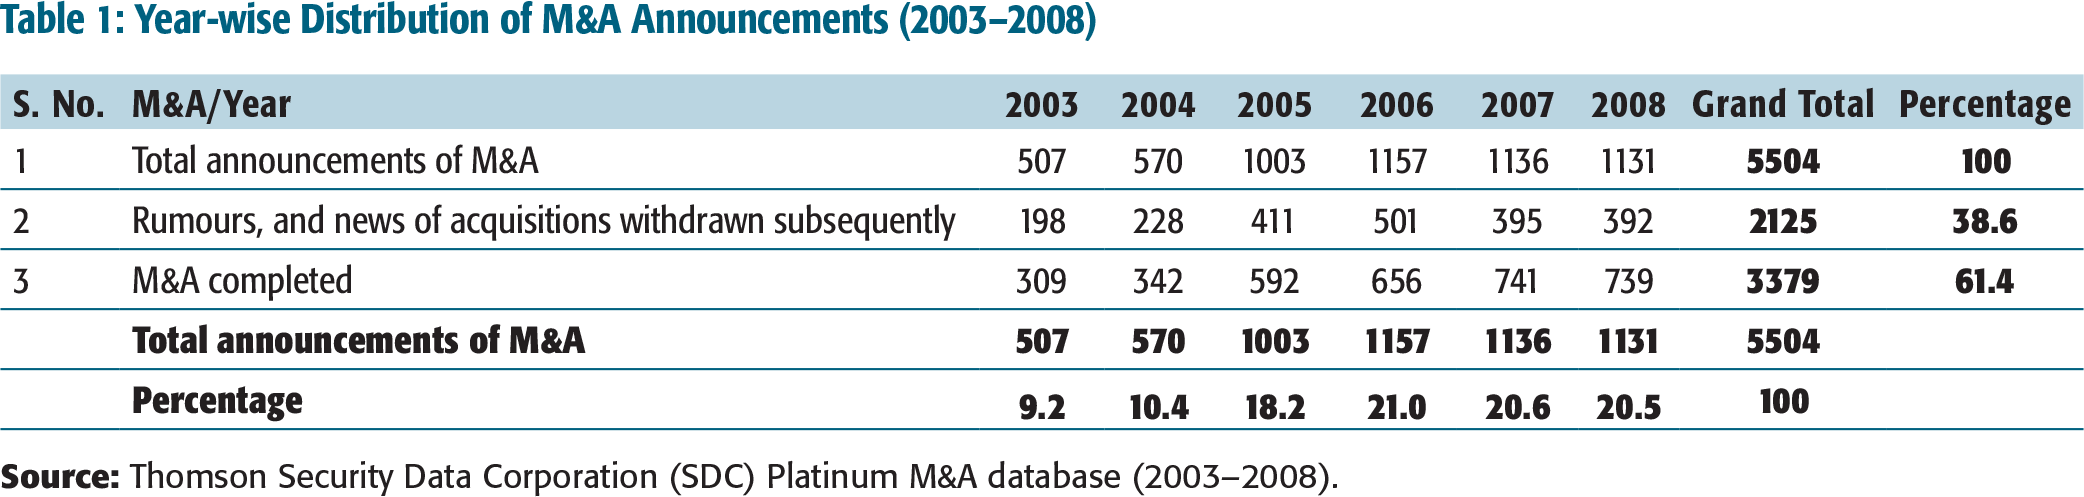
Table 2 summarizes the stake-wise sample distribution of M&A. It is evident from the Table that almost half (50.2 %) of the acquisitions are of minor stake, whereas nearly two-fifths (38.5 %) are the acquisitions of complete stake, and one-tenth acquisitions are of partial/majority control.
Year-wise Distribution of M&A Announcements (2003–2008)
Stake-wise Distribution of M&A Announcements (2003–2008)
The shares are ordinary common shares.
There are no announcements or ex-dates of stock splits, cash dividend and stock dividends/bonus issues or of capital investment in a new project, credit rating, financial results, issuance of new shares by way of domestic or international offering in the form of public offer, preferential issue, foreign currency convertible bonds (FCCB), American depository receipts (ADR), and global depository receipts (GDR) during the event window.
The firms must have daily price information available from the Prowess database, Bombay Stock Exchange, or the Capitaline database. The firms having non-synchronous trading have been eliminated from the sample.
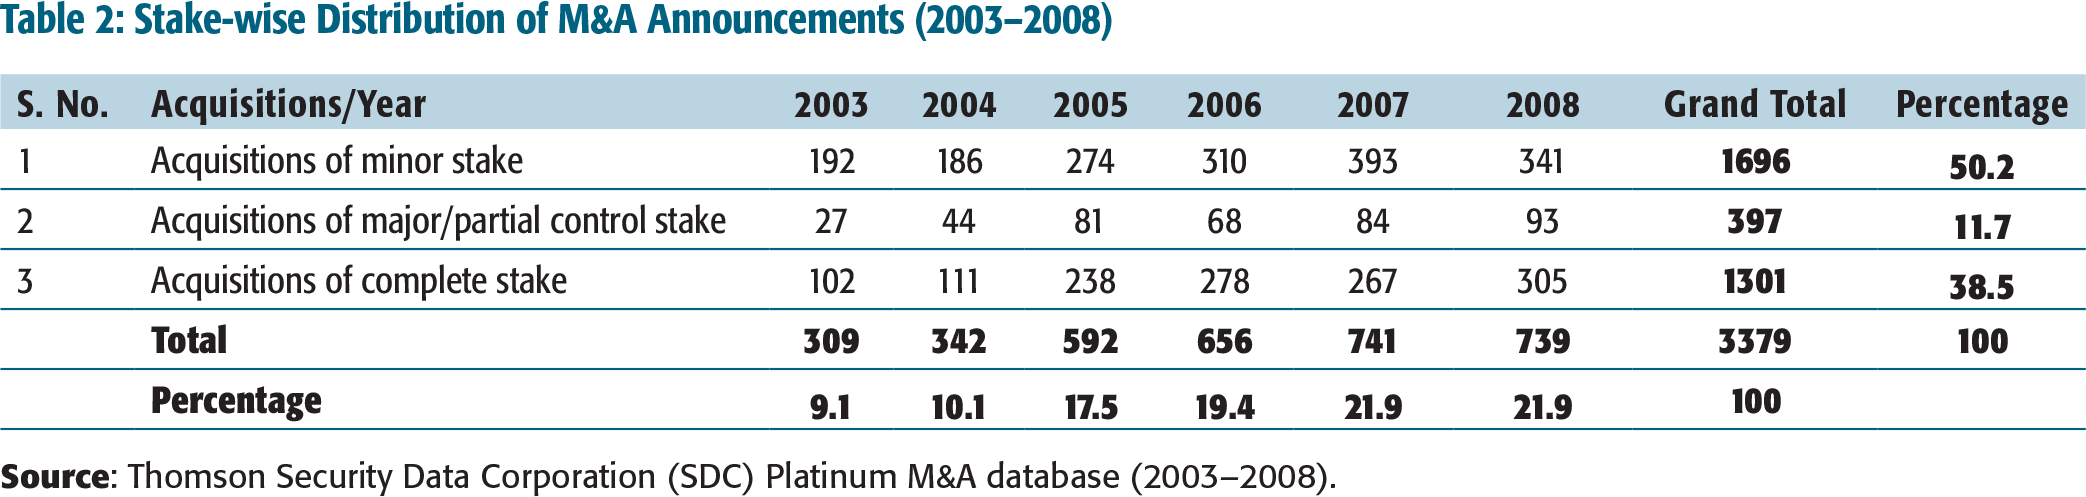
Therefore, in this study, while the universe for the M&A announcements is 5,504, the sample for the short-term performance is 522 comprising 256 cross-border and 266 domestic acquisitions. The unit of analysis for this study is acquiring firms in India.
Table 3 contains the details of selection of the final sample of M&A for the study.
Sample Selection
Table 4 shows that the trend of cross-border and domestic M&A has been increasing since year 2003 over the sample period with the highest number of M&A reported in year 2007 for both.
Year-wise Sample Distribution of Cross-border and Domestic M&A (2003–2008)
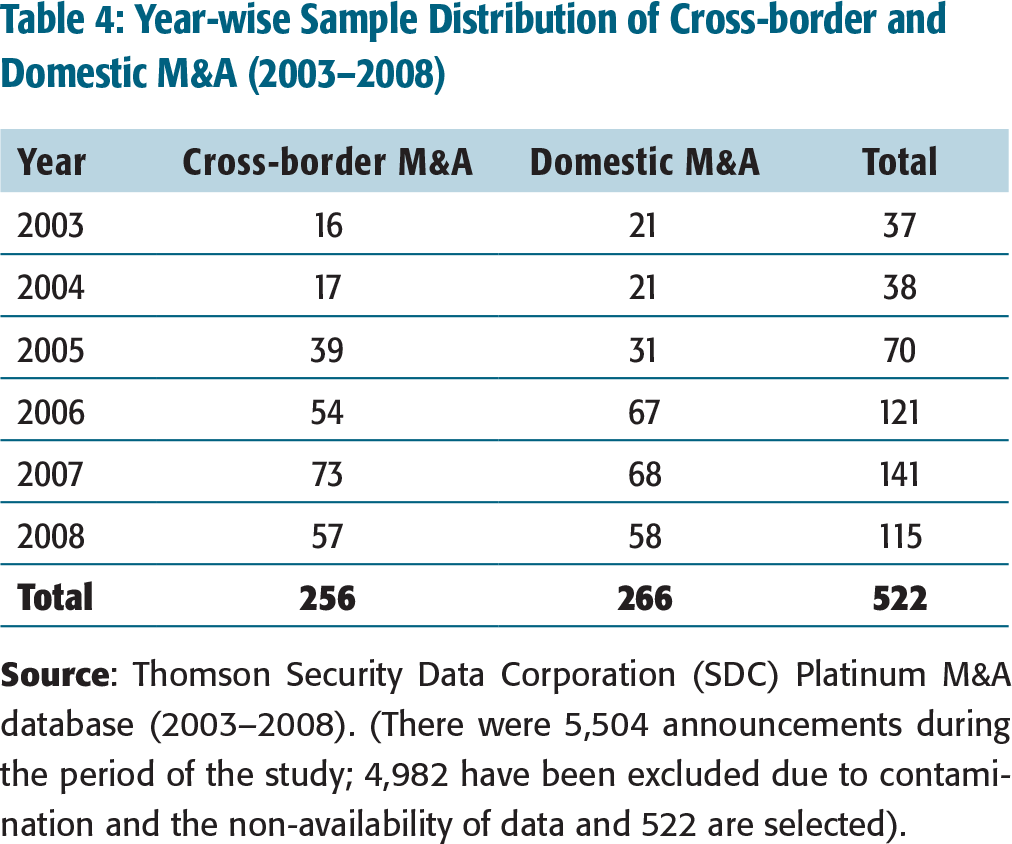
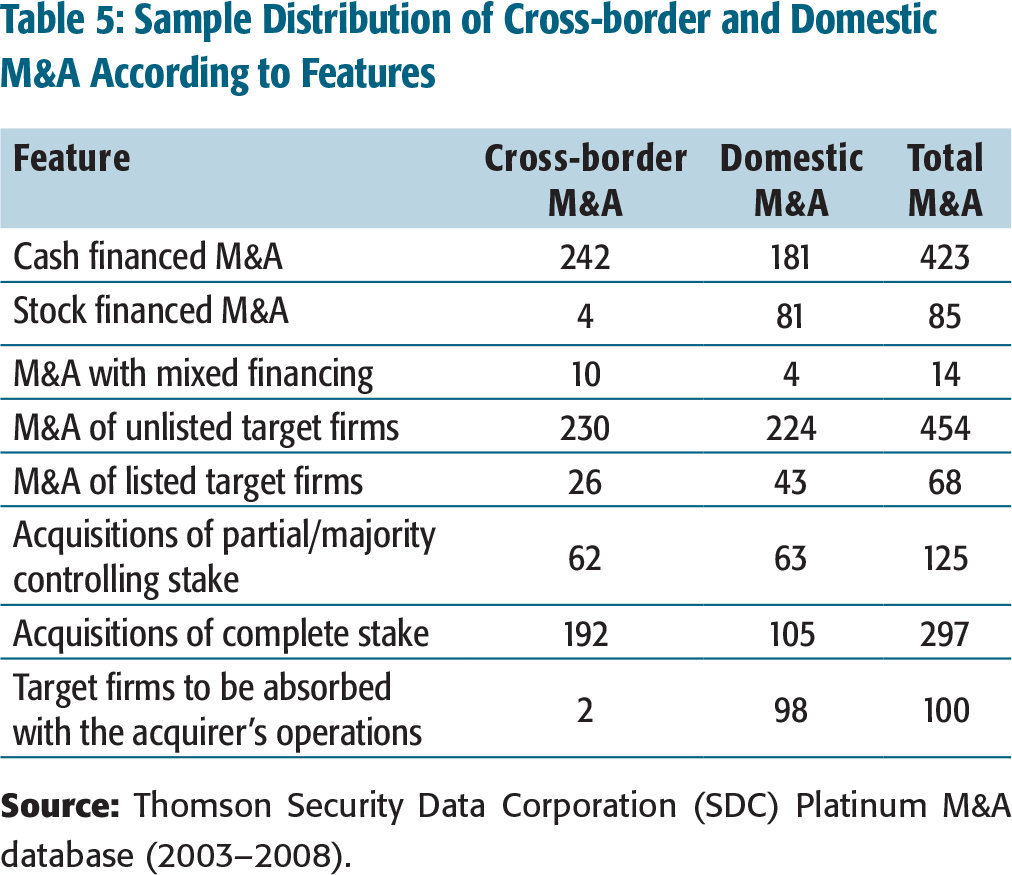
Table 5 depicts that cash is the most frequently used form of financing in both the sets of M&A. Contrary to the domestic acquisitions, for cross-border M&A, stock payments are rarely used. M&A of unlisted target firms are higher in comparison to the M&A of listed target firms.
Sample Distribution of Cross-border and Domestic M&A According to Features
EVENT STUDY METHODOLOGY
The events defined for the present research study are the announcements of M&A. These dates are verified (manually) from the archives of corporate announcements of the Bombay Stock Exchange (BSE) to ascertain the clean period data. It has been checked (manually) that there is no contamination of information and confounding event during the event window.
For the present study, the estimation window is from the day –280 to the day –26 (from 25 to 280 days prior to the event window), thus comprising 255 trading days ensuring that estimates of the normal return model are not influenced by the event-related returns. It is imperative for the estimation window and event window not to overlap.
The event window for this study is chosen as –20, through 0, to +20. Here, 0 depicts the announcement date, –20 is the 20 days’ time period prior to the announcement date, and + 20 is the 20 days’ time period after the announcement date. In order to account for early share price reactions (induced by the anticipation of the stock market of an upcoming announcement before and potentially slow information processing after the event), the CARs over alternate windows are considered. Fama, Fisher, Jensen, and Roll (1969) suggest that event date may be uncertain. Therefore, it is desired to consider AR which might appear before and after the defined date. This interval is known as the event window. The ARs over varying windows, namely, (–20, –2), (–5, 0), (–1, 0), (–1, +1), (–2, +2), (–5, +5) (–10, +10), (–20, +20), (0, +1), (0, +5), and (+2, +20), have been observed to capture the leakage effect.
The market model has been considered to estimate the expected returns. It involves the regression of a stock’s returns against a market index. The value-weighted market index—BSE SENSEX 1
BSE SENSEX (Bombay Stock Exchange Sensitivity Index) is a ‘market capitalization—weighted’ Index of 30 component stocks representing a sample of large, well-established, and financially sound companies. It is reckoned as a benchmark index of the Indian capital market.
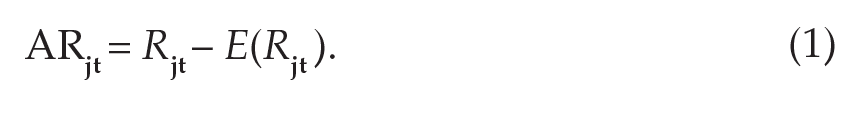
The key issue in event studies is what portion of the price movement is actually caused by the event of interest. In other words, it is required to extract the impact of the one particular event on stock returns. This leads to the concept of ARs. The AR is the differences between the actual return and the expected return on a particular day.
The AR of the jth stock (ARjt) is obtained by subtracting the normal or expected returns in the absence of the event E(Rjt), from the actual return in the event period, (Rjt) as per the following equation:
The market model relates the return of a security to the return of the market portfolio as per the following equation:
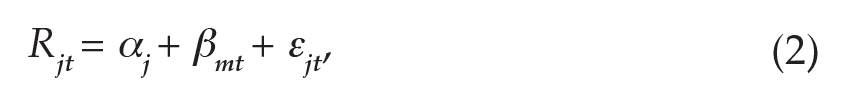
where, t= –280,…, –26, αj is a constant term for the jth stock, βj is the beta of the jth stock, Rmt is the market returns, and ϵjt is an error term.
The parameters of the model are estimated by using the time-series data from the estimation period that precedes each individual announcement. The parameters estimated are then used in the calculation of ARs for each day in the event window. The estimated parameters are then matched with the actual returns in the event period. The daily excess return, that is, the AR of firm j for the day t(ARjt) is estimated from actual returns during the event period and the estimated coefficients from the estimation period as per the following equation:

where t = –20, . . ., +20.
The average abnormal return (AARt) for each day in the event window is calculated as per the following equation:
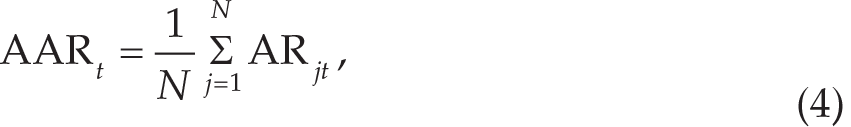
where N is the number of firms.
The CAR for a given security is the sum of daily ARs over the event window. Over an interval of two or more trading days beginning with day T1 and ending with day T2, the CAAR is calculated as per the following equation:

The precision-weighted CAAR (PWCAAR) is a better measure than CAAR and average standardized CAR (Cowan, 2007). The study also reports PWCAAR. The precision-weighted average is constructed using the relative weights of each stock. The precision-weighted return weight of each stock is inversely proportional to its standard deviation. The precision-weighted cumulative average is calculated as specified in the equation below:
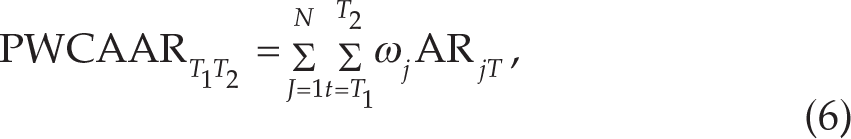
where
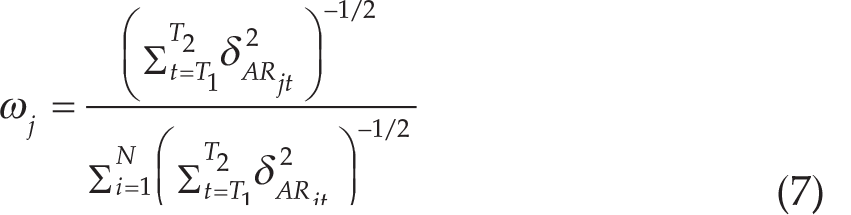
where
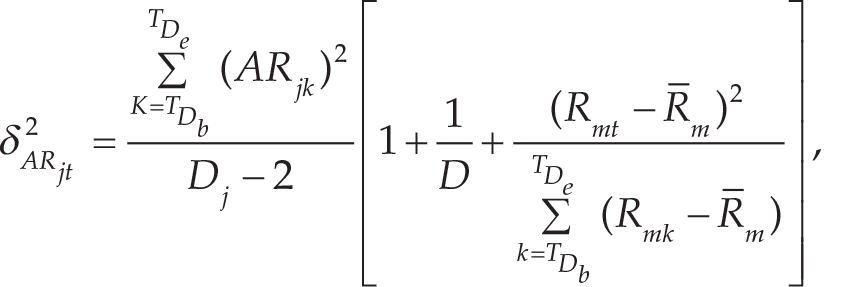
where Dj is the number of non-missing estimation period returns for firm j, Rmt is the return on the market index on day t in the event window, Rmk is the return on the market index on the trading day k in the estimation window, and is the mean market return over estimation period.
Statistical Significance of Abnormal Returns
Kang and Stulz (1996) documented specific robustness issues in event studies using Asia-Pacific financial market data. 2
A special resolution is passed (to be passed with two-thirds of majority) to change the name of a company, alterations to the memorandum or articles of association, or a reduction of capital of the company, etc. A special resolution requires 75 per cent shareholders of a company present or by appointment of a proxy to vote in favour of the company to alter a company’s constitution at a general meeting.
The four parametric test-statistics, namely, crude dependence adjustment test (Brown & Warner, 1980), cross-sectional standard deviation test (Brown & Warner, 1985), Patell’s test (1976) corrected by Mikkelson and Partch (1988), and standardized cross-sectional test (Boehmer, Musumeci, & Poulsen, 1991) have been conducted to test for the significance of AAR and CAAR over the event period.
The three non-parametric test statistics, namely generalized sign-test (Cowan, 1992), rank-test (Corrado, 1989), and Jackknife-test (Giaccotto & Sfiridis, 1996), have been conducted to test the significance of ARs.
EMPIRICAL RESULTS
Analysis of Short-term Performance of the Entire Sample
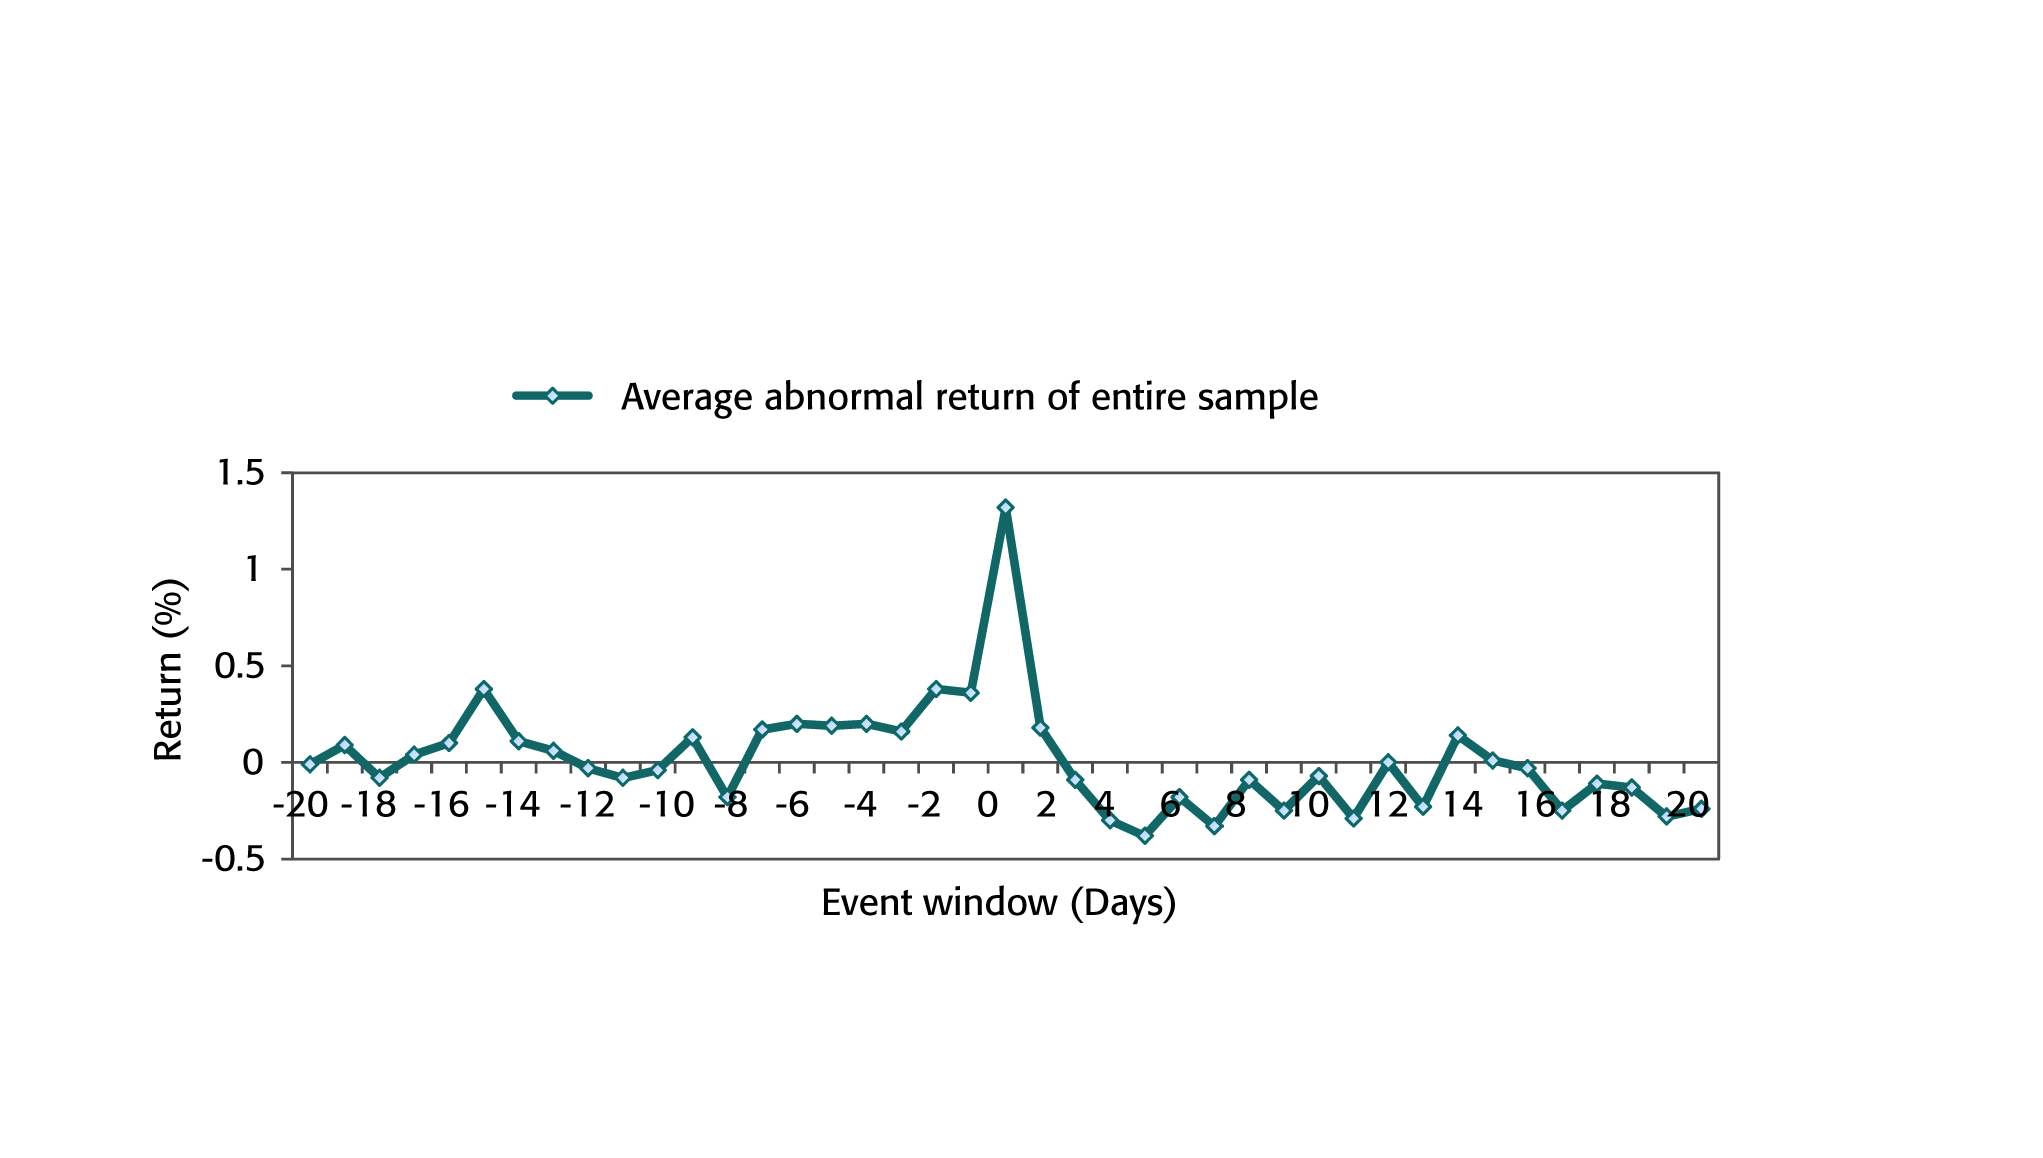
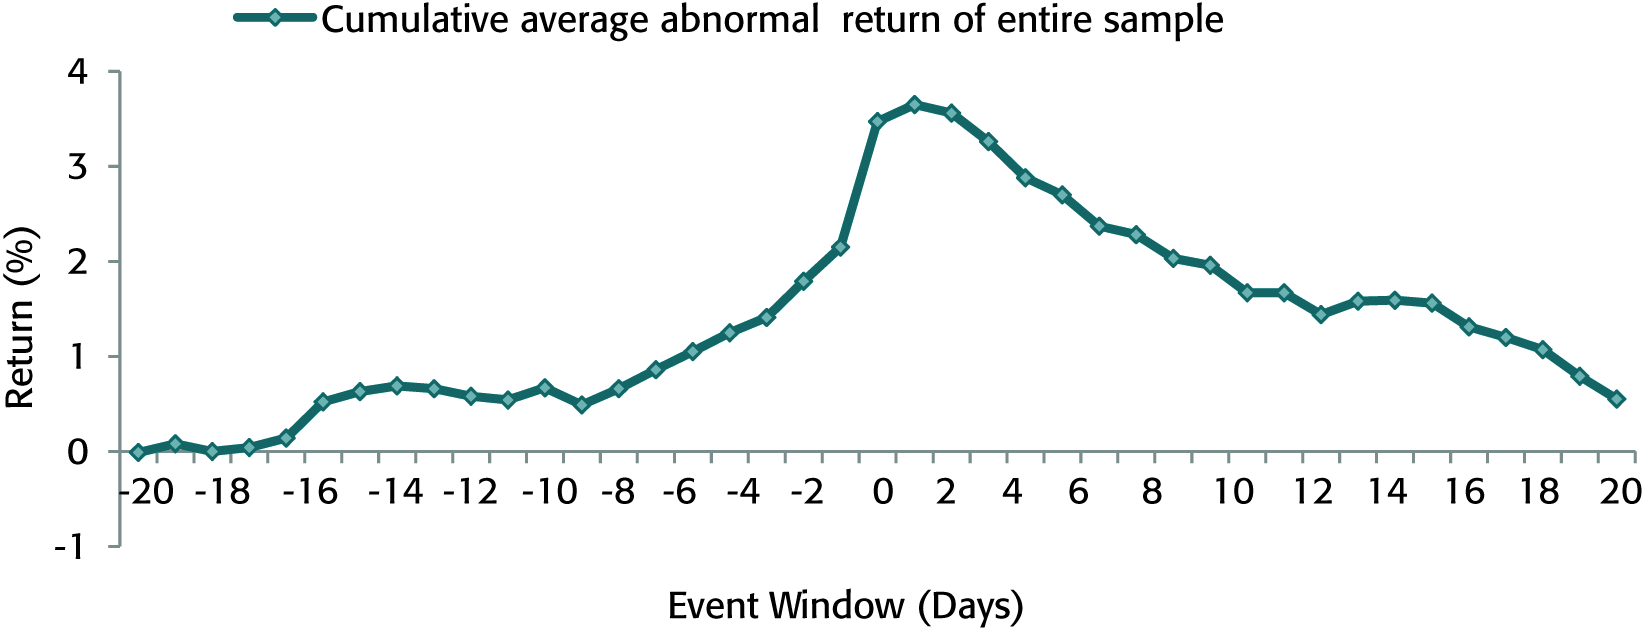
Table 6 reports the results of the event study conducted to examine the impact of announcements of M&A on stock returns. It depicts the AAR, corresponding t-statistic values, median abnormal returns (MARs), the number of the positive and negative ARs, and CAARs for each day in the event window. In addition, Figures 1 and 2 graphically depict the value of AAR and CAAR corresponding to each day of the event window.
Table 6 depicts that during the pre-announcement window, the pattern of positive AARs starts from 7 days before the announcement day and the returns are positive for 14 days, while they are negative for only 6 days. Out of these 14 positive AAR values, two values are significant. The negative returns are not significant on either of the six days. The AAR on the announcement day (0) is 1.32 per cent; this is the maximum and highly significant (at 1 % level). In fact, it has been noted that on the announcement (day 0), 320 out of the total of 522 companies observed positive ARs. The positive and significant AARs on the announcement (day 0) indicate that the investors perceive the announcement of M&A to be beneficial for them. Although the change of positive reaction prior to and on the announcement day to negative reaction after the announcement day indicates that the investors overreacted initially to these announcements but later a correction (to this overreaction by the investors) takes place quickly. Such findings lead to a conclusion that the null hypothesis of zero AARs on the announcement day and event windows of 3, 5, and 11 days is rejected.
AAR during the Event Window
CAAR during the Event Window
Abnormal Returns and Test Statistics on and around M&A Announcements (N = 522)
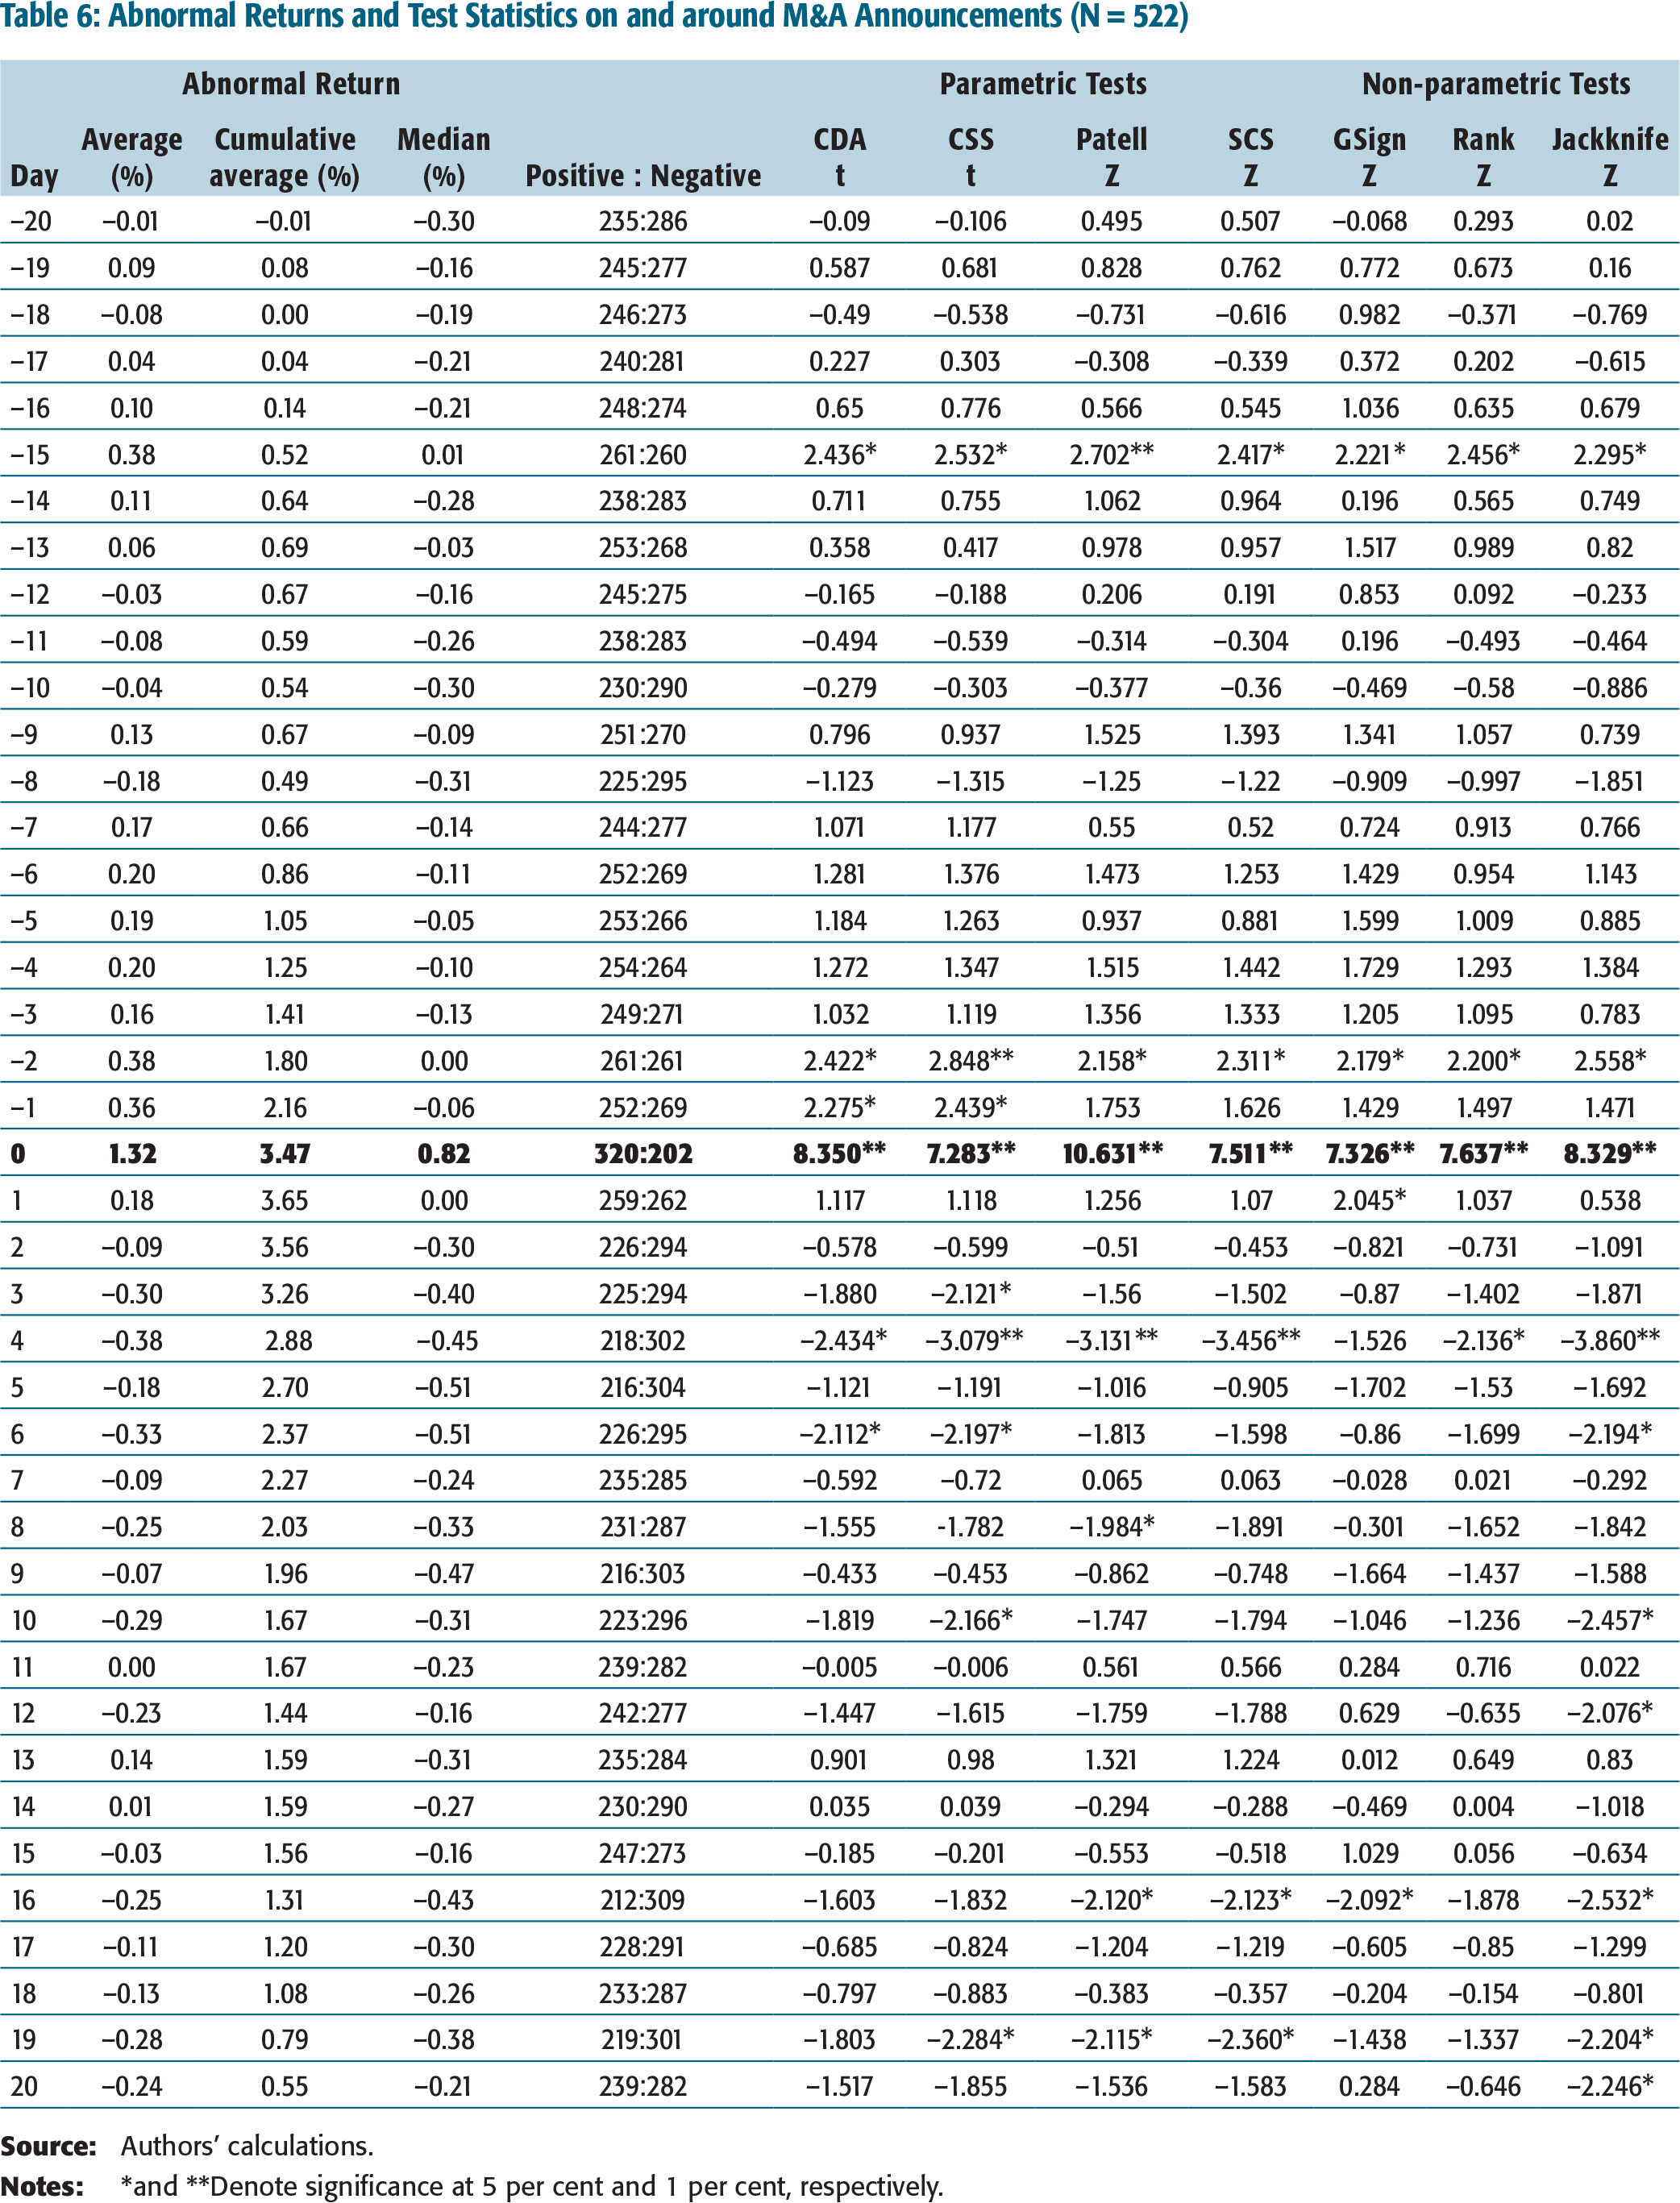
The ARs are also cumulated over the event window to assess the net magnitude of the overall returns. The results indicate that CAAR starts becoming positive from 19th day in the pre-event window; observe a positive pattern till the last day of the event widow. The CAAR value of 19th day in the pre-event window starts from 0.08 per cent and reaches to a peak of almost 3.65 per cent on one day after the announcement and settles at 0.56 per cent on the last day of the event window.
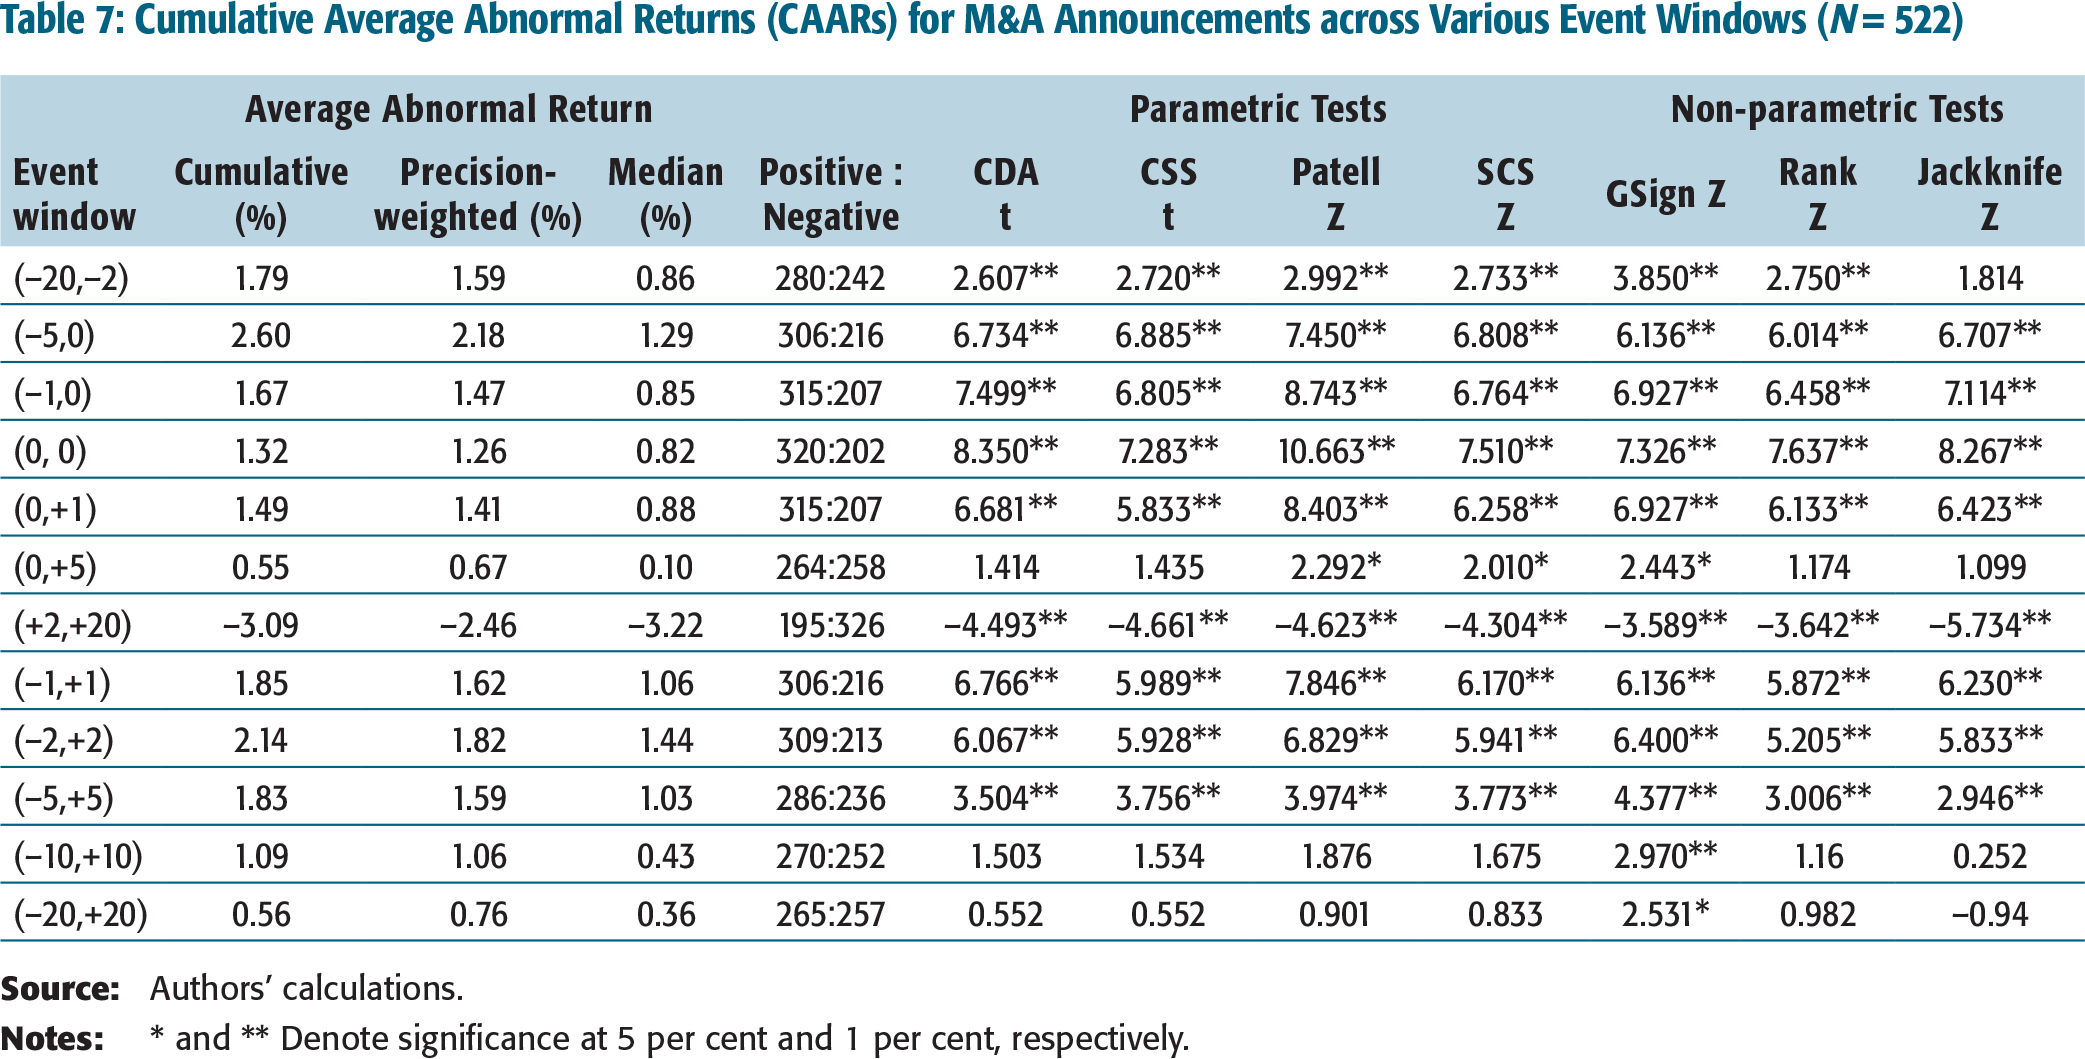
Furthermore, cumulative returns over various size event windows are calculated; this is to determine the important periods for investment perspective. Results are tabulated in Table 7. For the pre-announcement event windows (–20, –2) and (–5, 0), the CAAR values are 1.79 per cent and 2.60 per cent, respectively; these values are quite impressive. The CAAR is maximum (2.60%) and significant for window (–5, 0), making it the most important event window. Moreover, the AAR values of 0.36 per cent on one day before the announcement, 1.32 per cent on the announcement day, and 0.18 per cent on one day after the announcement indicate that an investor can gain a substantial CAAR of 1.85 per cent if the shares of the issuing company are purchased one day prior to the announcement day and sold one day after the announcement day. Furthermore, the CAAR values of 1.85 per cent, 2.14 per cent, 1.83 per cent, 1.09 per cent, and 0.56 per cent for the event window (–1, +1), (–2, +2), (–5, +5), (–10, +10), and (–20, +20), respectively, signify that the short-term impact of M&A announcements is remarkable for the investors. The results across the windows (–1, +1), (–2, +2), and (–5, +5) are significant at 1 per cent. However, the positive ARs do not sustain as indicated by the negative CAAR during the post-event window (+2, +20). The results indicate that the earlier the investor sells, the more he gains.
The positive returns observed on announcement and during the pre-event window are in sync with the expectation of the Indian managers to realize synergies and synergy hypothesis. Perhaps, this may be due to the reason that companies acquire another company for a strategic reason such as to exploit the economies of scale and scope, and leverage available resources and capabilities, thus creating more scope for value creation. M&A provide an opportunity to the acquiring company to combine and judiciously utilize intangible resources of both the companies on a broader scale.
Cumulative Average Abnormal Returns (CAARs) for M&A Announcements across Various Event Windows (N = 522)
Analysis of Cross-border Effect
The analysis of ARs for the cross-border and domestic M&A reveals that acquirers’ shareholders earn AAR of 1.60 per cent (significant at 1 %) on the announcement day for cross-border M&A. The proportion of stocks having positive return on the announcement day is more than 66 per cent. The proportion of stocks having positive return is significant at 1 per cent. Moreover, the value of PWAARs and MARs are 1.50 per cent and 1.15 per cent, respectively. The table also shows that the acquirer shareholders experience the CAAR of 2.74 per cent during the event windows of 11 days (–5, +5) and 2.64 per cent during the event windows of five days (–2, +2). CAAR during the pre-event window of 19 days (–20, –2) is 2.22 per cent. CAAR during the short-event window of two days (–1, 0) and that of three days (–1, +1) are 2.07 per cent and 2.31 per cent, respectively. The maximum CAAR of almost 3 per cent (2.97 per cent) is observed during the pre-event window of six days (–5, 0). All these results are significant at 1 per cent.
One notable finding is that the positive CAAR along with impressive precision-weighted CAAR sustain for longer-event windows of 21 days (–10, +10) and 41 days (–20, +20). But the positive ARs do not sustain during the post-event window of 19 days (+2, +20). The negative ARs are 2.79 per cent (significant at 1 %) for the post-event window (+2, +20).
The results of the market reaction to the announcements of domestic M&A show that acquirers’ shareholders earn the AAR of 1.04 per cent (significant at 1 per cent) on the announcement day for domestic M&A. The proportion of stocks having positive return on the announcement day is more than 57 per cent. The proportion of stocks having positive return is significant at 1 per cent. Moreover, the value of PWAARs and MARs are 0.98 per cent and 0.52 per cent, respectively. The CAAR of domestic acquisitions during the pre-event window of 19 days (–20, –2) is positive (1.38 per cent). Furthermore, the acquirers’ shareholders experience the CAAR of 1.66 per cent during five event days (–2, +2) and 0.96 per cent during the event windows of 11 days (–5, +5). CAAR during the short-event window of two days (–1, 0) and three days (–1, +1) is 1.29 per cent and 1.41 per cent, respectively. The maximum CAAR of 2.25 per cent is observed during the pre-event window of six days (–5, 0). All these results are significant at 1 per cent. The positive ARs do not sustain in the case of domestic acquisitions also. The negative ARs are 3.38 per cent (significant at 1 per cent) for the post-event window (+2, +20). In the case of domestic M&A also, the market, in general, reacts positively to M&A announcements. Later, a strong correction in the market price of the acquiring company takes place as almost all the CAAR values during the post-announcement period are negative.
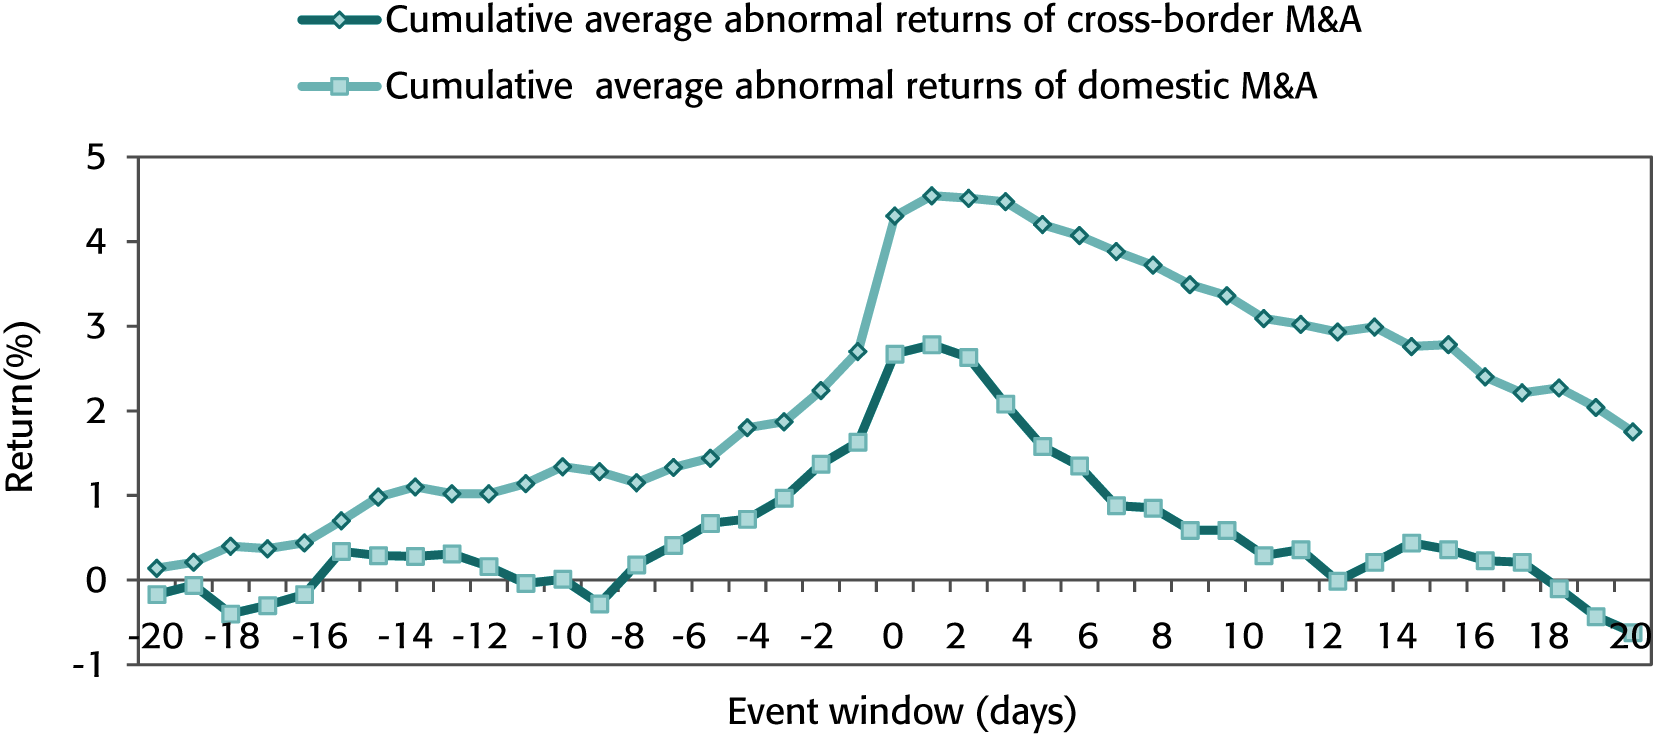
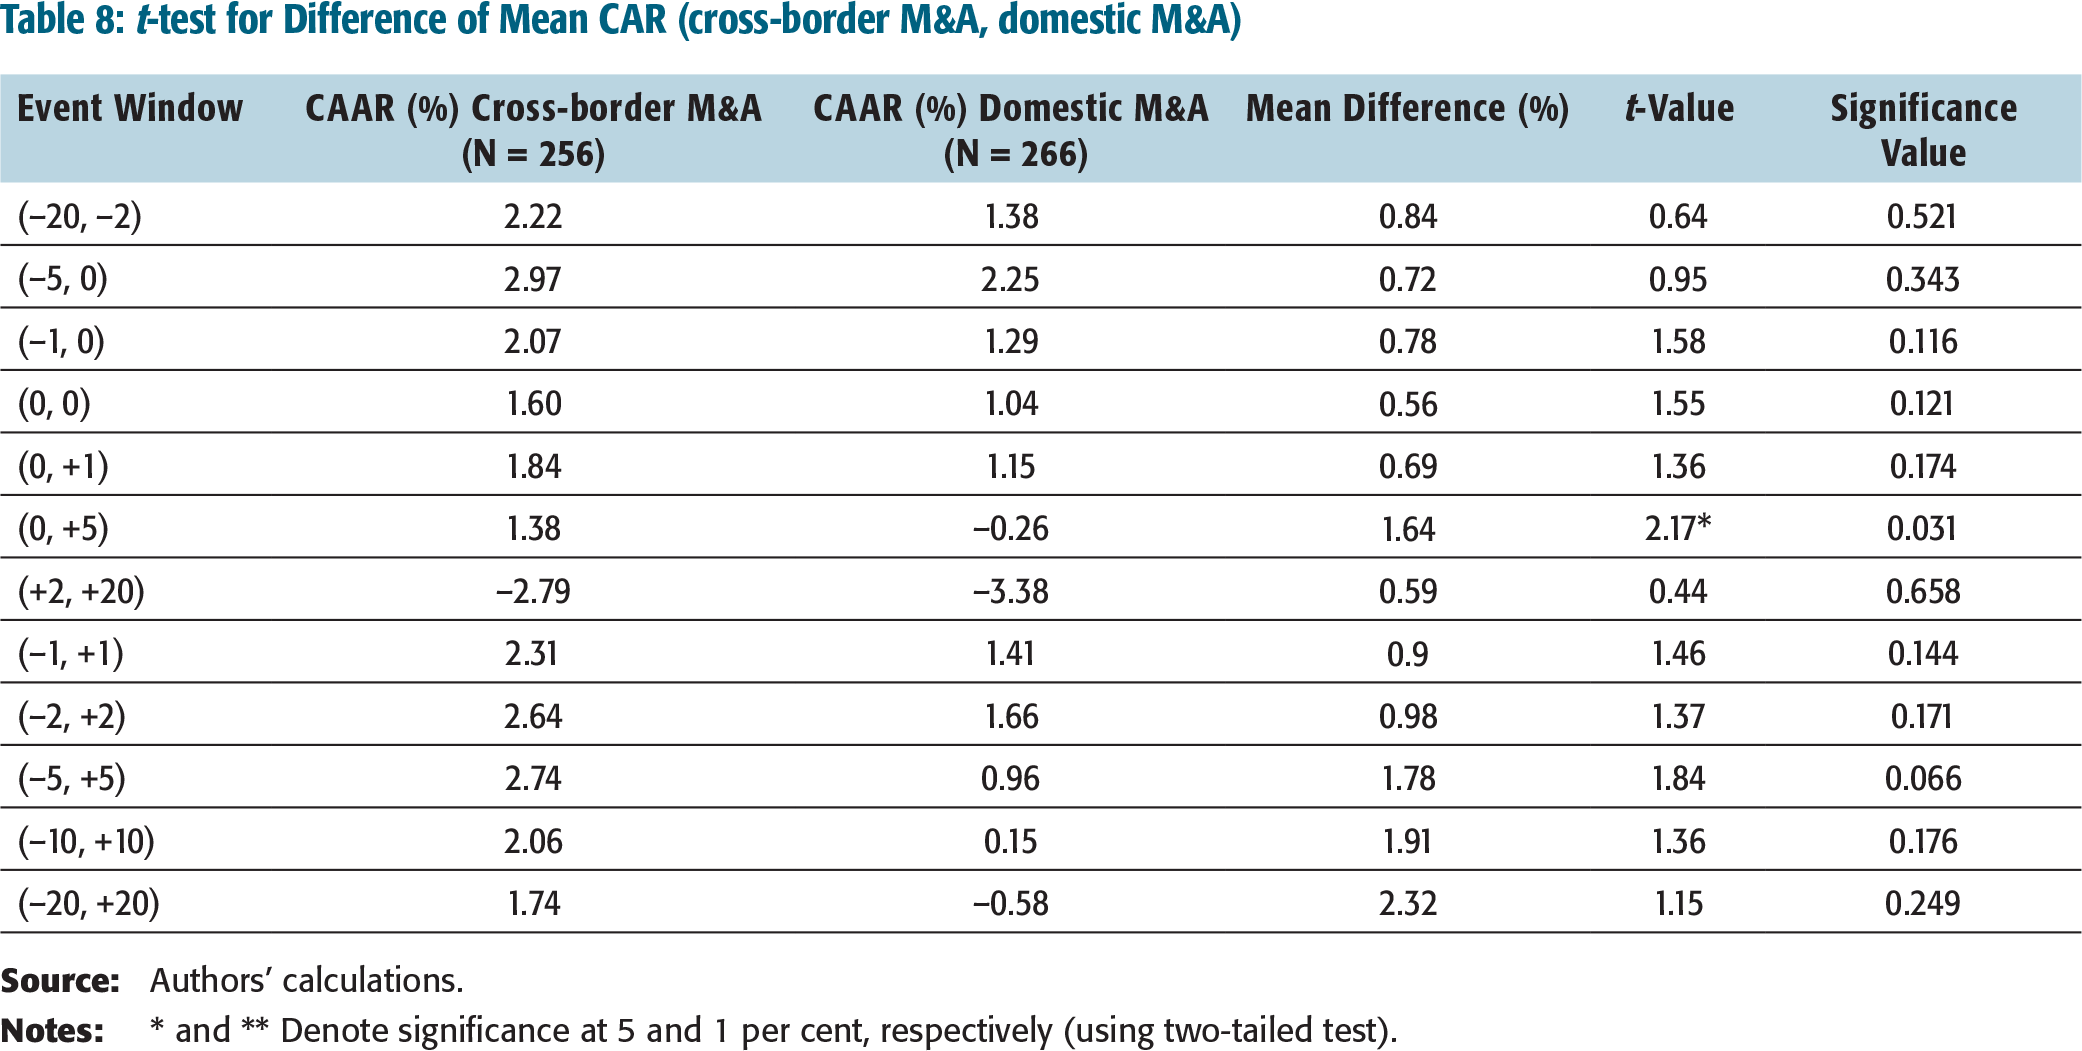
Independent t-test has been conducted to measure the difference between the CAAR of cross-border acquisition and domestic acquisitions; the results are tabulated in Table 8. It is apparent that the mean difference is positive for all the windows. However, the difference is significant (p-value = 0.031 < 0.05) only for the event window (0, +5). These results indicate that returns to acquirers’ shareholder of the cross-border acquisitions are higher than that to the domestic acquisitions. Furthermore, It is evident from the graph (Figure 3) that cross-border acquisitions enhance wealth over entire 41 days (–20, +20) period, whereas domestic acquisitions generate lower wealth and start falling in comparison to cross-border acquisitions.
CAAR during the Event Window (cross-border, domestic M&A)
t-test for Difference of Mean CAR (cross-border M&A, domestic M&A)
Analysis of Control Effect
The analysis of control effect reveals the ARs for the partial/majority control acquisitions of the target firm. AAR is 1.79 per cent (significant at 1 %) on the announcement day. PWAAR and MAR are 1.68 per cent and 0.96 per cent, respectively. Furthermore, the partial/majority control acquisitions generate maximum wealth (2.59 per cent) during the event window (–5, 0). CAAR during the short-event window of two days (–1, 0), (0, +1), three days (–1, +1), and five days (–2, +2) are 2.04 per cent, 1.96 per cent, 2.21 per cent, and 1.64 per cent, respectively; the results are also significant.
Notable finding is that partial/majority control acquisitions generate the positive CAAR of 1.47 per cent and 1.24 per cent during the longer event windows of 11 days (–5, +5) and 21 days (–10, +10), respectively. However, the results are not significant. The positive ARs do not sustain during the post-event window of (+2, +20) onward; the negative ARs are 2.99 per cent for the post-event window (+2, +20). However, the results are not significant.
In marked contrast, complete acquisitions generate the positive CAAR of 3.31 per cent (significant at 1 per cent) along with the impressive PWCAAR of 2.67 per cent during the pre-event window of 19 days. Furthermore, the acquirers’ shareholders of complete acquisitions earn 1.33 per cent and 1.23 per cent AAR and PWAAR, respectively, on the announcement day. The CAARs during the event window of 3 days (–1, +1), 5 days (–2, +2), and 11 days (–5, +5) are 1.93 per cent, 2.47 per cent, and 2.63 per cent, respectively; moreover, the returns are significant.
The most revealing finding is that the acquirer’s shareholders earn 2.94 per cent, 2.12 per cent, and 2.63 per cent during the longer event windows of 41 days (–20, +20), 21days (–10, +10), and 11 days (–5, +5), respectively. In the case of complete acquisitions, the market, in general, reacts positively to announcements and remains positive during the entire event window.
A study of target firms to be absorbed totally with the acquirer’s operations reveals that the acquirer’s shareholders experience the return of 1.13 per cent (significant at 5 %) over the event window of two days (–1, 0). The CAAR is positive for only five days (–2, +2) in the case the target firm is totally absorbed with the acquirer. The CAAR is negative for the pre-event window of 19 days (–20, –2), post-event windows and event windows of 11 days (–5, +5), 21 days (–10, +10), and 41 days (–20, +20).
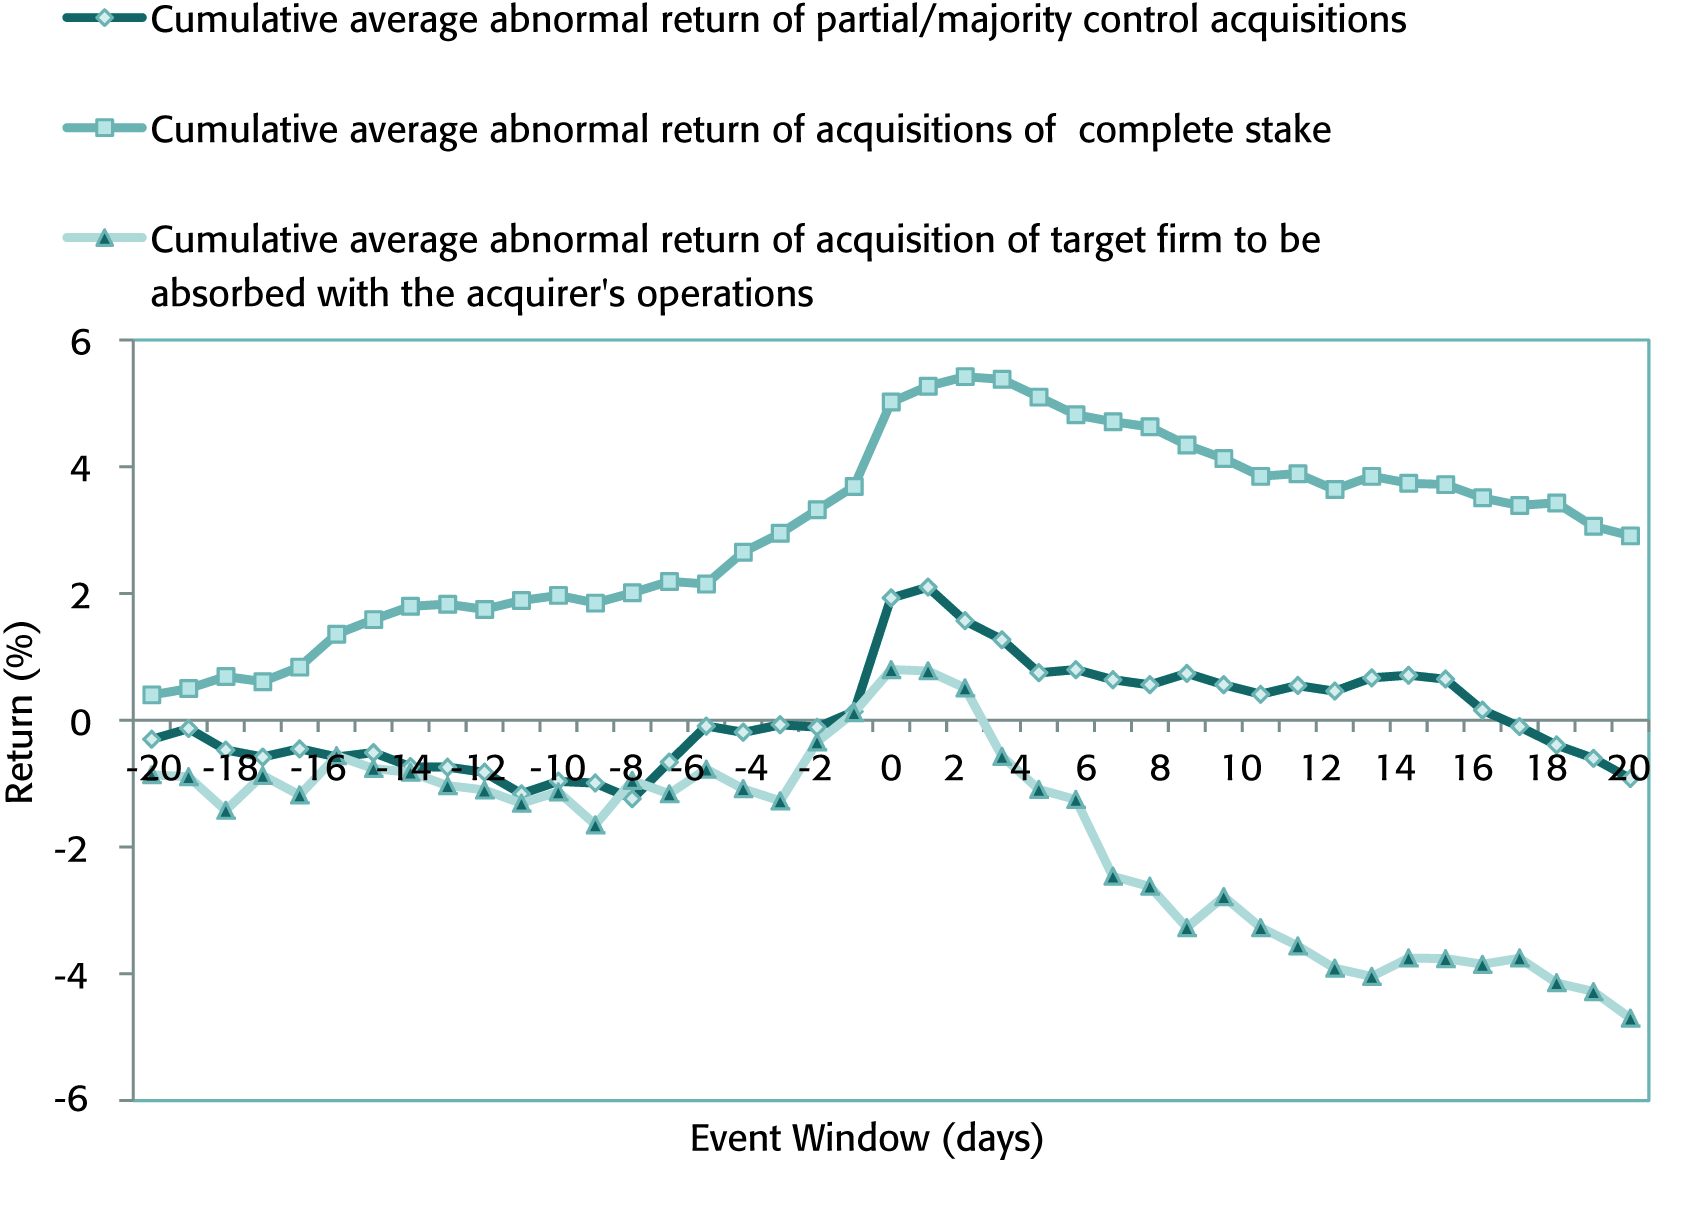
The above results lead to the conclusion that, although the announcement of the acquisition of the target firm to be totally absorbed with the acquirers’ operations induces positive reaction, this reaction is temporary in nature and gets diluted soon. Moreover, the reaction is not very strong; it gets nullified within a short duration of five days as also indicated by the trend of CAAR depicted in Figure 4.
CAAR during the Event Window (partial/majority control, complete control, target firm to be absorbed with acquirer’s operation)
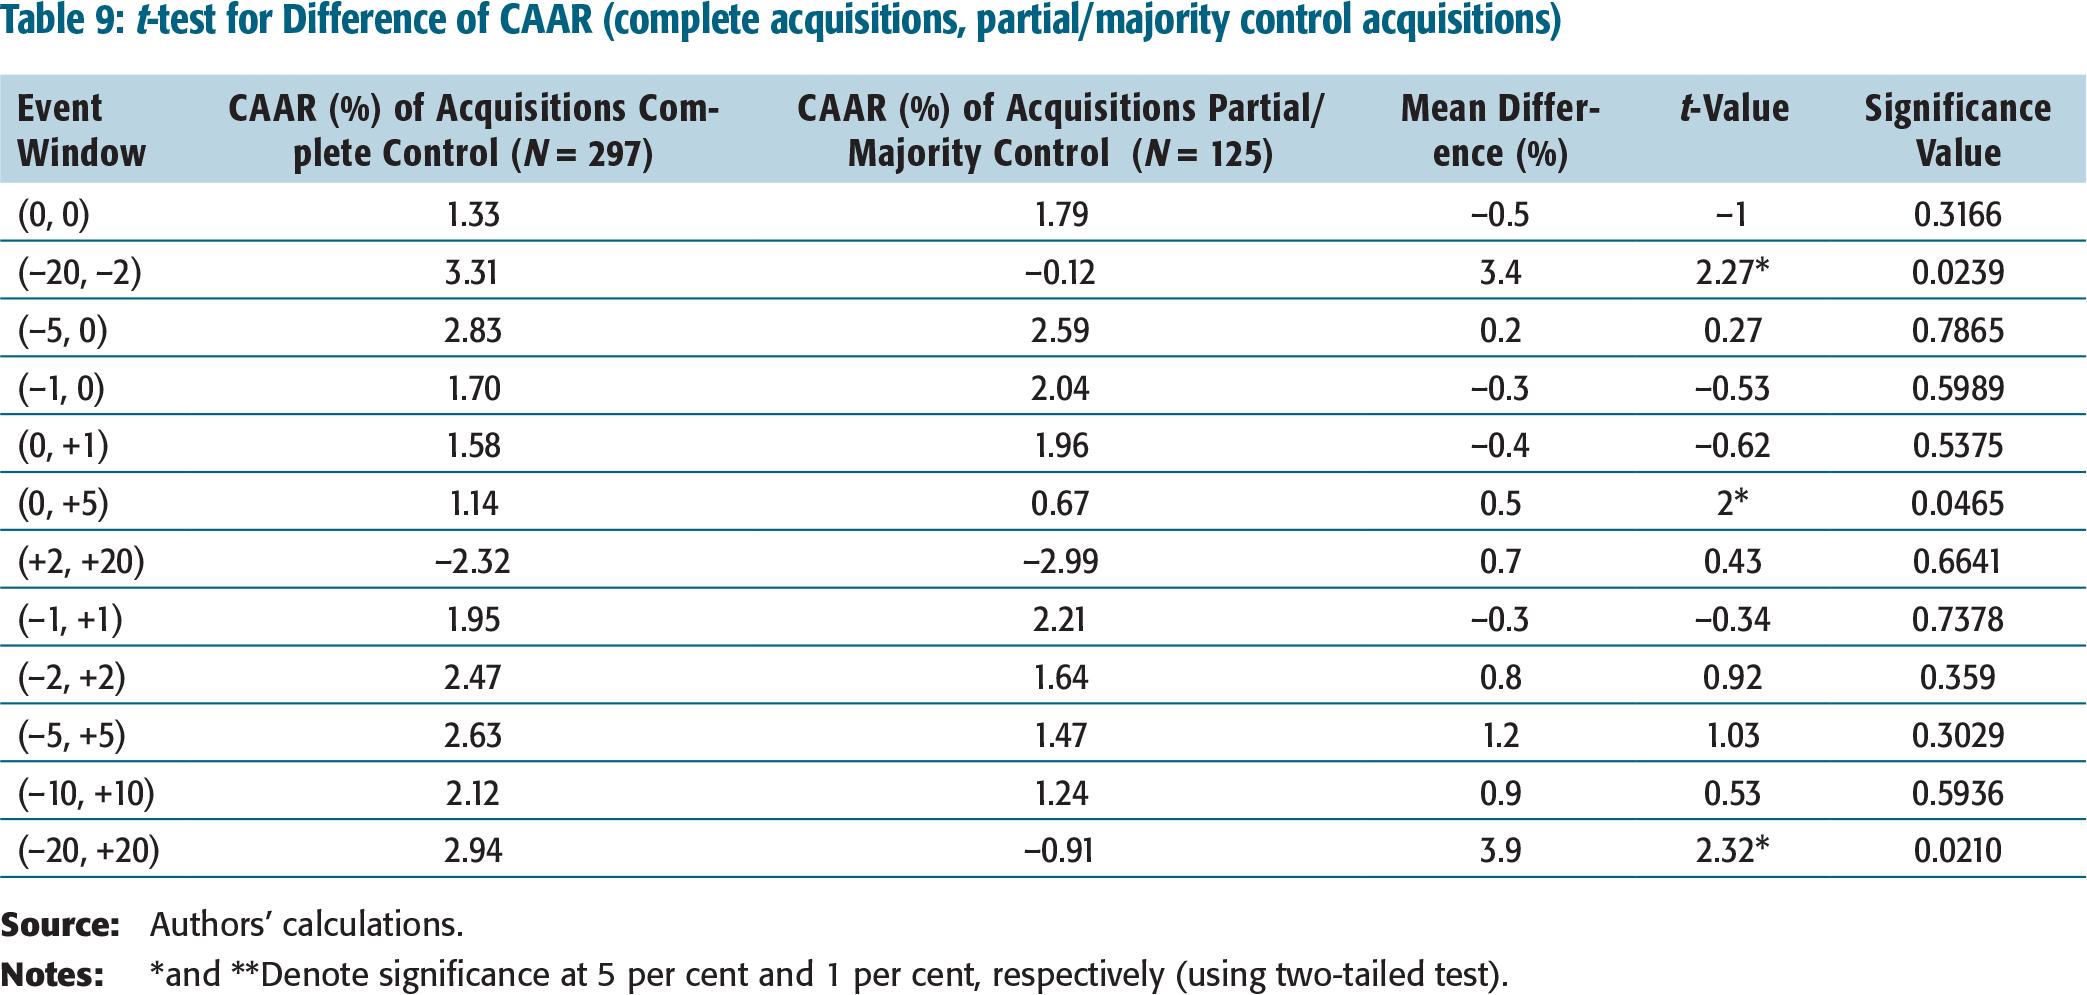
The results of t-test to measure the difference between the CAAR of complete and partial/majority control acquisitions of the target firm are tabulated in Table 9. The mean difference is positive for all the windows except the event windows around the announcement. Moreover, the difference is also significant at 5 per cent for the pre-event window of 19 days (p-value = 0.0239 < 0.05), 6 days (p-value = 0.0465 < 0.05), and the longer event window of 41 days (p-value = 0.021 < 0.05). On the basis of these results, it may be concluded that the complete acquisition of the target firm generates higher ARs than that of the partial/majority control acquisition.
t-test for Difference of CAAR (complete acquisitions, partial/majority control acquisitions)
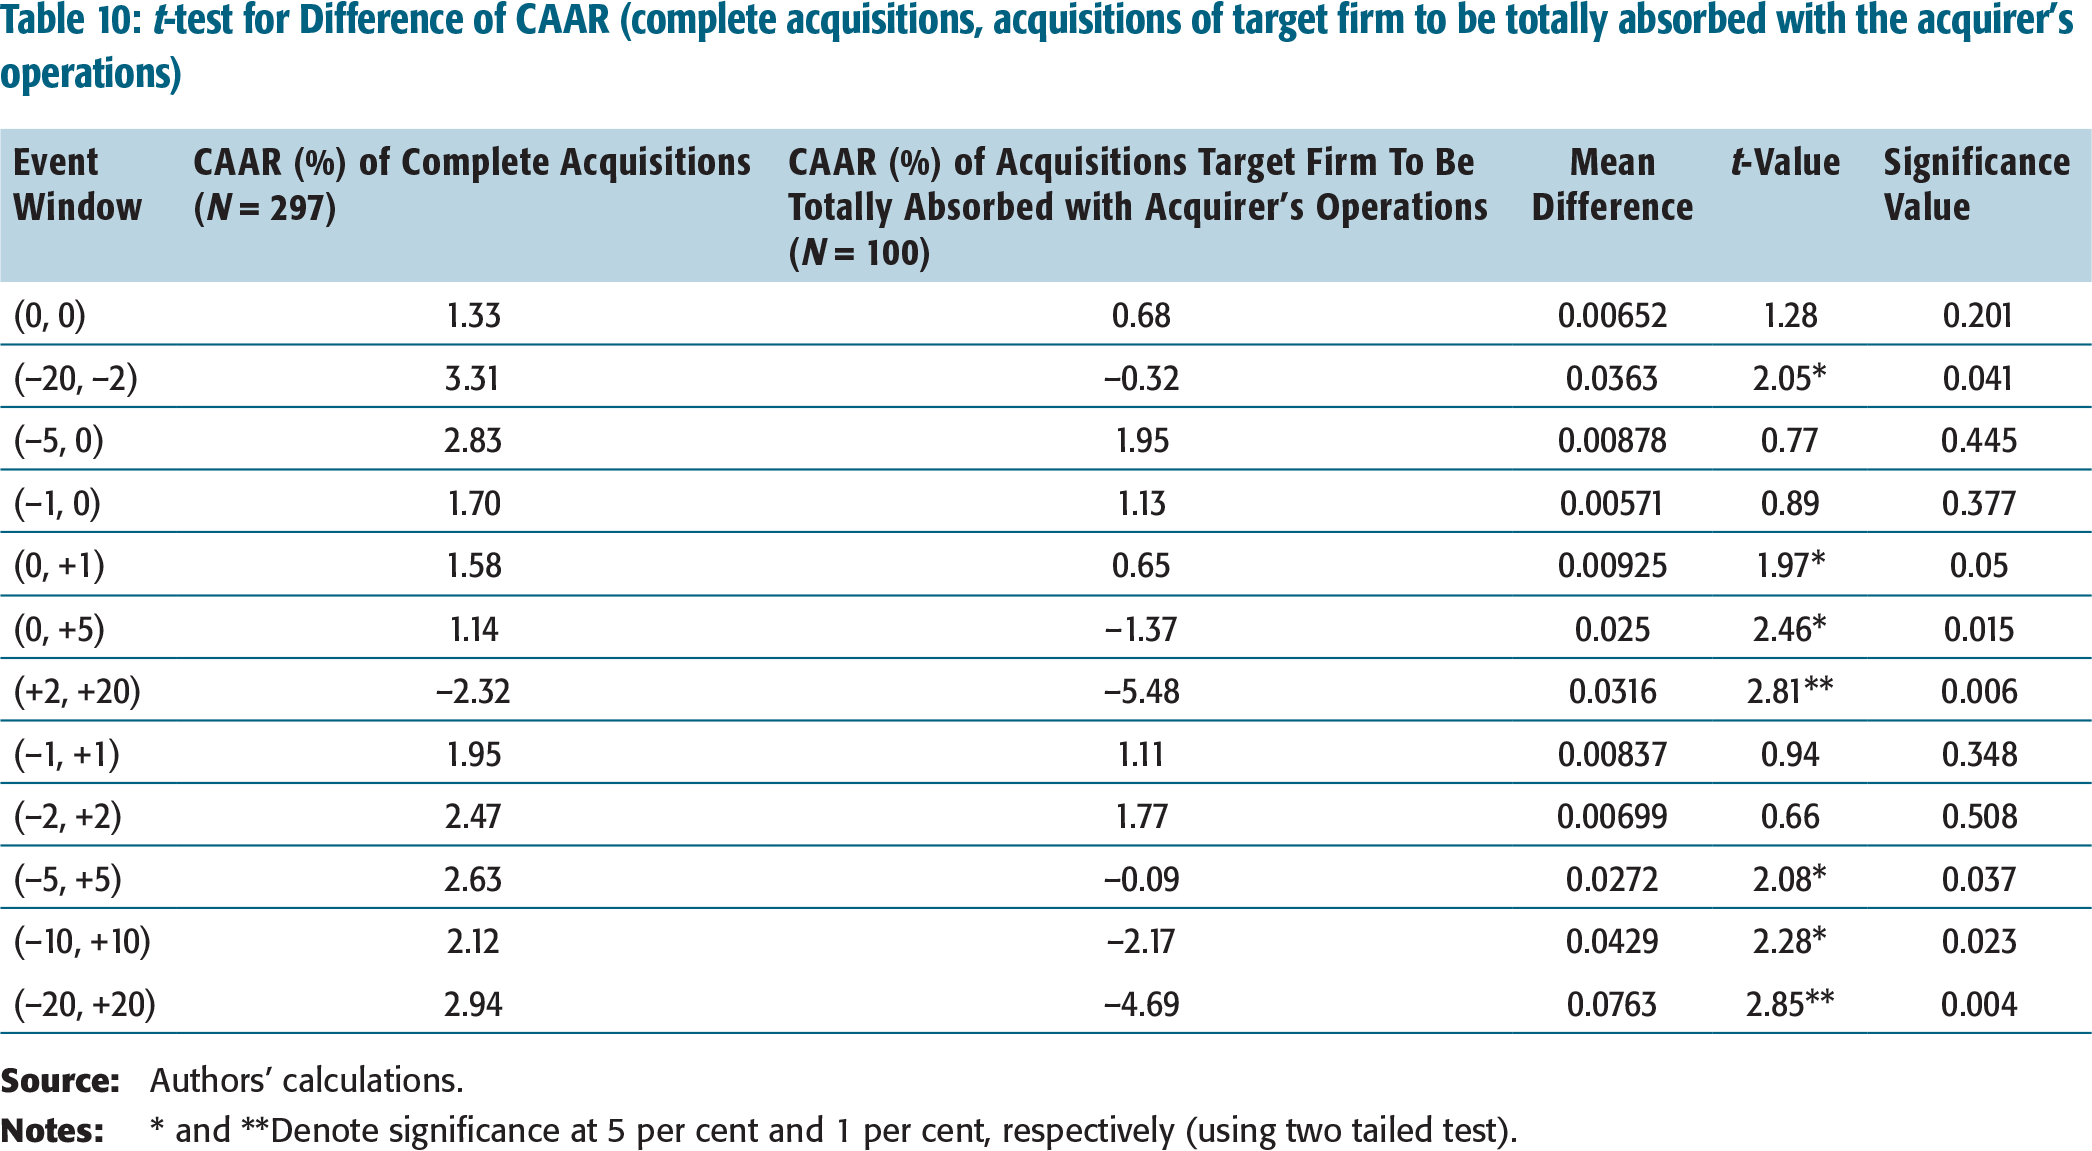
The results tabulated in Table 10 to measure the difference between the CAAR of complete acquisition and acquisitions of the target firm to be totally absorbed with the acquirer’s operations shows that the mean difference is positive for all the event windows. Moreover, the difference is significant for the pre-event window of 19 days (p-value = 0.041 < 0.05), event window of 11 days ( p-value = 0.037 < 0.05), 21 days (p-value = 0.023 < 0.05), 41 days (p-value = 0.004 < 0.05), and all the post-event windows of 6 days (p-value = 0.015 < 0.05), 2 days (p-value = 0.05 < 0.05), and 19 days (p-value = 0.006 < 0.05).
On the basis of the above findings, it is reasonable to conclude that complete acquisition of the target firm as a WOS generates higher ARs than the acquisition of the target firm to be totally absorbed with the acquirer’s operations. Furthermore, complete acquisition of the target firm as a WOS generates maximum ARs; complete acquisition of the target firm to be totally absorbed with the acquirer’s operations earns minimum ARs. The acquisitions of complete control as a WOS earn positive ARs for the entire event window of 41 days (–20, +20) as depicted in Figure 4.
The advantages of acquiring complete control of a firm arise from assets owned and capacity to acquire complimentary assets. The lack of requisite voting power2 to pass a special resolution, less autonomy, and difficulty in the integration process post-acquisitions also seems to be a factor for lower ARs in the case of partial/majority control acquisitions. Furthermore, the problems of post-acquisitions integration in the case of complete acquisitions of the target firm to be totally absorbed with the acquirer’s operations may be a reason for negative market reaction in the case of absorptions. Zhu, Jog, and Otchere (2011) and Spencer, Akhigbe, and Madura (2001) also find that the long-term performance of partial acquired firms is highly dependent on the corporate control characteristics of the target and the acquiring firms. Aybar and Ficici (2009) also find support for the positive impact of the stake pursued in the acquisition of the target firm.
Analysis of Listing Effect
t-test for Difference of CAAR (complete acquisitions, acquisitions of target firm to be totally absorbed with the acquirer’s operations)
One notable finding is that the acquisition of the unlisted target firm generates positive CAAR during the pre-event windows as well as event windows. But the positive returns do not sustain during the post-event window. The negative ARs are 2.94 per cent for the post-event window (+2, +20); however, the results are not significant.
From the results of the acquisition of the listed target firms, it is evident that the CAAR values of 1.94 per cent, 0.84 per cent, and 0.15 per cent for the event windows (–2, +2), (–5, +5), and (–10, +10), though positive, are not statistically significant.
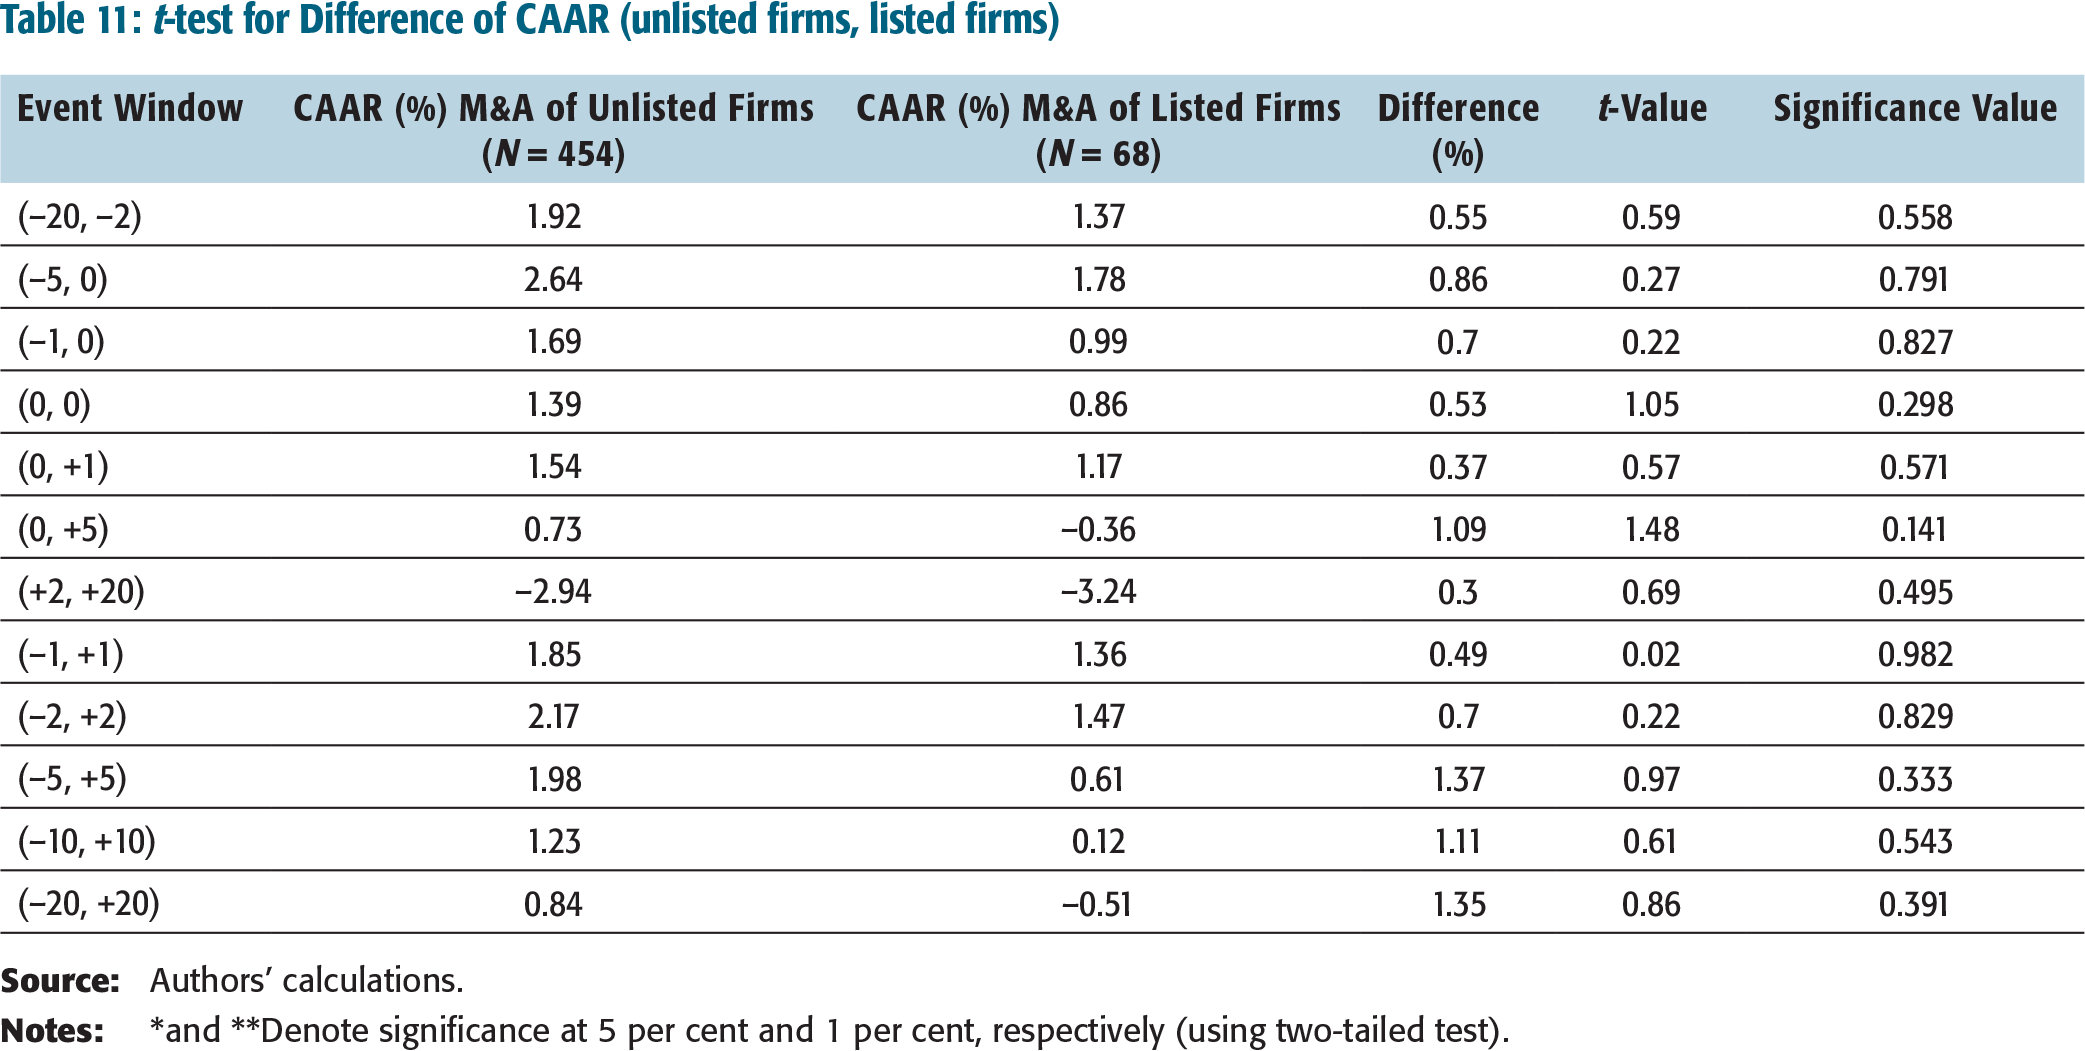
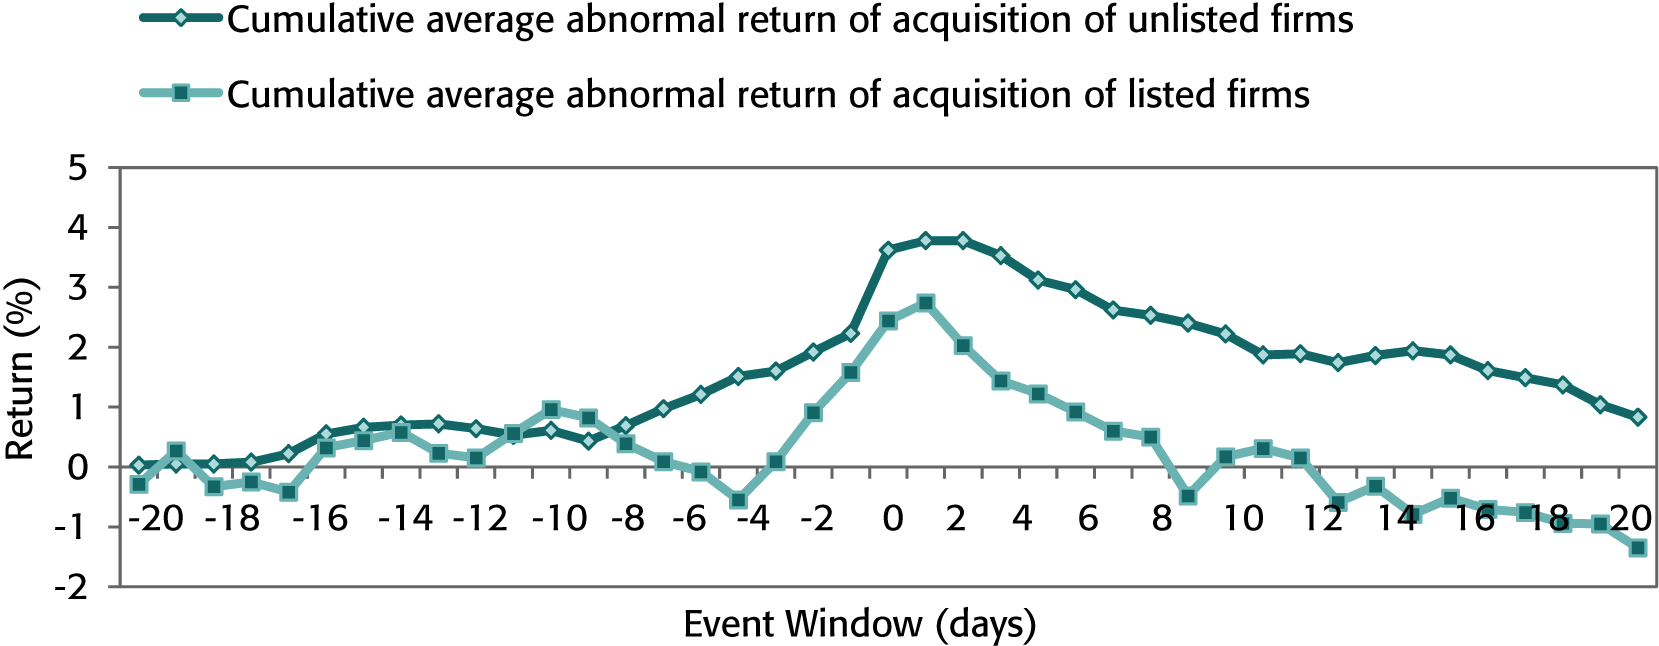
During the post-announcement windows (0, +5) and (+2, +20), there is a consistent fall in the CAAR values indicating that even insignificant positive reaction is almost nullified by the negative reaction (the peak value of CAAR declines from 2.74 per cent on day t(+1) to –1.35 per cent on day t(+20)). Furthermore, it is apparent from Table 11 that the mean difference between the CAAR of M&A unlisted and listed target firms is positive for all the windows; however, the difference is not significant for any event window. However, it is important to note that on the whole, unlisted target firms perform better than their public counterparts, also corroborated by Figure 5.
t-test for Difference of CAAR (unlisted firms, listed firms)
CAAR during the Event Window (unlisted target firms, listed target firms)
The lack of liquidity of unlisted firms reduces their bargaining power which, in turn, reduces higher premiums from the acquirers. This creates value for the acquirer. Furthermore, agency problems are more likely for acquirers of listed firms but do not apply to acquirers of unlisted target firms, which may be a major reason of lower returns for the acquisition of listed firms. The plausible reason for the better performance of unlisted target firms could also be explained by the fact that these firms are relatively small compared to public companies; these are generally owned by a small group of people; their monitoring and controlling can be exercised effectively, thereby leading to a reduction in agency cost and better wealth gains. Draper and Paudyal (2006), Conn, Cosh, Guest, & Hughes (2005), Fuller, Netter, and Stegemoller (2002), and Chang (1998) have also observed the similar findings.
Analysis of Payment Effect
In making an acquisition, the acquiring firm can pay either in cash or stock. The mode of payment can influence the acquirer’s performance. The results of M&A financed with cash payment show that the CAAR values across various pre-announcement event windows (–20, –2) and (–5, 0) are 2.16 per cent and 2.56 per cent (significant at 1 per cent level), respectively. The CAAR during the event windows (–1, 0), (0, +1), (–1, +1) (–2, +2), and (–5, +5) are 1.71 per cent, 1.6 per cent, 1.96 per cent, 2.21 per cent, and 2.13 per cent respectively; these values are significant at 1 per cent. The CAAR values of 1.29 per cent and 0.81 per cent for the event windows (–10, +10) and (–20, +20), though positive, are not statistically significant. During the post-announcement window of (+2, +20), there is a consistent fall in the CAAR values.
The study further reveals that the market reacts negatively to the announcement of acquisitions financed with stock. The acquirer shareholders experience negative ARs (not statistically significant) during the pre-event window (–20, –2). The CAAR values of 1.98 per cent, 0.94 per cent, and 1.28 per cent for the event windows (–5, 0), (–1, 0), and (–2, +2), respectively, though positive, are not significant.
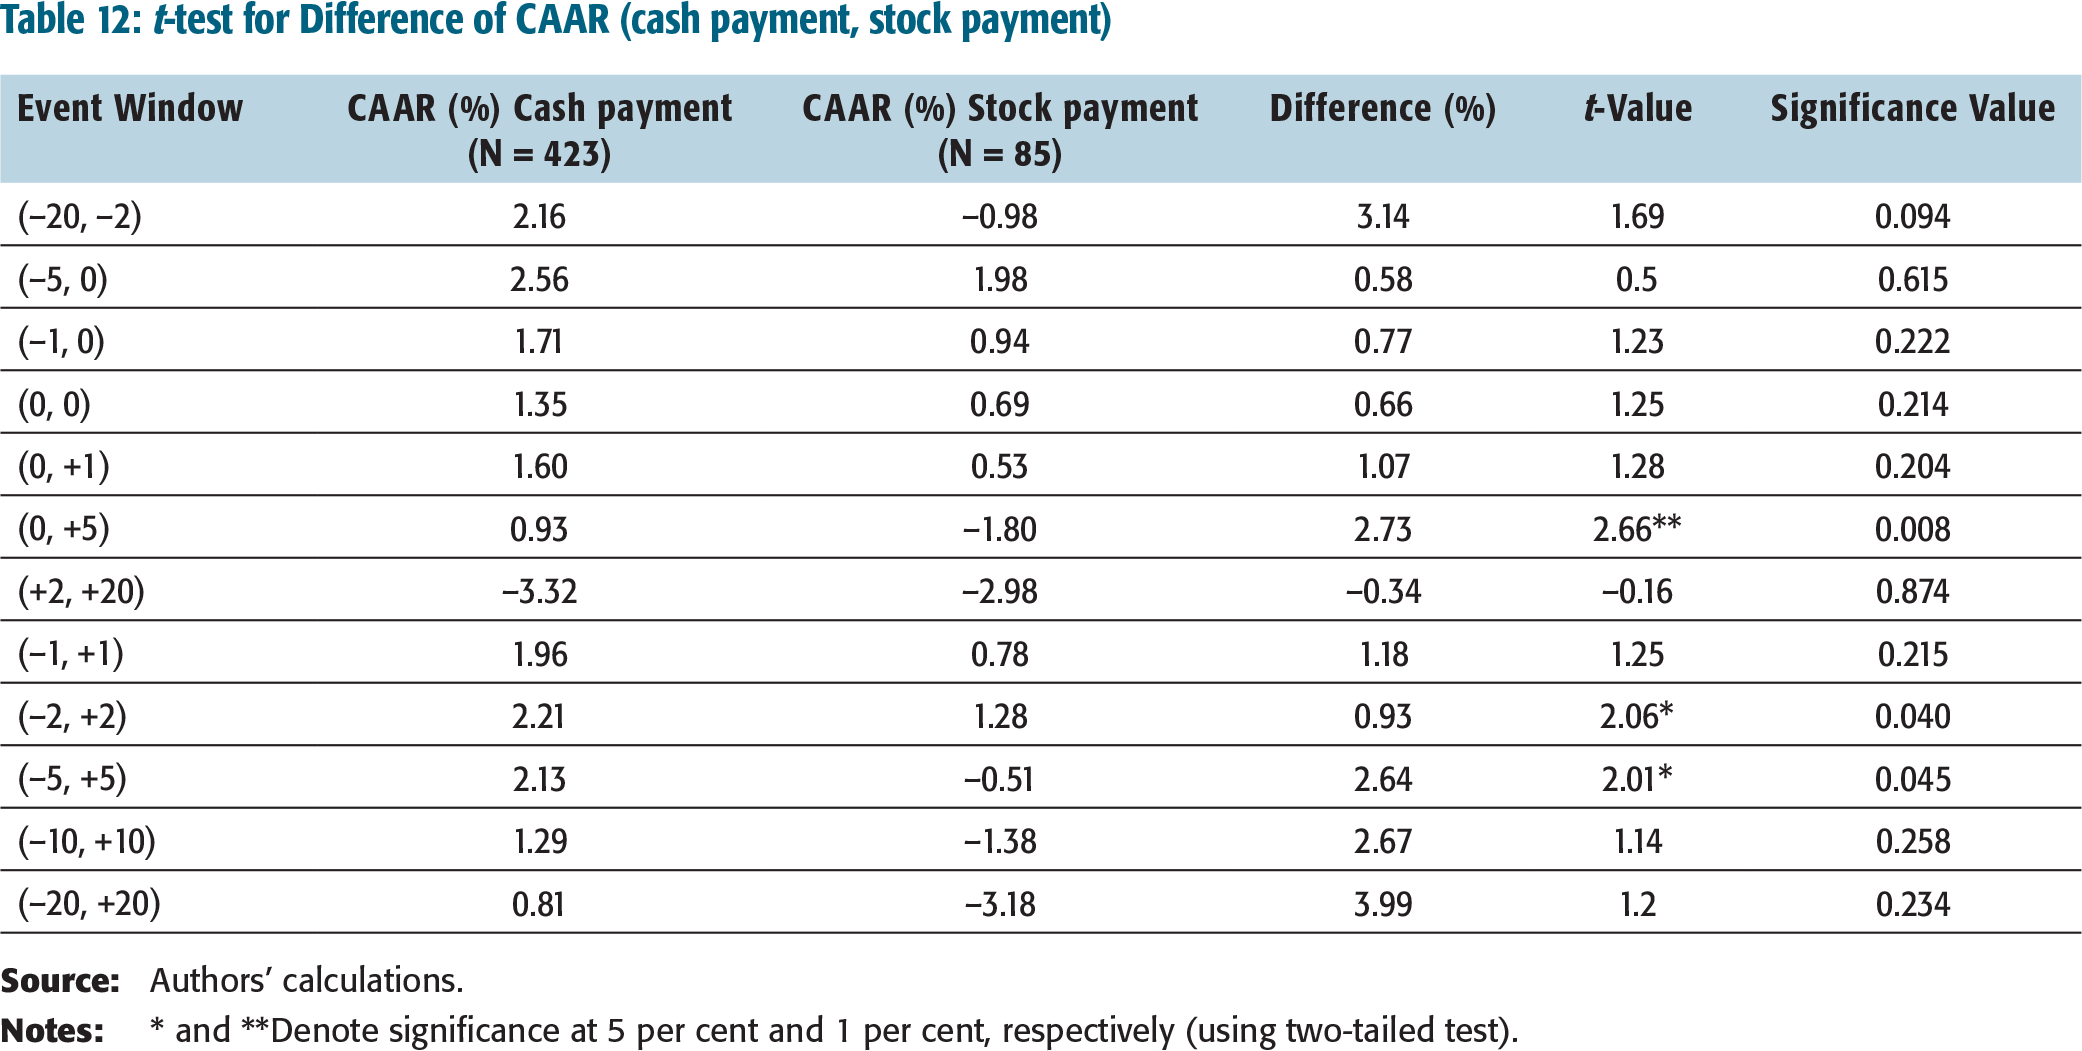
Table 12 presents the results of t-test conducted to measure the difference between the CAAR of acquisitions when cash and stock is employed as the mode of payment. The mean difference is positive for all the windows. However, the difference is significant for the event window [(0, +5) (p-value = 0.0008 < 0.05)], [(–2, + 2) (p-value = 0.040 < 0.05)], and [(–5, +5) (p-value = 0.045 < 0.05)]. Figure 6 corroborates the conclusion that the market reaction is positive for cash financed M&A and negative for stock financed M&A.
t-test for Difference of CAAR (cash payment, stock payment)
CAAR during the Event Window (cash, stock)
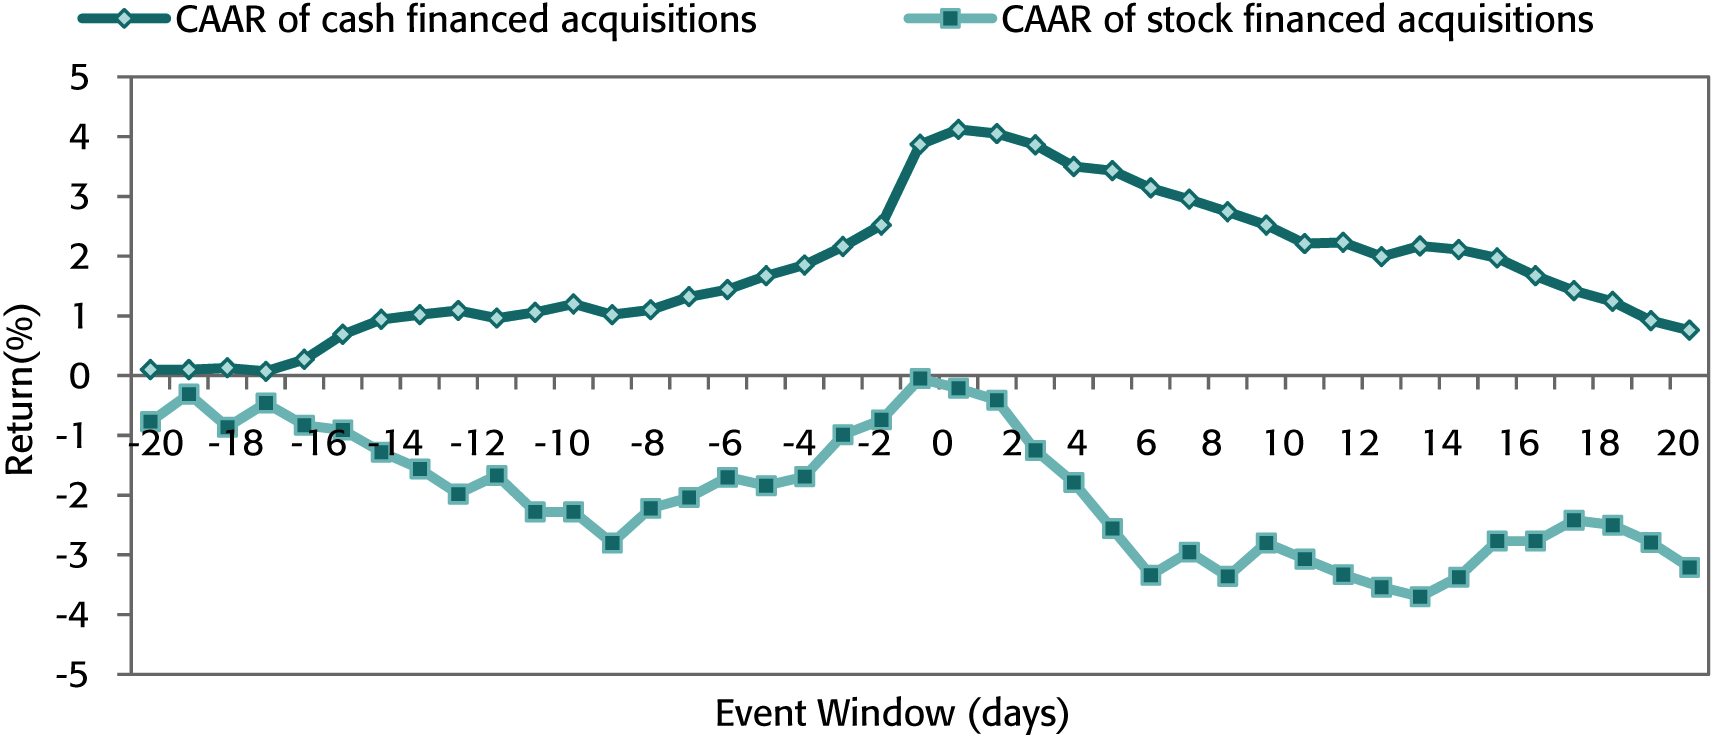
Shareholders of the acquiring firm perceive lesser chances of dilution of earnings per share (EPS) of the stock of the acquiring firm in case the acquisition is financed with cash. The issue of a new stock may erode the wealth of the existing shareholders by diluting EPS. The acquisitions, financed with cash, experience higher returns than the acquisitions financed with stock; that could be a signal in favour of ‘asymmetric information hypothesis and free cash flow hypothesis’. Shareholders of the acquiring firm perceive higher chances of dilution of EPS of the stock of the acquiring firm in case the acquisition is financed with the stock. The issue of a new stock may erode the wealth of the existing shareholders by diluting EPS. On the basis of the above findings, it is reasonable to conclude that ‘issuance of new stock for M&A is a bad news for the market’. The finding is in agreement with financial theory (Myers & Majluf, 1984), suggesting that the issuance of stock is viewed negatively by capital markets; the results are also in line with the empirical evidence with respect to stock issues (DeAngelo, DeAngelo, & Rice, 1984; Hansen, 1987; Jensen, 1986).
CONCLUDING OBSERVATIONS
The empirical research presents evidence that the market usually reacts positively to the M&A announcements. The study reveals that the shareholders of acquirer Indian corporations engaged in M&A experience a significant positive AR on the announcement day as well as CARs over small multi-days event windows around the announcements. The findings suggest that M&A result in wealth creation for shareholders of the Indian acquirers and the gains are significantly positive during the event window of two days, three days, and five days surrounding the announcement. However, a strong correction in the market price of the acquiring company takes place post-announcement and positive ARs do not sustain. Due to this correction, the CAAR values turn negative during the post-event window. As per the findings, the most beneficial investment window for the investors is (–5, 0), as the returns provided to the investors during this window are maximum. This implies that the investors associate information content with the M&A announcements. The M&A can be treated as a tool to augment the wealth of the shareholders. However, the wealth creation is limited to the small windows around the announcement.
Although the positive reaction has been observed in all the subsamples, the stock return behaviour differs. The magnitude of the excess returns is much larger for cross-border acquisitions, unlisted target firms, cash payment for M&A, and complete control on the target firm as a wholly-owned subsidiary than that for domestic acquisitions, listed target firms, stock payment, and partial control. These findings are consistent with other studies on the same subject.
Keeping the investment perspective in mind, an investor can earn substantial returns if he purchases the shares within five days before the news of M&A comes to the market and sells one day after the announcement. An investor can also gain if the shares of the acquiring company are purchased two days prior to the announcement day and sold two days after the announcement day. Conclusion may be summed up as ‘the earlier he sells, the more he gains’ and ‘the issuance of stock is not good news’.
These findings have certain implications for the corporate managers and the policy makers as well. They bring attention of the managers to consider cross-border as well as domestic acquisitions as an option to strengthen their competitiveness as the effects of these announcements appear to be a good indicator of longer-term success.
The study suggests that the Indian managers could adopt M&A as an effective strategy for corporate growth. The findings also bring attention of the managers about stock versus cash as a mode of payment to finance M&A. Issuance of shares is not as good as payment in cash as revealed in market reaction to acquisitions financed with stocks. Third, implication for management is to note the revealing finding of the substantial return when the target firm is acquired as a subsidiary. The management may acquire the target firm as a subsidiary and may absorb it with its own operations later on. The advantages of acquiring complete control of a firm arise from assets owned and capacity to acquire complimentary assets.
The positive returns observed on announcement and during the pre-event window are in sync with the expectation of the Indian managers to realize synergies. Perhaps, this may be due to the reason that companies acquire another company for a strategic reason, so as to exploit the economies of scale and scope, and leverage available resources and capabilities, thus creating more scope for value creation. M&A provide an opportunity to the acquiring company to combine and judiciously utilize intangible resources of both the companies on a broader scale. It seems that Indian companies have managed to develop their acquisition capabilities over time.
The market responds positively if the acquisition is considered value-adding to the acquiring company. Indian firms use cross-border acquisitions for strategic assets seeking in order to facilitate strategic and organizational transformation of the firms. Moreover, access to developed markets for products, resources, and capabilities enable Indian firms to leapfrog to the global league and thus create greater value than what could be achieved by acquiring a domestic firm. Over the years, the Indian firms, especially, in technology-intensive industries such as pharmaceutical sector and information technology had established their base as low-cost product or service providers on mass scale. The cross-border acquisitions complement the acquiring firms with necessary technological, management expertise and international customer base to compete in overseas markets.
This study contributes to the literature on the performance of M&A in the short term. Methodologically, the present study has demonstrated the use of the seven major significance tests to check the robustness of AARs and CAARs. The use of seven main test-statistics for assessing significance levels of ARs have proved to be useful, since these test-statistics take into account effects due to event-induced variance and offers, therefore, an alternative evaluation of significance.
This study is limited to looking at the performance of acquiring firms. However, the understanding of industry-wise performance can be taken up separately. Furthermore, a study on the dynamic process of partial and majority control acquisitions leading to ultimate control behaviour will add useful insights to the understanding of M&A. Does an acquirer with extensive acquisition experience outperform an acquirer with little or no acquisition experience is another query which needs further attention.