
Abstract

Keywords
The US primary care is crippled with a shortage of primary care physicians, uneven distribution of physicians and increasing patient load. Home-bound patient-monitoring or tele-health-monitoring programmes offer a promising solution to reducing the primary care patient load problem.
This article presents a multi-resolution simulation method to assess the effectiveness of the home-bound patient-monitoring programmes in terms of patient satisfaction and system efficiency. In the first stage, an agent-based model is used to assess the patient satisfaction. In the second stage, the first-stage patient satisfaction results are fed to a system dynamics model to analyse the global behaviour of a primary care system supported by home-bound patient-monitoring programmes.
The study evaluates the results in three scenarios:
Satisfied patients are more than unsatisfied patients Satisfied and unsatisfied patients are balanced Satisfied patients are fewer than unsatisfied patients.
These three scenarios represent the success, equal adoption and failure of tele-health-monitoring programmes for primary care. It is interesting to notice that the method that combines the traditional care model and a home-bound patient-monitoring programme (hybrid care model) yields more beneficial results in scenario 1 than in either scenario 2 or scenario 3. As more and more patients shift from the satisfied state to the unsatisfied state (as scenario 1 morphs into scenario 2 and eventually into scenario 3), the outcomes of the hybrid care model closely resemble the outcomes of the traditional care model; the outcomes do not differ significantly in terms of patient wait time, doctor consultation time and vital signs monitoring time. The results further show that the allocation of dedicated resources for home-bound patients would improve the primary care system efficiency, increase the patient absorption capacity, reduce patient wait time, cut down vital signs monitoring time and shorten needless doctor–patient consultation time.
This study demonstrates the application of the multi-resolution simulation technique in assessing the effectiveness of home-bound patient-monitoring programmes for primary care. Overall, the simulation results support the adoption of tele-health-monitoring programmes.
The current US primary care is facing issues on three fronts: (a) a decrease in the number of primary care physicians (PCPs), (b) an uneven distribution of primary care practitioners and (c) difficulty in accessing primary care. In addition, the generation of baby boomers and the health care reform under the current US administration (insuring additional 33–43 million patients) might stress out the primary care providers in the near future. The failure to address the above-mentioned issues might cripple and render a primary care system incapable of absorbing the excessive patient load. Apart from the excessive patient load in primary care settings, there is the problem of communication across different care units. Poor communication eventually leads to poor patient satisfaction and unnecessary expenditure. Inefficient communication between PCPs and specialists, PCPs and emergency departments (EDs), physicians and source of diagnostic data, and hospital-based physicians and PCPs is elevating the problems in addition to the uneven load distribution.
The objective of this study is to investigate how home-monitoring programmes affect the ability of primary care to absorb the patient load. The initial step is to form a patient satisfaction model for a home-monitoring programme using the agent-based approach. Individual agents will be patients who have adopted the programme. The key patient behaviour monitored during the process is the patient satisfaction. At the micro level, the ‘patient satisfaction state’ of the patients will drive in/away the patients coming into the primary care system at the macro level. The primary care system is modelled using system dynamics. We discuss the various simulation approaches, the need to solve the US primary care patient load problem, view home-monitoring as one of the solutions to address the patient load issue and illustrate and discuss how to assess the effectiveness of home-monitoring programmes for the aforementioned problems using the combined AB and SD simulation models.
NEED FOR A NEW PARADIGM
In the US, there is an urgent need for a new paradigm in primary care due to high deficiencies in the current system. The primary care responsibilities in the country are distributed over several categories of practitioners: family physicians, general internists, geriatricians, general paediatricians, nurse practitioners (NPs) and physician assistants (PAs) (Bodenheimer & Pham, 2010). These individuals are grouped under a class termed primary care practitioners. Nurses, pharmacists, health educators, medical assistants and other health workers form an additive layer to the primary care practitioner base (Bodenheimer & Pham, 2010). The primary care clinics are usually located in the outpatient division of teaching hospitals (urban areas) and the community health centres. Community health centres are public or non-profit organizations that serve low-income and minority populations (Bodenheimer & Pham, 2010). We take a look at the current US primary care, which is facing issues on two fronts: (a) a decrease in the number of PCPs and (b) an uneven distribution of primary care practitioners leading to inaccessibility.
Declining Primary Care Physicians
The mid-1990s saw a rise in health maintenance organizations (HMOs) that based their care structure on primary care as the initial entry point for patients entering the health care system (Bodenheimer & Pham, 2010). The 1990s experienced an increase in PCPs from 67 to 90 for every 100,000 people, and the percentage of graduating US medical students pursing primary care careers grew from 15 per cent in 1992 to 40 per cent in 1997 (Bodenheimer & Pham, 2010; Steinwald, 2008). The widening income disparity between PCPs and specialists coupled with increasing clinical workload led to the decline in the number of the US medical students opting for primary care careers (Bodenheimer, 2006; Bodenheimer & Pham, 2010). In 2005, approximately 300,000 physicians, and another 100,000 NPs and PAs provided medical care in the US (Bodenheimer & Pham, 2010). Although these figures may seem impressive, they do little to solve the primary care crisis especially when one considers the current and the future state of primary care. Population growth and ageing population are estimated to increase the workload of adult primary care practitioners by 29 per cent from 2005 to 2025, while the number of adult primary care practitioners is estimated to grow by only 2–7 per cent (Bodenheimer & Pham, 2010). The estimated shortage of adult primary care practitioners is projected to be in the 35,000–44,000 range (Bodenheimer & Pham, 2010). Including NPs and PAs, the ratio of primary care practitioners to population is estimated to decline by 9 per cent from 2005 to 2020 (Bodenheimer & Pham, 2010).
It is, therefore, important to develop new strategies to ensure the availability of adequate primary care practitioners in order to address the existing and future primary care patient demands.
Uneven Distribution of Primary Care Practitioners Leading to Inaccessibility
The uneven distribution of PCPs (100 PCPs: 100,000 urban population and 46 PCPs: 100,000 rural population) means that 21 per cent of the US rural population is serviced by 10 per cent of the PCPs (Bodenheimer & Pham, 2010). The areas where the population-to-PCP ratio exceeds 2000:1 are designated as primary care health professional shortage areas by the Federal Health Resources and Services Administration (HRSA) (Bodenheimer & Pham, 2010). As of 2009, 65 million people lived in these shortage areas. Summarizing the discussion, the primary care part of the health care system is facing issues regarding declining PCPs, uneven distribution of PCPs and inaccessibility.
HOME-MONITORING PROGRAMMES
The medical devices in the case of home monitoring generate streams of data. Several studies have revealed good accuracy and reliability of the reported medical data with minimal data transfer problems and errors, in the case of chronic illness (Aris, Wagie, Mariun, & Jammal, 2001; Capomolla et al., 2004; Gómez et al., 2002; Kjellstrom, Igel, Abraham, Bennett, & Bourge, 2005; Lindgren et al., 1997; Marrero et al., 1995; Moller, Dideriksen, Sorensen, Madsen, & Pedersen, 2003; Pare, Jaana, & Sicotte, 2007). Other studies have revealed the close agreement of the data collected from home monitoring using wearable devices with that of laboratory results (Finkelstein, Cabrera, & Hripcsak, 2000; Finkelstein et al., 1993). Moreover, studies have shown that the benefits of home monitoring are not limited to the patients; home monitoring could also significantly decrease in-hospital admissions, ED visits and the length of stay in hospital in the case of patients suffering from cardiac and pulmonary abnormalities (Cordisco, Beniaminovitz, Hammond, & Mancini, 1999; Heidenreich, Ruggerio, & Massie, 1999). This is an encouragement for researchers to further study systems involving home monitoring and analyse their overall effects on patients who take part in the system and also on the health care providers. Currently, the home-monitoring studies are widely implemented as hospital programmes to ease the burden on the ED. The success or failure of such programmes can be observed only after their implementation, making it a risky approach. The use of the simulation method to assess the effectiveness of the home-monitoring programme is a unique approach. In this work, we concentrate on the primary care sector. However, this approach will enable the hospitals to design and simulate various home-monitoring-related programmes for both inpatient and outpatient settings, and obtain results without implementation, thereby saving time and costs.
SIMULATION
Figure 1 gives a snapshot of the agent-based patient satisfaction model for the home-monitoring programme. Each circle represents a state and each arrow represents a state transition from one state to another. PP is the patient population state. This state represents patients who are susceptible to the home-monitoring programme adoption. In other words, they are the potential patient adopters. PA is potential adopters of the programme. The patients’ transition from the PP state to the PA state means that the patients have adopted the home-monitoring programme. The consumer market reflects a similar state transition from being potential adopters to adopters. In general, the diffusion models assume that the timing of the first-time purchase of an innovation is distributed in some fashion over the population (Wright, Upritchard, & Lewis, 1997). The generic diffusion model equation (Equation 1) is given below (Sultan, Farley, & Lehmann, 1990):

where dN(t)/dt is the rate of diffusion at time t,
N(t) is the cumulative number of adopters at time t, N* is the total number of potential adopters in the population, g(t) is the probability of adoption for individuals who have not yet adopted.
Variations of the diffusion model depend upon g(t). One may consider g(t)= p, where p is the co-efficient of external (mass media) influence (Fourt & Woodlock, 1960) under the assumption that the diffusion process is influenced only by external factors. On the other hand, one may consider g(t) = q F(t), where q is the co-efficient of internal (word of mouth) influence (Mansfield, 1961) under the assumption that the diffusion process is affected only by internal influence.
State Chart of Patient Satisfaction for Home-monitoring Programme
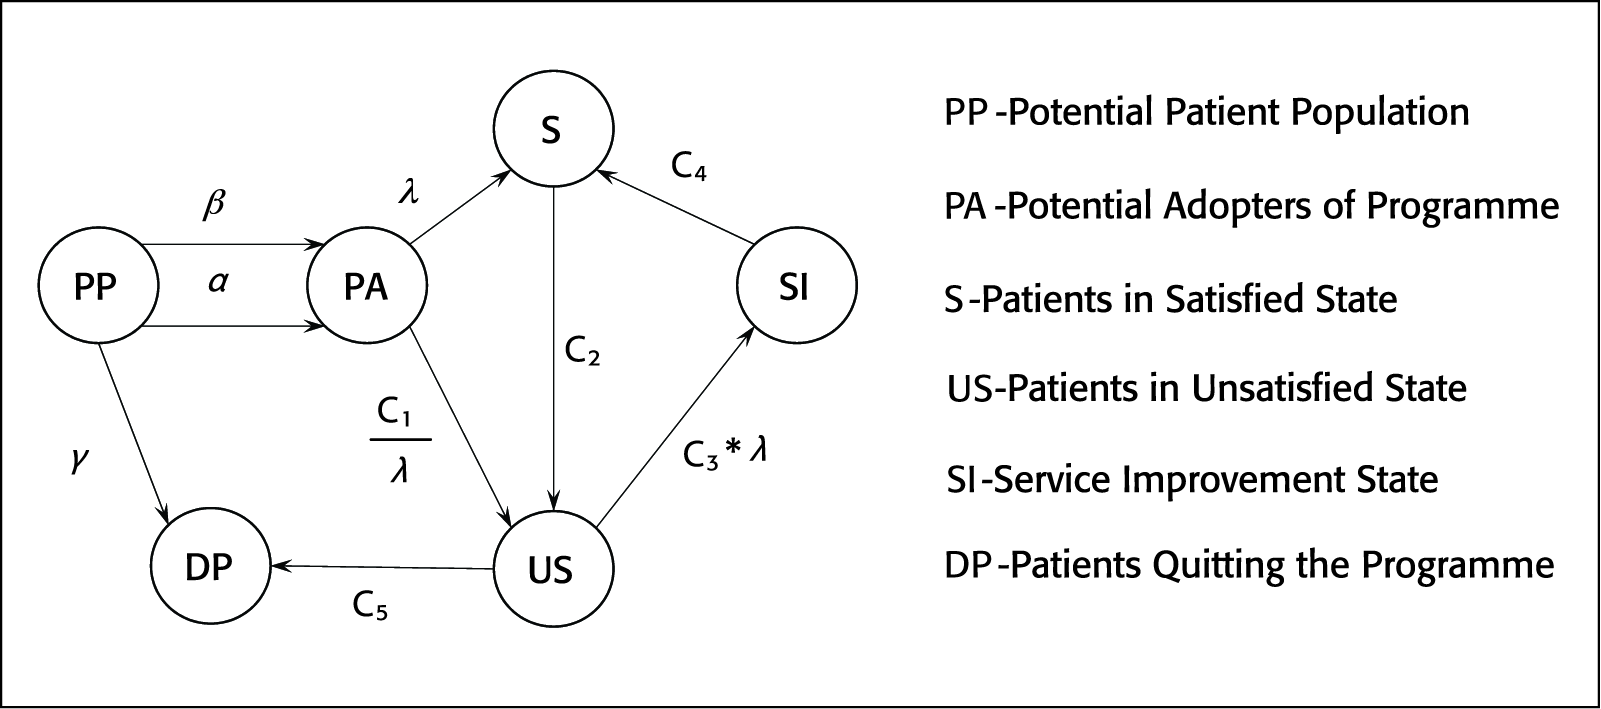
The effect of internal influence is a function of the number of previous adopters which is represented by F(t). Bass (1969) combined both internal and external influences to create a multi-influence model g(t) = p+qF(t. People who adopted due to external influence were termed as innovators and people who adopted due to internal influence were termed as imitators. The diffusion model suggested by Bass is termed as the Bass diffusion model. In recent years, the Bass model has become complex by including other factors such as price, potential market, and promotion and advertising (Delre, Jager, Bijmolt, & Janssen, 2007). However, the Bass models are used repetitively with a proven value range for p and q. The average values of p and q were found to be 0.03 and 0.38, respectively (Bass, Krishnan, & Jain, 1994). The value of p is often quite small (0.01 or less); on the other hand, q is rarely greater than 0.5 and rarely less than 0.3 (Bass et al., 1994). In comparison to the consumer market, the patient adoption diffusion process is different. As shown in Figure 1, the patients move from potential adopters to adopters via two transition factors, namely, α (external influence factor) and β (internal influence factor). α is the influence exerted by the PCPs to adopt the home-monitoring programme. In other words, it is the promotional effort undertaken by the hospital. Compared to consumer products and services promotion, which generally follows an exponential decay, the α factor increases with time, the reason being that product marketing campaigns decay after a certain amount of time or after a target market capitalization is achieved. In the case of hospitals, the campaign or the physicians’ influence over time becomes stronger since they can support their influence with observed positive impacts of the home-monitoring programme on a certain number of patients who have adopted the programme earlier (initial adopters). More number of patients adopting the programme will generate more evidence on the success of the programme and help influence more patients to adopt it. The internal influence factor β is the influence exerted by the patients who are satisfied by the home-monitoring programme. Internal influence is a more important factor than the external influence (Delre et al., 2007). This is the underlying observation derived from the Bass diffusion model.
We have incorporated the above-mentioned observation in our model by applying a constraint β > α throughout the simulation phase. On the other hand, the α factor is increased in steps every 30 days of the simulation run instead of assigning an exponential increase. This is supported by an assumption that the hospital campaign increases on a monthly basis rather than following an exponential decay campaign strategy. Verella and Patek (2009) in their work used affordability, effectiveness, regulatory approval, favourable publications, insurance coverage and patient pressure as the parameters for assessing the patient adoption of a continuous glucose-monitoring technology. The readers are encouraged to use these parameters (as external influence factor) to infuse more realism into the model.
Once the patients have adopted the home-monitoring programme, they move to either S (satisfied) or US (unsatisfied) state. The transition to the satisfied state is governed by λ (satisfaction factor). The satisfaction factor is a function of home-monitoring device design, home-monitoring programme service and follow-up service. The transition to the unsatisfied state is given by C1λ (C1 is a constant). Hence, a poor device design or home-monitoring service will drive more patients to the unsatisfied state compared to the satisfied state. The void in the existing literature to outline the parameters affecting the patient satisfaction of those who have adopted a home-monitoring programme restricts our ability to add more granularities to the selected parameters. We have assumed that the aforementioned three parameters affect the transition to the satisfied or unsatisfied state. Initially, some patients may transition to the satisfied state because of the effect of new technology and service. Eventually, they will transition to the unsatisfied state. Assuming that the transition from the satisfied to the unsatisfied state is a low rate transition, we have assigned C2, a constant low rate transition. The unsatisfied patients will then be subjected to a service improvement programme wherein their problems will be addressed by improving the home-monitoring programme services. The transition from the US to SI (service improvement) state is governed by C3*λ (C3 is a constant). After entering the SI state, the patients will transition to the satisfied state and the transition is governed by a constant rate C4. The unsatisfied patients who wish to quit the programme will transition to the DP (drop programme) state at a constant rate C5. Similar to the satisfied patients, the unsatisfied patients will exert a negative influence. This negative influence factor is denoted by γ which is responsible for driving potential patient adopters to quit the programme. Another system constraint β > γ is derived from the concept that the positive social influence is greater than negative social influence in the case of consumer market (Delre et al., 2007). One may argue that in the case of health care, negative influence may be stronger than the positive influence, since the patient behaviour may follow a cautious behaviour pattern. This however remains to be validated in the case of home-monitoring programme adoption.
The inclusion of patient influence in the diffusion process compels one to consider the network structure also. The consumer network may be a regular, random or small world, where the consumers are represented as nodes and their relation or communication paths with other consumers are represented by links (Delre et al., 2007). In the case of regular networks, agents are highly clustered and information travels slowly. On the other hand, random networks display low clustering with fast information travel (Delre et al., 2007). However, the small world networks have high clustering and still information travels fast (Delre et al., 2007). In this study, we assume that the patients communicate via Internet and the one-to-one contact has less effect than the contact via Internet. For representing the network where the information travels via Internet, we adopt the scale-free network structure. The scale-free network structure is characterized by the formation of hubs, that is, some patients may be more connected than others. Since Internet follows a scale-free structure, this assumption seems valid. The patients are connected to the physicians, and hence they can be represented as hubs in the network. In the following section, we discuss about the system dynamics model of the primary care unit.
SYSTEM DYNAMICS MODEL
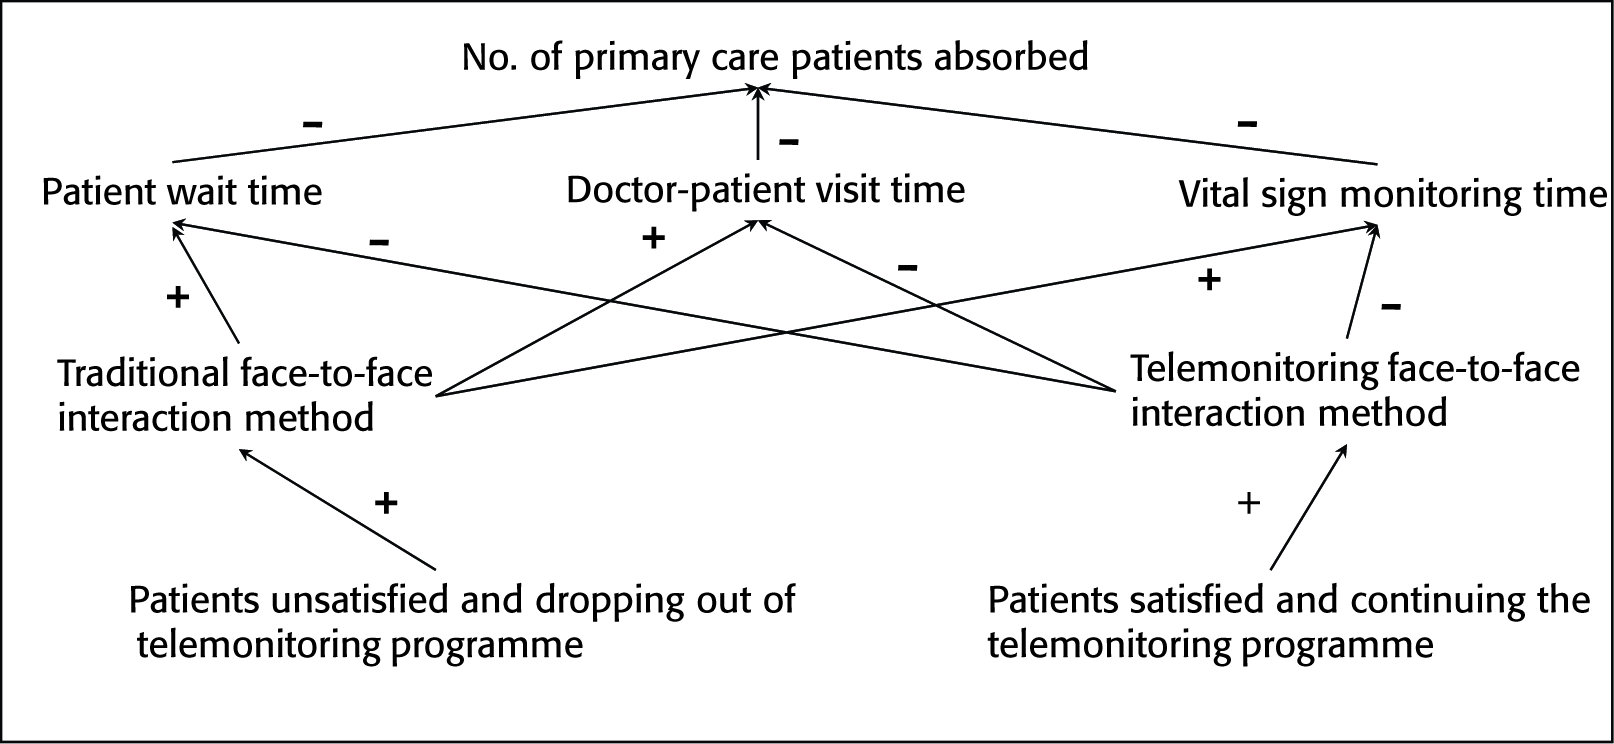
Figure 2 shows the influence diagram of the primary care system when it is subjected to a home-monitoring programme. The agent-based simulation model classifies the patient satisfaction state as satisfied or not satisfied. The satisfied patients tend to continue the home-monitoring programme, while the unsatisfied patients tend to quit the programme. The patients continuing with the home-monitoring programme are subjected to a home-monitoring face-to face interaction method wherein the doctors and patients communicate via the video conferencing technique. On the other hand, the patients dropping out of the programme are subjected to the traditional face-to-face interaction technique wherein the patients meet the doctor on-site. The increase in patients continuing the home-monitoring programme will reduce three parameters, mainly, patient wait time, doctor–patient visit time and vital sign monitoring time. On the other hand, patients adopting the traditional on-site interaction method will increase the above-mentioned parameters. This logic is valid under an assumption that the resources are not changing, that is, more physicians, nurses and medical assistants are not provided to take care of the increasing patient load. This represents the system constraints and is in agreement with the lack of adequate resources in the primary care sector.
The agent-based simulation parameters are varied to create three scenarios: (a) the number of satisfied patients is more than the number of unsatisfied patients; (b) equal number of satisfied and unsatisfied patients; and (c) the number of satisfied patients is less than the number of unsatisfied patients. In the system dynamics model, we analyse how the above-mentioned scenarios affect the patient load absorption if (a) dedicated resources are allocated for home-monitoring programme patients (doctors, nurses and medical assistants) (home-monitoring method); (b) dedicated resources are allocated for patients opting for the traditional method of care (traditional method); and (c) the same resources are used for both home-monitoring and traditional methods of care (combined method).
Influence Diagram of Primary Care System Subjected to a Home-monitoring Programme
RESULTS AND DISCUSSION
The agent-based patient satisfaction model and the system dynamics primary care model were run for a period of 365 days; γ was set to 0.01 with a step increase every 30 days of the simulation run; β was set to 0.05. For the three parameters—device design, programme service and follow-up service—values were set to 2, 0.1 and 0.5, respectively; γ was set to 0.03. The values of constants were set as follows: C1 = 0.05, C2 = 0.0007, C3 = 0.3, C4 = 0.005 and C5 = 0.01.
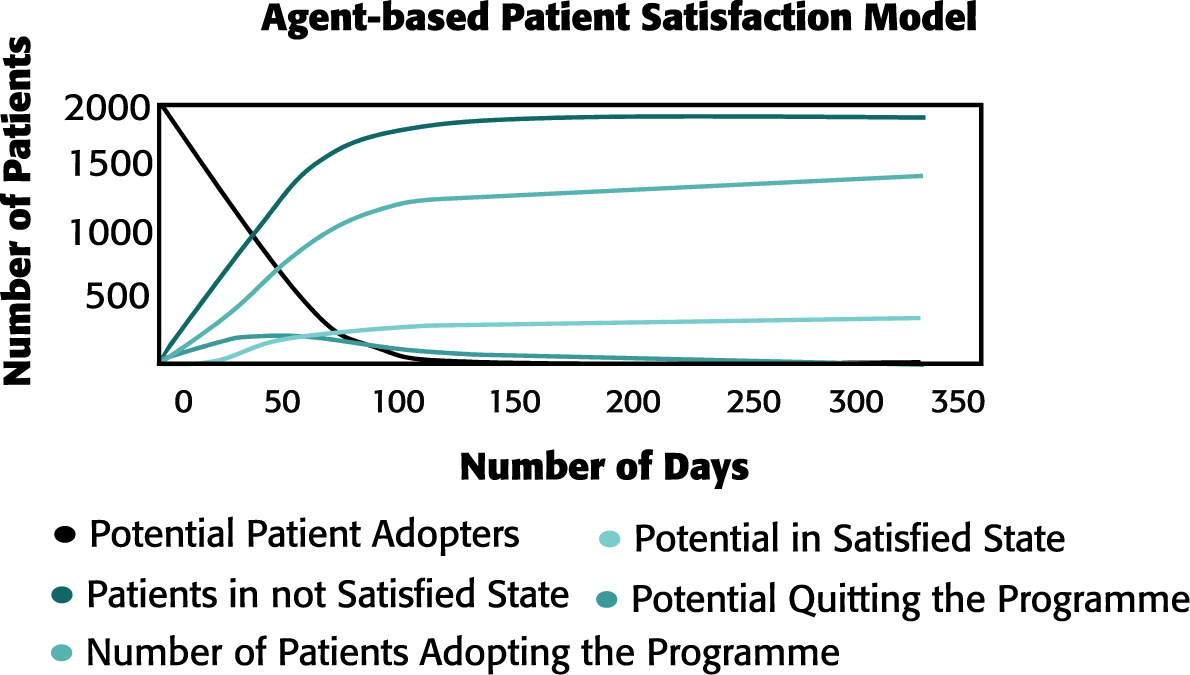
Table 1 shows the results of the agent-based patient satisfaction scenario and their corresponding effects on the primary care system. Figure 3shows the output of the agent-based patient satisfaction model for scenario 1, where the number of satisfied patients is more than the number of unsatisfied patients. The figures for other two scenarios are not included because of space constraints. The three scenarios represent the success, equal adoption and failure of home-monitoring programmes for primary care. In all, the scenarios having separate resources for handling home-monitoring patients prove beneficial for absorbing more patients, reducing patient wait time, doctor consultation time and vital sign monitoring time.
Agent-based Patient Satisfaction Scenario and their corresponding Effects on Primary Care System
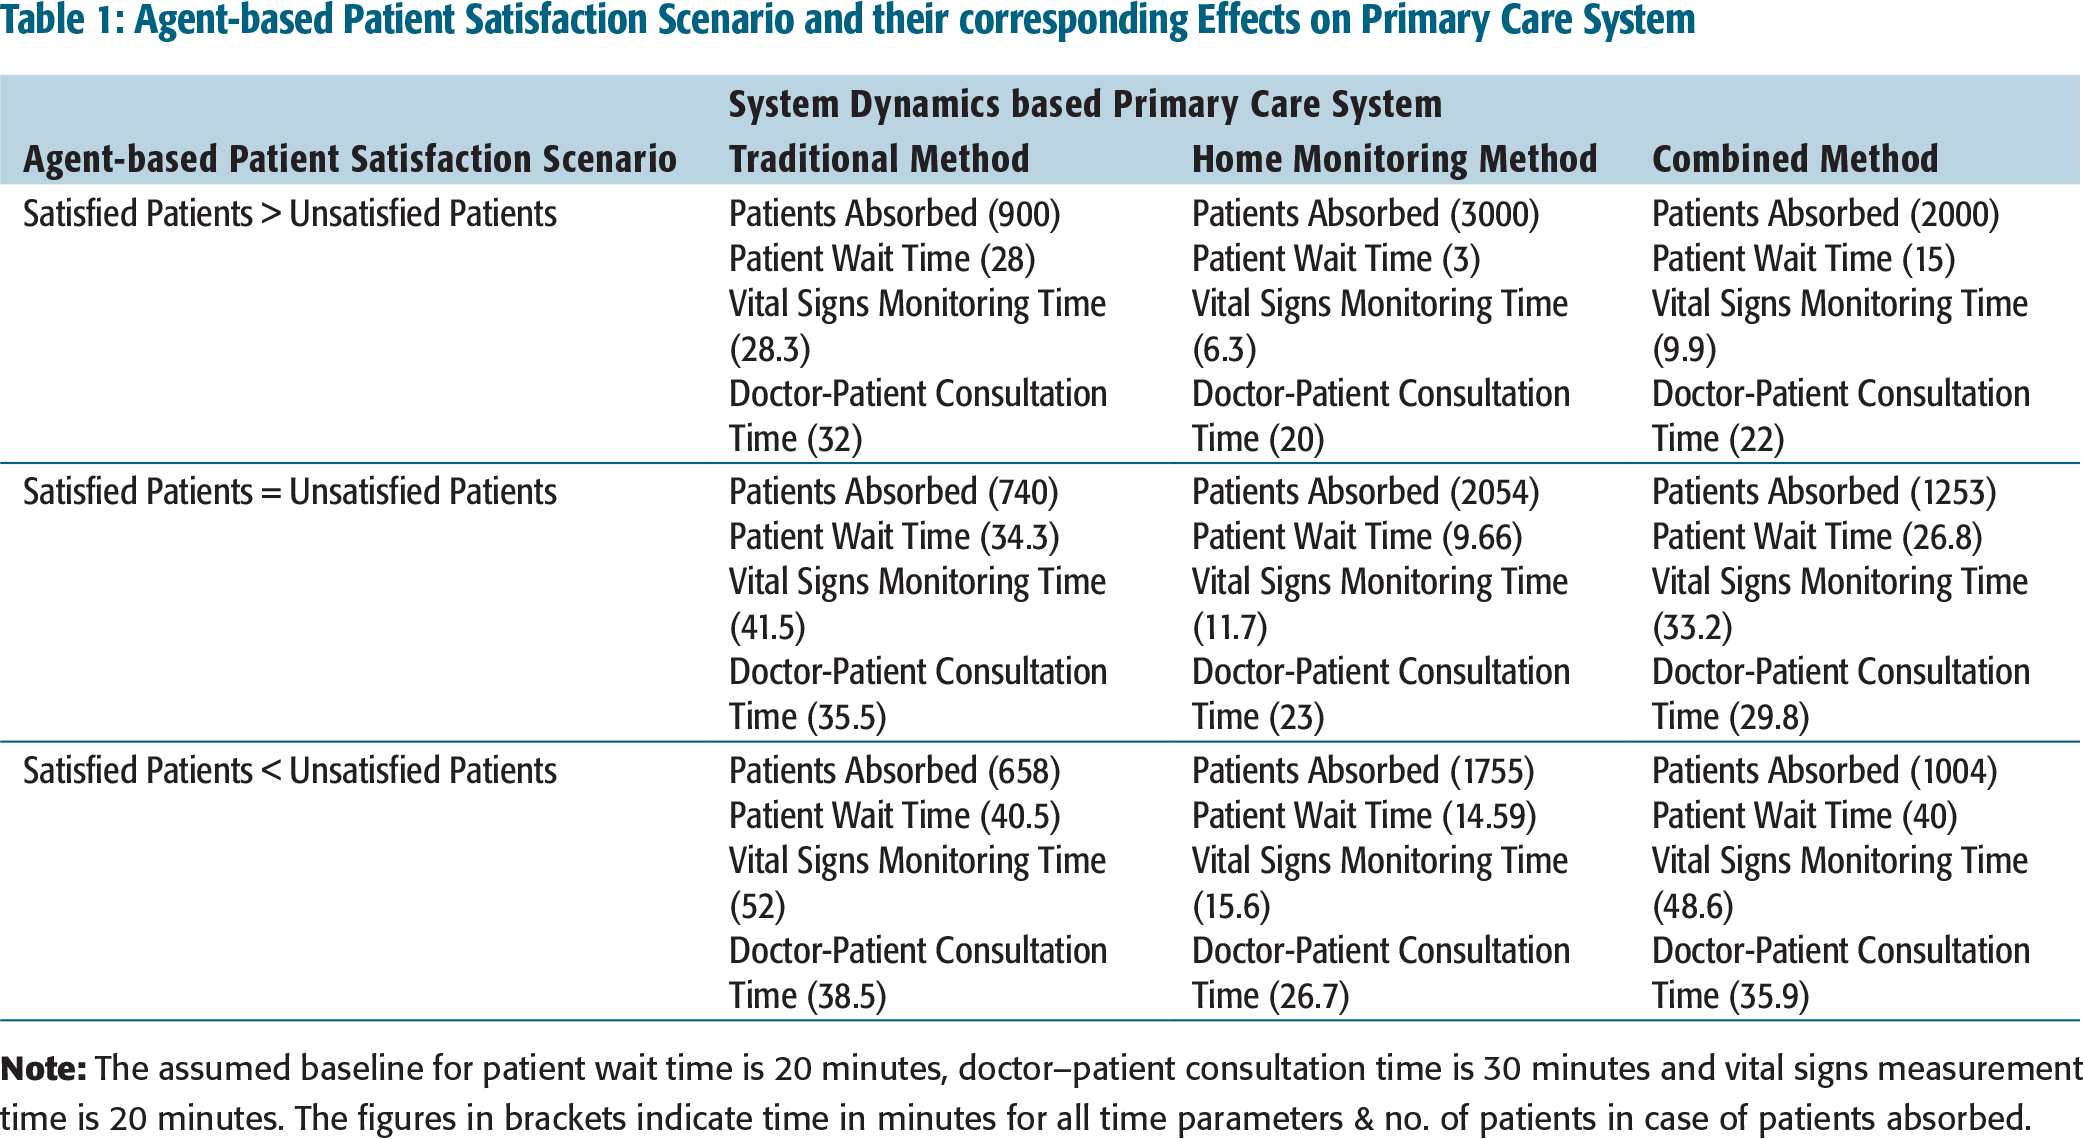
The transit from the satisfied state to the unsatisfied state, that is, the shift from scenario 1 to scenario 2 and scenario 3, the combined method of care closely follows the traditional method of care and does not differ significantly in terms of patient wait time, doctor consultation time and vital signs monitoring time. Patients absorbed in all the three scenarios under three different methods of care delivery show a rising trend. This is because the system dynamics model of the primary care system is reinforcing in nature. It has the even number of negative influences (see Figure 2). It is interesting to note that the combined method of care yielded beneficial results in scenario 1 as compared to scenarios 2 and 3. As more patients shift from satisfied to unsatisfied state, the difference between the combined method of care and the traditional method of care is reduced.
Output of Agent-based Patient Satisfaction Model for Scenario 1
We have illustrated the use of the combined simulation technique in assessing the effectiveness of the home-monitoring programme to reduce the primary care patient load problem. Even though the area of application is for primary care, the method can be adopted for other components of care settings. The lack of availability of data for the indication of patient satisfaction led us to adopt the agent-based method. In future, we intend to validate our patient satisfaction model. We have assumed that the vital signs monitoring in the case of home-monitoring programmes will be done off-site where trained health monitoring and IT professionals will provide monitoring, incidence detection and alerting services. In future, we wish to adopt a discrete event simulation method to study the primary care patient flow process (add stochastic dimension) and include additional parameters, mainly, appointment cancellation and patient revisit.
This study is mainly focused on the US health care. However, its applicability for India cannot be undermined. Home-monitoring systems in India are on a rise with falling costs of sensor technology. India has among the highest penetration of digital technology for checking the glucose level in the case of diabetes patients. Currently, the rise in health-monitoring mobile applications is exponential in nature. Home-monitoring programmes offer a better care delivery solution in overcrowded scenarios, which currently is Indian health care’s biggest issue. The simulation technique suggested in this work can enable policy makers to assess the impact of home-monitoring systems and eventually measure its adoptability. Combining home-monitoring programmes with conventional care would enable practitioners to lower patient wait time and absorb more patients into the system. Indian health care system would thus be able to serve more patients with available health care workforce.