
Abstract

As an economy transforms from an agricultural economy to an industrial economy, a decline in participation of female labour force is observed. This is attributed to the shift from family-based production to large-scale production in industrial units. The womenfolk being mostly illiterate or with low levels of education face shortage of work in the home turf and have inhibitions in working as manual labour in the non-agricultural sector. But with an increase in family income and improvement in the education level of females, more and more females start entering the labour force, especially into non-manual or service-oriented jobs. That is why the participation of females in the labour force in comparison with the economic growth is supposed to be U-shaped (Goldin, 1994). This article examines how the experience has been in India especially among rural females who account for the major share of the rural population.
For developing countries, average patterns of women’s labour force participation are more mixed, ranging from as low as 21 per cent in the Middle East and North African region to as high as 71 per cent in the East Asian and Pacific region in 2010. The gender gaps in labour force participation are also highest in the Middle East and North African and South Asian regions, where men’s participation rates exceed women’s rates by over 50 percentage points. 1
Women are less likely than men to participate in the labour market in most countries. Retrieved from http://data.worldbank.org/news/women-less-likely-than-mento-participate-in-labor-market
National Sample Survey Organisation (NSSO) 68th Round Employment–Unemployment Survey 2011–12. LFPR calculated for the 0-plus age group.
Ibid.
Retrieved from http://www.censusindia.gov.in/2011-common/census_2011.html
RURAL FEMALE LABOUR FORCE PARTICIPATION IN INDIA
The pursuit of neoliberal economic policies 5
Post 1991, the Indian government had brought in a series of economic reforms which had facilitated privatization of the public sector, trade liberalization and deregulation of industry.
Labour Force Participation Rate per 1000 of Age 15-plus Years as per Usual Status
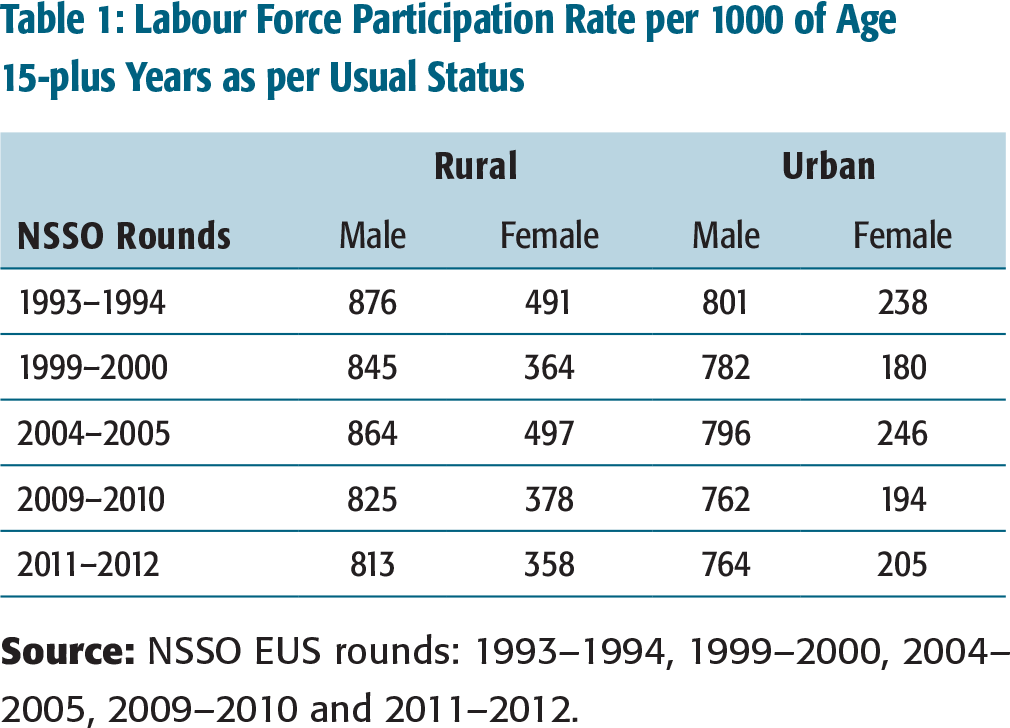
With nearly 80 per cent (NSSO 2011–2012, 68th round) of the female labour force being concentrated in rural areas, the focus of this paper is on addressing the issue from the rural angle. Table 2 captures the age cohort-wise distribution of rural female labour force across the Rounds. It emerges that there has been a steady decline in the LFPR from 1993–1994 to 2011–2012 in the age group of 5–9 years and 10–14 years indicating that the rural females of this age group are in the education space. Similarly, in the 15–19 and 20–24 age-cohort, a decline in the LFPR is seen in 2009–2010 and 2011–2012.
Age-wise Distribution of Rural Female Labour Force Participation Rate per 1000 as per Usual Status
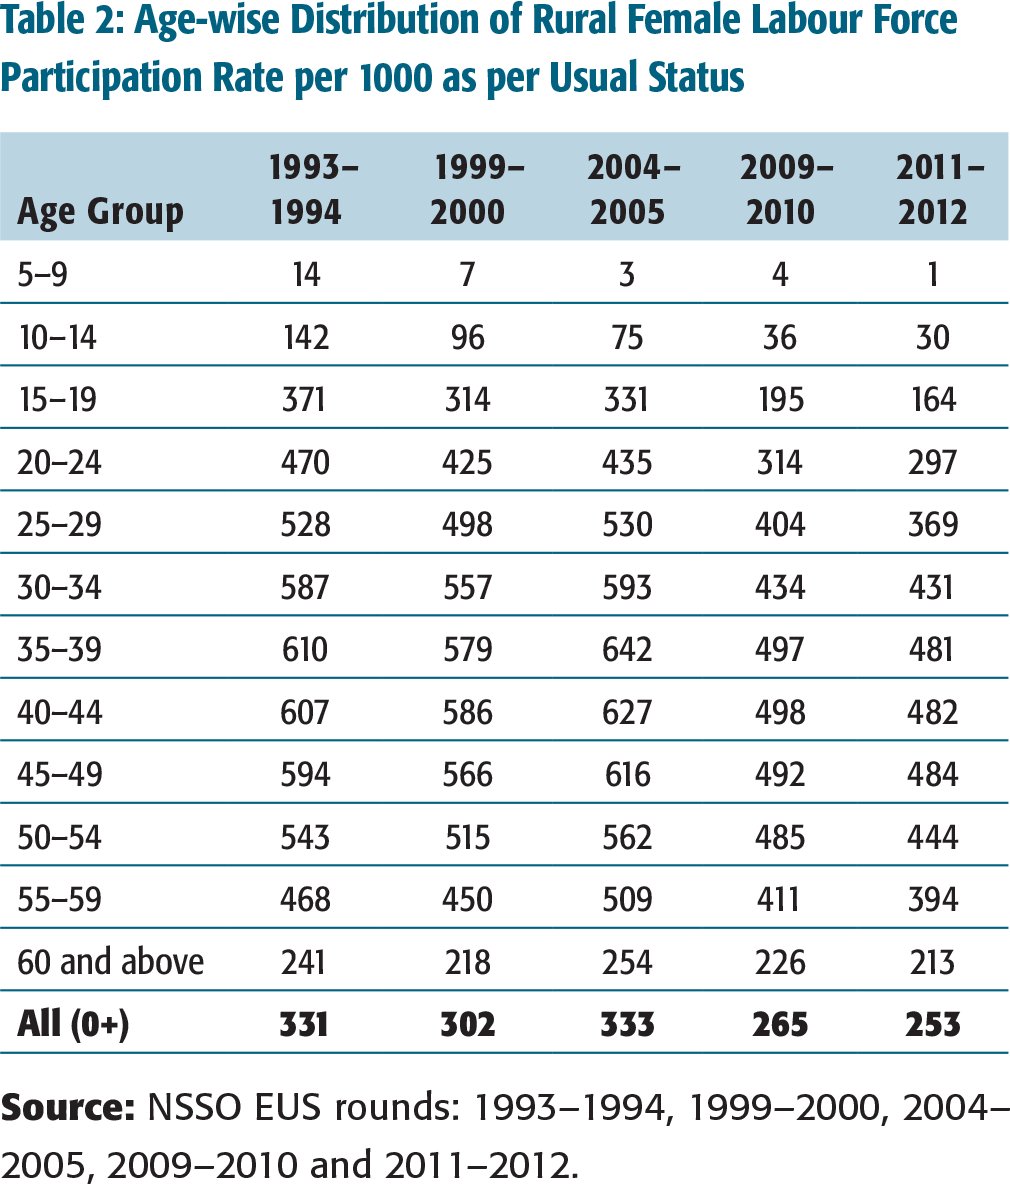
The LFPR reaches its prime in the age group of 30–49 years, but even among this group, except for 2004–2005, when there was a rise in labour force participation, the FLFPR is seen declining. To understand why women who were earlier in the labour force were leaving, the activity status of rural females outside the labour force was looked into (Table 3).
Females Engaged in NSSO Activity Codes 92 and 93 per 100 Population (age group 15-plus)
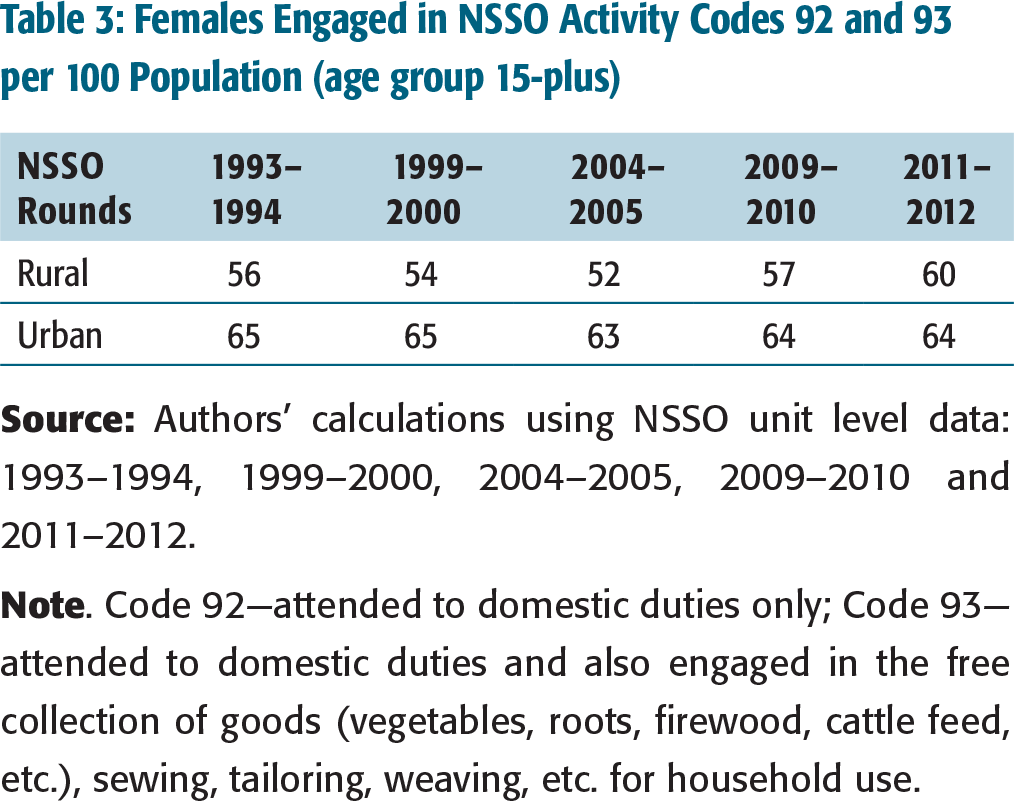
As may be seen from Table 3, the proportion of rural females who reported themselves as engaged primarily in domestic duties and activities for household consumption increased from 56 per cent in 1993–1994 to 60 per cent in 2011–2012, while for urban females, it has been around 64 per cent during this period. The women who spent their time in domestic duties belonged to all age groups. The proportion of rural females aged 15–29 years who spent their time in domestic duties increased from 54.8 per cent in 2004–2005 to 57.5 per cent in 2011–2012, while the proportion for the 30–44 year age group increased from 52.5 to 65.8 per cent during this period. 6
Authors’ calculation from the NSSO EUS unit level data.
Ibid.
Sarva Shiksha Abhiyan is a programme implemented by the Ministry of Human Resources Development that provides basic education to the children up to the age of 14 years, and the implementation of this programme has been strengthened with the introduction of the Right to Education Act, 2009 that guarantees free and compulsory education to all children up to the age of 14 years.
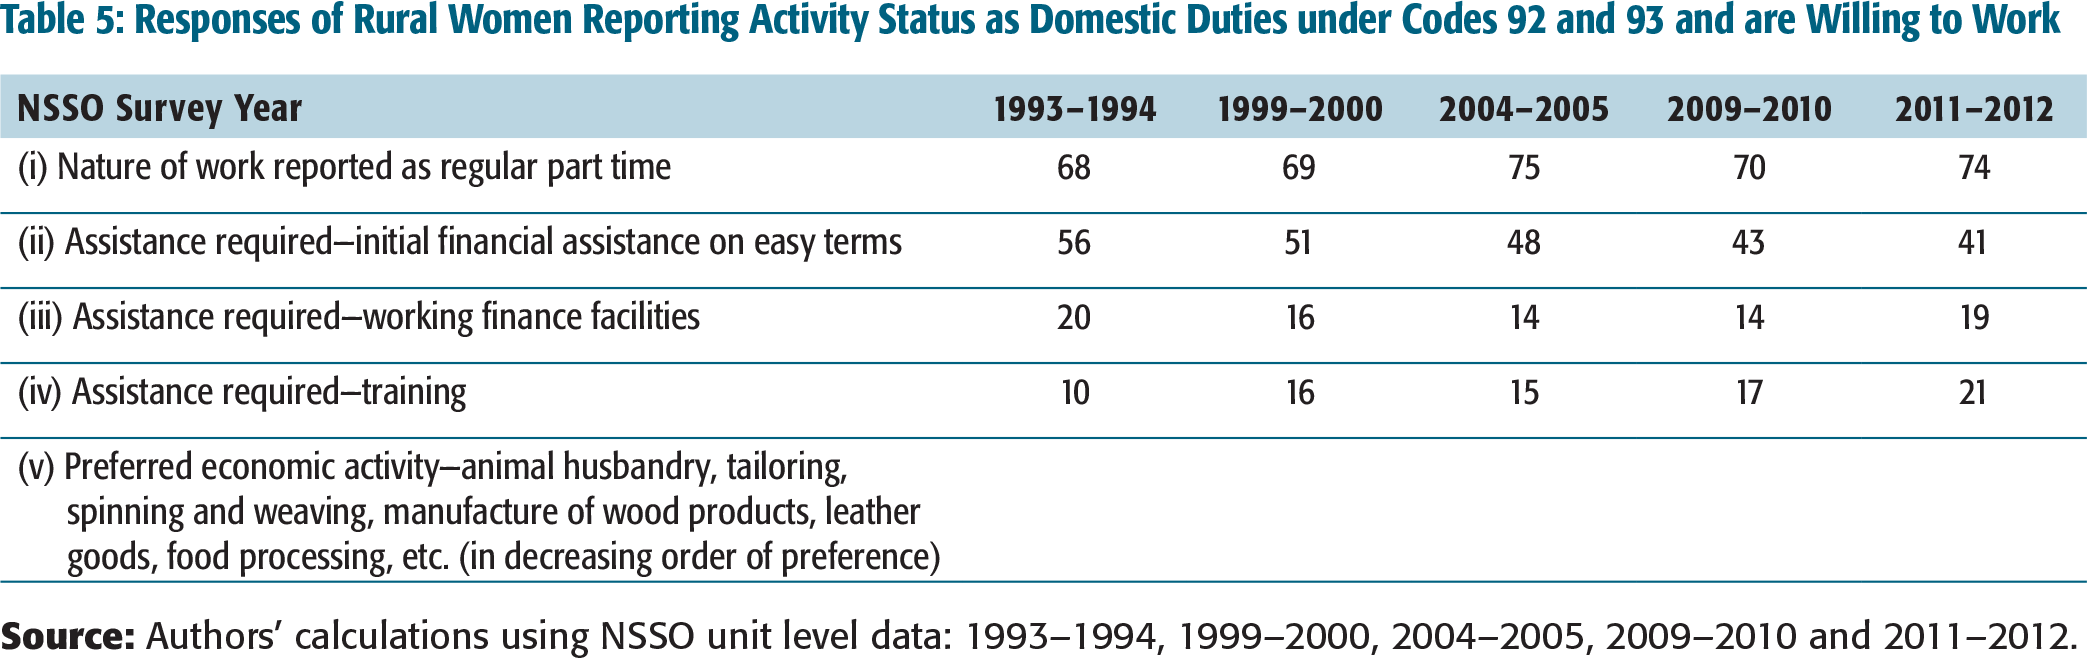
As may be seen from Table 5, the rural females have given preference for women-centric work which can be discharged from the household or within the periphery of the household in the nature of self-employed. Although a majority of rural females have asked for venture capital, a decline in trend for this assistance and an increase in demand for training may be noticed across the rounds. The preference for women-centric jobs also implies that rural females prefer activities which can easily blend with their domestic duties. To further understand the work preferences, the workforce distribution of rural females was looked into.
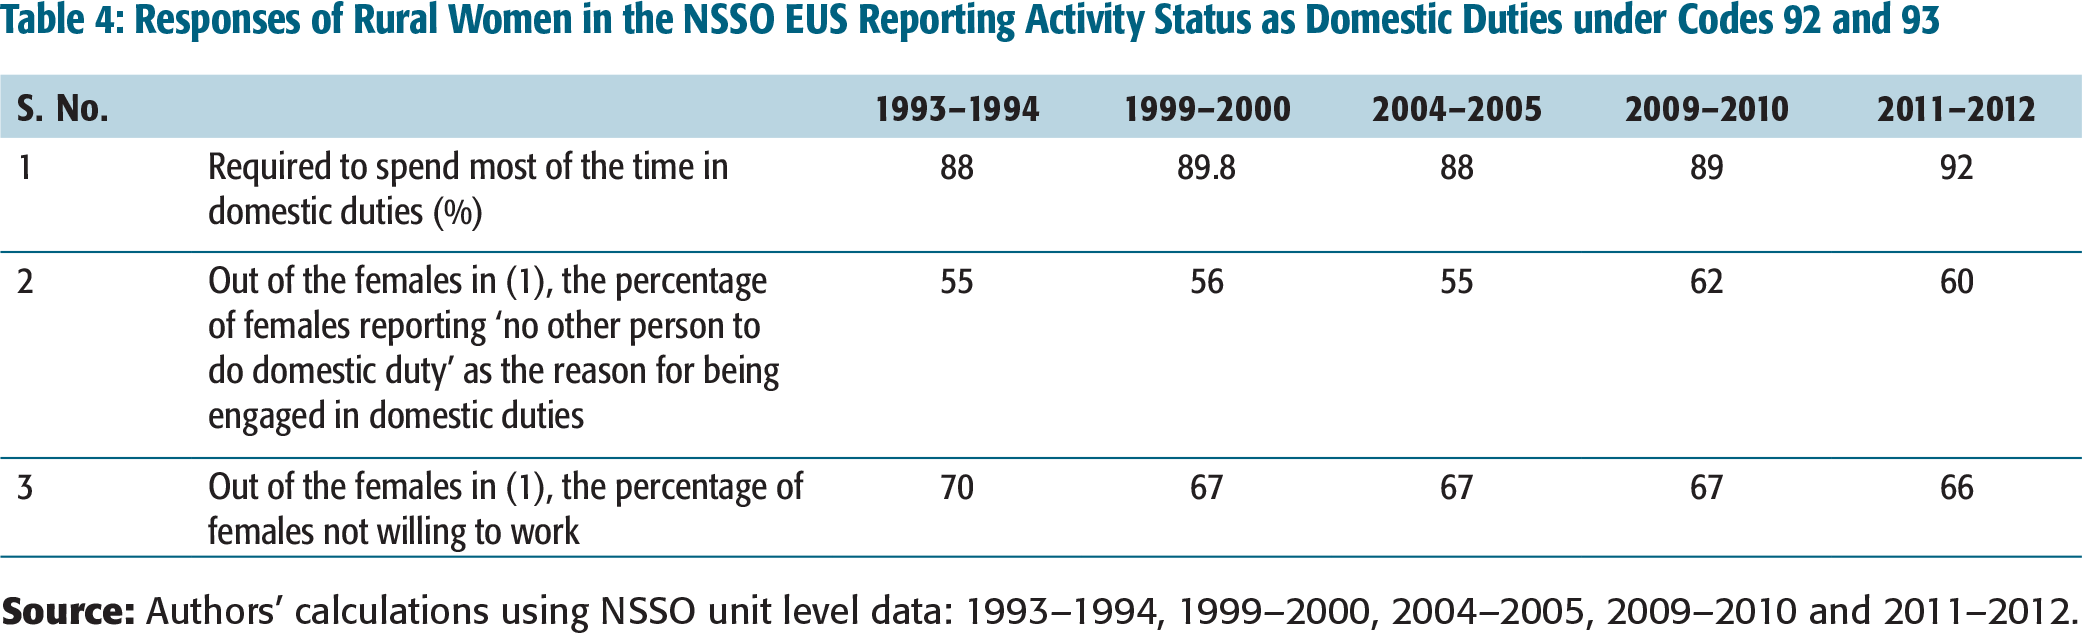
Responses of Rural Women in the NSSO EUS Reporting Activity Status as Domestic Duties under Codes 92 and 93
Responses of Rural Women Reporting Activity Status as Domestic Duties under Codes 92 and 93 and are Willing to Work
Rural Female Workforce Distribution
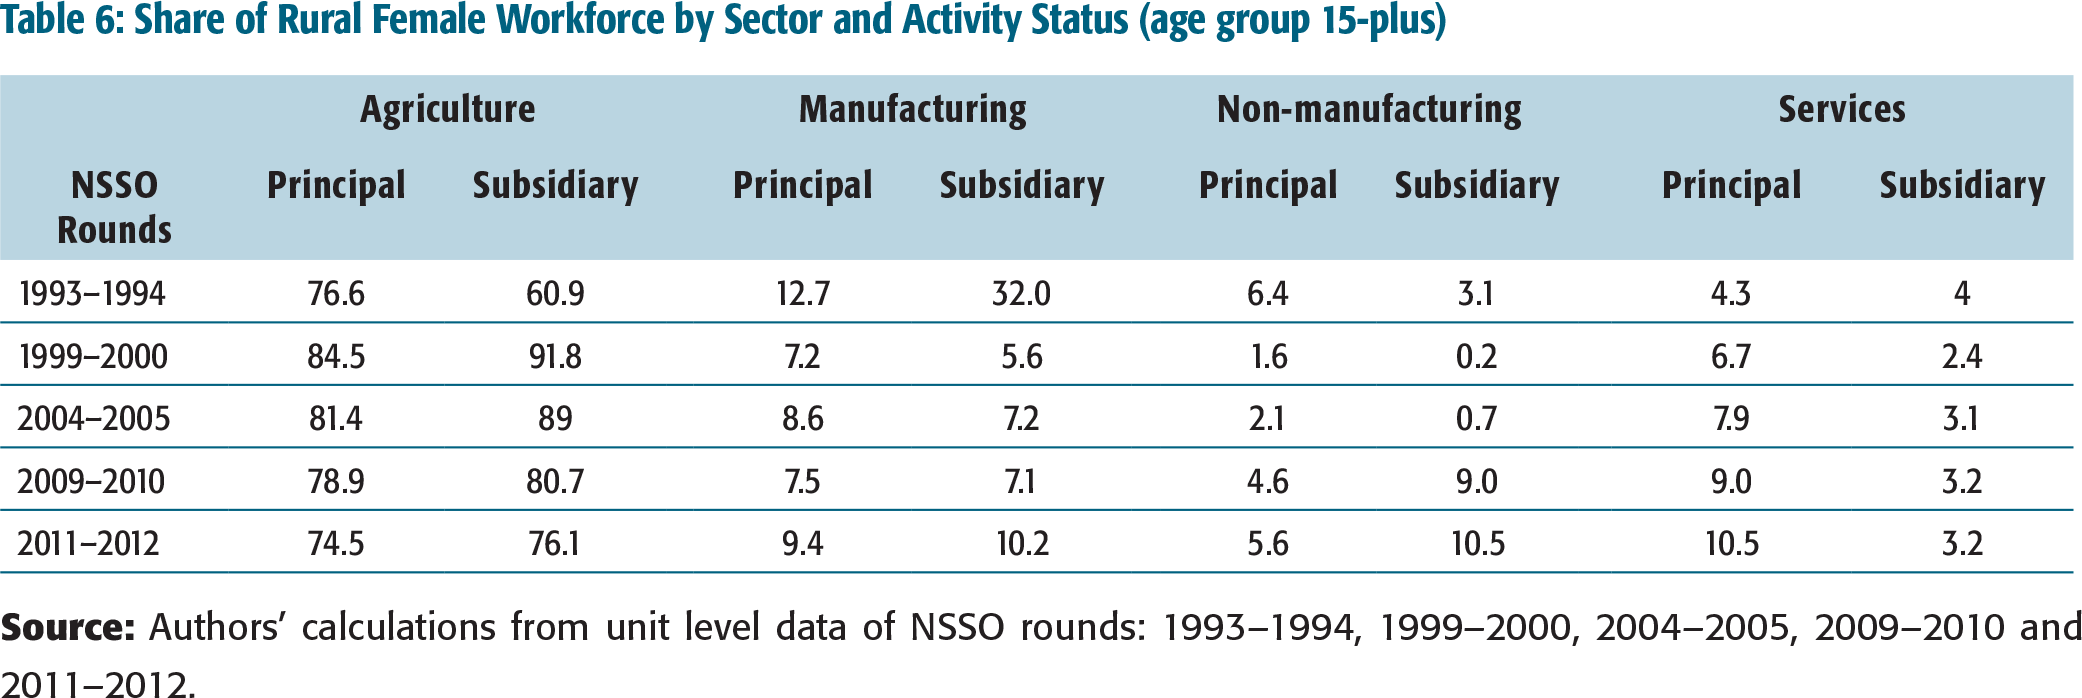
More than 70 per cent of the rural female workforce (Table 6) is engaged in agriculture, and the proportion of workforce engaged in agriculture in principal and subsidiary capacity is around 75 per cent across different NSSO rounds. In 2004–2005, when there was a spurt in RFLFPR, the proportion of rural females engaged in agriculture in principal or subsidiary capacity was found to be lower than that in 1999–2000. But the proportion of females engaged in the non-farm sector saw a rise in 2004–2005. The declining trend in the share of employment in agriculture both in principal and subsidiary capacity is evident from 2009–2010 onwards.
Rural females engaged in manufacturing as a principal activity declined from 12.7 per cent in 1993–1994 to 9.4 per cent in 2011–2012, while the proportion of rural females engaged in manufacturing as a subsidiary activity decreased from 32 per cent in 1993–1994 to 7.1 per cent in 2009–2010 and marginally increased to 10.2 per cent in 2011–2012. This implies that there was the loss of jobs for women who were engaged in manufacturing. This may be due to the decrease in demand for the products from traditional industries which led to the loss of jobs for women. In the non-manufacturing sector that consists of the construction sector apart from public utilities, there has been a decline in the share of rural females since 1993–1994, which sees a reversal from 2009–2010 onwards. In the services sector, the share of rural females in the principal status has steadily increased from 1993–1994 to 2011–2012, while as a subsidiary activity, there has been a fluctuation in their participation. Thus, in the past two decades, while the services sector has shown a rise in jobs for the rural females, agriculture shows a declining trend and in the industry sector a reversal is noticed only in the last two rounds. But only if the decline in agriculture jobs is commensurate with the increase in jobs in the non-farm sector, can the situation of loss of jobs be arrested.
Distribution of Rural Female Workforce by Employment Status
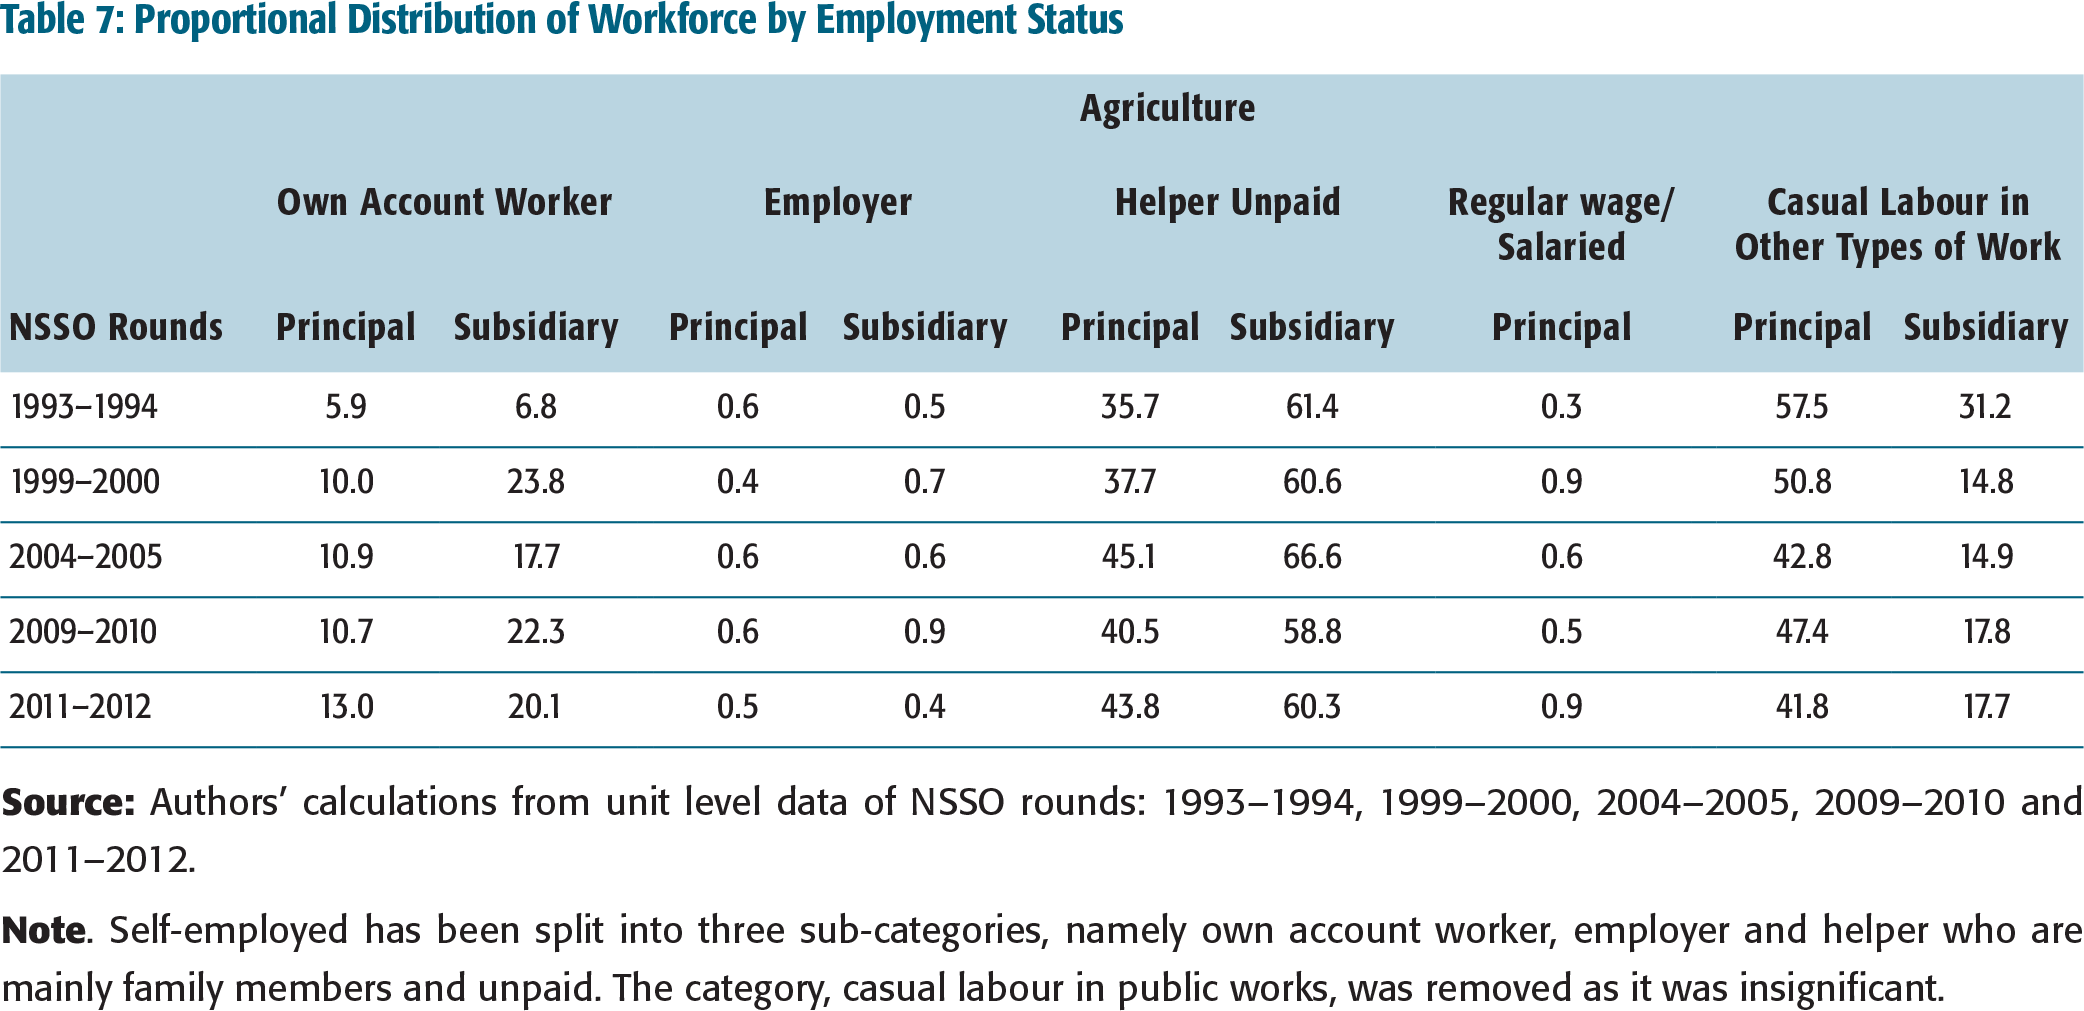
Agriculture is the main sector that employs the rural female workforce. The employment status of the workforce engaged in agriculture over the rounds may be seen in Table 7.
In the agriculture sector, among rural females who reported themselves as self-employed, there was an increase in the proportion of the own account worker category both in the principal status and subsidiary status. But what is disturbing is that a large proportion of rural females in agriculture are working as unpaid helpers both in principal and subsidiary capacity. The sudden spurt in the labour force and workforce in 2004–2005 also witnessed an increase in the proportion of rural females engaged in agriculture working as helpers and a decline in those working as casual labour. This may be attributed to distress employment as agriculture and allied activities grew at a rate of 0.89 per cent during the period from 2002–2003 to 2004–2005 (Eleventh Five Year Plan, 2007–2012, Vol. III).
Share of Rural Female Workforce by Sector and Activity Status (age group 15-plus)
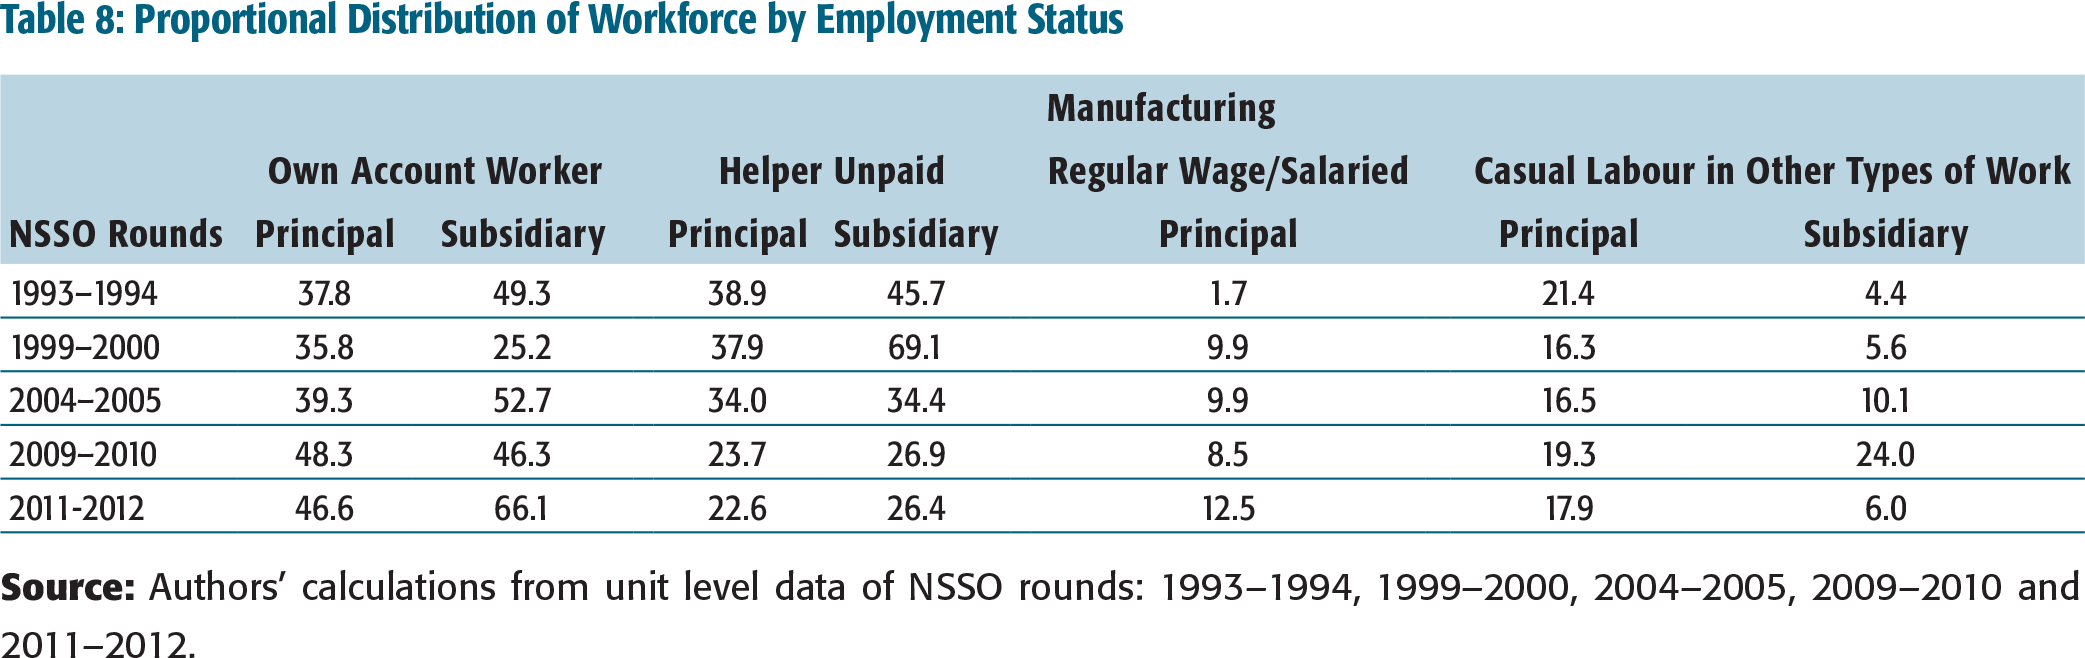
Proportional Distribution of Workforce by Employment Status
The distribution of the workforce by employment and activity status in the manufacturing sector may be seen in Table 8. The rural female working as an employer under the self-employed category was almost non-existent in all the rounds. However, those working as the own account worker in the principal and subsidiary capacity saw an increase. Those reported working as unpaid, though considerable, shows a declining trend. This raises the doubt as to whether family members who were earlier working as helpers started reporting as own account workers. While rural females working in the regular wage/salaried category in principal capacity saw an increase, those working in subsidiary capacity were almost insignificant.
Rural females working as casual labour in principal capacity show a decline, while in the subsidiary capacity there are wide fluctuations. Thus, out of the small proportion of workforce engaged in manufacturing, the increase in the share of the regular employed is a positive sign of decent jobs being created.
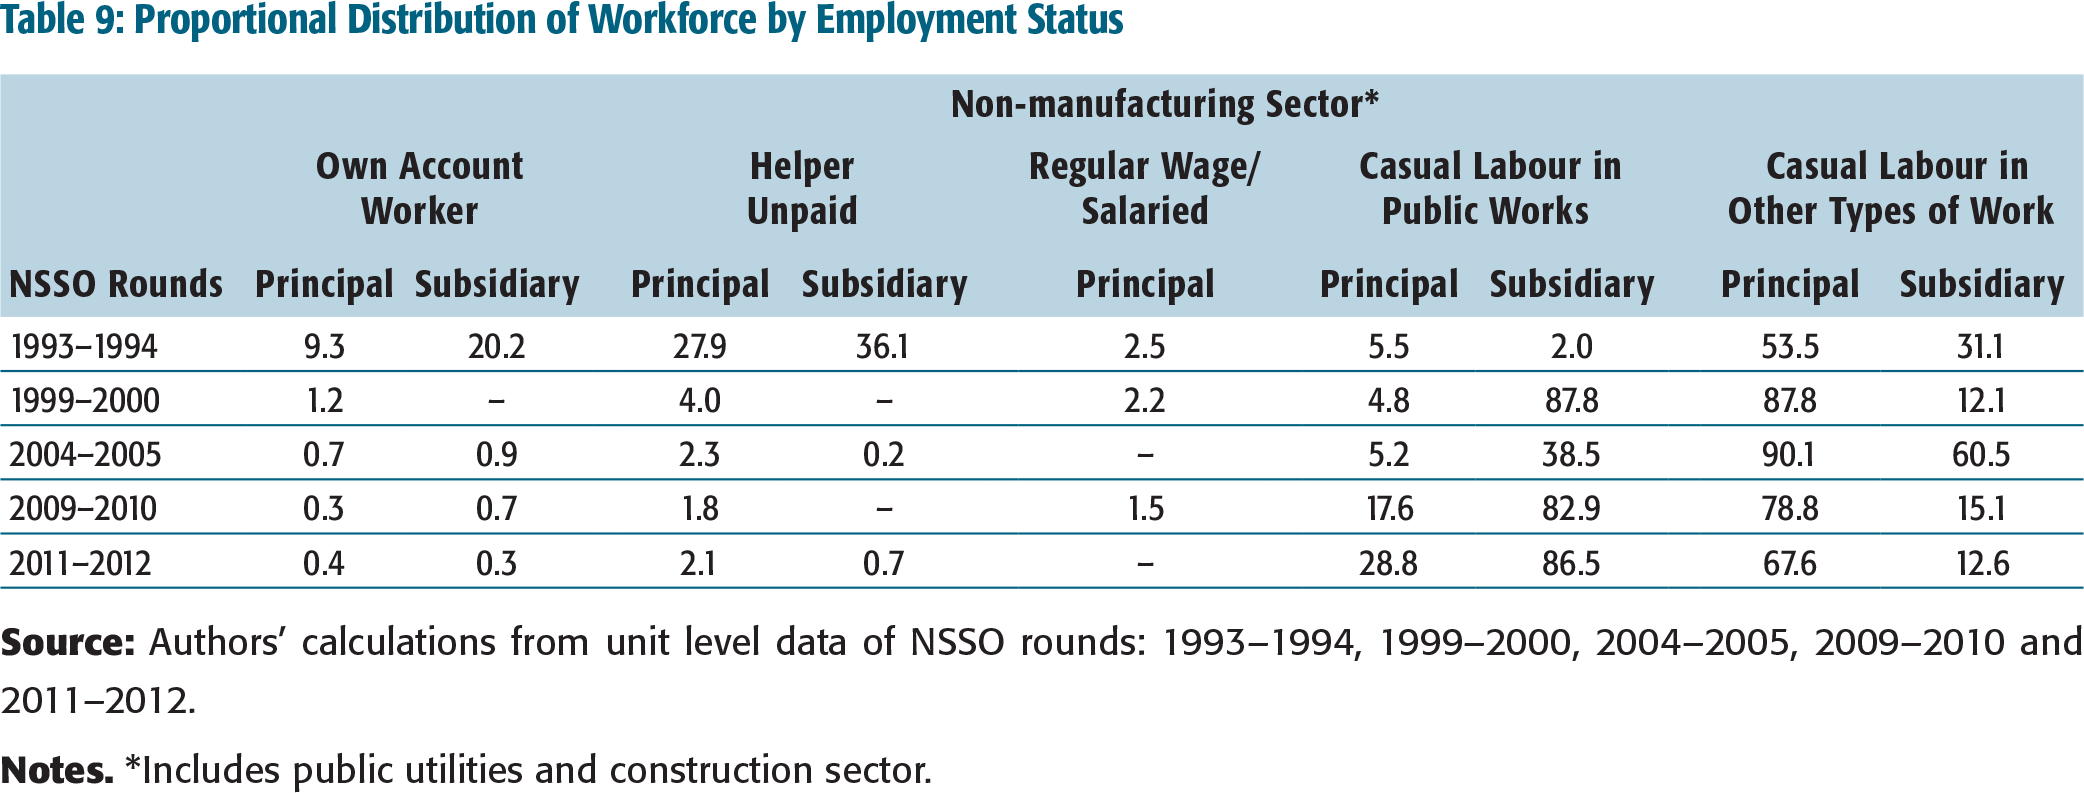
In the non-manufacturing sector, a majority of the rural females are found working as casual labour in other types of work (Table 9).
But in the last two rounds, there is a decline in rural females working in principal capacity as casual labour in other types of work and an increase in the proportion of females working in subsidiary capacity as a casual worker in public works. Can this be interpreted as a shift by the rural females with the loss of jobs in manufacturing and agriculture to the non-manufacturing sector especially construction and working in subsidiary capacity?
Proportional Distribution of Workforce by Employment Status
Proportional Distribution of Workforce by Employment Status
Proportional Distribution of Workforce by Employment Status
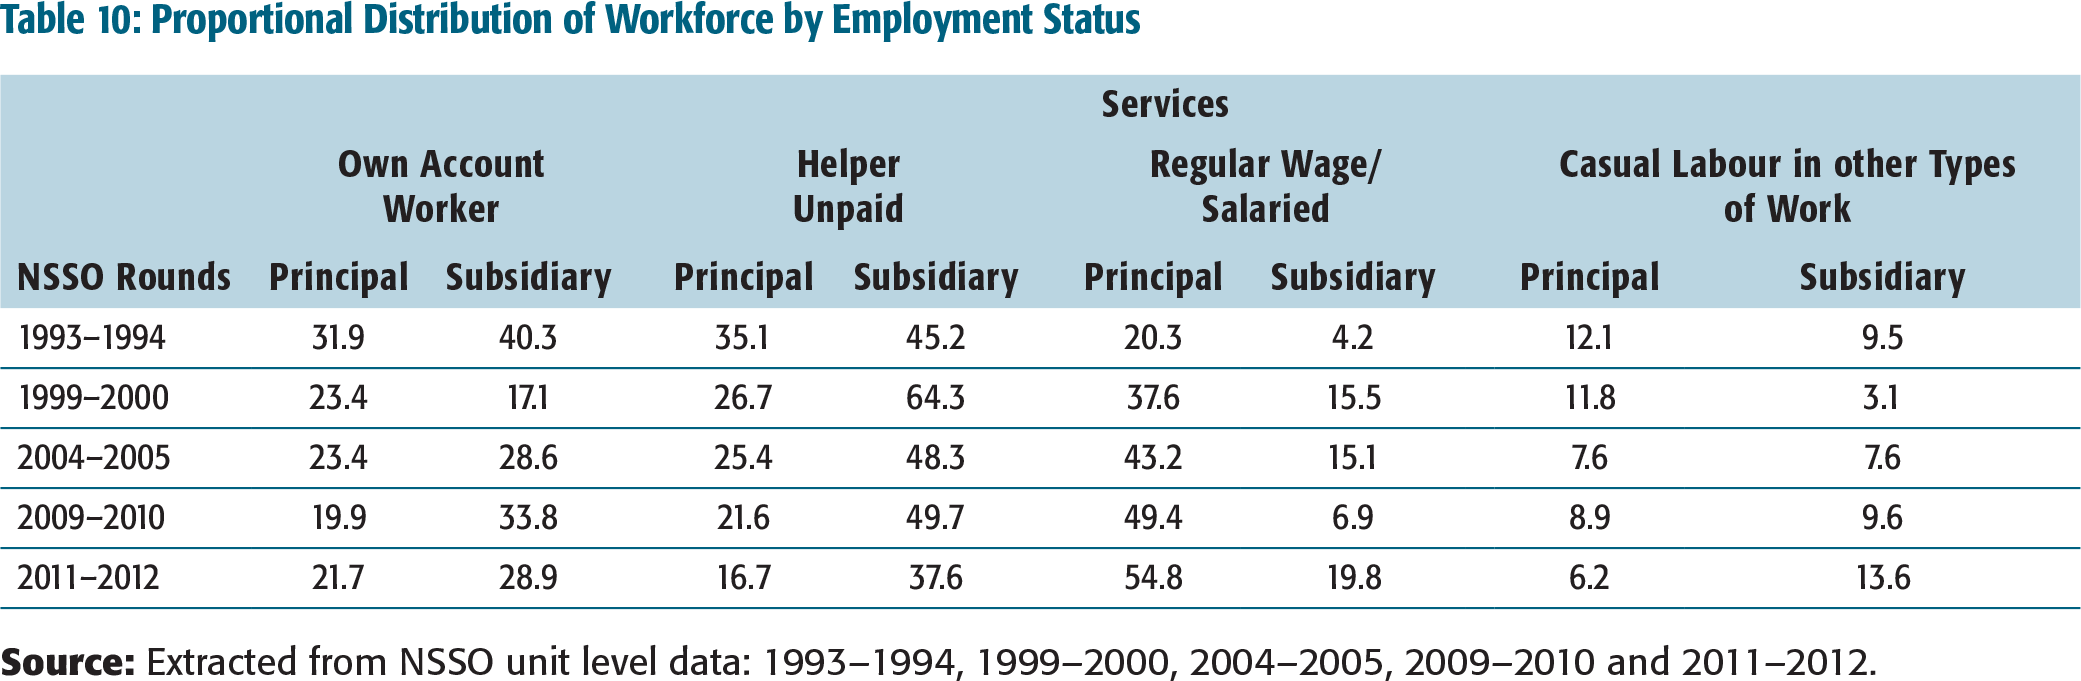
In the services sector, a good trend of rural females engaged as regular wage/salaried class in principal capacity is seen steadily increasing (Table 10). At the same time a decline in rural females engaged as own account workers, helpers and casual labour can also be observed.
The ILO Research Paper No. 10 (Kapsos, Silberman, & Bourmpoula, 2014) attributes the decline in female labour force participation to the rising number of females in the age group of 15–24 attending educational institutions, an increase in household income levels, and the measurement issue in capturing female work in NSSO surveys. The next section explores the effect of these factors on female labour force participation.
Education Effect
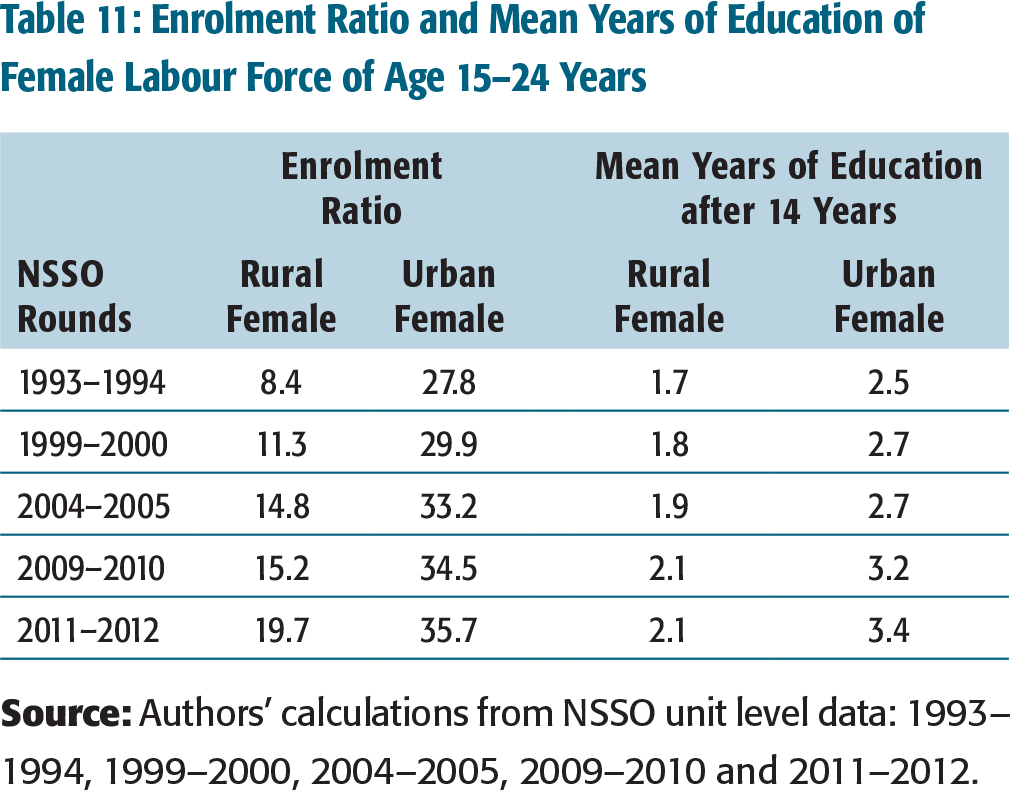
With the introduction of the Sarva Shiksha Abhiyan8 and the Right to Education Act, 2009, there has been an improvement in the basic education level up to 14 years of age. But for better employability, the enhancement of skills after 14 years is a prerequisite. A look at the mean years of education after 14 years shows an increasing trend since 1993–1994, though still low at around two years for rural females and three-plus years for urban females in the last two NSSO rounds (Table 11).
Enrolment Ratio and Mean Years of Education of Female Labour Force of Age 15–24 Years
Among the rural females in the 15–24 age group, who reported their current status under Code 91, 9
NSSO Employment–Unemployment Survey (various rounds).
Another factor that can facilitate entry of female youth is the declining fertility rate. The total fertility rate (TFR) in rural India has declined from 3.7 in 1993–1994 to 2.6 in 2011–2012. 10
Ibid.
Income Effect
To assess the impact of income effect on withdrawal of females from the labour force, the household MPCE (monthly per capita employment) data from the EUS for the period from 2004–2005 to 2011–2012 was examined. The household level MPCE data was used to form decile classes. These decile classes divided the households into 10 classes such that the lowest class represented the lowest 10 per cent in the spectrum of income distribution and the top or the highest decile class represented the top 10 per cent of the households in terms of their expenditure. Using MPCE for the study of the income distribution may not be a good proxy for income in higher classes as then the savings and expenditure on certain other luxurious activities/items like tourism and jewellery, to name a few, are not accounted for. However, in the lower classes of income where the expenditure on food, housing, clothing, education and medicine form a high percentage of the total MPCE, the approximation works quite well.
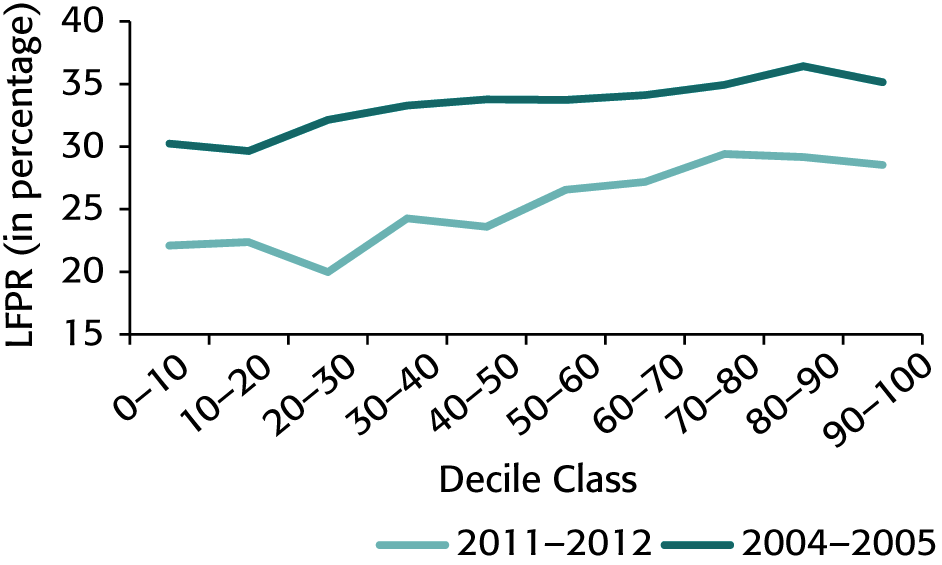
It is observed from Figure 1 that there has been a decline in the rural FLFPR among all the MPCE decile classes 11
The MPCE decile classes are formed in such a way that each class has same proportion (10 per cent) of the population and are ordered in an increasing level of MPCE.
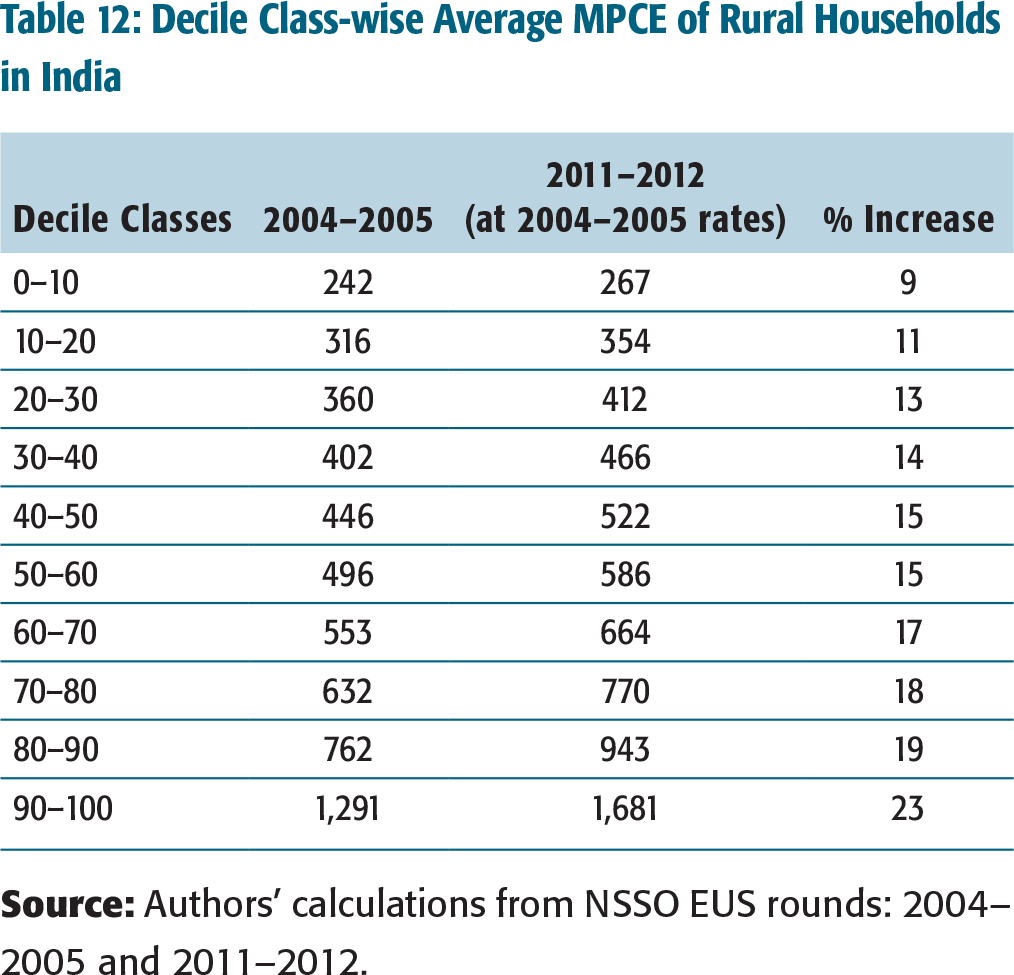
The magnitude of improvement in the average per capita consumption expenditure in rural areas varies between 9 per cent and 15 per cent up to the 6th decile class, whereas for the rest 4 deciles, it varies between 15 per cent and 23 per cent (Table 12). The decline in female labour force participation in the lower decile classes may be attributed to income effect because the females might have withdrawn from distress employment, but the same argument does not support the withdrawal of females belonging to the middle and higher decile classes (Figure 1).
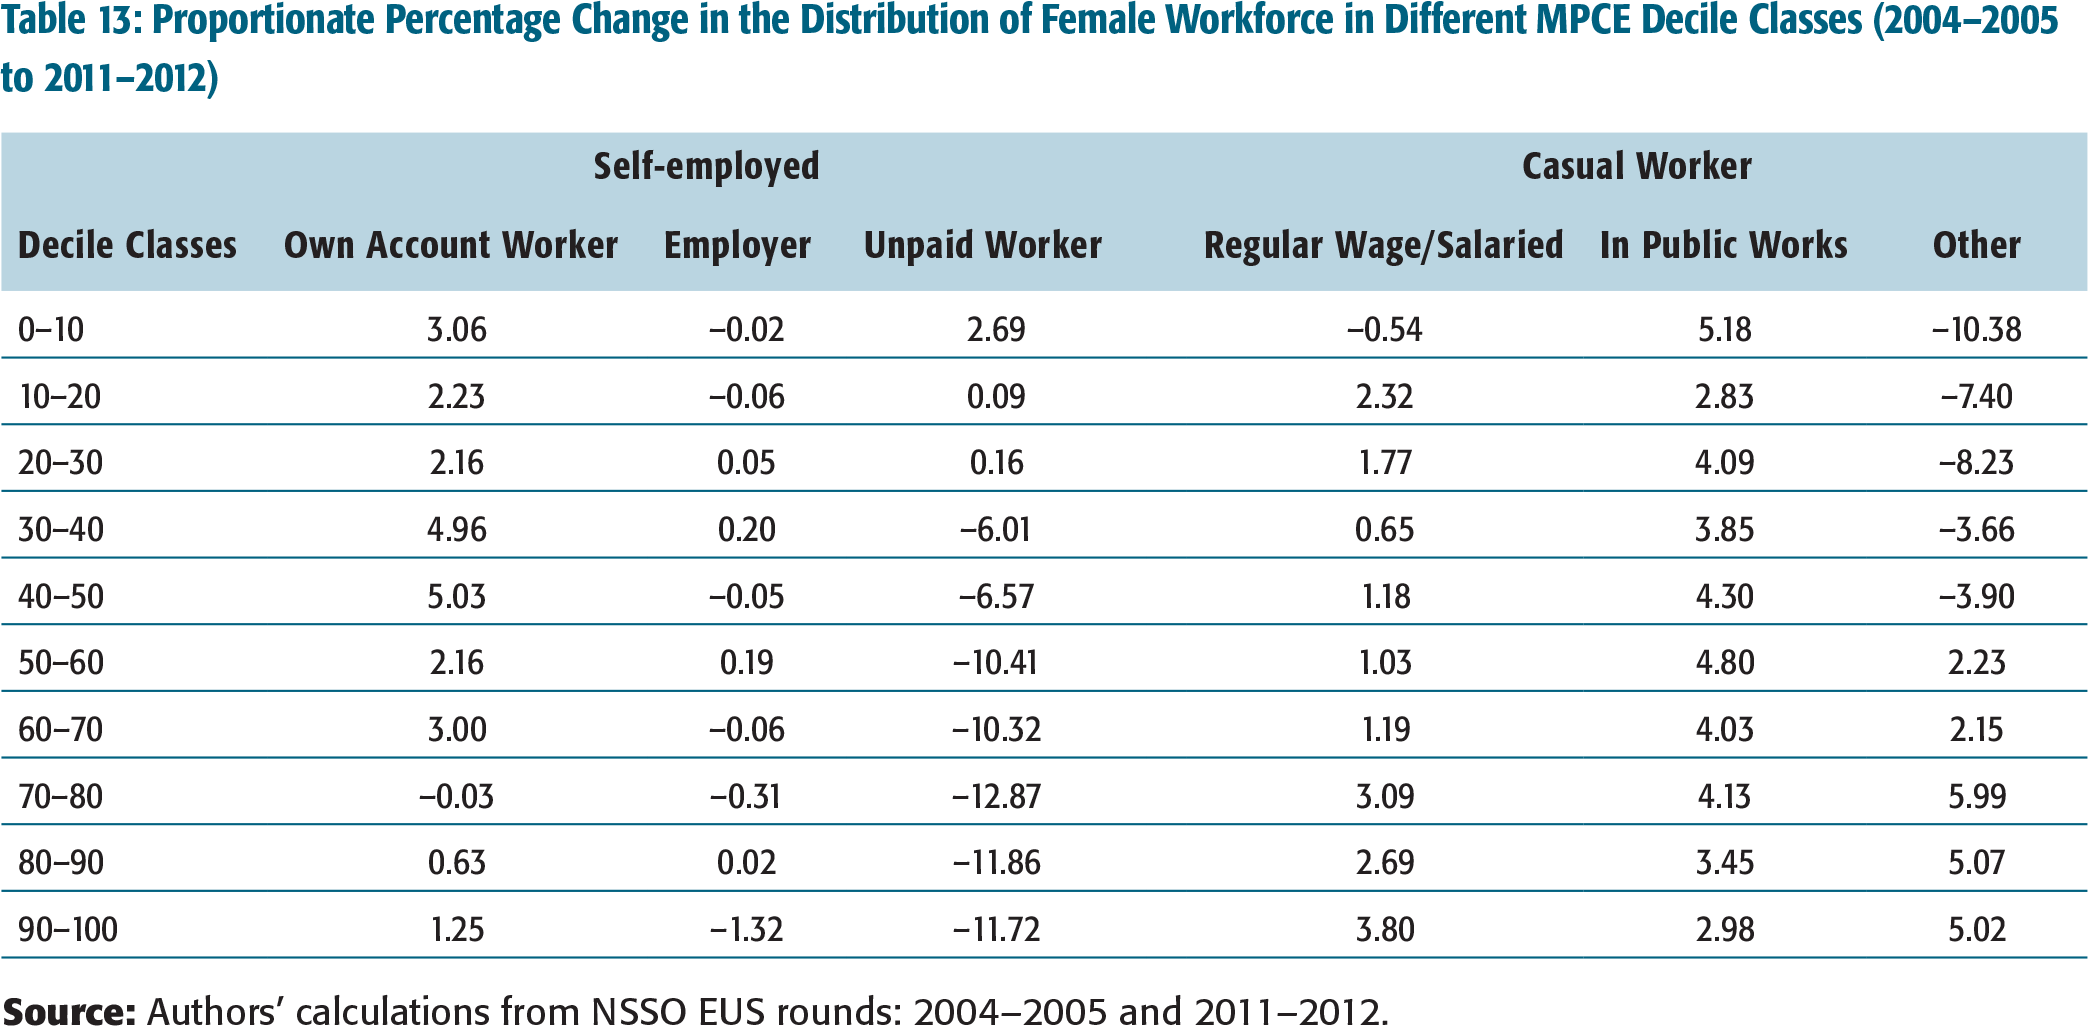
The decile class-wise distribution of workforce into different employment status reveals that as compared to 2004–2005, in 2011–2012, there has been an increase in women working as a self-employed own account worker in the lower and middle decile classes, while a decline is observed especially in the higher decile class women working as an unpaid helper. The data also suggests an increase in regular salaried/wage employed across all decile classes and a significant increase in casual workers in public works. The proportion of females in casual works other than public works declined significantly, especially in lower decile classes, whereas it increased in higher decile classes (Table 13).
Decile Class-wise Average MPCE of Rural Households in India
This clearly indicates a shift to casual work in the public works category which can be attributed to the Mahatma Gandhi National Rural Employment Guarantee Act (MGNREGA). But the average person-days generated per household under MGNREGA has been hovering between 45 and 50, which suggests that, although preferred, the work opportunity generated by MGNREGA is not sufficient. Also, another key important implication is the fall in the unpaid helper category. The movement or shift in the employment status across decile classes clearly indicates that women have preference for a decent kind of work. Also, as alternatives to remunerative employment are provided by programmes like MGNREGA, they do not prefer working as unpaid workers. This motivation towards remunerative employment is well supported if we take a look at trends in wage rates.
Although MPCE is a proxy for per household income, wage data as available in NSSO covers only two sets of employment, namely, casual and regular job, leaving out the self-employed where nearly 50 per cent of the female workforce is engaged. However, an attempt to analyse the wage data of workers in regular and casual employment (Table 14) shows that in terms of 2004–2005 prices, the regular female workers have witnessed more increase in their wages/salaries. In rural areas, the female wages/salaries for regular type of work increased by 30 per cent in 2011–2012 over 2004–2005 as compared to only 23 per cent for males.
Proportionate Percentage Change in the Distribution of Female Workforce in Different MPCE Decile Classes (2004–2005 to 2011–2012)
Percentage Change in Wages/Salaries of Workers in Rural India
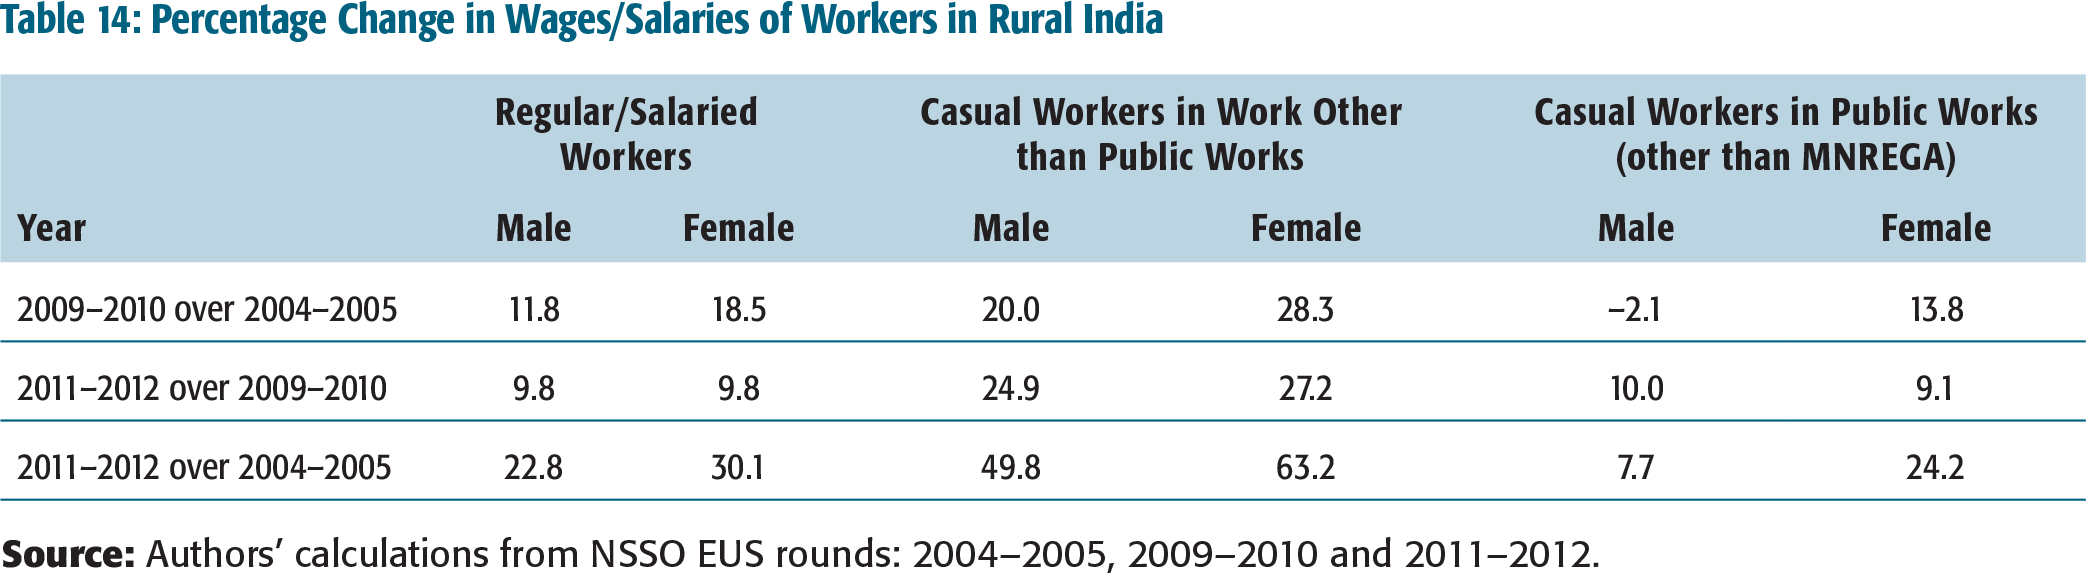
In the case of casual workers involved in works other than public works, the wages for female workers appreciated by 63 per cent as against 50 per cent for the male counterparts in 2011–2012. For those involved in public works other than MNREGA, women workers experienced better hike in their compensation/wages.
These results are in contradiction with the argument that it was the increase in income of the head of the household which caused women especially in rural areas to withdraw from labour force. The labour market outcomes in monetary terms were much better for females than for males. Drawing from the labour supply theory in economics, since the wage outcomes are higher for females, this must increase the opportunity cost of the leisure or the tendency to stay out of labour force by the choice per se. This should, in turn, be a motivating factor for them to come out and work. But it is also important to take cognizance of the sectoral wage changes.
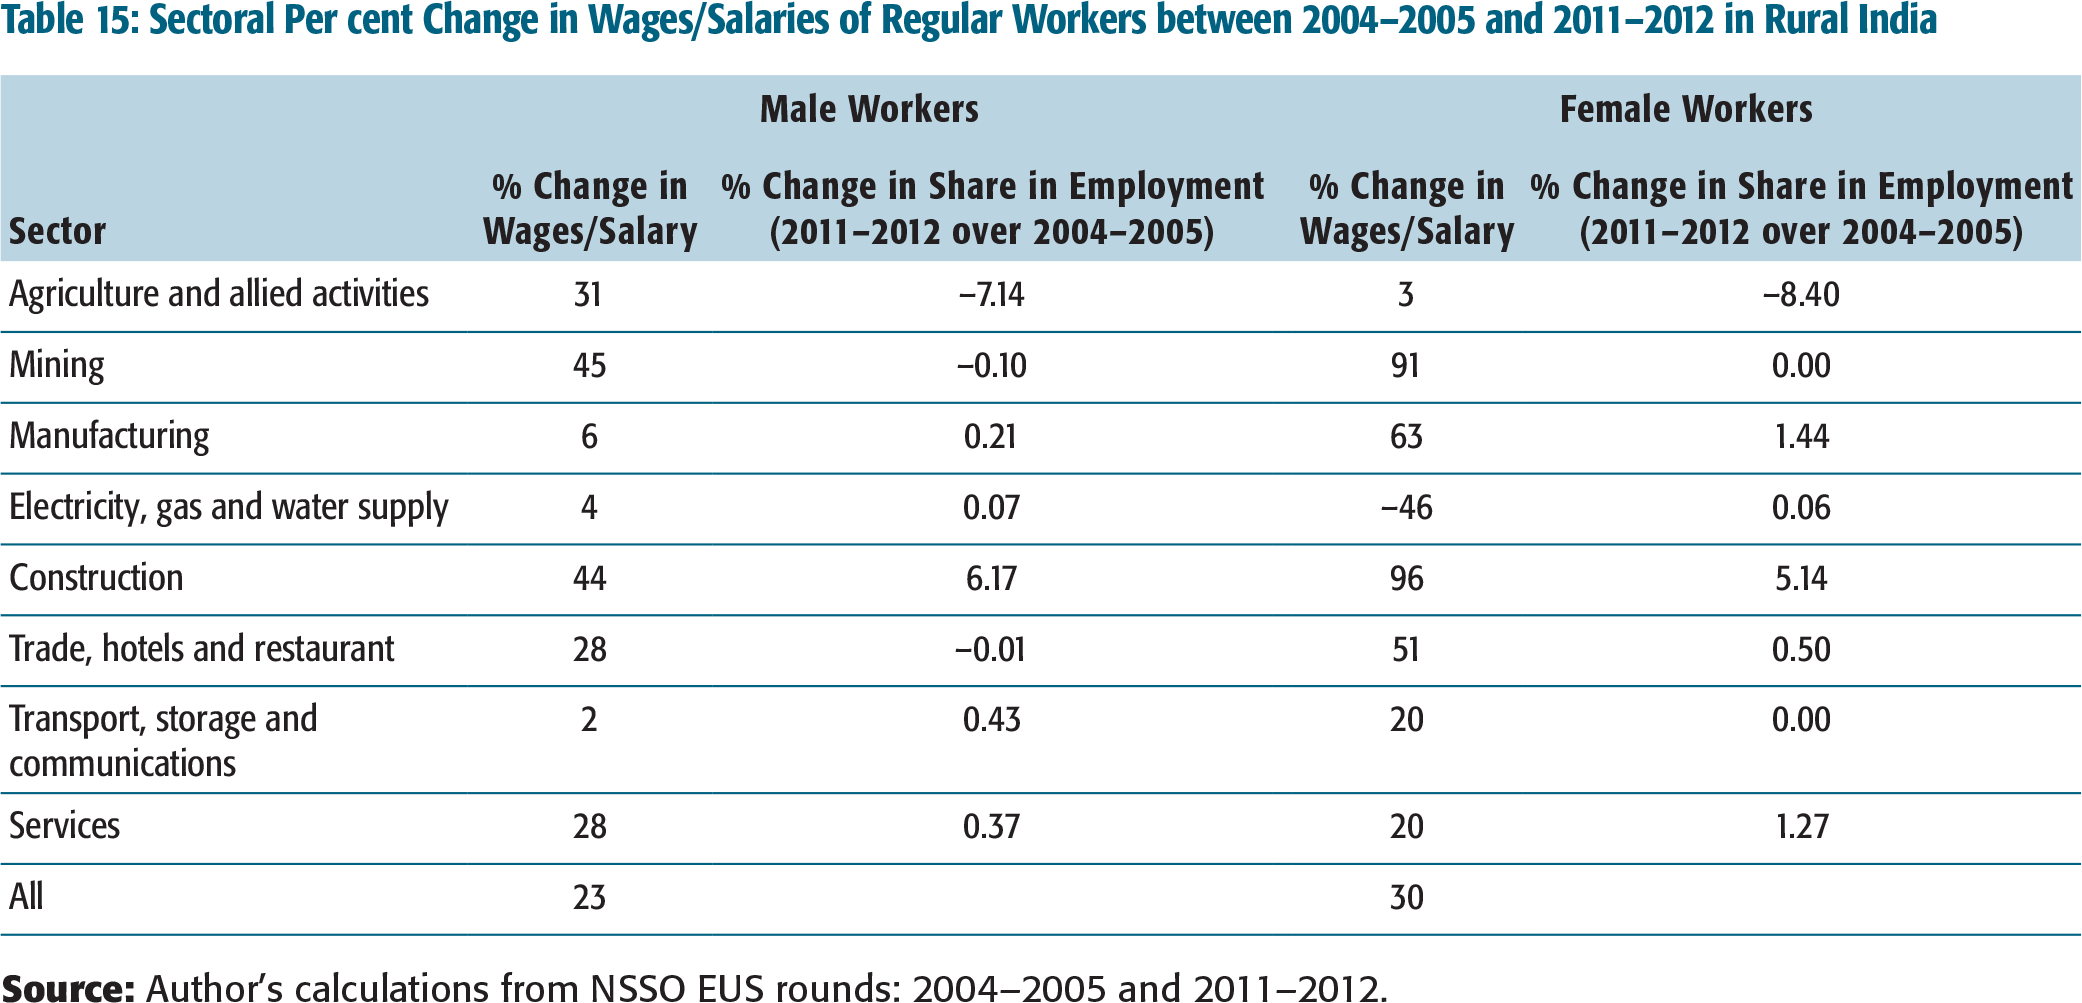
It can be observed from Table 15 that rural females experienced a rise in wages in mining, manufacturing, construction, trade, hotels and restaurant, and transport. The services sector experienced a less proportionate increase in wages of females as compared to that of males. The manufacturing sector which employed 10 per cent of the female workforce in rural areas in 2011 and registered an increase of 1.44 per cent in jobs between 2004–2005 and 2011–2012 saw a sharp increase in wages of female workers as compared to their male counterparts. Construction is another sector where there is a significant rise in wages for women with a 5.14 per cent increase in jobs created for females. There is a steep fall in the proportion of jobs in agriculture and allied activities for females between these two NSSO rounds. Although manufacturing, construction, trade, hotels and restaurants can be economically fruitful sectors for female workforce, the share of female workforce in regular employment in these sectors was only 5.6 per cent as compared to 10 per cent for males in 2011–2012. Thus, the women who lost jobs in agriculture did not find place in other sectors of the economy. Looking at the educational profile of the rural female labour force (Figure 2), clearly, it is the low educational attainment of rural females that acts as a barrier to their smooth inter-sectoral labour mobility. Nearly 69 per cent of the rural females are either illiterate or have educational attainment only up to the primary level.
Sectoral Per cent Change in Wages/Salaries of Regular Workers between 2004–2005 and 2011–2012 in Rural India
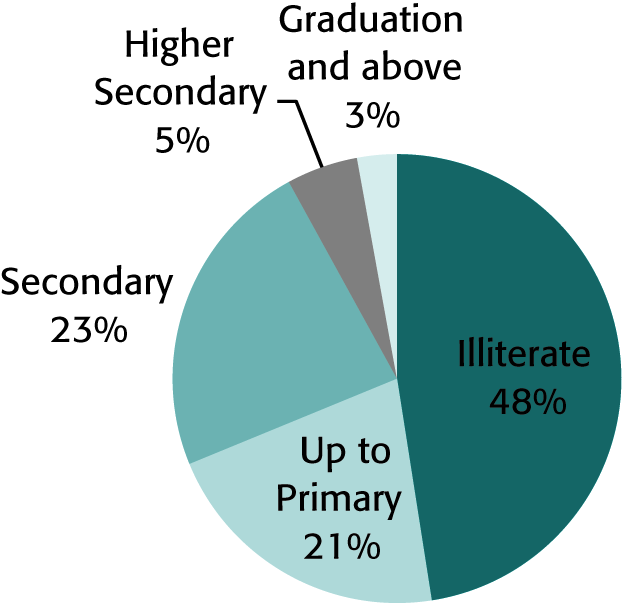
Thus, more than the income effect, it is the lack of sufficient opportunities commensurate with the skill levels of the women in rural areas that has caused the withdrawal of females from the labour market.
Gender Gap
Table 16 shows the male–female gap in the LFPR across Indian states during the period from 1993–1994 to 2011–2012 highlighting their minimum, maximum and median rates.
LFPR (in %) (1993–1994 to 2011–2012)
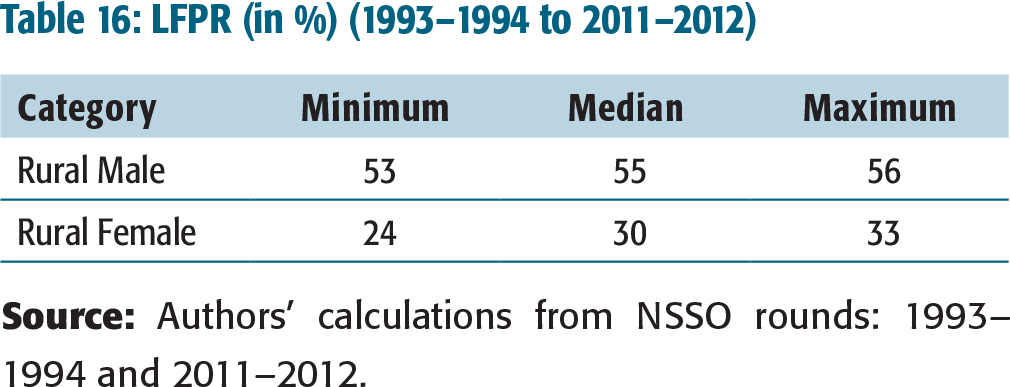
It is evident that the gender gap between male and female labour force participation is 25 percentage points in rural India (median value of 55–30). Across rural India, it can be seen that during the period from 2004–2005 to 2011–2012, except Himachal Pradesh, all other major states experienced an increase in the gender gap between male and female labour force participation (Table 17). It ranges from 2 percentage points in Himachal Pradesh to 43 percentage points in Bihar. The maximum increase in the gender gap between 2004–2005 and 2011–2012 was observed in the states of Karnataka, Gujarat, Haryana, Madhya Pradesh, Punjab, Jharkhand and Odisha. If the states are arranged in ascending order of the gender gap in the LFPR in rural India, all the states which show a sharp increase in the gender gap in 2011–2012 figured in the middle range in 2004–2005 with the gender gap widening between 11 (Odisha) and 16 (Karnataka) percentage points in 2011–2012.
Gender Gap in Rural LFPR (in %) (2004–2005 to 2011–2012)
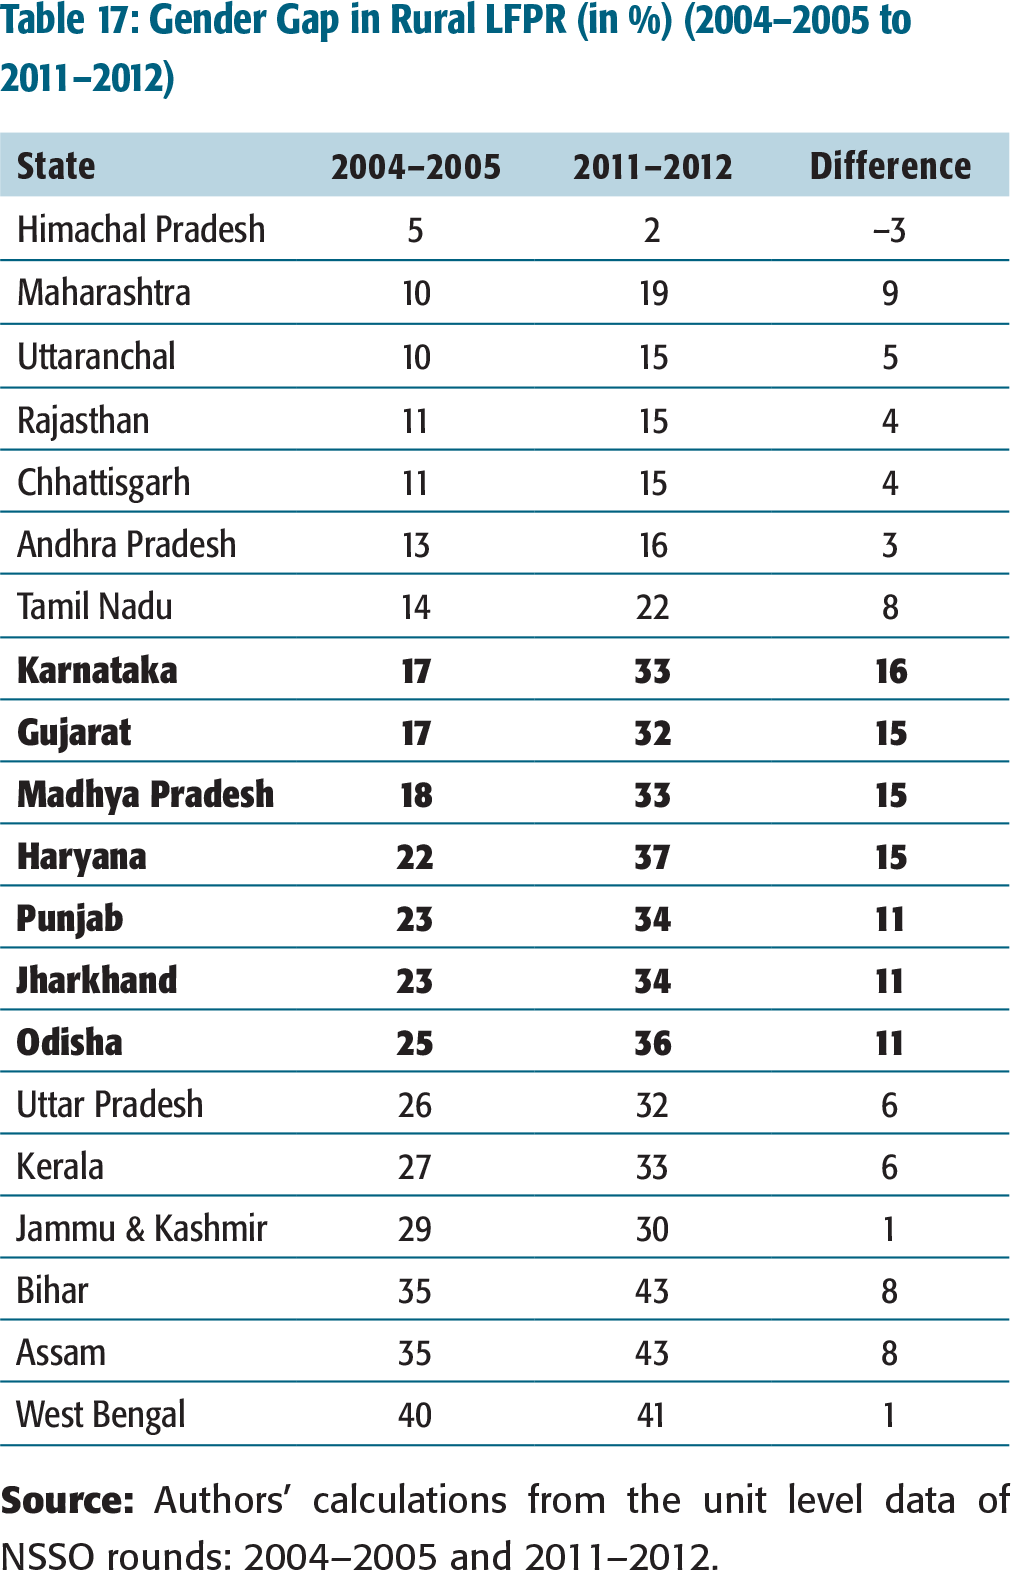
So, the question is what happened to these states in the middle range of the gender gap spectrum that forced women to withdraw from the labour force? To answer this, (Table 18) analyses the state-wise change in sectoral workforce composition in rural India between 2004–2005 and 2011–2012.
Change in Rural Sectoral Workforce (in million) (2011–2012 over 2004–2005)
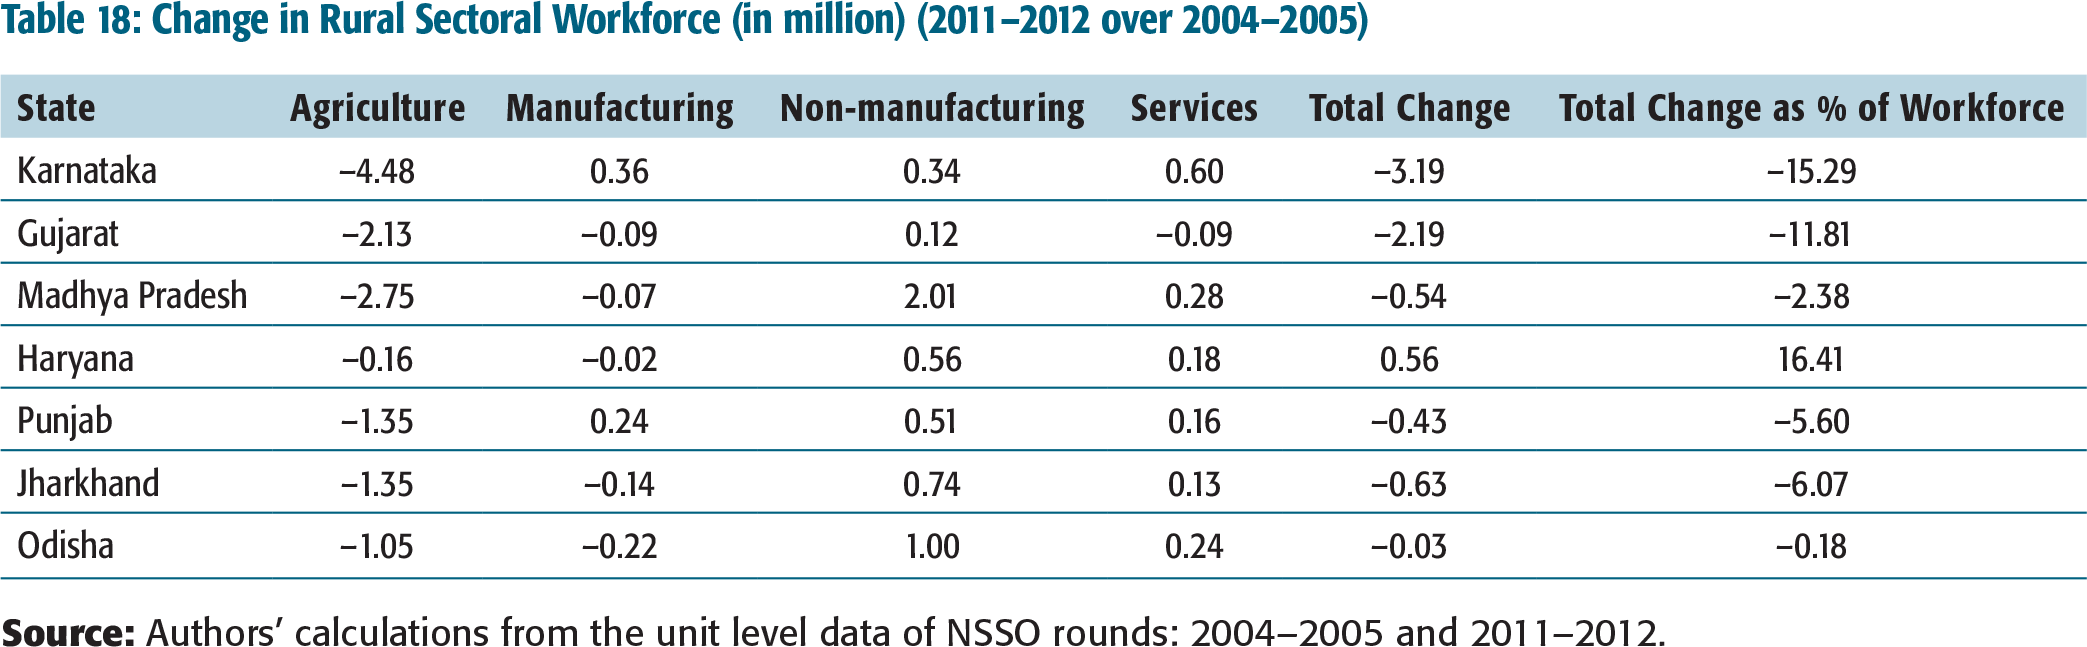
It is observed that agriculture, which was the primary work area of women, has seen a decline across these states. However, the women workers who have been displaced from agriculture did not find place in non-farm sectors. The jobs created were mostly in the construction and utilities sector where women have a very small share in employment. Even in the service sector, jobs created were in transportation, storage, communications, trade, hotels and restaurants which also did not benefit those who had to leave agriculture. With rural females mostly employed as the own account worker, unpaid helper or casual worker, the switch over to unskilled work in other sectors was limited considering their educational profile. Hence, the women in rural areas can be said to have experienced more of a discouraged worker effect that further pushed them out of the labour market.
Measuring the Female Labour Force Participation
It has been pointed out that there are measurement issues with the NSSO surveys which have been the reason for a significant underestimation of the female work (Kapsos et al., 2014). A large number of literature is available on data underestimation. Women are involved in subsistence and extended SNA activities 12
Non-economic activities generating services (and some goods) that are produced by households without undergoing monetary transactions.
TO SUM UP
Among all the arguments, income effect, education effect and the problem of underestimation, what is left unnoticed is the structural transformation of the economy and its resultant impact on the female labour market in the whole process. With an increase in income levels of the households, a woman no longer prefers working as an unpaid worker or a helper or as a casual worker unless the work is remunerative (as in MGNREGA). However, such opportunities are limited in rural India and as a result women are not finding jobs matching their preference (regular part-time jobs close to their households). Furthermore, with low skill levels, jobs in the non-farm sector are also limited. These factors perhaps have led to the withdrawal of women from the labour force.
POLICY STRATEGIES
The decline observed in rural female labour force participation is due to a complex mix of several forces working simultaneously. While the focus is on education and income effect, our findings reveal that the lack of sufficient non-farm jobs in rural areas has forced women to stay out of the labour market. The wage conditions prevalent in the rural labour market show that female workers have experienced a better hike in wages/salaries; it implies that the gender gap in terms of wages/salaries has started declining. But the opportunities available in rural India which are compatible with their education levels are dying out. Dedicated efforts in skilling, re-skilling and improving their educational outcomes through infrastructure development, female teacher availability, incentives along with creating an adequate number of favourable job opportunities are necessary to harness their potential.
Considering the constraints experienced by the rural females to enter the labour force (Tables 4 and 5), policy initiatives are required to make them economically active. The initiatives should focus on microfinance-supported self-help group-centred activities, which will make them economically active along with handling domestic duties. Also, this will help to address the need for working finance assistance as expressed by the females willing to accept work. If such policy initiatives materialize and the 34 per cent women in activity codes 92 and 93, who are willing to work, enter the labour force, the rural female participation rate would increase from the current 25.3 per cent to 39 per cent.
Furthermore, rural manufacturing should create jobs that can be undertaken by women in their household or as a community. Such focused steps can increase the participation of rural females back into the labour force.
For females in the 15–24 age group who are about to enter the labour force, vocational and basic skills training need to be provided so that they can enter the labour market overcoming social inhibitions and restrictions. Lack of adequate infrastructure in terms of roads and connectivity can also be deterring women from undertaking work in the nearby areas. Thus, improving connectivity between the villages and the satellite towns and small cities will also enhance female labour force participation.
India has already started realizing its demographic dividend and female population which account for nearly 50 per cent of the population is an asset to be utilized carefully if we have to reap this window of opportunity. Declining fertility rate and child dependency ratio are factors which can facilitate female workers to come out. In short, a bubbling rural economy is the need of the hour to create jobs and absorb the bulging economically active female population.
*The views expressed are personal and do not represent the organization the authors represent.