
Abstract

Executive Summary
Banks in India have focused on non-interest income streams to complement their income from traditional interest earning activities for some years now. This move to innovation adoption and new income streams has been more pronounced for new private and foreign banks, while there appears to have been certain hesitation on the part of public sector and old private banks. This article studies the impact of the move to new income streams and the consequent rising diversification on performance (as measured by profitability and stability of income) for Indian banks.
A comparative analysis of income generated from these income streams for different bank groups in India shows that new private banks and foreign banks in India have been more successful than public sector banks in generating a greater proportion of their income from non-interest and fee-based sources. However, this increasing diversification cannot be linked to better risk-adjusted performance in the Indian context. Using multiple regression analysis, the impact of diversification and increasing share of fee-based income on profitability and risk-adjusted profitability is questioned for all banks in India over the period 2005–2012.
The article finds that the rising share of fee-based income and non-interest income in total income and diversification has a positive impact on profitability, but the impact on risk-adjusted performance and hence stability is not statistically significant. While the results show a positive impact of diversification on profitability, the article underlines that the impact direction of diversification measures may be negative, which is in agreement to what many studies have shown in the US, European, Australian and Indian contexts.
This article considers the impact of diversification in non-interest income separately from diversification in total income. This diversification score helps to know if the banks are generating their non-interest income from only fee income or only their own investments or they have diversified the non-interest income generation by focusing on both. Importantly, there is a positive impact of increasing share of ‘fee income’ in both total income and non-interest income on profitability as well as risk-adjusted measures. The results underscore that while public sector banks need to generate more income from fee-based activities, it would be imperative to choose sources of fee-based income that remain stable and have a positive impact on risk-adjusted measures.
Innovation, one of the key drivers of growth, has been defined by the Oxford Dictionaries, 1
Oxford Dictionaries (innovation). Accessed on 10 February 2013 through oxforddictionaries.com/definition/english/innovation
This appears to be especially relevant while discussing innovative bank income streams in the Indian context. Innovation in banking has encapsulated new technology and channels, new products and services, new markets and institutions and new business models. This has led the banks to diversify into new income streams comprising non-interest income, of which fee income is a crucial component. This article asks whether the move to innovation in income streams and the consequent rising diversification in income has impacted profitability and stability of income positively for Indian banks. While banks have adopted new income streams owing to an overriding concern to reduce dependence of profitability on fund-based sources and diversify the income generation, the consequences in terms of stability of earnings seems unclear. While some studies (see, for example, Busch & Kick, 2009; Davis & Tuori, 2000; Smith, Staikouras & Wood, 2003) point to a positive impact of diversification on financial performance and risk profile, others show a negative impact of the move into fee-based activities on risk-adjusted performance of banks (De Young & Roland, 2001; Stiroh, 2004; Stiroh & Rumble, 2006). In the Indian context, RBI's former Deputy Governor, Gopinath (2011) indicated that fee-based income may not be less risky than traditional lending activities and there is a need to understand the underlying risks and effectively monitor the provision of such services.
Diversification has been more pronounced for banks in the United States and Europe. De Young and Rice (2001) observed that between 1980 and 2001, non-interest income in the US commercial banking system increased from 0.77 per cent to 2.39 per cent of the aggregate banking industry assets, and increased from 20.31 per cent to 42.20 per cent of the aggregate banking industry operating income. For developed countries, Kaufman and Larry (1994) showed an increase in the share of non-interest income to total income in the banking sectors of most developed countries between 1982 and 1990. Esho et al. (2004) pointed out that Australian credit unions diversified their activities in the 1990s to reduce their reliance on interest revenue which took three primary forms: (i) a change in pricing policy with transaction fees on loans and deposits; (ii) new financial services including insurance, funds management and off-balance sheet activities that generated commissions and facility fees; and (iii) shift in the portfolio mix of assets away from personal loans and advances into residential lending.
Importantly, Feldman and Schmidt (1999) pointed out that the composition of non-interest income had been changing for the US economy with fee income becoming the dominant source of non-interest income received by banks made possible by technological and regulatory changes opening up new sources of non-interest income.
Gamra and Plihon (2011) suggested that emerging market banks are required to innovate in services and products, to differentiate strategies, and fundamentally transform their business into a much wider array of non-traditional services. This article shows that from 1997 to late 2007, emerging market banks saw non-interest income as a share of net operating revenue rise from 28.2 per cent to around 36.7 per cent with the biggest increase of non-interest income being in trading.
The shift towards non-interest income has been significant for Indian banking. Umakrishnan and Bandopadhyay (2005) compared the difference in income composition for new generation private sector banks, foreign banks, public sector and cooperative banks during 1999–2004 and concluded that the share of interest income in total income had been declining over the years. The RBI Report on International Trade in Banking Services (2010) showed that foreign bank branches operating in India had been more successful in generating income from fee-based services than Indian banks’ branches operating outside India. Interestingly, the report also pointed out that while for foreign banks operating in India, derivative, stock, securities, foreign exchange trading services’ and ‘financial consultancy and advisory services’ were the major source of fee income, for Indian banks operating abroad, the largest proportion of fee income came from ‘credit-related services’ and ‘trade–finance related services’. Uppal (2010) showed that for banks in India, interest income was continuously decreasing on account of deregulation in interest rates and non-interest income was rising. Sahoo and Mishra (2012) related greater extent of operational diversification in banks with greater fluctuations in financial performance.
Fee-based Income as % of Total Income (SHFEE)
The primary role of a bank is to accept deposits and make loans, profit being the difference between the costs of deposits and the earnings from lending. However, in the last two decades, the environment facing banks have changed drastically, with banks’ income no longer confined to lending and income generated from its own funds. Fee-based income or income earned from sources that do not involve exposure to bank's own funds is globally becoming more and more important for the bank's income statement.
Following the methodology of diversification scores developed by Stiroh and Rumble (2006), this article uses such diversification scores generated for a comparative analysis of bank groups in India. Using multiple regression analysis, it questions the impact of diversification and increasing share of fee-based income on profitability and risk-adjusted profitability measures for all banks in India over the period 2005–2012. The article thus tries to delve into the diversification brought about by the move to innovative income sources and its impact on bank profitability and income stability.
Literature Review
The primary role of banks as intermediaries channelizing savings into investments is underlined by deposit-taking and lending activities. Smith et al. (2003) pointed out that while the basic functions of banks and other financial service companies remained relatively constant over time, these functions are now being provided through different products and services. Economic forces have led to financial innovations, in turn fostering competition and diminished to an extent of cost advantage. Traditional banking, as a result, has lost profitability, with banks diversifying into new activities that may bring higher returns.
The shift of banks towards new business lines and fee-based income has been more prominent in developed countries and therefore much of such literature has emanated from the banking industries of Europe and the US. De Young and Rice (2004b) documented that for the US economy, a part of increases in non-interest income flow was coming from new lines of business made possible by deregulations introduced since 1990s while a part stemmed from producing traditional banking services with new production processes that were made possible by advances in information technology, communications channels and financial processes.
In this context, a vital question being raised in economic literature is whether the growth in income from fee-based activities has contributed to greater stability in bank income. Davis and Tuori (2000) showed that banks obtained diversification benefits in increasing non-interest income, which in turn helped to smooth profitability. Smith et al. (2003) examined the variability of interest and non-interest income and their correlation for banking systems of EU countries for the period 1994–1998. This article finds that an increased importance of non-interest income for most bank categories have stabilized profits in the European banking system in the given years. However, it does not establish that non-interest income is invariably more stable than interest income.
Chiorazzo, Milani and Salvini (2008) found that income diversification increased risk-adjusted returns for Italian banks during the period 1993–2003. Busch and Kick (2009), studying the impact of growth of non-interest income on the financial performance and risk profile of German banks between 1995 and 2005, found evidence that risk-adjusted returns on equity and total assets had both been positively affected by higher fee income activities for German universal banks. They also found that savings and commercial banks having a greater share of fee-based income charged lower interest margins, implying subsidization between interest and fee business.
Inaba and Hattori (2007) showed that Japanese commercial banks had also been expanding their fee-based business and found a positive correlation between Japanese commercial banks’ fee business income and net interest income in the second half of the 1990s. They pointed out that this relationship led to an increase in the variability of their Return on Assets (ROA) but did not affect their management stability over that period. However, during 2001–2005, such a positive correlation was not clearly observed.
Umakrishnan and Bandopadhyay (2005) indicated that diversifying to fee-based income was a more viable option for banks in the long run and needed constant feel of the market requirement, innovation and skill upgradation. Arora and Kaur (2009) examined the internal determinants for diversification of banks in India using aggregate bank level data for foreign sector banks, nationalized banks, private banks and the SBI group. They found that risk, cost of production, regulatory cost and technological change were very significant for bringing variation in the income structure of the banks.
However, many studies pointed to a greater dependence on non-interest income contributing to increased volatility in bank income. De Young and Roland (2001) and Stiroh (2004) found this to hold for the US firms. De Young and Roland (2001), analysing the quarterly movements in revenues and profits at 472 large and medium-sized banks between 1988 and 1995, found that earning volatility increased with greater share of revenue coming from fee-based activities. They pointed out three reasons why fee-based income may not be more stable than traditional banking activities. First, banks may have qualitatively different relationships with their fee-based customers as opposed to their traditional banking customers, the relationship with the latter tending to be stronger. For example, during a downturn, the fall in revenue from fee-based income like mutual fund sales may be sharp while interest earnings from lending activities is not likely to fluctuate much. Second, expanding production of fee-based activities requires much greater fixed costs than increasing production of lending activities. Third, as fee-based activities do not require banks to hold capital against them, banks can take advantage of this to raise return to equity. This creates incentives for banks to arbitrage risk-based capital regulations by transforming on-balance sheet risk from interest-based activities to off-balance sheet risk from fee-based activities.
De Young and Rice (2003) showed that large banks tended to generate relatively more non-interest income. The article also found that well-managed banks relied less heavily on non-interest income while relationship banking tended to generate non-interest income. Further, some technological advances (e.g., cashless transactions, mutual funds) are associated with increased non-interest income while other technological advances (e.g., loan securitization) are associated with reduced non-interest income at banks.
Stiroh (2004), examining the link between risk-adjusted bank performance and diversification for community banks from 1984 to 2000, showed that higher non-interest income was negatively linked with risk-adjusted performance. Esho et al. (2004) pointed out, in their study spanning 198 Australian credit unions, that increased reliance on fee income generating activities was associated with increased risk .
Stiroh and Rumble (2006) showed that diversification benefits were more than offset by increased exposure to non-interest activities. These non-interest activities were volatile but not more profitable than lending activities. Stiroh and Rumble (2006) decomposed the impact of the move to greater fee-based activities into a ‘direct exposure effect’ (coming from a greater dependence on new activities) and an ‘indirect diversification effect’ (coming from the resultant change in revenue concentration). Analysing the performance of the US financial holding companies (FHCs) from 1997 to 2002, this article showed that while FHCs adopted ‘cross-selling’ for diversifying revenue and lowering costs, this actually meant exposure to multiple income streams with similar shocks and the greater correlation across revenue streams significantly hampered diversification benefits.
Vallascas, Crepi and Hagendorrff (2011), analysing the impact of income diversification on the performance of Italian banks during the recent financial crisis, showed that institutions which were diversified before the crisis experienced the largest decline in performance during the financial crisis.
In the Indian context, Sahoo and Mishra (2012) found that the banks with greater extent of operational diversification suffered from the problem of greater fluctuations in financial performance and a larger asset base did not necessarily help a bank to bring in stability in its financial performance. Moreover, greater efforts by the banks towards creating entry barrier or image advantage raised fluctuations in their financial performance.
While banks in India have recognized the importance of raising income from fee-based income activities and thereby reducing the dependence on fund-based income, there are many challenges in the way of moving to more fee-based activities and sustaining them, especially for public sector banks. It may be that, banks face certain barriers to adopting the orientation relevant to such new business lines, recognizing that fee-based income may not contribute to stable income and that the right choice of activities for income diversification are unclear.
Definitions and Methodology
The empirical analysis uses data on revenue sources and performance measures of banks in India for the period 2005–2012. The key variables to be used are identified and the importance of these variables is discussed in the context of the study.
Variables Definitions
Diversification Scores
Following methodological construct of Stiroh and Rumble (2006), diversification scores are built for the banks. In this article, ‘two’ diversification ratios are considered. The first considers the diversification in bank income into interest and non-interest income and the second considers the diversification of non-interest income into ‘commission, exchange and brokerage income’ and other components. ‘Other Income’ for banks in India comprises of ‘commission, exchange and brokerage’, net profit (loss) on sale of investments, net profit (loss) on revaluation of investments, net profit (loss) on sale of land and other assets, net profit (loss) on exchange transactions, and miscellaneous income. In the study, the income from ‘commission, exchange and brokerage’ is denoted as ‘fee income’. 2
The incomes included in ‘commission, exchange and brokerage’ include trade finance related services; payment and money transmission services; fund management services; financial consultancy and advisory services; underwriting services; clearing and settlement services; derivative, stock, securities, foreign exchange trading services (RBI, 2010).
This methodologically improves upon the existing literature by introducing a diversification score for non-interest income which will help to underline ‘how’ banks are generating their non-interest income. The components of non-interest income other than fee income are largely income generated from the bank's own investment. This diversification score thus helps to know if the banks are generating their non-interest income from only fee income or only their own investments or have they diversified the non-interest income generation by focusing on both.
Further, this refinement in methodology also helps to find the impact of such diversification of non-interest income on bank performance. This is important in the face of many studies showing that trading/investment income tends to be volatile and generates lower-risk adjusted returns (Gamra & Plihon, 2011; Stiroh & Rumble, 2006; Umakrishnan & Bandopadhyay, 2005). Importantly, it is ‘commission, exchange, and brokerage’ which ‘encapsulates income being generated from provision of new services and products by banks in the recent years’. Considering a separate diversification score for this component implies that focus can be on the impact of diversification of non-interest income on profitability and stability of income for banks. The first diversification score simply sees the impact of diversified income on bank performance. However, the second diversification score goes beyond that to underline the impact of the banks’ movement into ‘newer income streams’ (which had the most profound impact on ‘fee income’ in the years under study) on bank performance.
It helps to analyse whether with banks focusing on generating non-interest income, the movement to newer income streams (which will raise ‘fee income’) should bring in better performance or should the banks focus more on income from their own investments to positively impact profitability and stability. Further, the focus can also be on the ‘distribution’ of non-interest income into fee-based and other components of non-interest income.
Further, along with studying the impact of the share of fee income in total income (SHFEE), and the share of non-interest income in total income (SHNON) on bank performance, the article also considers the impact of the share of fee-income in non-interest income (SHFOT) on bank performance. It becomes crucial to consider separately the income generated from ‘fee income’, along with ‘other or non-interest income’ to see the implication of both the increasing share of non-interest income and the increasing ‘fee-income’ in non-interest income on bank profitability and stability.
Thus, diversification scores are generated from these two different indicators. Following methodological construct of Stiroh and Rumble (2006), diversification scores are defined as follows:


where,
SHIN = Share on interest income in total income
SHNON= Share of non-interest income or other income in total income
SHFOT = Share of ‘fee-income’ in non-interest/other income
SHOT = Share of ‘other components’ 3
Net profit (loss) on sale of investments; Net profit (loss) on revaluation of investments; Net profit (loss) on sale of land and other assets; Net profit (loss) on exchange transactions and miscellaneous income.
DIV 1 measures the degree of diversification in the banks revenue and a higher score reflects a greater degree of revenue diversification for the bank. A score of zero would suggest that all of the bank's revenue is coming from fee-based or fund-based sources, while a score of 0.5 would mean a complete diversification. Again DIV 2 reflects the diversification in non-interest income. Thus, a score of zero would suggest that the bank is generating all its non-interest income from either ‘fee-income’ or ‘other components’ and a score of 0.5 would suggest that the bank is generating non-interest income equally from both the components. The diversification scores are calculated from interest income, other income and ‘fee income’ averaged over the period 2005–2012 for each individual bank, unlike in Stiroh and Rumble (2006) where diversification scores for each period were averaged.
Risk-adjusted Measures of Performance
Risk-adjusted returns on equality (RAROE) and risk-adjusted returns on assets (RAROA)(see, for example, Busch & Kick, 2009; Stiroh & Rumble, 2006) are constructed as below:


where, ROA is the average Return on Assets for the individual banks over the period 2005–2012, ROE is the average Return on Equity for the individual bank over the period 2005–2012, σ ROA and σ ROE represent standard deviation of ROA and ROE. It may be seen that RAROA and RAROE are ‘Sharpe ratios’ defined by the average profits divided by the standard deviation of profits and represent profits per unit of risk.
A third measurement of risk-adjusted performance is also introduced following Stiroh and Rumble (2006), the ‘Z’ score defined as:

where, E/A is the mean equity to asset ratio; the Z score thus shows risk-adjusted performance, with a higher score denoting a better performance.
Methodological Construct
A comparative study of the share of income coming from fee-based activities for public sector banks
4
IBA categorizes nationalized banks and State Bank of India and its Associates together as public sector banks. RBI data classifies Scheduled Commercial Banks in India into five different groups according to their ownership and/or nature of operation, as under: (i) State Bank of India and its Associates, (ii) Nationalized Banks, (iii) Private Sector Banks, (iv) Foreign Banks and (v) Regional Rural Banks. Regional rural banks are not included in the purview of this study. Further, Private Sector Banks are further categorized as old and new Private Sector Banks. The final groups considered for the study are as follows: Group A: Public Sector Banks [(a) State Bank of India and its Associates, (b) Nationalized Banks]; Group B: Private Sector Banks [(a) Old Private Sector Banks (b) New Private Sector Banks]; Group C: Foreign Banks.
The Z scores are compared with the diversification ratios for banks groups
For analysing the impact of diversification on risk-adjusted performance, two basic empirical specifications are used:


where, the dependent variable Xi is
For independent variables, both average diversification ratios and average SHFEE and SHNON are considered. This is to ascertain that the impact of increasing income being derived from non-interest/fee-based sources is clearly understood. Control variables Log (Assets) [LASS], Log (Capital) [LCAP], Ratio of Net Non-Performing Assets to net Advances [RNPA] are also introduced (see, for example, De Young & Rice, 2004; Stiroh & Rumble, 2006).
Data Source
Data on income, expenditure, assets, liabilities and important ratios for banks in India over the period 2005–2011 are obtained from RBI database 6
Source: Reserve Bank of India (2012). Selected ratios of scheduled commercial banks. Accessed on 6 May 2012 through www.rbi.org.in
Empirical Findings
The article considers the share of income generated from fee-based and non-fee based sources for banks in India over the period 2005–2011. It first presents a comparative analysis of income generated from fee and non-fee income for different bank groups in India. Using diversification ratios, DIV 1 and DIV 2, it further compares the diversification in portfolio for banks groups in India and uses Z scores to compare the risk-adjusted performance between different bank groups. Additionally, the impact of diversification in income and rising share of fee-based income in other income on risk-adjusted performance for banks in India is examined using regression analysis.
Distribution and Diversification of Total Income
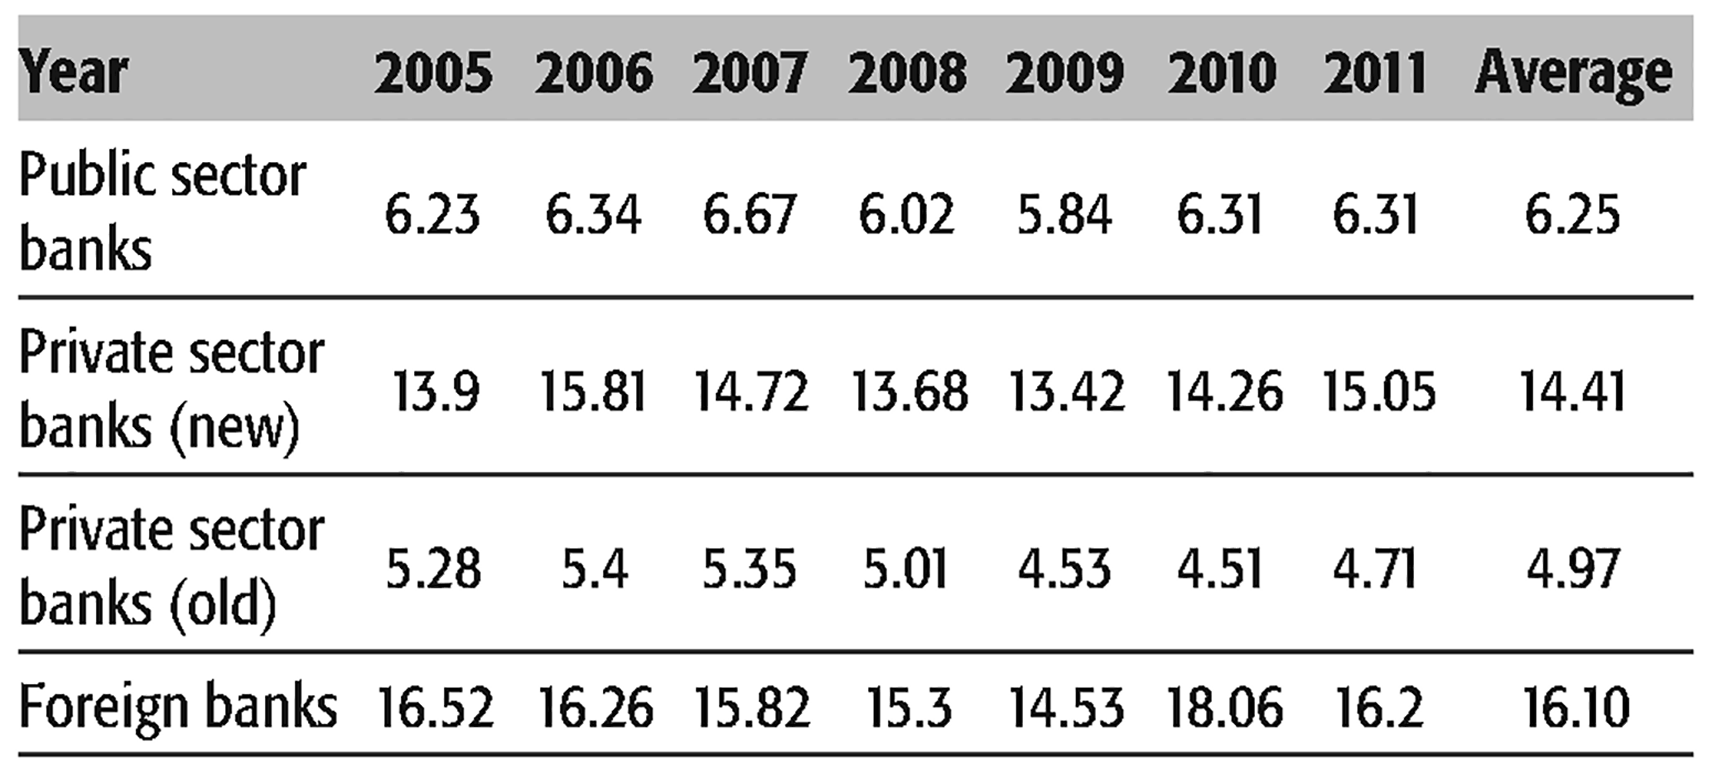
For public sector banks, the proportion of fee-based income in total income over the period 2005–2011 is on an average 6.25 per cent, while for new private sector banks and foreign banks, it is 14.41 per cent and 16.10 per cent respectively. Table 1 shows the percentage of income coming from fee-based activities for the three groups of banks considered in this study. As shown in Table 1, the percentage of fee-based income (commission, exchange, and brokerage) in total income for public sector banks has fallen marginally from 6.67 per cent in 2007 to 5.84 per cent in 2009. It stood at 6.31 per cent in 2011. For private sector banks (Old), there has been a fall from 5.4 per cent in 2006 to 4.71 per cent in 2011.
Both private sector banks (new) and foreign banks have been active in generating a considerable amount of their income from fee-based services. For private banks (new), the percentage of fee-based income (commission, exchange and brokerage) in total income has increased from 13.9 per cent in 2005 to 15.05 per cent in 2011. For foreign banks, percentage of fee-based income (commission, exchange and brokerage) in total income stood at 16.2 per cent in 2011.
'Interest Income’ as % of Total Income (SHIN) and ‘Other Income’ as % of Total Income (SHNON)
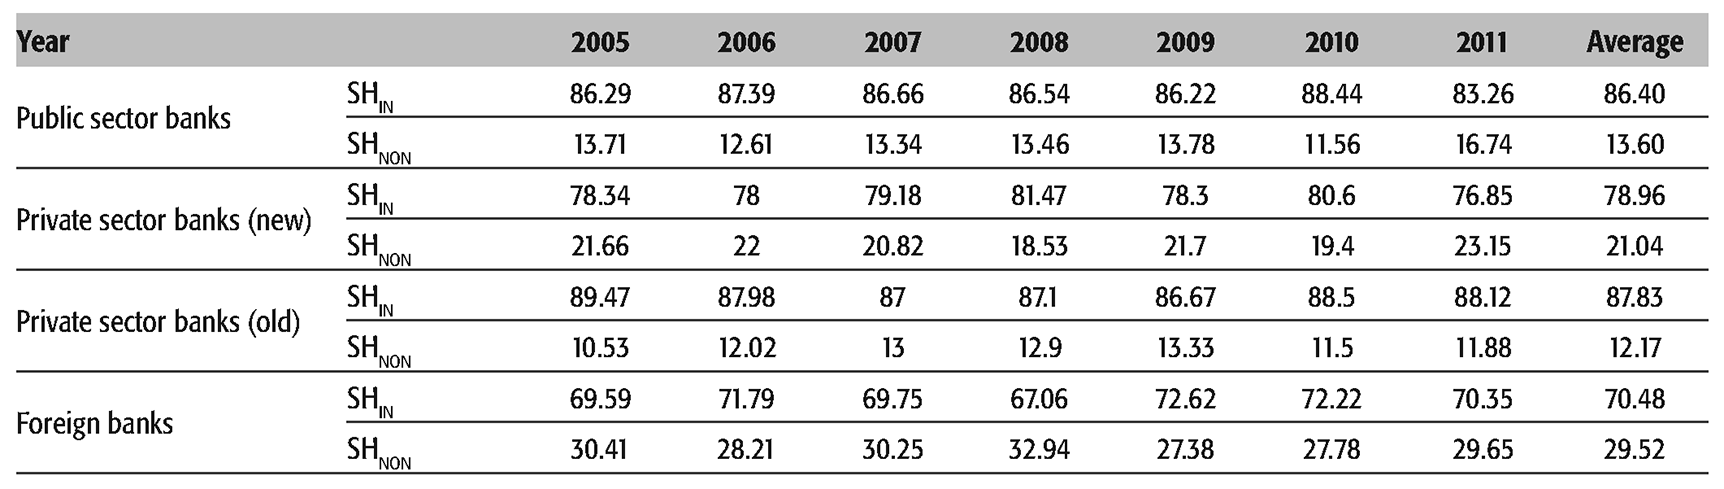
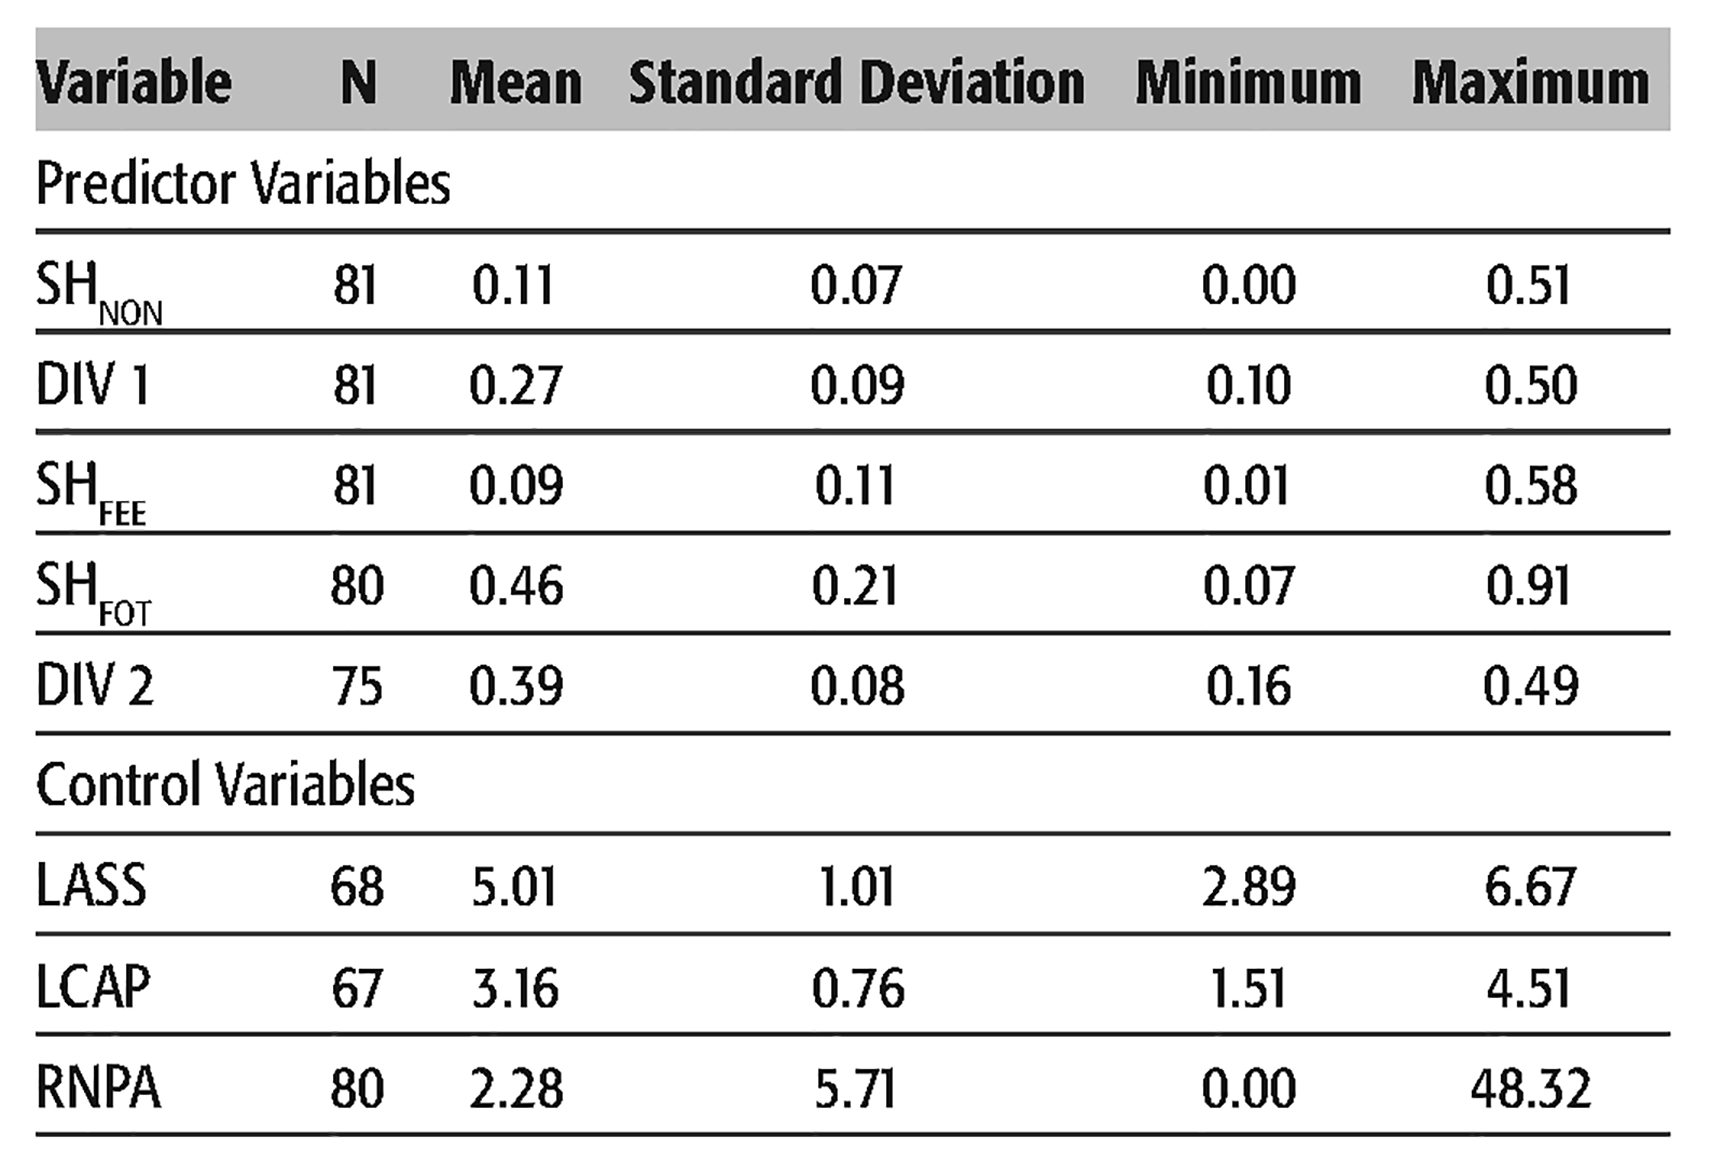
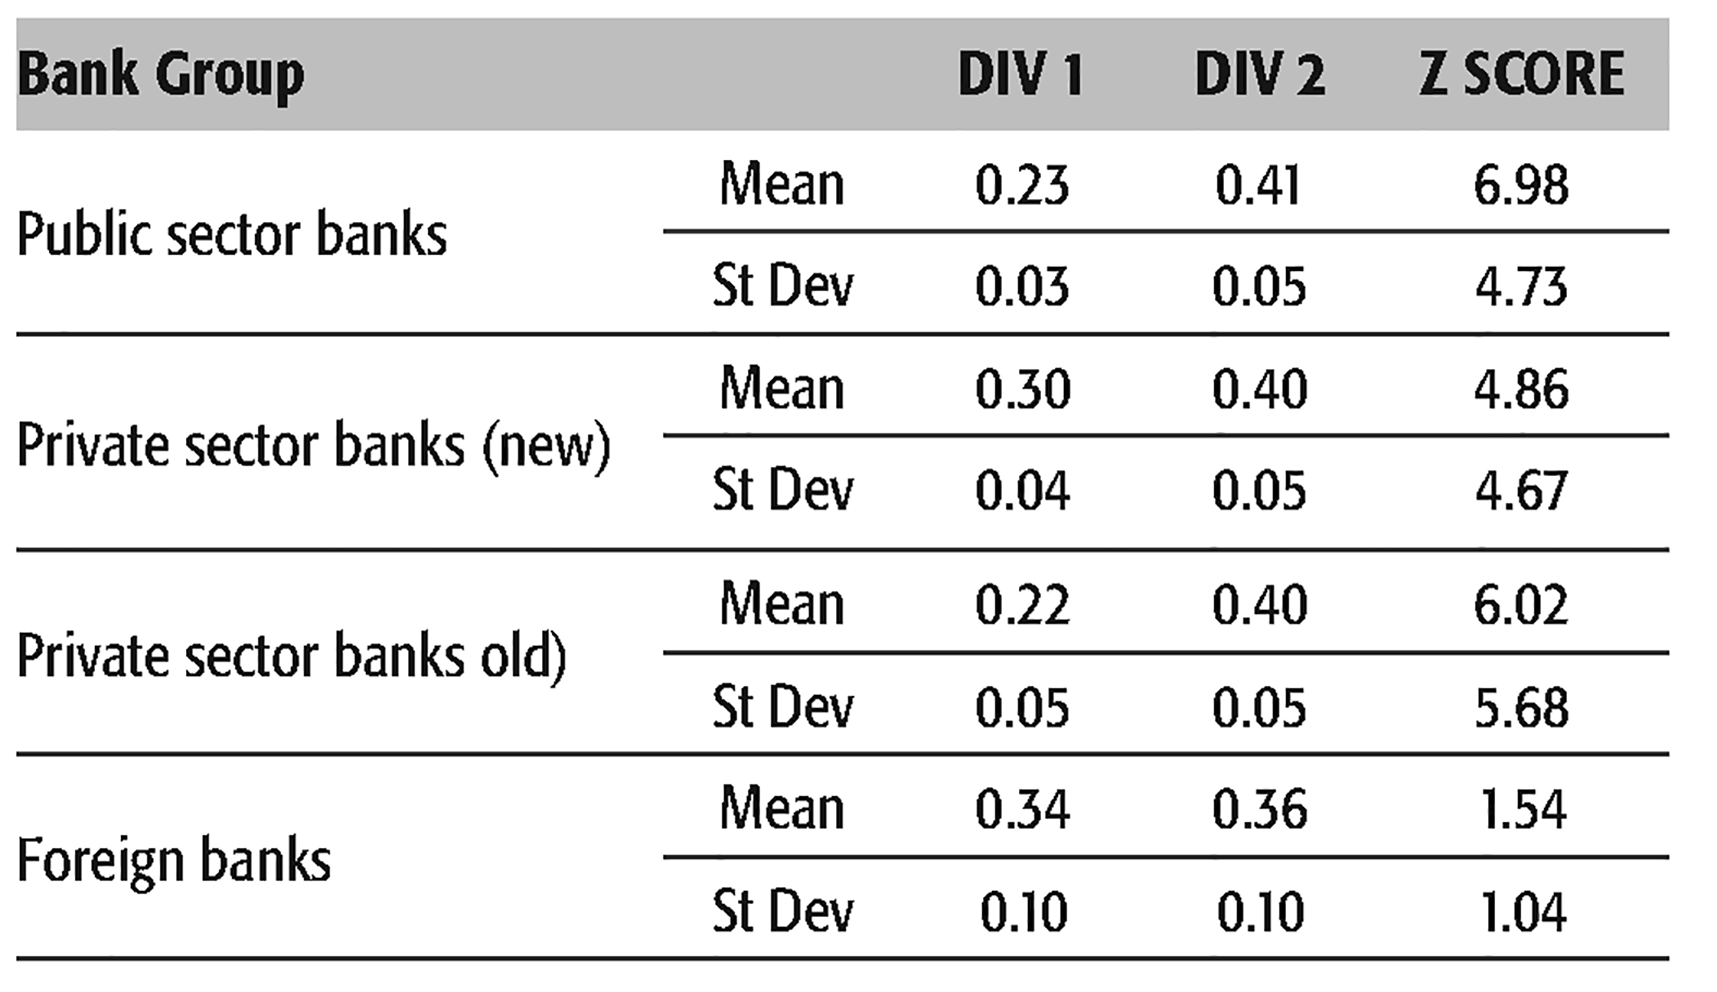
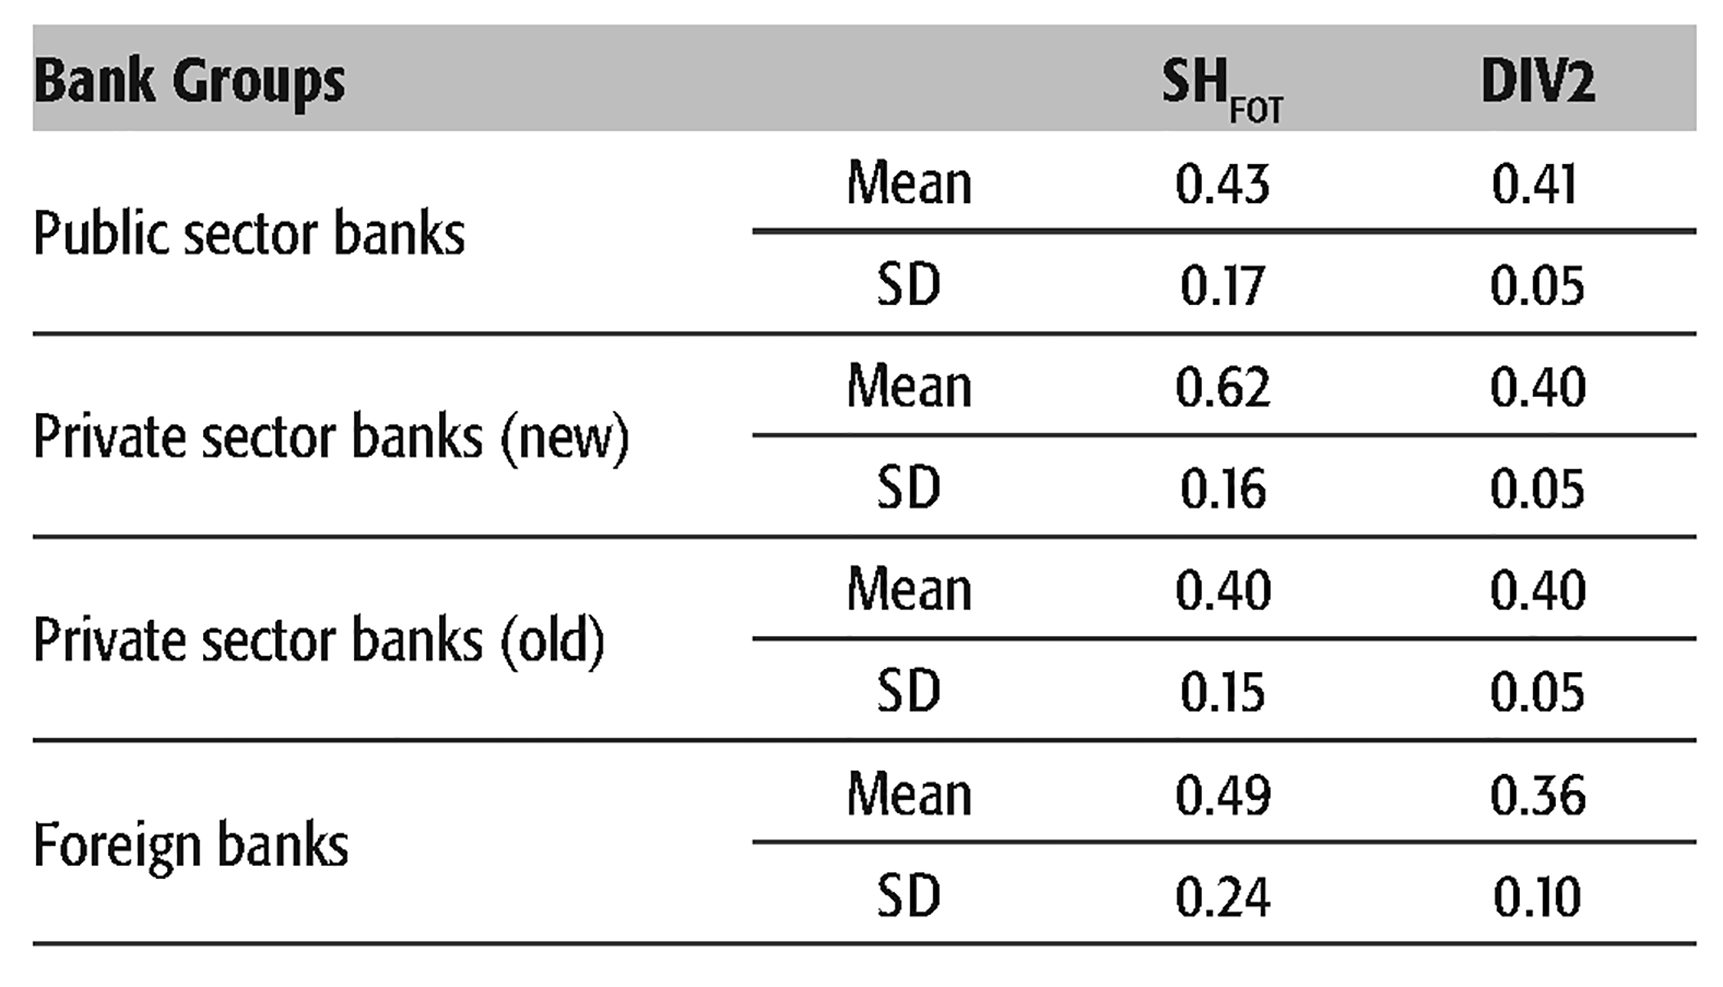
Evidently, while for all banks, the share of non-interest income in the total income has increased over this period, the same cannot be said about the proportion of fee-income in total income which has increased markedly only for new private and foreign banks. Table 3 shows the share of fee income in non-interest income and diversification in non-interest income for different bank groups, and Table 4 gives the diversification scores for the different groups and their Z scores. It may be seen that diversification of total income for public sector banks stand at around 0.23 (DIV1) suggesting a moderately diversified portfolio with low variability in diversification between banks in this group. The diversification of total income for private banks (new) is slightly better at 0.3, and while for foreign banks, it is around 0.34 (DIV1), the variability in diversification between banks in this group is much higher. Private banks (old) have a moderately diversified portfolio again (DIV1 at 0.22) with higher variability in diversification compared to public sector and new private sector banks. Z scores giving risk-adjusted performance are the highest for public sector banks (6.98) though with high variability between banks in the group. While foreign banks have low Z scores at 1.54, the variability of risk-adjusted performance is also lower than for other bank groups. It may be also be seen from Table 5 that for the Indian banking industry as a whole, the share of non-interest income in the total income (SHNON) stands at 11 per cent with a maximum of 51 per cent. Again the share of fee income in total income (SHFEE) is 9 per cent for the industry.
Distribution and Diversification of Non-interest Income
Descriptives of Predictor and Control Variables
Fee-based Income as % of Total Income (SHFEE)
Share of Fee Income in Non-interest Income and Diversification in Non-interest Income
Impact of Diversification on Risk-adjusted Performance
Descriptives of Key Dependent Variables
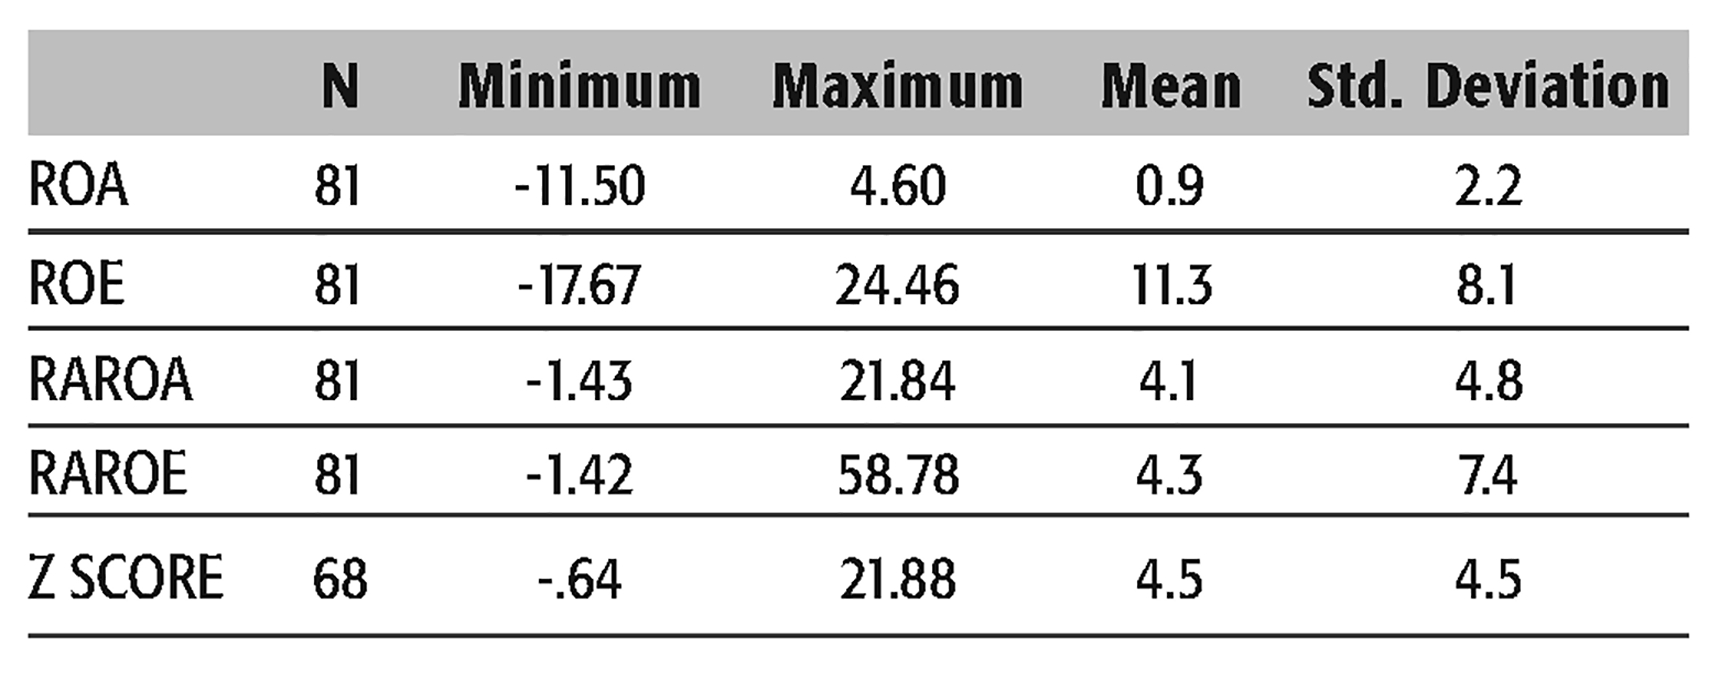
The descriptive statistics for the key predictor variables and control variables is seen in Table 3. As seen in the table, diversification in total income (DIV1) varies from 0.1 to 0.5, with a mean of 0.27 for the sample representing a moderately diversified portfolio for the banks in India. Diversification in non-interest income stands higher at 0.39.
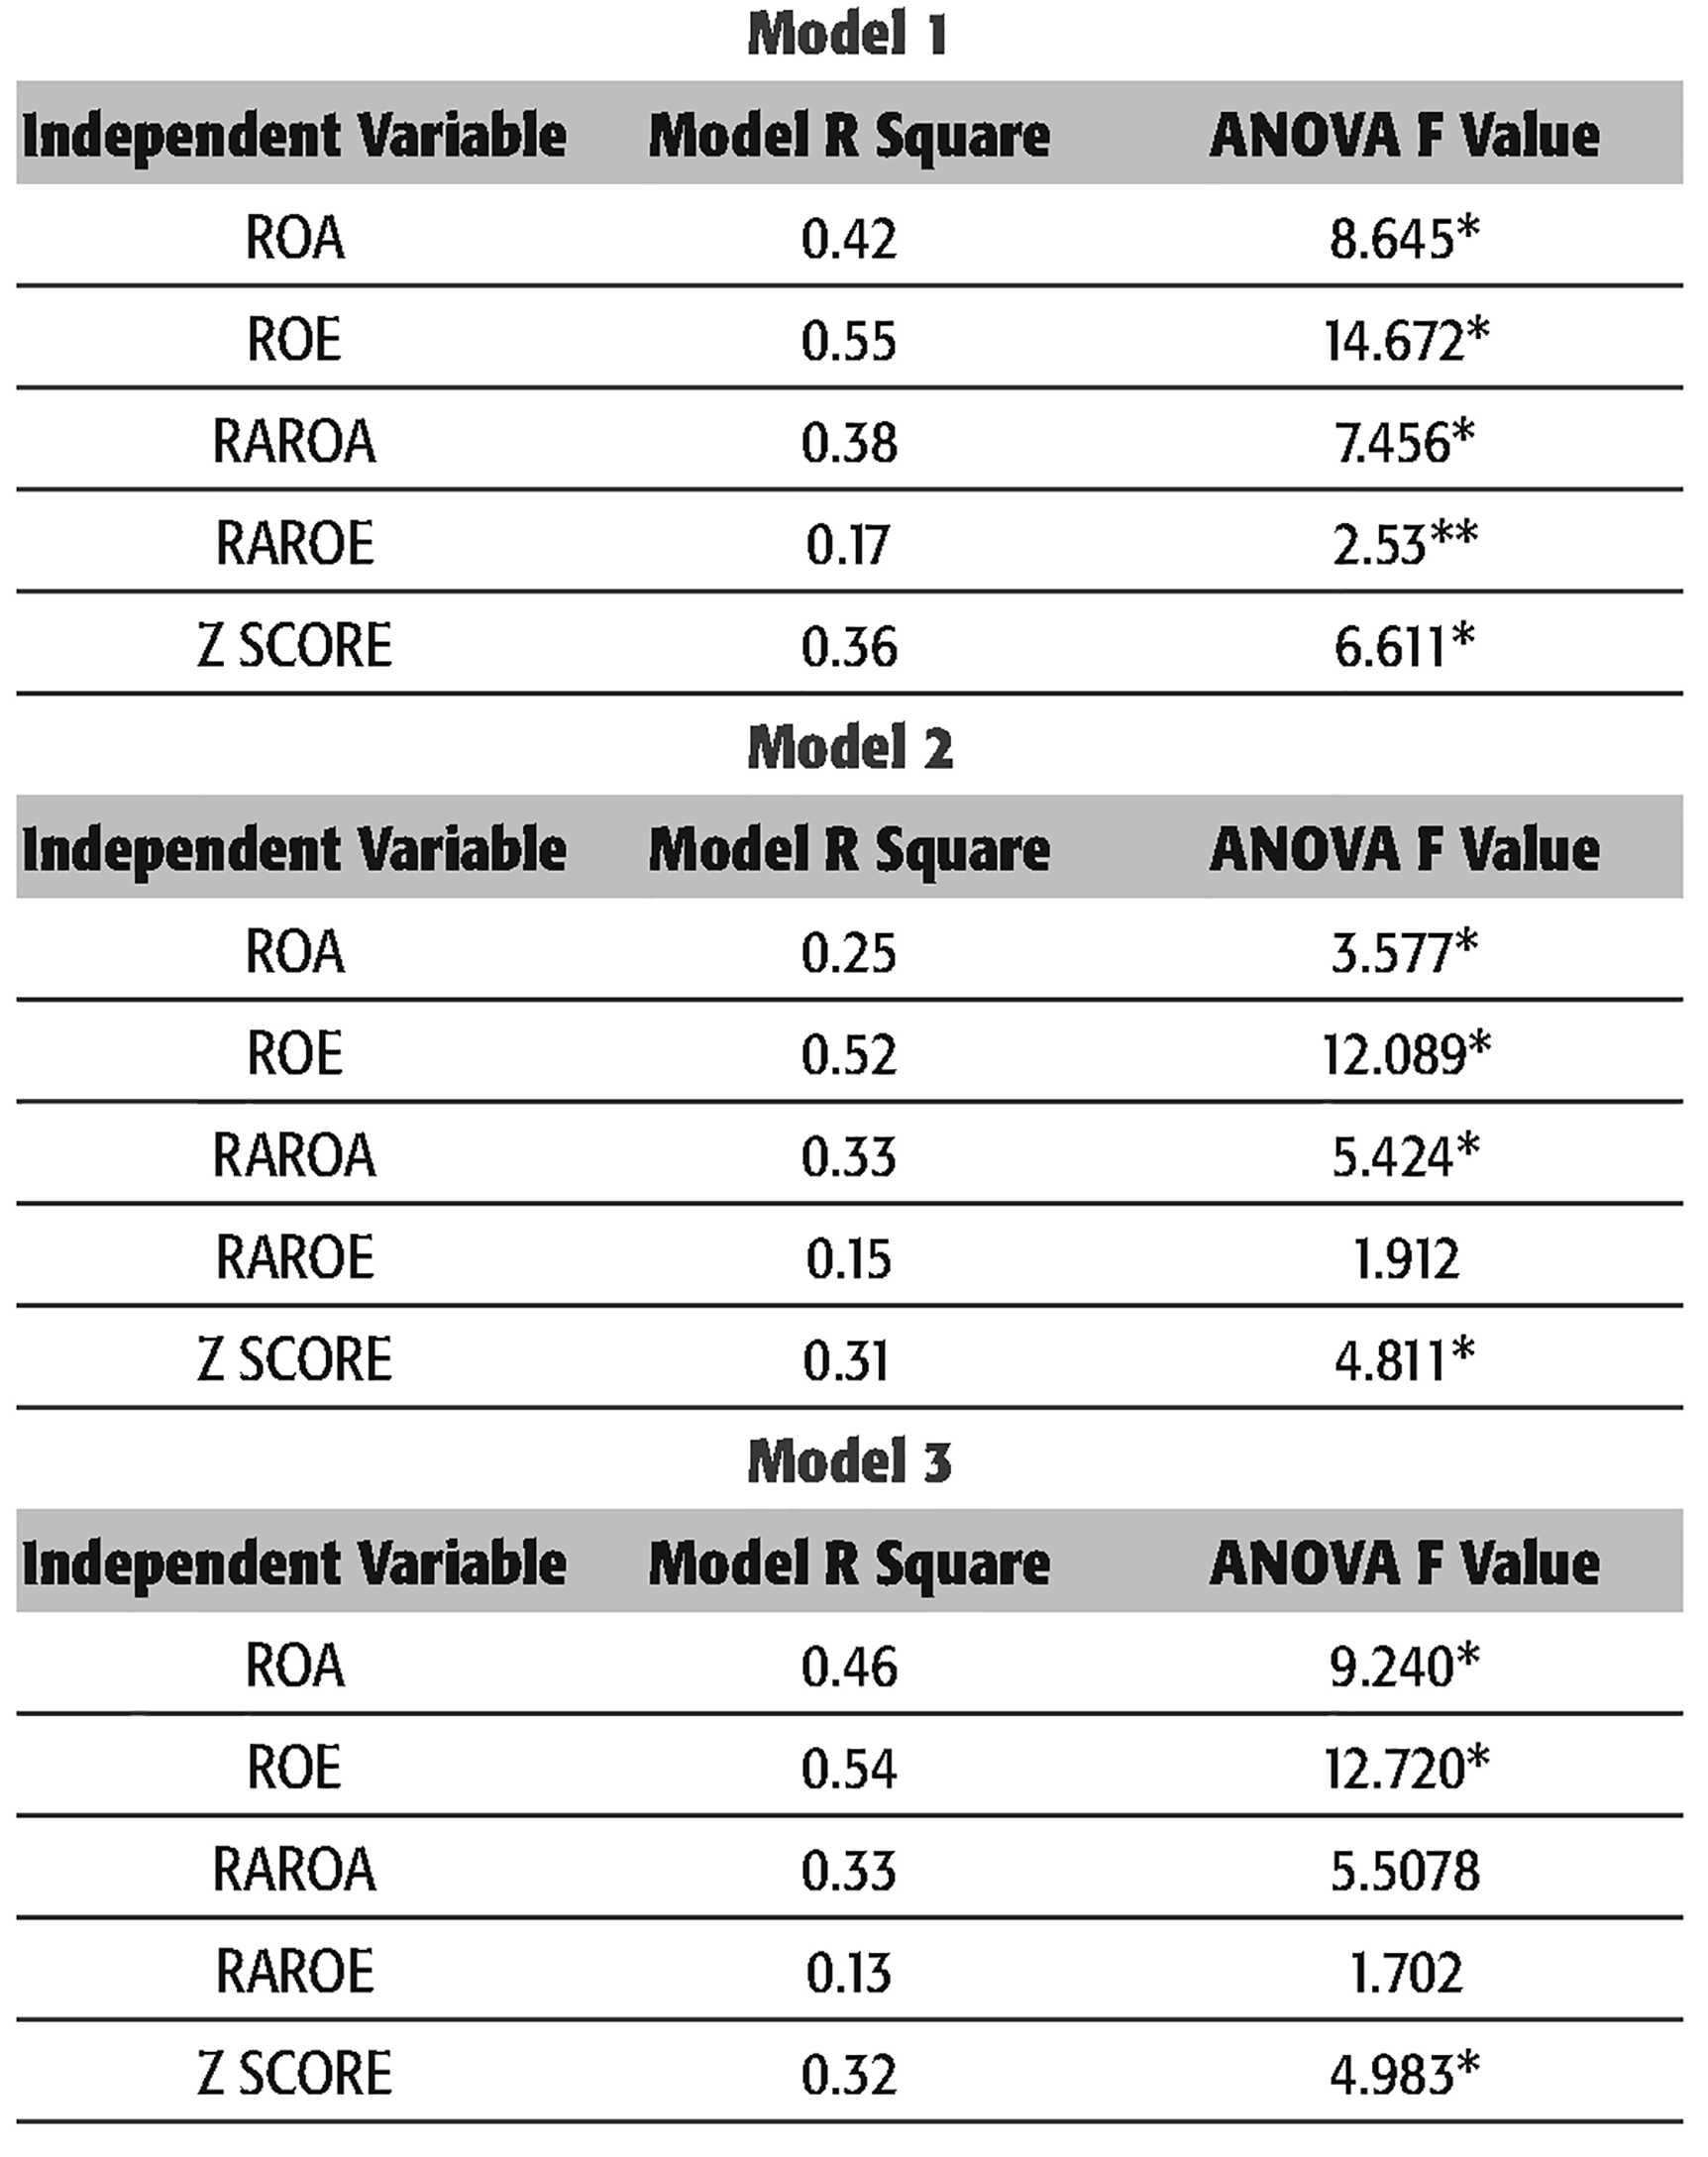
Model R square and ANOVA F Value
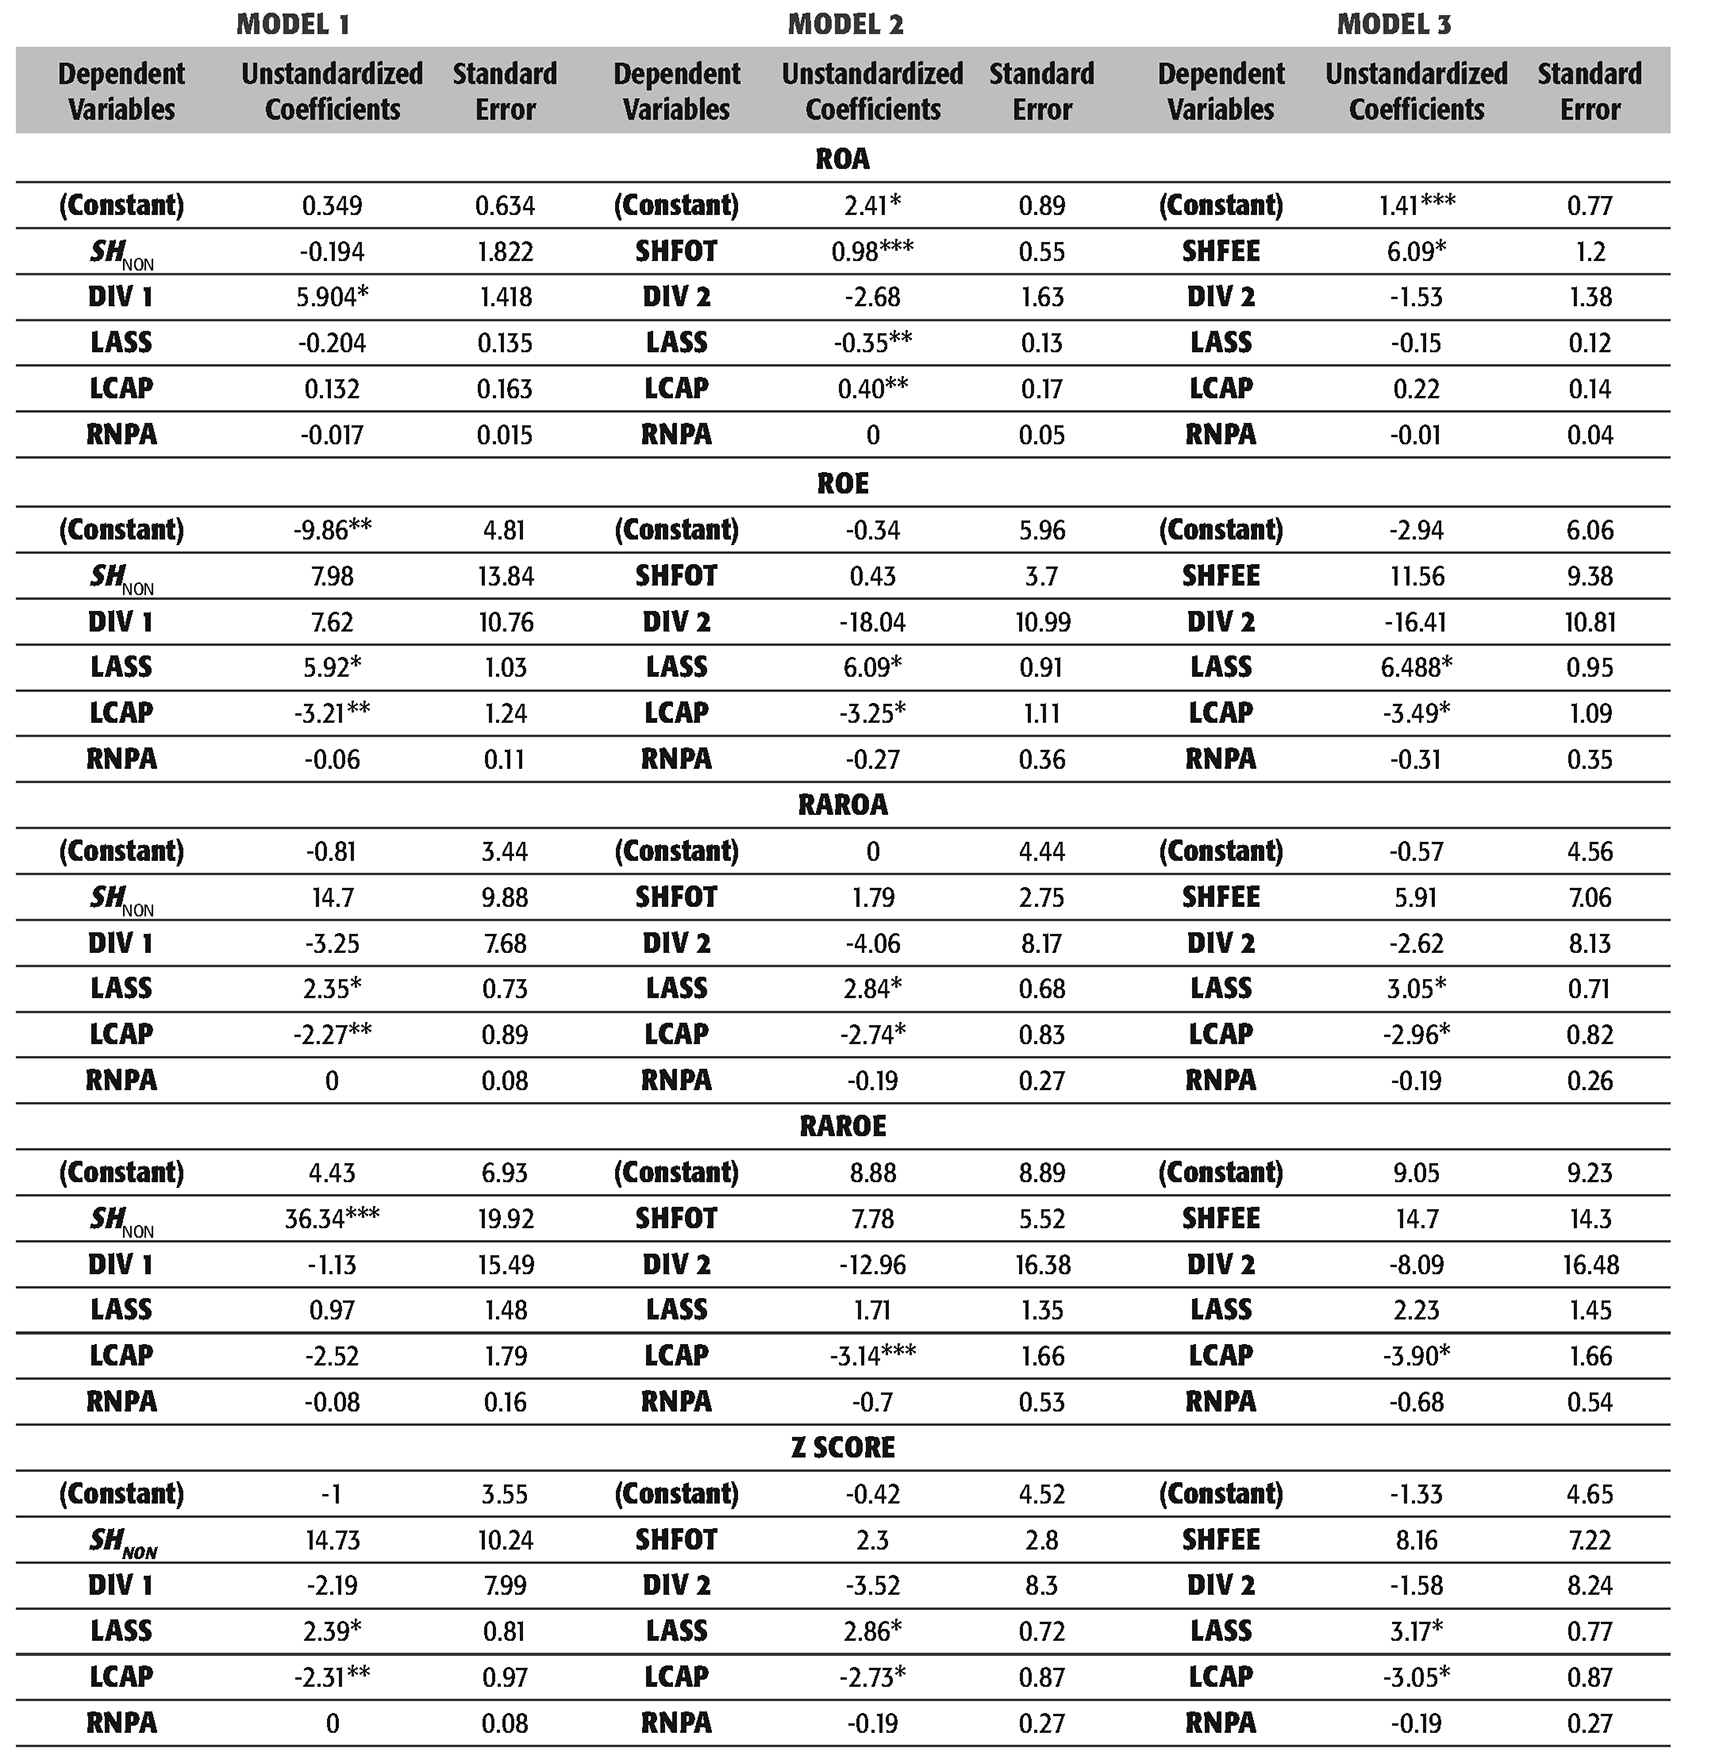
Multiple Regression Results
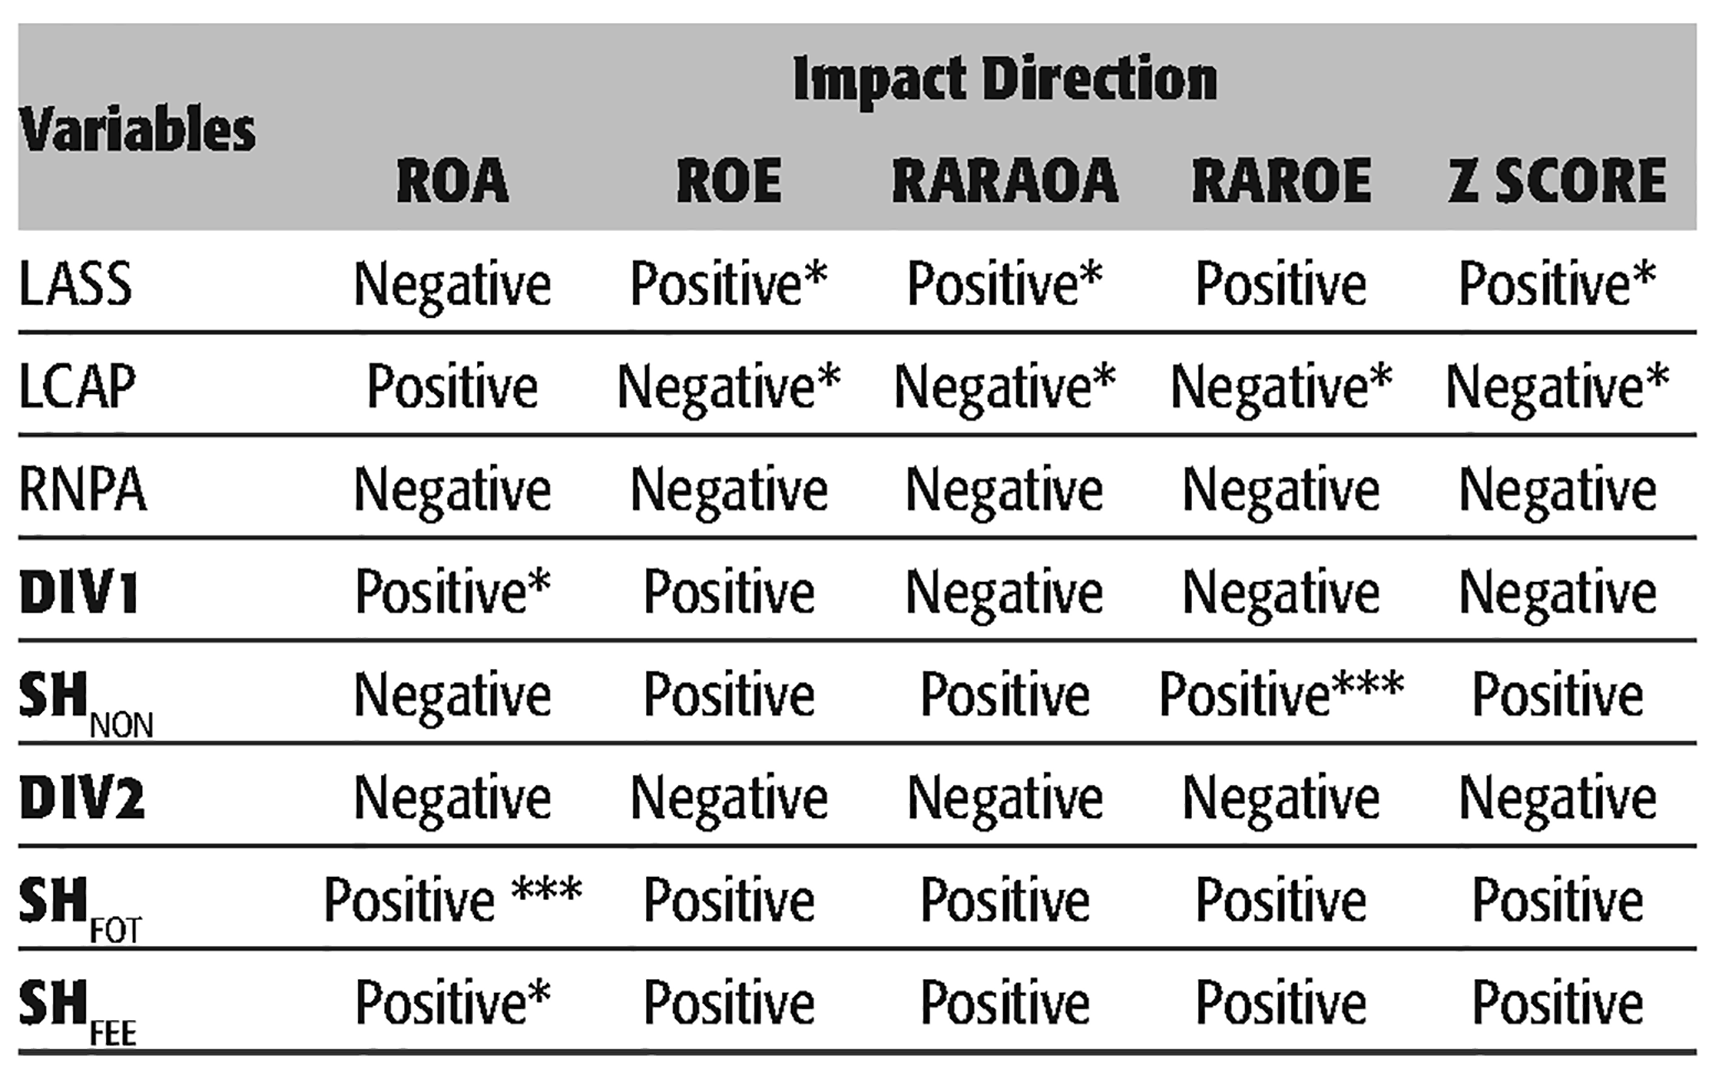
Impact Direction of Predictor Variable
Implications of Results
The article questions how the innovation-led diversification has been impacting bank profitability and stability of income in the Indian context. There are two distinct ways in which this article tries to add to the existing body of literature. First, it tries to see the impact of diversification in non-interest income separately from diversification in total income. The rationale behind this is the fact that the major components of non-interest income in recent years have come from innovative income streams and gestation of new products and services which have all contributed to increasing ‘fee income’ and consequent diversification of non-interest income. This is in keeping with global and Indian studies that have focused separately on fee-income based diversification and other non-interest income based diversification strategies (Gamra & Plihon, 2011; Sahoo & Mishra, 2012; Stiroh & Rumble, 2006; Umakrishnan & Bandopadhyay, 2005). Second, while the results show a positive impact of diversification for profitability, the article underlines that the impact direction of diversification in total income on risk-adjusted measures clearly suggests the need to choose stable sources of fee-income for future. Moreover, the diversification in non-interest income may not impact profitability and risk-adjusted income positively as discussed.
Evidently, for foreign and private sector banks (new) a greater proportion of income comes from fee-based activities, compared to public sector banks. However, as seen in the empirical results, while diversification and increasing share of fee-income in total income positively impact ROA, the impact on ROE or other risk-adjusted performance measures is not statistically significant. Moreover, the impact direction of diversification measures may be negative, which is in agreement to what many studies have shown in the US, European, Australian and Indian context (De Young & Roland, 2001; Esho et al., 2004; Inaba & Hattori, 2007; Sahoo & Mishra, 2012; Stiroh, 2004; Stiroh & Rumble, 2006). The results suggest that while public sector banks need to generate more income from fee-based activities, it would be imperative to choose sources of fee-based income that remain stable and have a positive impact on risk-adjusted measures.
The choice of income streams from which non-interest income can be generated under these circumstances becomes relevant. Encouragingly, greater proportion of ‘fee-income’ in non-interest income impacts positively both profitability and risk-adjusted performance measures. However, diversification of non-interest income may, in fact, negatively impact profitability or stability of income. Economic literature points out that the impact of fee-based income and other components of non-interest income, especially trading income, will be different on stability of income. Gamra and Plihon (2011), for example, show that fee income can generate some improvement in the risk-adjusted measures, while trading income imply lower performance as measured by risk-adjusted returns. Stiroh and Rumble (2006) point to trading income as the most volatile part of the non-interest income. Again, for fee-based income, the choice of new products or streams can determine the likely stability of income. Umakrishnan and Bandopadhyay (2005) also point out in the Indian context that investment income is the most volatile across all ownership groups.
Conclusion
The article looks at the impact of new business lines and income streams on banks’ profitability and stability. It is clear that adoption of innovations leading to new business lines confront certain barriers even as these evolve from gestation to implementation. Globally, the impact of adoption of these income streams and the consequent diversification, on profitability and stability of income for banks has not been clear.
In Indian banking, the move to innovation adoptions and new income streams has been more pronounced for new private and foreign banks, while there appears to have been certain hesitation on the part of public sector and old private banks. The study points out that while the impact of diversification of both total income and ‘non-interest’ income (encapsulating newer income streams) on profitability is positive and significant, the other impact on stability is not. However, profitability may not have become a driving force behind strategic shifts in business orientation of banks, particularly in respect of adoption of innovations. In such regards, concerns over the stability of income from non-interest income sources may be a significant economic barrier to innovation adoption. The implications of the study may be that banks adopting new income streams must choose those that are likely to enhance stability of income. As seen in the article, the distribution of non-interest income can significantly impact stability of income as increasing ‘fee-income’ in non-interest income may have a positive impact on risk-adjusted performance. Trading income, an important component of non-interest income, seems to be more volatile while core service income or the fee, commision and brokerage income generated from provision of new products and services may lead to greater stability in income. Future research needs to delve deeper into these aspects of innovation led businesses that banks may consider for adoption.
Limitations and Future Research Direction
The study has confined itself to finding the impact of increasing diversification on performance for banks in India, and has not delved into the impact separately for different bank groups. This could be an important direction of research in future. Further, on acccount of data being unavailable on the various components of non-interest and fee income, the impact of increasing share of various components of fee-based income on profitabiltiy and stability could not be analysed, which needs to be looked into in future. This will help in understanding which components of fee-income can contribute to profitability and stabiltiy for banks.
Footnotes
Acknowledgments
An earlier version of the article was presented at the NIBM National Conference on ‘Bank of the Future: Implications for the Indian Banking Sector’ on 22 February 2012. The author thanks Professor Anjan Roy, the anonymous referees as well as the participants of the Conference for their useful comments and suggestions. The views and opinions expressed in the paper belong to the author and do not in any way reflect the views of the Institute the author represents.