
Abstract
Background:
Attention deficit hyperactivity disorder (ADHD) children and their siblings often exhibit deficits in emotional information processing both in terms of emotion recognition and interference. An individual’s preparedness to resolve cognitive and emotional conflict before encountering emotionally interfering stimuli or while making a response can reveal the neural basis of emotional processing, utilizing pre-stimulus electroencephalography (EEG) microstates and pre-response source localization. This study aimed to investigate emotional interference via emotional Stroop task (EST) in children with ADHD and their siblings and neurotypical controls.
Methods:
In this cross-sectional observation study, 43 children with ADHD, 17 siblings of ADHD children, and 40 age-matched controls participated. EEG data was recorded using 128 channels during EST performance and analyzed for behavioral performance, pre-stimulus microstate parameters, and pre-response source localization of correct response trials.
Results:
Behavioral performance showed higher reaction time in ADHD children and their siblings than neurotypical controls. ADHD children had lower accuracy, while their siblings had higher accuracy than controls. Siblings also had higher accuracy compared to children with ADHD. Microstate analysis revealed Map 2 as a state marker and Map 3 as a trait marker. Meanwhile, increased allocation of cognitive resources was found to be a preserved trait among ADHD children and their siblings to resolve cognitive conflict during emotional interference tasks.
Conclusion:
EST was found to be a potential cognitive endophenotypic marker.
Keywords
The study examined the interference effect of valanced words on facial expressions in ADHD children, their siblings, and typically developing controls using behavioral, microstate, and source localization analyses. The study identified both state and trait markers that highlight the potential of the EST in distinguishing the performance of children with ADHD from their siblings and controls.Key Messages:
Executive dysfunction and emotion dysregulation have been suggested as one of the core manifestations of attention deficit hyperactivity disorder (ADHD).1–3 Moreover, deficient executive control in ADHD has been attributed to emotional interference in individuals with ADHD. 4 Most available literature has focused on the neurophysiological mechanisms related to the core symptoms of attentional deficits and hyperactivity. However, studies on emotional interference remain sparsely investigated in ADHD. Emotional interference refers to the ability of emotional stimuli’s potential to draw attention and disrupt executive function, 5 a process suggested to be impaired in children and adults with ADHD. 6
Studying emotional interference could act as a key to understanding the myriads of social difficulties associated with ADHD. Eiumtrakul et al. recently documented that about 10.7% of the siblings also manifest emotional difficulties. 7 Therefore, it is essential to investigate the emotional interference in first-degree relatives, as this may unveil potential endophenotypic markers. Historically, endophenotypes are a valuable resource for understanding the development and progression of many psychiatric diseases due to their intermediary nature between the diagnostic phenotype and underlying factors. 8 A study by Soni et al. (2019), reported endophenotypic markers using electroencephalography (EEG) microstates and intracortical generators in patients with schizophrenia, thereby consolidating the role of electrophysiological parameters in establishing a potential endophenotypic marker. 9 Thus, understanding the neural underpinnings of emotion regulation in endophenotypes may facilitate understanding the neural circuitry of ADHD.
EEG can serve as an ideal tool to explore the neural basis of resource allocation during emotional interference in children with ADHD with inherent high temporal and spatial (dense array). EEG microstate is an index of stimulus-driven mental processes and has been studied across various cognitive tasks in health and disease. 10 It is seen that along with the stimuli attributes, the brain’s internal state during stimulus presentation may also affect performance. 11 The current perspective suggests ADHD to be a disorder of large-scale neuronal systems dysfunction; microstate analysis can help in giving us an insight into the heterogeneity of ADHD by exploring the heedfulness to the emotional interference task. While pre-stimulus microstate analysis would shed light on the brain’s preparatory states, understanding how these states translate into successful task performance requires examining the neural activity prior to response selection leading up to correct responses, which can be achieved by examining the pre-response source localization.
In this study, a word-face variant of the emotional Stroop task (EST) was administered to study emotional interference in children with ADHD. The task investigated the recruitment of neural resources to resolve cognitive conflict during emotional interference utilizing pre-stimulus microstate and pre-response source localization analysis.
Methods
Study Design and Setting
This cross-sectional observational study data were collected from May 2019 to December 2022 from a tertiary care hospital using consecutive sampling. The Institutional Ethics Committee approved the study protocol. Before inclusion in the study, the participants and their parents provided assent and written informed consent for participation.
Participants
Based on convenient sampling, 105 (45 children with ADHD, 20 siblings of ADHD, and 40 neurotypical controls) participants were enrolled in the study. Children with ADHD were recruited from the department of psychiatry of the institute and diagnosed by clinicians as per Diagnostic and Statistical Manual of Mental Disorders, 5th Edition (DSM-V) criteria. 12 Conners ADHD Rating Scale 3 Parent Short Form (to quantitatively evaluate inattention, hyperactivity, learning problems, executive functions, aggression, and peer relations, respectively) was used to assess their behavioral profiles. 13 As endophenotypes, siblings of children with ADHD who consented to participate in the study were enrolled, and controls who voluntarily agreed based on community advertisements, flyers, and announcements were recruited. The study only included right-handed children with normal or corrected-to-normal vision. Children diagnosed with ADHD were excluded from the study if they were diagnosed with any comorbidity along with ADHD, while participants from the control group were excluded if they had any learning disabilities, neurological or psychiatric conditions, as reported by parental interviews, or if they had a first-degree parent or sibling diagnosed with ADHD. The final sample for behavioral data analysis included 100 participants: 43 ADHD, 17 siblings of ADHD, and 40 controls. Few participants’ EEG data were further excluded due to noise in the signal, movement-related artifacts, or an insufficient number of epochs. For further analysis, details of these exclusions are provided in the tables in the results section. The study was conducted in a controlled laboratory environment; the lab was dimly lit to reduce visual distractions and ensure consistent session lighting. Participants were sat comfortably when they arrived, and the distance to the screen was changed so that each eye’s stimulus subtended an angle of ∠6°.
Procedure and Task
The ADHD participants were instructed to discontinue their medication 24 hours before the recording to eliminate any immediate effects of medicine on cognitive function.14,15 EEG recording was carried out in a quiet room free of electrical noise. An EEG sensor net of appropriate size was placed on the participant’s head, and electrode impedance was maintained below 50 kΩ.
Emotional Stroop Task
The EST was used to understand the neural basis of resource allocation during emotional interference in participants with ADHD using word-face (an emotionally valanced picture along with an emotional word was shown together (i.e., stimuli), and the participants were asked to categorize the words’ emotion while ignoring the picture) EST. 5 The International Affective Picture System (IAPS) 16 was used to obtain pictures (10 of each valence (negative < 4, neutral 4.5 < 6 and positive 6.5 >)). The Affective Norms for English Words (ANEW) 17 database was used to obtain words HAPPY, SAD, and BLAND (positive, negative, and neutral valence, respectively). To allow participants to recognize the emotion of the face, the words were written across the face horizontally, leaving the eyebrows, eyeballs, cheeks, upper lips, and lower lips unmasked. 18 Red was selected as the text color since it has been found to be the least arousing. 19 The task comprised congruent (the valence of the face and word was a match) and incongruent trials (the valence of the face and word was a mismatch). The task was designed on E-prime v2.0. One block of 60 trials each was administered in random order comprising both congruent and incongruent trials (30 each) in both tasks Figure 1. Participants were acquainted with the task through a practice session comprising ten trials, followed by a single session actual trial. Behavioral data were recorded as reaction time and accuracy.
The Trial Structure of Emotional Interference Task: Participants Were asked to Respond to Valence of the Word while Ignoring the Valence of the Face (Word-Face). One Block of 60 Trials Was Administered and Each Trial Began with a Fixation Point for 1,000 Ms Followed by Stimuli (2,000 Ms) which Disappeared As Soon As Subjects Responded. The Response Was Collected as Key Presses on Sr (Stimulus-Response) Box: 1 For Positive Emotion, 2 for Negative Emotion and 3 for Neutral Emotion. Reaction Time and Accuracy Percentage Were Logged for Each Trial. 100 Ms Pre-Stimulus Segments and 500 Ms Pre-Response Segments of Correct Trials Were Extracted and Subjected to Microstate Analysis in Cartool Software and Source Localization in Sloreta Respectively.

The EEG Data Acquisition and Pre-processing
Hydrocel geodesic sensor net (HCGSN, Magstim, USA) was used to acquire single-trial EEG data (128 channels) sampled at 1000Hz with vertex as a reference during baseline state (five minutes of eyes-closed and eyes-open respectively) followed by EST. Pre-processing was done using EEGLAB toolbox 2022.1. 20 Source analysis was performed on down-sampled data of 500 Hz at a filter setting 1–100 (Finite Impulse Response (FIR) filter). Meanwhile, microstate analysis was performed on down-sampled data of 250 Hz at a filter setting of 1–40. The 50-Hz line noise was removed using default settings for Zapline-plus, 20 and the clean_rawdata plugin was used to detect bad channels in the EEG lab. The pop_interp function of the EEG lab was used to interpolate channels below the correlation threshold using spherical splines. This was followed by Independent Component Analysis (ICA) using the runica algorithm, and ICLabel identified artifacts at thresholds between 0.8 to 1 range, classifying them into the ECG, eye, or muscle component. Data was then average-referenced to common.
A visual inspection was also done, and periods with remaining artifacts were marked and excluded from further analysis. Analyses were performed on epochs for which correct responses were logged. For source analysis, 500 ms of pre-response data were retained from each subject, while 100 ms of pre-stimulus–data from 100 channels (to avoid muscle artifacts from the data, 28 electrodes on the neck and face were removed) were retained for microstate analysis.21,22
Analysis of Pre-stimulus EEG Microstates
The analysis involved identifying dominant classes of microstate maps from EEG data representing dominant global functional brain states present during the individual recordings. On identification of dominant maps, a set of average microstate maps are derived across subjects that reflects a shared set of brain functional states seen across study groups. These common microstate maps were then fitted to the individual EEGs, assigning a label to each data point based on the map with the highest correlation. Subsequently, EEG microstate parameters are extracted, namely global explained variance (GEV), mean duration (MD), segment count density (SD), and time coverage (TC) as a function of microstate class. 23 Further, statistical analysis was performed on the extracted features to test for differences between groups and identify potential alterations in the recruitment of particular global brain functional states. 24
Cartool software v4.11 was utilized for microstate analysis. 25 Modified k-means cluster analysis was first applied to the data of individuals, and maps at local maxima of global field power (GFP) were extracted for cluster analysis. These extracted maps were then subjected to second clustering from each participant within each group. An optimal number of clusters (both within and across participants) was determined using meta-criterion calculation based on seven criteria (Gamma, Silhouettes, Davis and Bouldin, Point-biserial, Dunn, Cross-Validation criterion, Krzanowski-Lai Index). Eventually, a single meta-criterion was derived. The identified best cluster was then fitted back to the original EEG of each individual, thereby labeling each data point with the map that showed the highest correlation, 27 for each group. Based on the spatial correlation of each microstate map, the following five parameters were computed: SD, GEV, MD, TC, and transition probabilities. Topographical analysis was performed to find similar maps across groups and statistically compare microstate parameters. Maps that showed >0.8 correlation were considered similar and compared between groups.
EEG Source Localization
Pre-response 500 ms data was analyzed to estimate sources contributing to conflict resolution, and analysis was done using exact low-resolution brain electromagnetic tomography (eLORETA). 28 It analyzed 6239 cortical voxels (5 mm3), representing 66 gyri and corresponding Brodmann areas, using the MNI 152 template. Comparison between the two groups was done using t-statistics on current source densities in each voxel using statistical nonparametric mapping (SnPM), providing a critical threshold and probability for the observed t-values, which is corrected for multiple comparisons across all voxels. For each SnPM randomization, a total of 5,000 permutations determines the significance.
Statistical Analysis
GraphPad Prism version 9.0.0 for Windows was used for analysis. 29 The data’s normality was checked using the Shapiro–Wilk normality test, and outliers were removed before computing statistical measures. One-way analysis of variance (ANOVA) or the Kruskal–Wallis test was performed as appropriate, and multiple comparisons were made to determine the group difference for behavioral data. The p value was adjusted wherever required. The between-group comparison was made using ANOVA to find differences in the temporal parameters of microstate maps, followed by posthoc tests using Holm’s method or Bonferroni correction. Further, SnPM randomization tests were performed for each microstate map between the groups to investigate the differences between the microstates in source space. The study reports the solution obtained at p < .05. We also correlated the mean reaction time of correct responses with the microstate parameters of each group for word-face EST.
Results
Demographic Characteristics of Participants
The demographic data were analyzed for age and gender across groups. The mean age of participants was 12.3 years (±2.73) in the ADHD group, 12.33 years (±4.32) in the Siblings group, and 12.92 years (±3.58) in the Control group. No significant difference in age was observed between the groups, with p > .99 for all comparisons (ADHD vs. Siblings, Siblings vs. Controls, and ADHD vs. Controls).
For gender distribution, the ADHD group had 38 males and 5 females, the Siblings group had 11 males and 7 females, and the Control group had 30 males and 10 females. A statistically significant difference in gender distribution was found between the ADHD and Siblings groups (p = .0069), while they were comparable between the Siblings and Controls or ADHD and Controls (p = > .5).
Duration of Illness and Medication Profile of Children with ADHD
The MD of the illness was 23.9 months while they were on the following medications: methylphenidate (n = 34), atomoxetine (5), and drug-naïve (n = 4).
Conners questionnaire scores: The mean ± SD T-scores observed were as follows: inattention (80.1 ± 13.2), hyperactivity (80.5 ± 15.31), executive functions (66.34 ± 13.71), learning problems (65.41 ± 16.44), and aggression (72.56 ± 18.65).
Behavioral Results
The reaction time analysis and accuracy between-group comparisons revealed significant differences. The median reaction time (with interquartile ranges) was 887.5 (714–1,106) ms for the ADHD group, 888 (729–1,088) ms for the Siblings group, and 842 (666–1,066) ms for the Control group. The overall p value for reaction time was < .0001, with significant differences between ADHD and Controls (p < .001) and between Siblings and Controls (p = .0005). However, they were comparable between ADHD and their Siblings (p > .99).
For accuracy, the ADHD group had an accuracy of 91% (±29), the Siblings group 96% (±20), and the Control group 93% (±26). The overall p value for accuracy was also <0.0001, with significant differences between ADHD and Siblings (p < .0001), ADHD and Controls (p = 0.02), and Siblings and Controls (p = .005).
Microstate Analysis
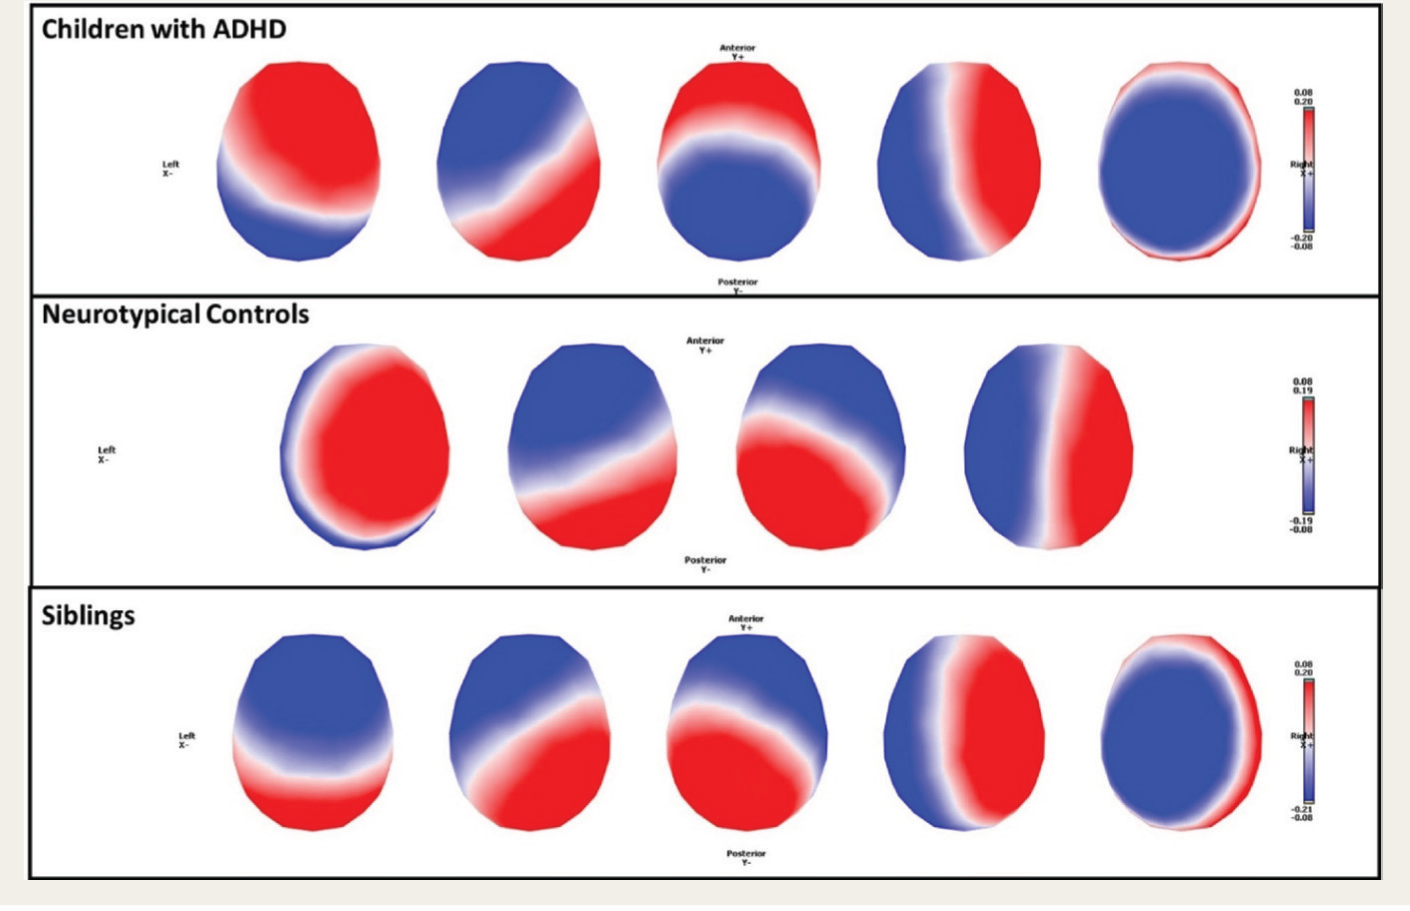
Five dominant maps were identified using k-means cluster analysis across each group for children with ADHD and their siblings, which explained 76.53% and 77.9% of total variance, and four dominant maps for neurotypical controls that explained 71.57 % of total variance, as shown in Figure 2. All the parameters for each group and between-group comparisons are represented in Table 1. Based on the post-segmentation topographical analysis, similar maps were compared across groups, and we found significant differences in microstate parameters, as reported below.
The Scalp Topographical Template Maps Identified by K-Means Cluster Analysis Across Children with ADHD (5), Neurotypical Controls (4) and their Siblings (5) in Pooled Data of Word-Face Emotional Stroop Task. Color Scale Represents the Intensity of Scalp Electrical Potentials with Red and Blue Represents Positive and Negative Value Respectively.
Microstate Parameters of Word-face Emotional Stroop Task.
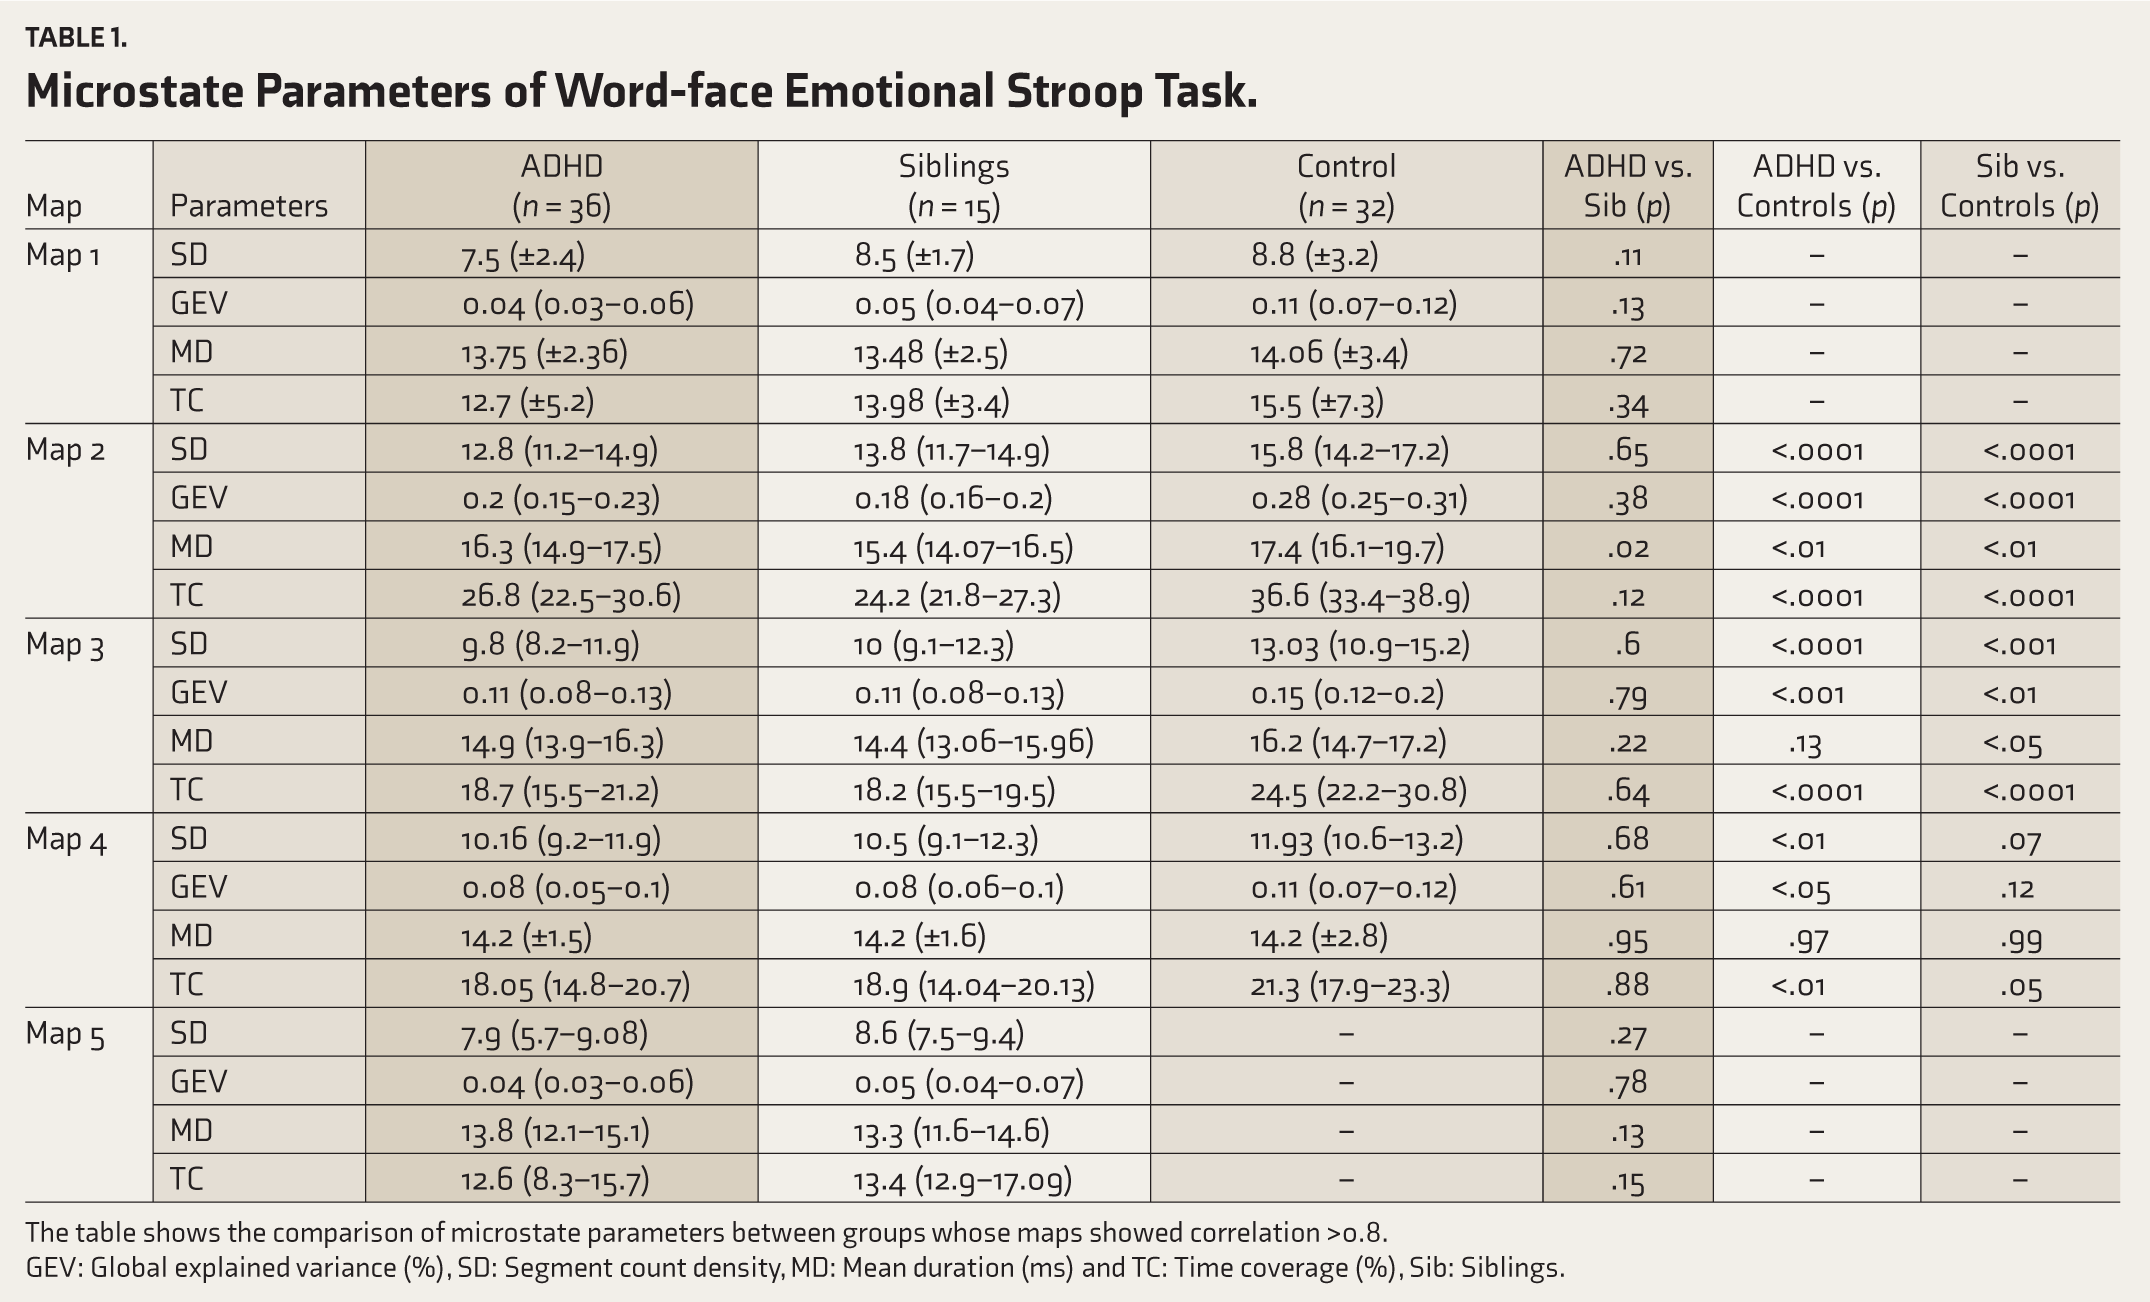
The table shows the comparison of microstate parameters between groups whose maps showed correlation >0.8.
GEV: Global explained variance (%), SD: Segment count density, MD: Mean duration (ms) and TC: Time coverage (%), Sib: Siblings.
Children with ADHD and Neurotypical Control
Based on Topographic Analysis of Variance (TANOVA) Maps 2, 3, and 4 were shown to correlate significantly between both groups. Student’s t-tests exhibited lower GEV, SD, and TC across maps in children with ADHD.
Children with ADHD and Siblings
All five maps were found to be correlated with each other, although the Student’s t-tests exhibited a significant increase in the MD of Map 2 in children with ADHD.
Neurotypical Controls and Siblings
Maps 2, 3, and 4 were shown to correlate significantly with each other, and the Student’s t-test exhibited lower GEV, MD, SD, and TC for Maps 2 and 3 in siblings.
Pre-response Source Analysis
Children with ADHD and Neurotypical Controls
Statistical analysis of voxel-by-voxel comparison showed significantly increased act- ivations in children with ADHD compared to controls. Voxels (Threshold: t = 3.34; p = .05) that showed increased activations were found localized at the Middle Temporal Gyrus, Precentral Gyrus, Uncus, Inferior Parietal Lobule, Postcentral Gyrus, Superior Temporal Gyrus, Middle Frontal Gyrus (Figure 3; Supplemental Table 1).
Children with ADHD and Siblings
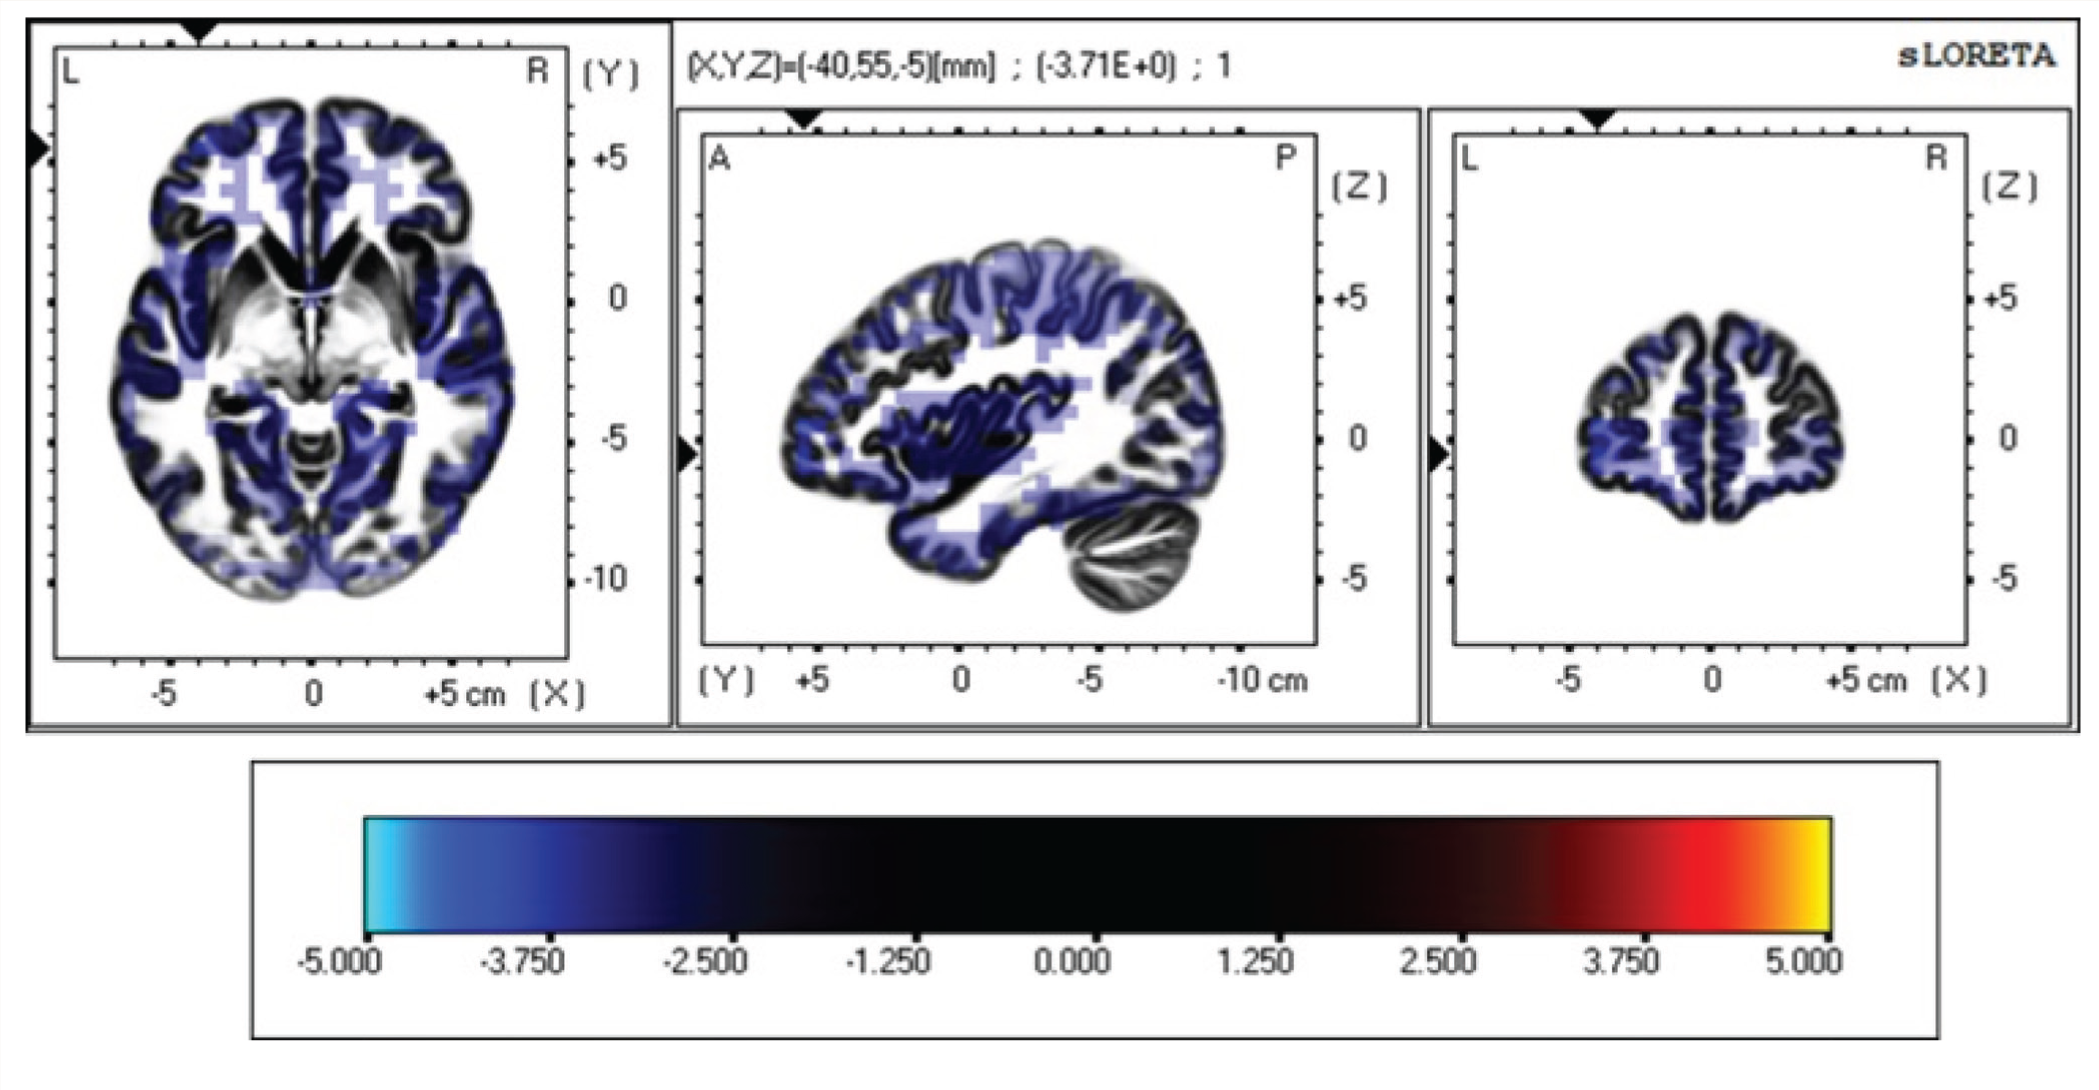
Statistical analysis of voxel-by-voxel comparison showed significantly increased activations in siblings compared to children with ADHD. Voxels (Threshold: t = 3.406; p = .05) that showed increased activations were found localized at Fusiform Gyrus, Parahippocampal Gyrus, and Inferior Temporal Gyrus (Figure 4; Supplementary Table 2).
The Sources which Were Found to be Significantly Different between Children with ADHD and Neurotypical Controls Are Plotted as Brain Slices. The Scale Presented at the Bottom of the Slice View Shows the Range in which the T-Values in the Comparison Varied.

The Sources which Were Found to be Significantly Different Between Children with ADHD and their Siblings are Plotted as Brain Slices. The Scale Presented at the Bottom of the Slice View Shows the Range in which the T-Values in the Comparison Varied.
Neurotypical Controls and Siblings
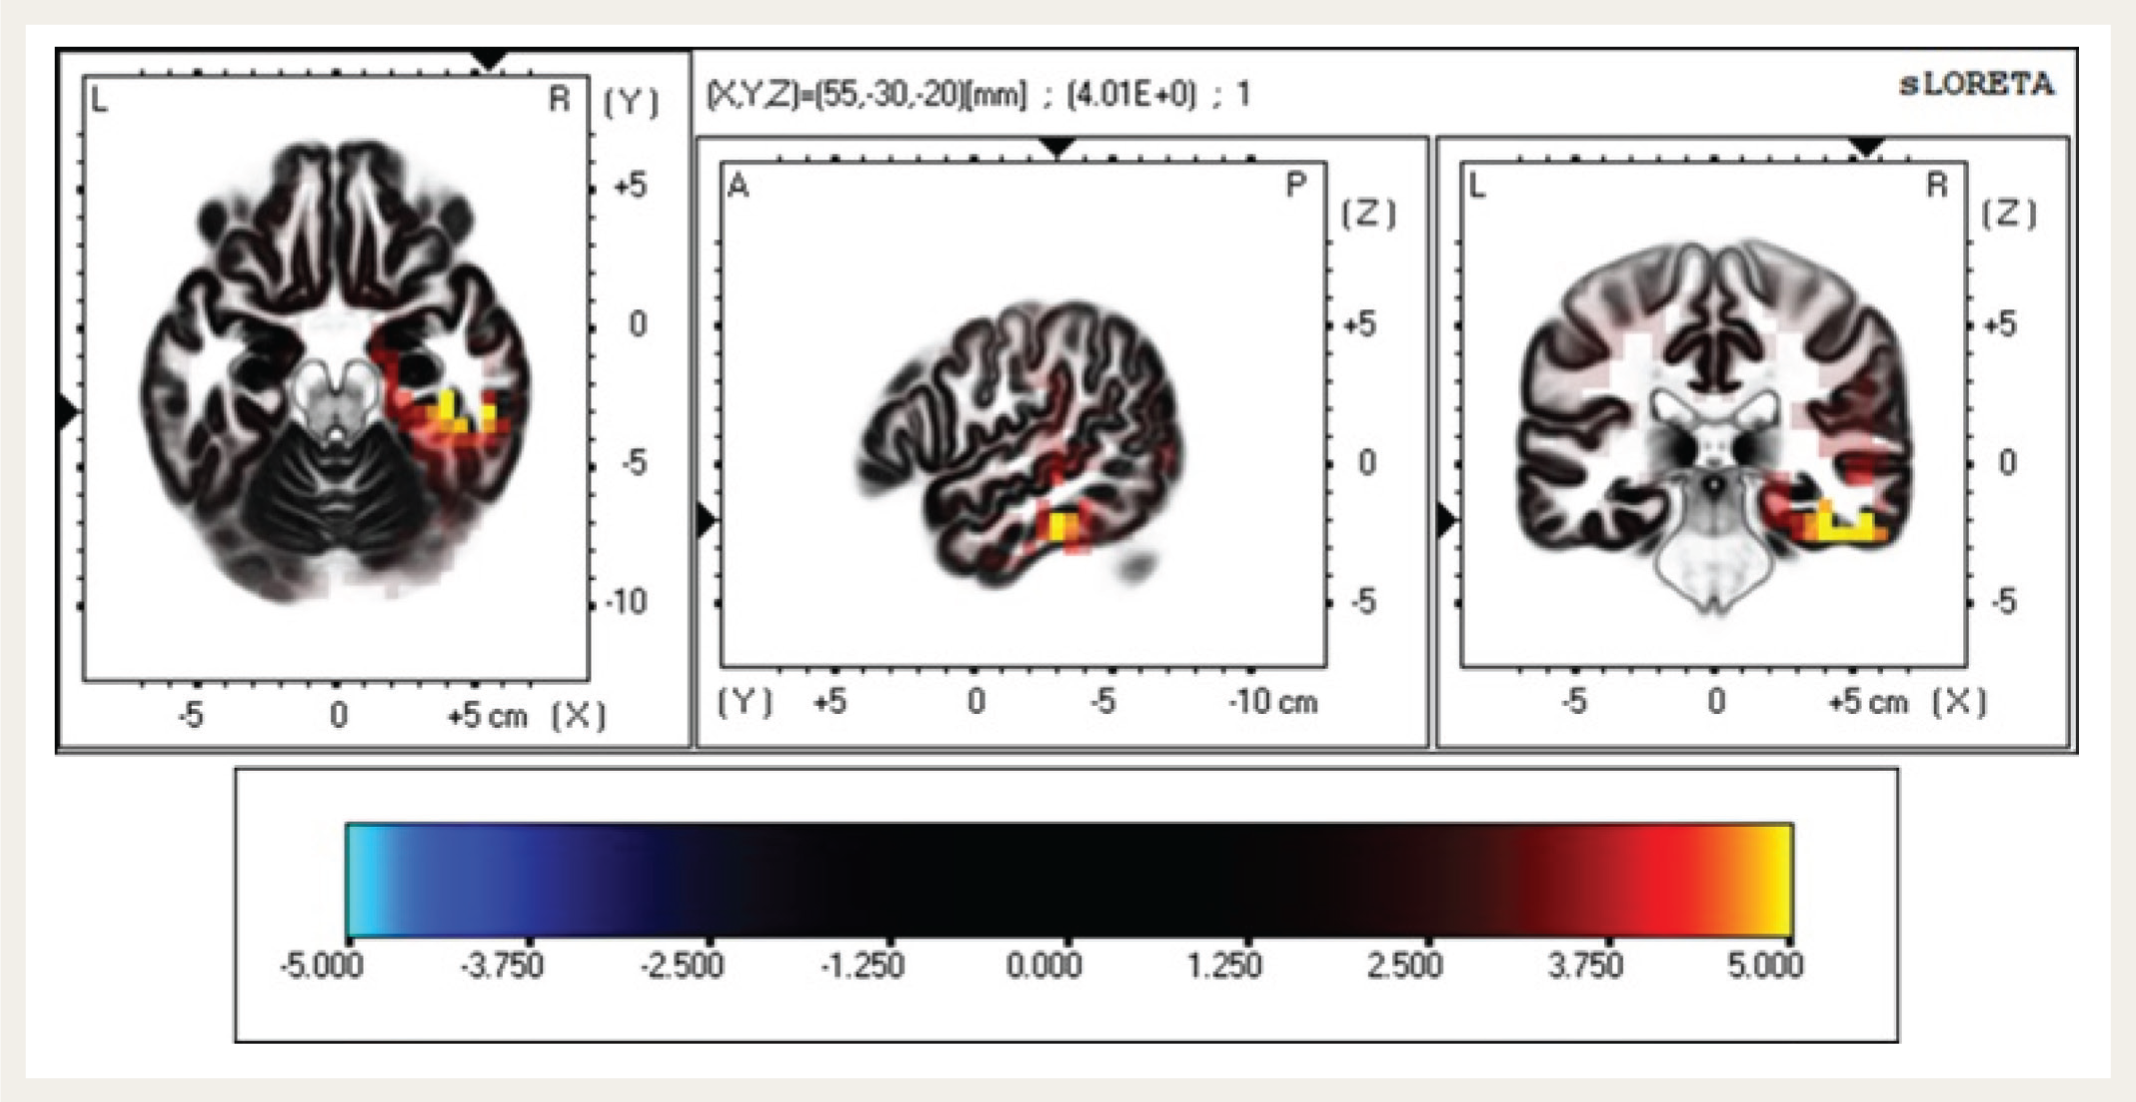
Statistical analysis of voxel-by-voxel comparison showed significantly increased sibling activations compared to controls. Voxels (Threshold: t = 3.5; p = .05) that showed increased activations were found localized at Fusiform Gyrus, Parahippocampal Gyrus, Inferior Temporal Gyrus, Superior temporal gyrus (Figure 5; Supplementary Table 3).
The Sources which were Found to be Significantly different between Siblings of Children with Adhd and Neurotypical Controls Plotted as Brain Slices. The Scale Presented at The Bottom of the Slice View Shows the Range in Which the T-Values in the Comparison Varied.
Discussion
This study aimed to demonstrate differences in neuronal mechanisms related to response selection processes during emotional interference in ADHD children compared to their siblings and typically developing children using a word-face EST. The differences during the emotional interference task observed by behavioral, pre-stimulus, and pre-response trials of correct response were as follows.
The behavioral results of the study show that children with ADHD and their siblings had higher reaction times than neurotypical controls. Furthermore, children with ADHD had lower accuracy scores when compared to neurotypical controls as well as their siblings. Suggesting children with ADHD had increased susceptibility to facial and emotional distractions, which may have contributed to the higher error rates and prolonged response times. Previous studies have reported higher reaction time and higher error rates across negative, positive, and neutral valence words in children with ADHD. 30 Additionally, findings of longer response time for emotionally distracting stimuli and abnormal processing of task-irrelevant stimulus features31,32 further substantiate the results of this study in children with ADHD.
Notably, siblings demonstrated higher reaction times and accuracy compared to neurotypical controls. This suggests that they prioritized accuracy over speed, which contrasts with their affected siblings, who tend to prioritize speed over accuracy.33,34 As a result, they tend to exercise increased cognitive control and caution to minimize errors, indicating a more deliberate and careful approach to processing emotionally distracting information.
Given these behavioral differences, we explored the role of pre-stimulus microstates in preparing for correct trials during the task, aiming to gain a deeper understanding of neural dynamics that contribute to such performance variations in children with ADHD. We found that the microstate parameters of Map 3 could distinguish children with ADHD and their siblings from neurotypical controls; additionally, Map 4 distinguishes children with ADHD from neurotypical controls. In contrast, Map 2 could distinguish children with ADHD from their siblings and neurotypical controls as well as siblings from controls suggesting. Map 2 was found to emerge across all comparisons. Posthoc power analysis utilizing microstate parameters of Map 2 revealed power >0.08, suggesting that the study was adequately powered and indicating an actual effect. Significant differences were found in the following microstate parameter GEV, which reflects the overall variance contributed by the map. At the same time, SD suggests the propensity of its underlying neural generators to become activated, TC relative time covered by that map, and MD of a map suggests the stability of the underlying neural network. 35
The topography of Map 2 resembles Map B (right-left diagonal orientation) associated with visual processing. Map 3 resembles Map C (a midline central maximum orientation) associated with the saliency network, and Map 4 resembles Map E (the vertical line that separates the right and left hemispheres of opposing polarities) typically attributed to the default mode network.26,27,36 Atypical activation of these maps could be an indication of a lapse of attention in both children with ADHD and their siblings, a trait often reported, 37 which can explain the slow reaction time while performing the task. 38 Map 2 was found significant across all comparisons—between children with ADHD and their siblings, ADHD, and controls, as well as siblings and controls, suggesting it may capture a key functional or structural alteration related to ADHD, potentially linked to genetic or neurodevelopmental factors suggesting it to be a state marker. Siblings showed intermediate differences for both Maps 2 and 3 when compared to controls, suggesting they share some neural characteristics with ADHD individuals, possibly due to shared genetic or environmental influences. Notably, Map 3 distinguished only siblings from controls, suggesting it may represent a trait marker, capturing stable structural or functional alterations that are not necessarily symptomatic but may indicate a predisposition to the disorder.
While pre-stimulus microstates offer a snapshot of the brain’s readiness, analyzing the neural activity just before a correct response can further clarify the processes driving successful performance. The statistical comparison of pre-response periods for correct trials between groups showed higher activation in both children with ADHD and their siblings when compared to neurotypical controls as well as in siblings when compared to children with ADHD. The source was localized at the middle and superior temporal gyrus, uncus, inferior parietal lobule, precentral gyrus, postcentral gyrus, and middle frontal gyrus in children with ADHD compared to controls prior to correct response selection. Increased activity in these areas suggests increased task-based attentional demand,39,40 in children with ADHD to resolve emotional interference and accurate response selection. Among the activated areas, the middle frontal and temporal gyrus regulate attention and, along with the postcentral gyrus, are known to be engaged during cognitive control processes influenced by emotions,41–43 Meanwhile, the precentral gyrus has been reported to be involved in motor execution and implicated in response inhibition 44 and in determining how competing cognitive and emotional information is processed 45 ; meanwhile, the inferior parietal lobule aids in cognitive control, attention, and conflict resolution and has been associated with increased difficulty of EST. 46 IPL has also been shown to be involved in automatic emotion regulation task. 47
Similar to children with ADHD, we observed that their siblings also showed increased activation compared to both neurotypical controls and children with ADHD. Among the activated areas, inferior temporal and fusiform play a role in facial processing and have been reported to be modulated by emotional faces. Meanwhile, superior temporal gyrus activation was reported when subjects responded to faces with a negative emotional expression compared with neutral ones. 48 We also found a difference in activity in the superior temporal gyrus associated with sentence processing and social–emotional processing 49 and the Parahippocampal gyrus associated with emotional processing. 50
The pre-response source localization results suggest that increased allocation of cognitive resources is a preserved trait among children with ADHD and their siblings to resolve cognitive conflict during emotional interference tasks.
Conclusion
Overall, we found distinct behavioral performance, pre-stimulus–microstate parameters, and pre-response neural source activation between groups comparison during word-face EST, suggesting it to be a potential cognitive function task in distinguishing children with ADHD from their siblings and controls. However, further research is necessary to understand the underlying neural mechanisms. Further, this study showed Map 2 as a state marker and Map 3 as a trait marker, thereby emerging as an indicator of correct responses in the study population using microstate analysis. Additionally, increased allocation of neural resources for resolution of correct response was found to be a preserved trait. This further substantiates the potential of ESTs in distinguishing the performance of children with ADHD between their siblings and controls.
This study explored the interference effect elicited by valence words on facial expression in children with ADHD, their siblings, and neurotypical controls using behavioral, microstate, and source localization analysis. Although this study analyzed the pooled data of ESTs, the data can be further analyzed separately for congruent and incongruent trials to determine neural correlates associated with the emotional interference process in ADHD. Though promising results are exhibited, it should be considered that the study was conducted with a small sample size, and a larger sample size is required to gain an in-depth understanding. Psychometric assessment tests alongside parental interviews could have been used to rule out psychiatric condition(s)/disorder in siblings of children with ADHD. Further, psychometric tools to corroborate the presence of any co-morbid conditions, such as depression and anxiety, which are known to influence emotions, could have enhanced the study.
Supplemental Material
Supplemental material for this article available online.
Supplemental Material
Supplemental material for this article available online.
Supplemental Material
Supplemental material for this article available online.
Supplemental Material
Supplemental material for this article available online.
Supplemental Material
Supplemental material for this article available online.
Footnotes
Acknowledgements
The authors would like to thank Department of Science and Technology (DST) for funding the research of the article and all the participants of the study (CSRI/127/2016).
Data Availability Statement
The data that support the findings of this study will be provided on request.
Declaration of Conflicting Interests
The authors declared no potential conflicts of interest with respect to the research, authorship, and/or publication of this article.
Declaration Regarding the Use of Generative AI
Declaration Regarding Use of Generative AI was not used in writing this manuscript. Authors assume full responsibility for the entire content of the manuscript.
Ethical Approval
The study was approved by institute’s ethical committee (All India Institute of Medical Sciences, New Delhi; IECPG-300/29.05.2019)
Funding
The authors disclosed receipt of the financial support for the research of this article: The corresponding author received support from Department of Science and Technology (DST) (CSRI/127/2016).
Informed Consent
Informed consent and assent were obtained from all the children and their parents, prior to inclusion in the study.
References
Supplementary Material
Please find the following supplemental material available below.
For Open Access articles published under a Creative Commons License, all supplemental material carries the same license as the article it is associated with.
For non-Open Access articles published, all supplemental material carries a non-exclusive license, and permission requests for re-use of supplemental material or any part of supplemental material shall be sent directly to the copyright owner as specified in the copyright notice associated with the article.