
Abstract
Background:
Research on event-related potentials (ERP) in addiction highlights the importance of cognitive ERP markers, such as P300 and error-related negativity (ERN), in distinguishing between alcohol-dependent patients and healthy controls. We aimed to develop and validate ERP paradigms utilizing culturally validated stimuli to evoke P300 and ERN for the Indian population.
Methods:
In a cross-sectional study, 16 alcohol-dependent patients and age-matched healthy controls were recruited. For P300, we designed a visual oddball (Go/No-Go) task using culturally appropriate alcohol and non-alcohol-related images. To study ERN, we used the Assessing Neurocognition via Gamified Experimental Logic (ANGEL) task, developed in India, integrating its “game” levels to capture error monitoring with fewer trials. A 32-channel EEG-ERP system was used for data acquisition.
Results:
Participants showed high engagement in the visual Go/No-Go task, with 94.4% accuracy. The P300 difference wave showed significantly higher amplitudes (p = .01, Cohen’s d = 0.97) and latencies (p < .001, Cohen’s d = 1.62) in patients compared to controls at the Pz electrode. No significant group differences were found in accuracy or reaction times for frequent and rare stimuli. In the ANGEL task, patients had a significantly lower ERN difference wave amplitude at the Pz electrode than controls (p < .001, Cohen’s d = 1.47), with no latency differences. Task accuracy was lower, and reaction time was longer in patients.
Conclusions:
The visual Go/No-Go task and the ANGEL task are promising tools for understanding the neurocognitive mechanisms underlying alcohol dependence in the Indian context.
Keywords
Cognitive ERP markers such as P300 and error-related negativity (ERN) may be useful in differentiating between patients with alcohol dependence and healthy controls Both the visual Go/No-Go task and the ANGEL task were validated using culturally relevant stimuli in patients with alcohol dependence and healthy controls.Key Messages:
According to the World Health Organization’s 2018 global alcohol report, 17.2% of India’s population engages in heavy episodic drinking. In 2016, people aged 15 and older in India consumed an average of 5.7 liters of alcohol per person, a 38% increase from 2010 to 2017, with consumption expected to increase further.1,2 Chronic harmful alcohol use involves complex brain changes where an imbalance between increased alcohol-related cue reactivity and impaired error processing may affect relapse or abstinence in alcohol use disorder patients. Event-related potentials (ERPs), which measure brain responses to specific stimuli, are useful for studying this. Two ERP components, P300 and error-related negativity (ERN), are important for assessing cognitive and emotional functions in individuals with alcohol dependence.
The P300 is a positive ERP component occurring around 300 ms after a stimulus, depending on its complexity. It indicates attention allocation, cognitive processing, and stimulus salience. 3 P300 research often uses the randomized oddball paradigm and the Go/No-Go task. The oddball paradigm presents a rare stimulus randomly among frequent ones, with at least a 20% probability.3,4 The Go/No-Go task requires participants to respond as quickly as possible to frequent “go” stimuli while inhibiting responses to infrequent “no-go” stimuli. This task evaluates an individual’s capacity for inhibitory control, which is required to overcome automatic response tendencies. 5 In individuals with alcohol dependence, rare alcohol-related stimuli elicit a significantly larger P300 amplitude, indicating increased cue reactivity or salience.6,7
The ERN is a negative response occurring 50–100 ms after identifying response conflict and errors in cognitive activity, primarily visible across the midline frontocentral scalp area and originating in the anterior cingulate cortex.4,8,9 Studies have shown that individuals at risk for AUD exhibit decreased amplitude in ERN compared to healthy controls.10–12 Additionally, low to moderate doses of alcohol reduce neuronal error-reactivity in healthy individuals.12–13 However, some studies report that individuals with AUD may exhibit enhanced ERNs.14,15 Thus, ERN results vary, and there is no consensus on its role in AUD.
There is a notable gap in exploring both P300 and ERN components in addiction research, particularly regarding AUD in the Indian population. To bridge this gap, researchers must consider cultural variations in attitudes toward alcohol. Using culturally relevant images in studies ensures that the appropriateness of the stimuli increases, prevents misunderstandings, and increases the accuracy of the results. 16 In India, where drinking patterns and rituals differ, culturally relevant images better represent drinking behaviors and preferences. The Indian Alcohol Photo Stimuli (IAPS) 17 was developed to ensure cultural sensitivity and relevance. This study validates the Go/No-Go task paradigm, using IAPS to assess alcohol cue reactivity in patients with AUD.
Without a standardized ERP paradigm for reliably evoking ERNs in individuals with AUD, the Assessing Neurocognition via Gamified Experimental Logic (ANGEL) task 18 has emerged as a promising alternative. This complex paradigm can elicit 10 neurocognitive components, including the ERN. The “Discern and Decide” component of the ANGEL task is designed to increase error likelihood, thereby eliciting higher ERN amplitudes for incorrect responses. Its flexible design allows for various data analysis conditions, enabling researchers to average infrequent trials that elicit incorrect responses to meaningful stimuli. This study aims to use the ANGEL paradigm to elicit the ERN in patients with AUD and healthy controls.
The objective was to investigate the effectiveness of using culturally relevant stimuli to evoke P300 among individuals with AUD in the Go/No-Go task. Additionally, the study evaluates the ERN using the ANGEL task, which is a non-alcohol-related multi-cognitive paradigm. The results are presented at the individual level to demonstrate the validity of the paradigms in AUD patients and healthy controls.
Methods
Participants
This cross-sectional observational study was conducted at a tertiary care center in southern India from June 2022 to April 2023. Sixteen individuals with alcohol dependence syndrome, currently abstinent, in early remission as per the ICD-10 Diagnostic Criteria for Research, 19 and age-matched healthy controls aged 18–55 years participated. All participants were right-handed, as determined by the Edinburg Handedness Inventory.20,21 Exclusion criteria included harmful substance use other than nicotine or caffeine, as outlined by Campanella et al., 7 a Hindi Mental Status Examination 22 score below 24, significant visual impairment (including refractory errors, color blindness or 6/6 vision), 23 chronic physical illnesses such as hepatic encephalopathy, chronic renal disease, uncontrolled diabetes mellitus, and thyroid disorders, chronic neurological conditions including epilepsy, traumatic brain injury, stroke, and degenerative disorders, and major comorbid psychiatric illnesses. As this was a pilot study examining the feasibility of ERP paradigms, no sample size calculation was done. All participants provided written informed consent. The study received approval from the Kasturba Medical College and Kasturba Hospital Institutional Ethics Committee (IEC 753-2020) and is registered with the Clinical Trial Registry of India (CTRI/2021/03/032163).
Measures
A qualified psychiatrist diagnosed the patients and excluded comorbid disorders. Demographic and clinical details were collected using a semi-structured proforma. The Edinburg Handedness Inventory,20,21 which includes 10 items assessing hand use in various everyday tasks, was used to determine handedness. The laterality quotient was calculated to derive handedness.
The 5-item General Health Questionnaire (GHQ-5) 24 was administered for screening healthy controls. This shorter version of the original 60-item GHQ 25 assesses psychiatric disorders in community settings and non-psychiatric clinical settings. Each item is rated on a bimodal four-point scale, with scores of 0 for “less than usual” or “no more than usual” and scores of 1 for “rather more than usual” or “much more than usual.” Total scores range from 0 to 5, with a cut-off score of less than 1 used to classify individuals as healthy controls. This questionnaire, validated for use in the Indian population, has a sensitivity of 86% and a specificity of 89%. 24
The Alcohol Use Disorders Identification Test (AUDIT), 26 developed by the World Health Organization, was used to screen for alcohol consumption. The AUDIT consists of 10 items that prompt patients to report their alcohol consumption in terms of standard drinks. Each question is scored from 0 to 4, with a maximum possible score of 40. A score of 8 or higher indicates hazardous or harmful alcohol use. The AUDIT has been tested across various racial and ethnic groups and genders, demonstrating good sensitivity and specificity. 26
To assess craving, the Alcohol craving questionnaire (ACQ-NOW) 27 was used. This self-administered scale consists of 47 items and is designed to assess the multidimensional aspects of alcohol craving among current users. A general craving index is derived from these items. The scale was translated into Kannada and then back-translated following WHO protocol to ensure linguistic and conceptual accuracy, with permission from the original author. 27
Procedure
EEG Acquisition
The Go/No-Go task and the ANGEL paradigm were created using the Brain Electro Scan System (BESS) ERP software. EEG/ERP acquisition and paradigm presentation were synchronized using the same software. EEG/ERP recordings were conducted in an acoustically insulated environment. Stimuli were displayed on a computer monitor at a viewing distance of 103 cm in a pseudo-random sequence. EEG data were collected using a 32-channel saline-based cap and the BESS amplifier, with electrodes positioned according to the 10–20 system using sintered Ag-AgCl electrodes. Data were digitized at 24-bit resolution with a sampling rate of 1024 Hz. Throughout the experiments, electrode impedance was maintained below 10 kΩ. (BESS 6.1, Axxonet, India).
EEG Tasks
Task 1: Go/No-Go Task
To create alcohol-related images for the task, we assembled a bank of 203 photos with cultural relevance to the Indian context, the IAPS. 17 The “beer in a glass” image was selected as the visual alcohol-related stimulus, while visually matching images of tea and juice were chosen as non-alcohol-related stimuli (Supplementary Figure 1).
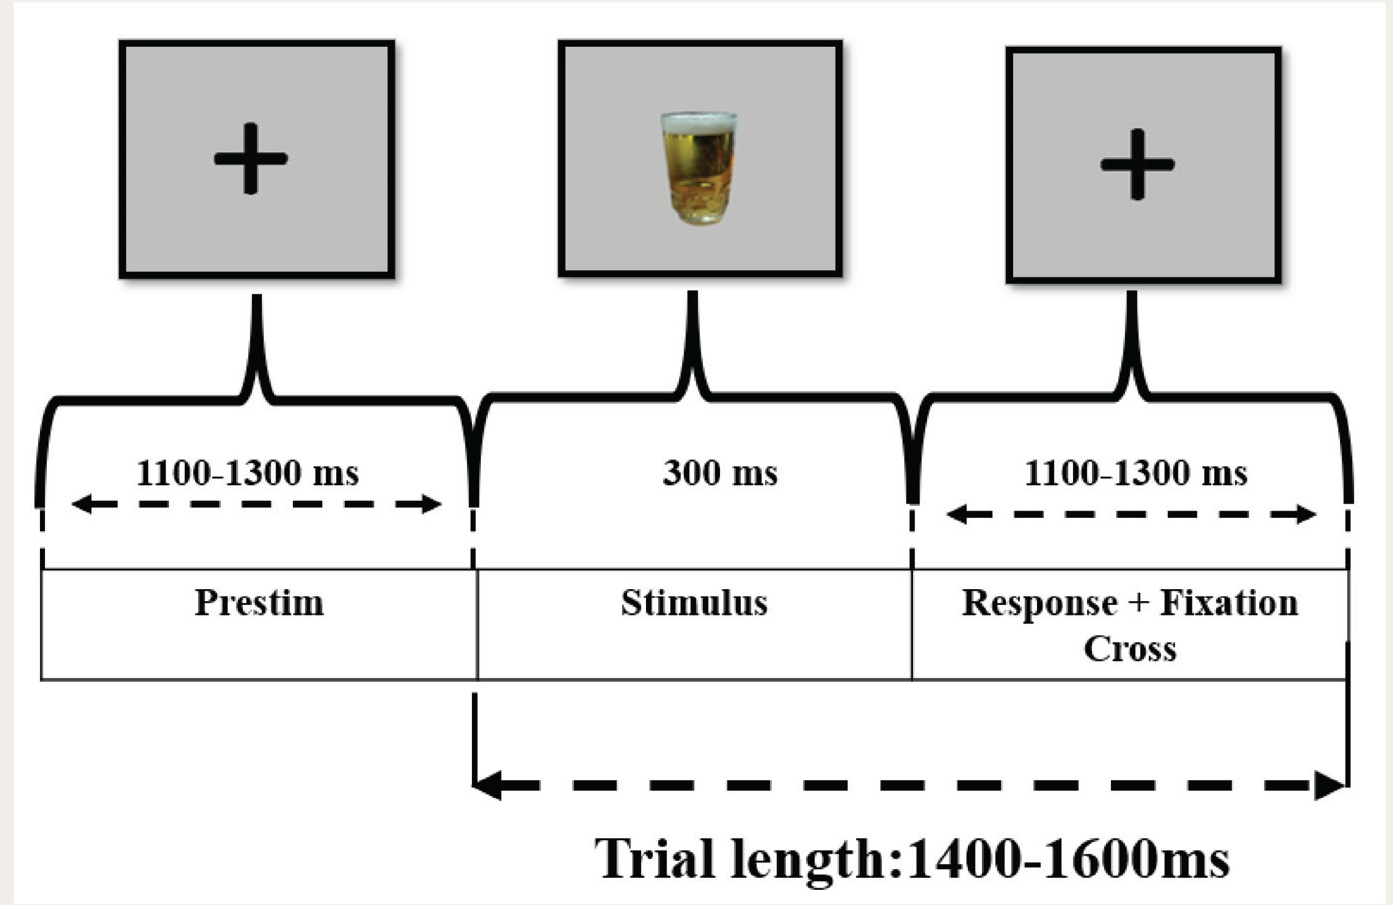
During the task, a total of 600 images were presented: the frequent stimulus “tea” appeared 480 times (80%), the target image “beer in a glass” appeared 60 times (10%), and the deviant image “juice” appeared 60 times (10%). The paradigms were administered in a predetermined pseudo-random order, consistent across all participants. The task was divided into four blocks, with breaks after every 300 trials. Each trial included a fixation cross, with images displayed for 300 ms, followed by an inter-trial interval ranging from 1100 to 1300 ms, during which a fixation cross appeared (Figure 1). Participants responded by pressing corresponding buttons on a number keypad. For the “go” trials, they pressed button 4 with their left index finger when the frequent image “tea” appeared. For the target “beer in a glass” image, they pressed button 6 with their right index finger while ignoring the “juice” image, distracting the “no-go” trials. Feedback in terms of correct or incorrect responses was provided using high- and low-pitched tones throughout the experiment.
Structure of a Go/No-go Task Trial.
Task 2: ANGEL Task
To study ERPs associated with error processing, including the ERN and positive error (Pe), we used the ANGEL task, a non-alcohol-related multi-cognitive paradigm developed within the Indian context. Each trial starts with a white plus sign (+) at the center of the screen for fixation, flanked by two black-and-white checkerboards (Supplementary Figure 2). Then, one checkerboard is briefly replaced with a prominent black-and-white visual stimulus for 240 ms, randomly selected from 30 images, including Mooney faces or their distorted versions. 28 In each block, one type of picture appears 80% of the time on one side of the fixation sign (frequent) and 10% of the time on the other side (rare) (Supplementary Figure 3). The other image type is presented on the other side the remaining 10% of the time (rare). There were 320 trials (20 trials per block across 16 blocks), with inter-trial intervals ranging from 1200 to 1900 ms. Participants respond as fast as possible by pressing corresponding keys with both index fingers, indicating either the position of the image (left vs. right; “where” blocks) or the type of stimuli (face vs. distorted; “what” blocks) based on the instruction at the beginning of each block. They have 700 ms to respond; otherwise, it is a missed response. Each block comprises 20 trials, followed by average response time and accuracy feedback. The entire procedure, including feedback breaks, typically takes 10 minutes (Figure 2). 18
ANGEL Task Trial Structure.
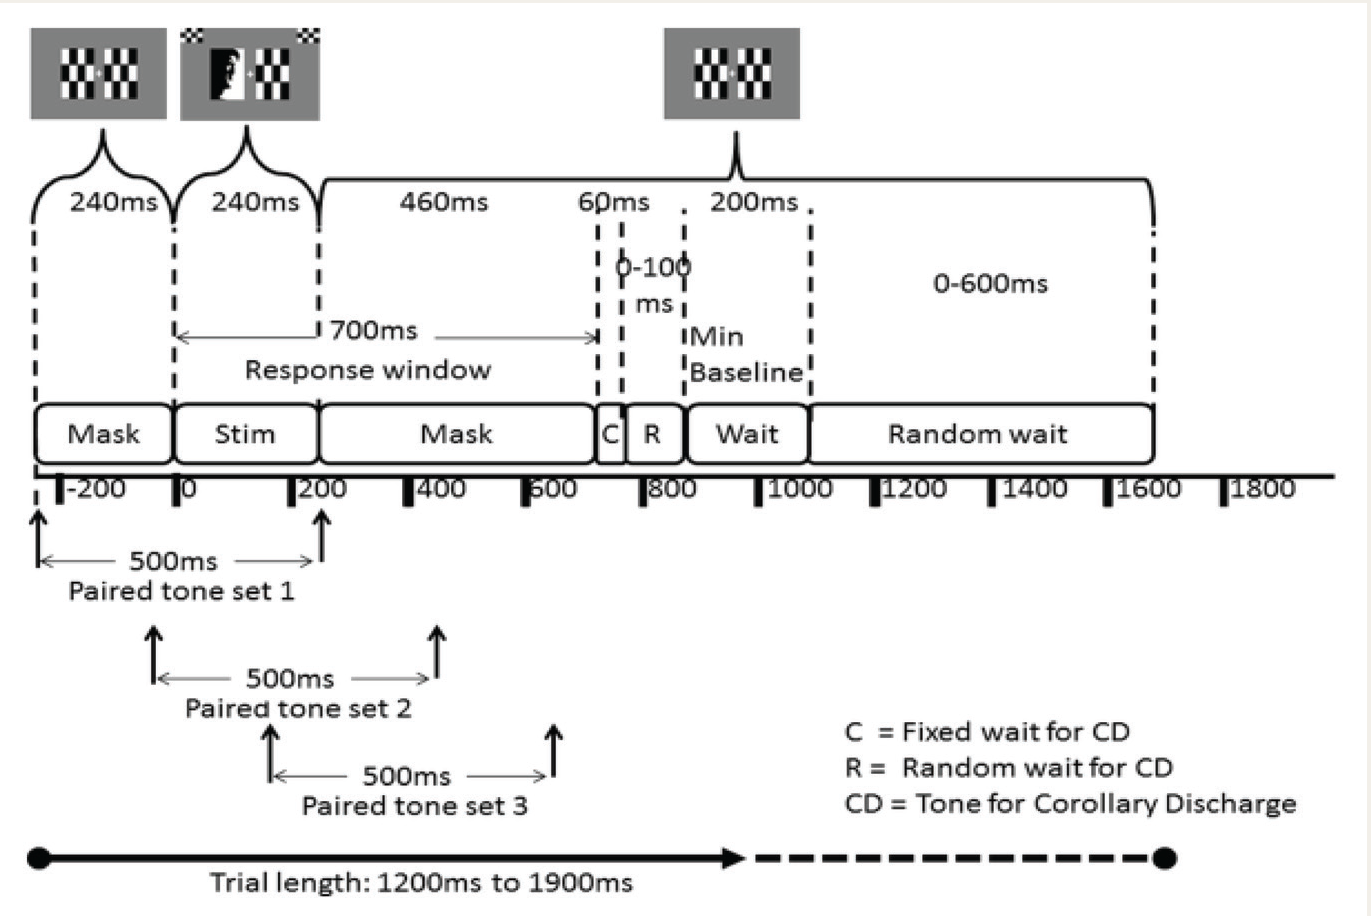
The visual stimulus (Stim) includes a pre-stimulus mask where paired tone stimuli may begin and a post-stimulus mask during which the subject can respond. The Corollary Discharge (CD) tone may be presented (C) immediately after the subject responds or after a random interval (R) at the end of the response window timeout. Each trial presents only one of the three paired tone sets, followed by three trials with a blank sound clip. At the end of each trial, there is a fixed minimum baseline (including the mask) of 200 ms, which may randomly extend by up to an additional 700 ms. On average, each trial lasts 1550 ms, ranging from 1200 to 1900 ms. Adapted from “Nair AK, Sasidharan A, John JP, Mehrotra S, Kutty BM. Assessing Neurocognition via Gamified Experimental Logic: A Novel Approach to Simultaneous Acquisition of Multiple ERPs. Front Neurosci 2016;10:1. doi: 10.3389/fnins.2016.00001.” Materials and methods section, Figure 2.
EEG and ERP Data Processing
We performed offline data analysis using EEGLAB version 2021.1, 29 an open-source toolbox running on MATLAB version R2021a (The MathWorks Inc.). Raw EEG recordings were exported from BESS as EDF files with additional digital event time information in a separate text file. These files were imported into EEGLAB in “. Set” format, using default channel location information based on channel labels. Events were imported from the “. evt” file created during data recording. We applied a 30 Hz low-pass filter, removed bad channels, and eliminated segments with large amplitude artifacts (e.g., movement) using the artifact subspace reconstruction (ASR) method, available as a clean raw data plugin in EEGLAB. A 15 standard deviation threshold was used for ASR. Independent component analysis was then performed on the clean data using the default “infomax” algorithm, and components were automatically classified with the IClabel plugin. Components labeled eye artifacts and muscle movements with >90% confidence were removed. The removed bad channels were interpolated on the cleaned dataset, then down-sampled to 256 Hz and re-referenced to the average of all channels.
The pre-processed data were then epoched from -200 ms to 1000 ms for P300 and -500 ms to 800 ms for ERN. These epochs were assigned to bins, averaged into ERP waveforms, and various ERP measures were extracted, including peak amplitude and latency, using the ERPLAB plugin version 8.10. 29 P300 was the largest positive peak after the N2 wave between 250 and 500 ms post-stimulus onset. The P3d peak amplitude and latency (from the “target” alcohol minus “frequent” tea difference wave) were obtained for each participant. The ERN waveform was defined as the peak amplitude and latency within a 50–200 ms interval after the response at the midline electrodes for incorrect trials compared to correct trials (from the incorrect minus correct difference wave) for each subject separately. 4
Statistical Analysis
Statistical computations were performed using Jamovi version 2.4. 31 The mean amplitude and latencies of the difference waves for P300 and ERN were compared using independent samples t-tests. Behavioral data for both tasks, including reaction times on correct hits and commission errors, were also compared between the two groups using independent samples t-tests. Effect sizes were reported as Cohen’s d (small: <0.5 small, medium: 0.5–0.8, large: >0.8). All p values <.05 were considered statistically significant.
Results
Sample Characteristics
Sixteen male alcohol-dependent patients, currently abstinent, and age-matched controls were recruited for the study (Table 1). The mean age of the patients was 37.9 years (SD 5.9, range 28–47), and the controls were 36.8 years old (SD 6.4, range 26–46). Among the patients, 75% were married, 56.2% had a middle school certificate, and all were employed. Most patients lived in nuclear families (56.3%) in rural or semi-urban areas (43.7%) and belonged to the upper-middle class (68.7 %). Among the healthy controls, 56.3% were married, all had attained honors-level education, and 68.7% were employed. The majority lived in nuclear families (81.3%) in semi-urban areas (100%) and belonged to the upper-middle class (68.7%).
Sociodemographic and Clinical Characteristics.
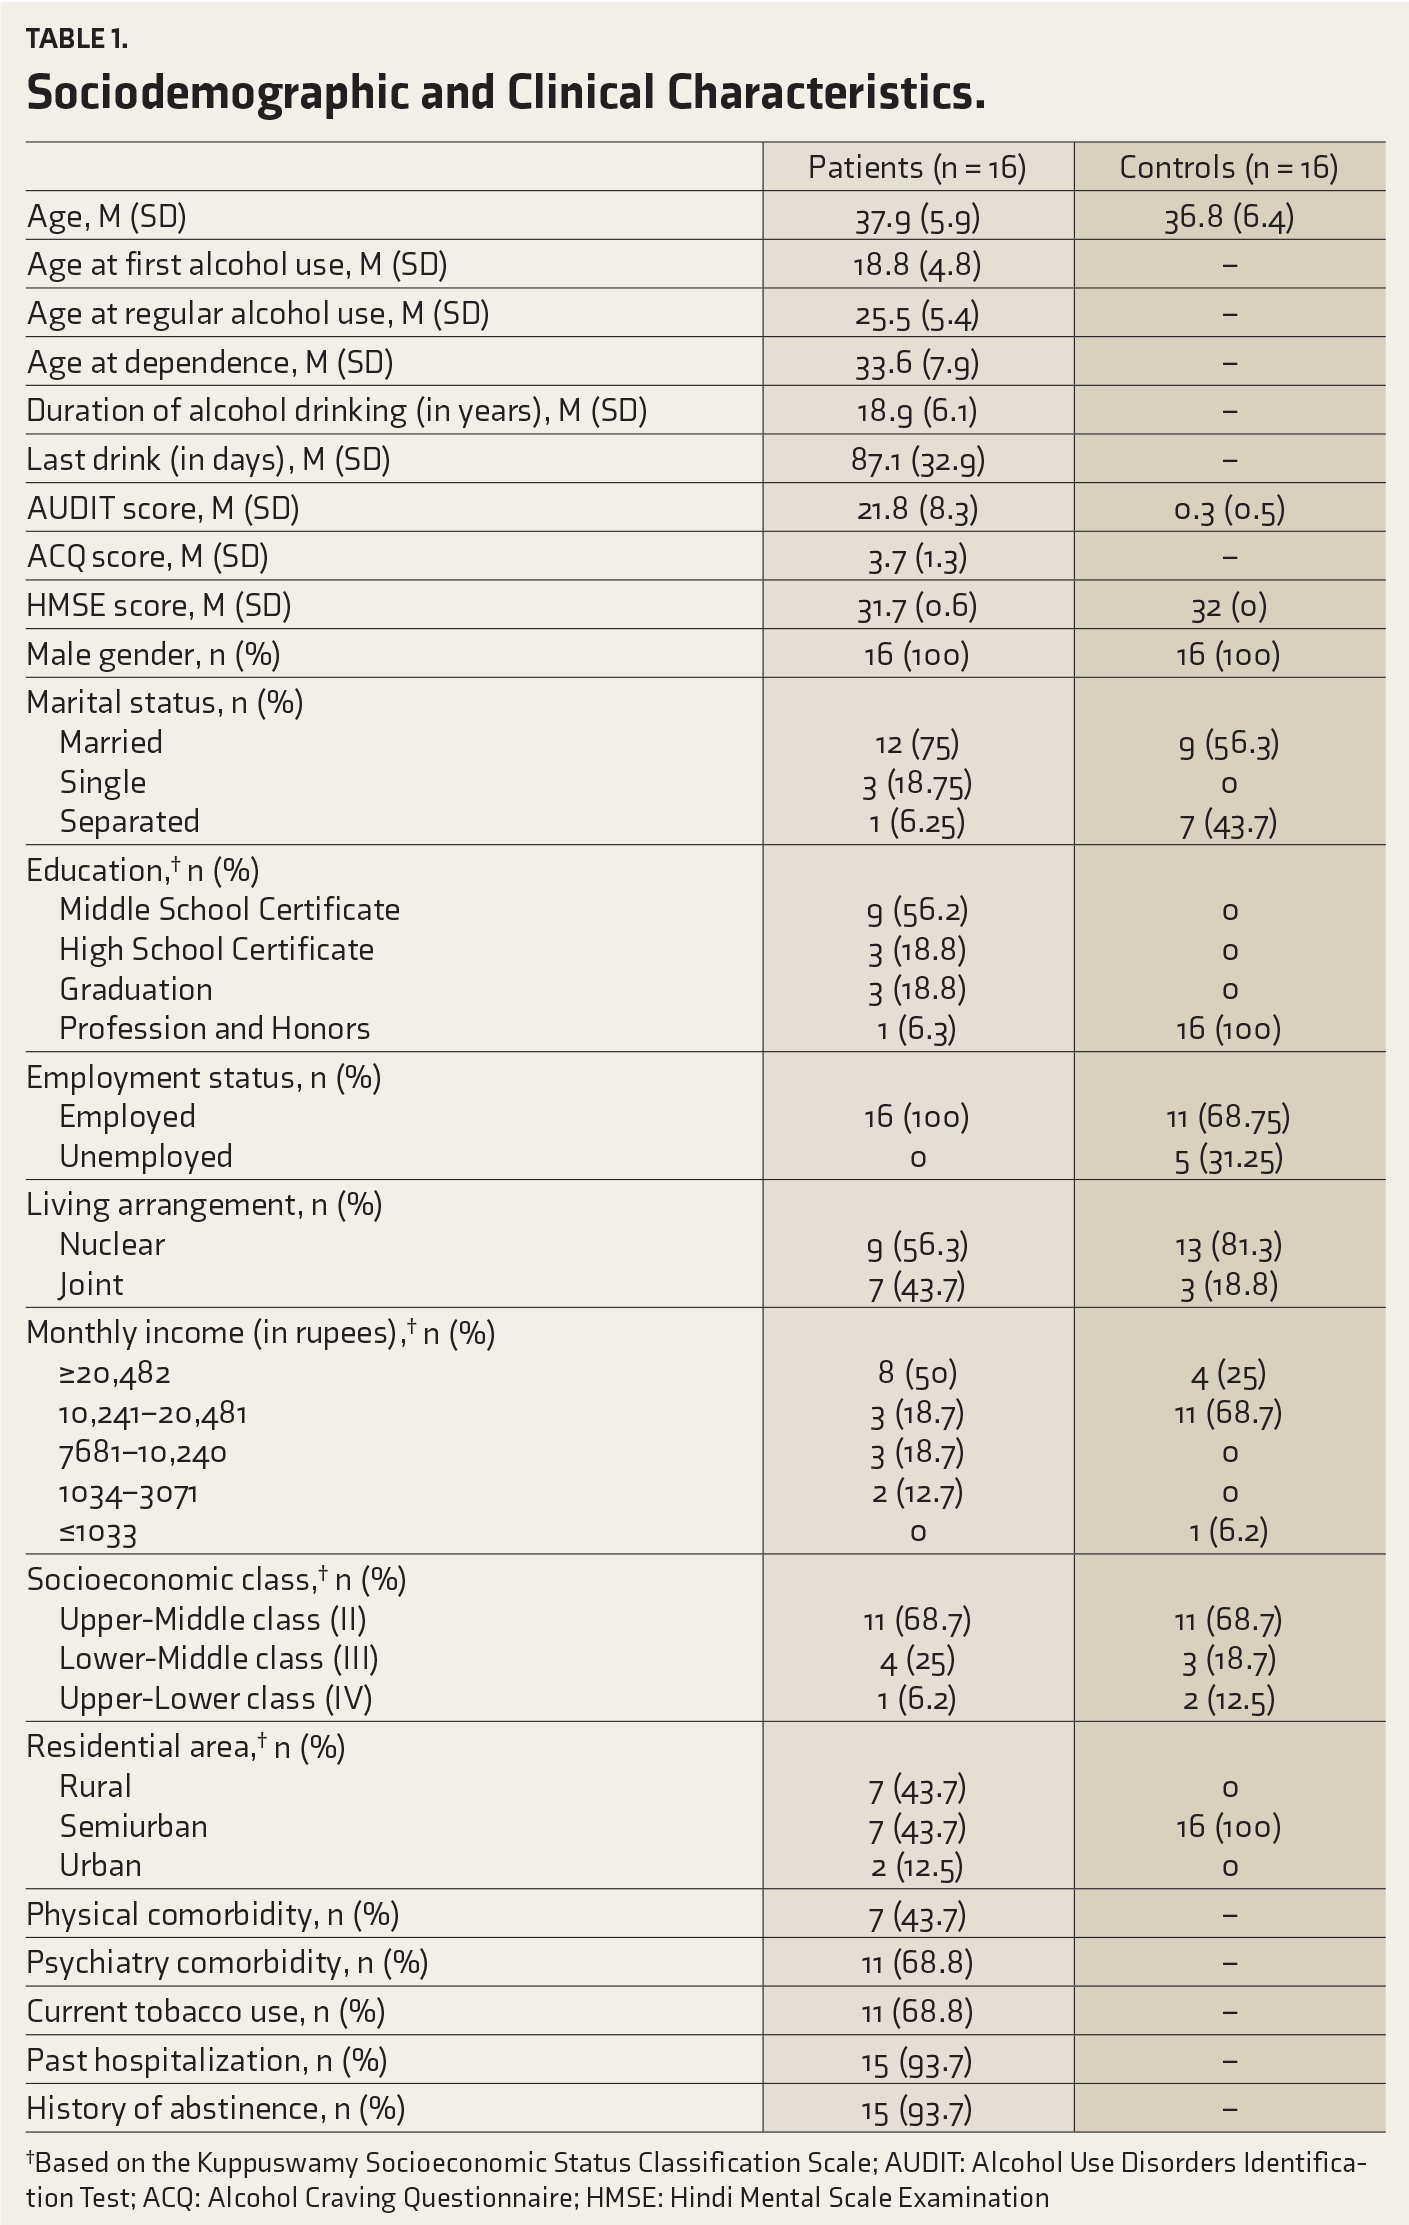
†Based on the Kuppuswamy Socioeconomic Status Classification Scale; AUDIT: Alcohol Use Disorders Identification Test; ACQ: Alcohol Craving Questionnaire; HMSE: Hindi Mental Scale Examination
The mean age of first alcohol use among patients was 18.8 years (SD 4.8), with a mean duration of alcohol dependence of 18.9 years (SD 6.1). Approximately 43.8% had psychiatric comorbidity, specifically tobacco dependence, and 93.8% had experienced periods of abstinence. Participants were assessed at an average of 87.1 days since their last drink (SD 32.9, range 10–146 days). The majority had a history of previous hospitalizations (93.7%) and were current tobacco users (68.8%). The mean ACQ-NOW general craving score was 3.7 (SD 1.3). The mean AUDIT score for patients was 21.8 (SD 8.3), significantly higher than the healthy controls, with a mean score of 0.3 (SD 0.5).
Go/No-Go Task
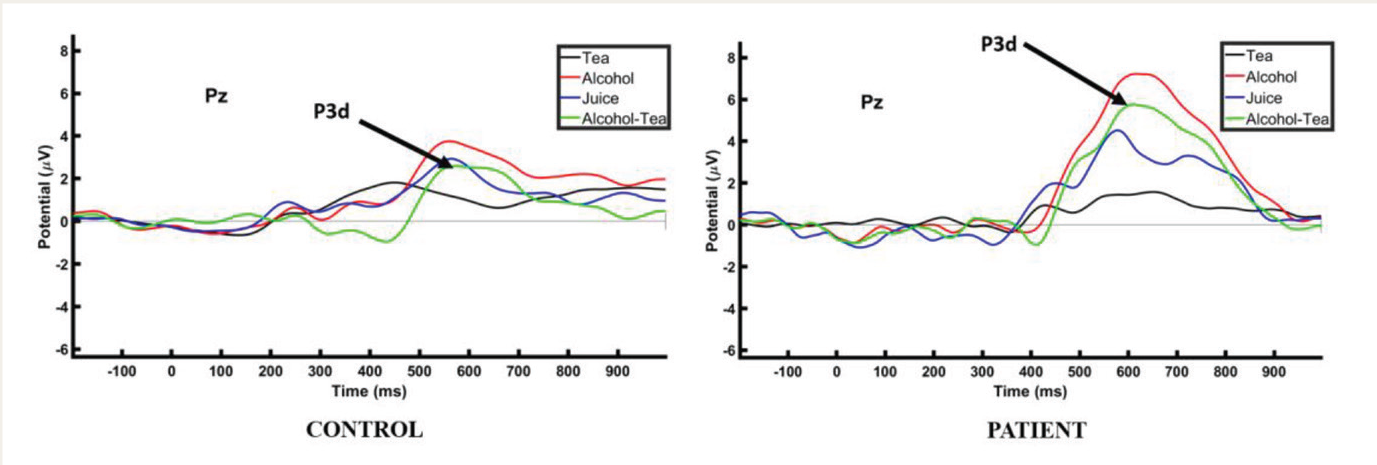
In the Go/No-Go task, the P3d amplitudes (p = .01) and latencies (p < .001) at the Pz electrode were significantly higher in patients compared to healthy controls (Table 2). The effect sizes, measured by Cohen’s d, were 0.97 for P3d amplitudes and 1.67 for latencies, indicating large effects. However, there were no significant differences between the groups regarding accuracy or reaction times for the frequent tea and target alcohol stimuli.
P300 and ERN Difference Wave Amplitudes and Latencies at Pz in Patients and Controls and the Behavioral Responses.
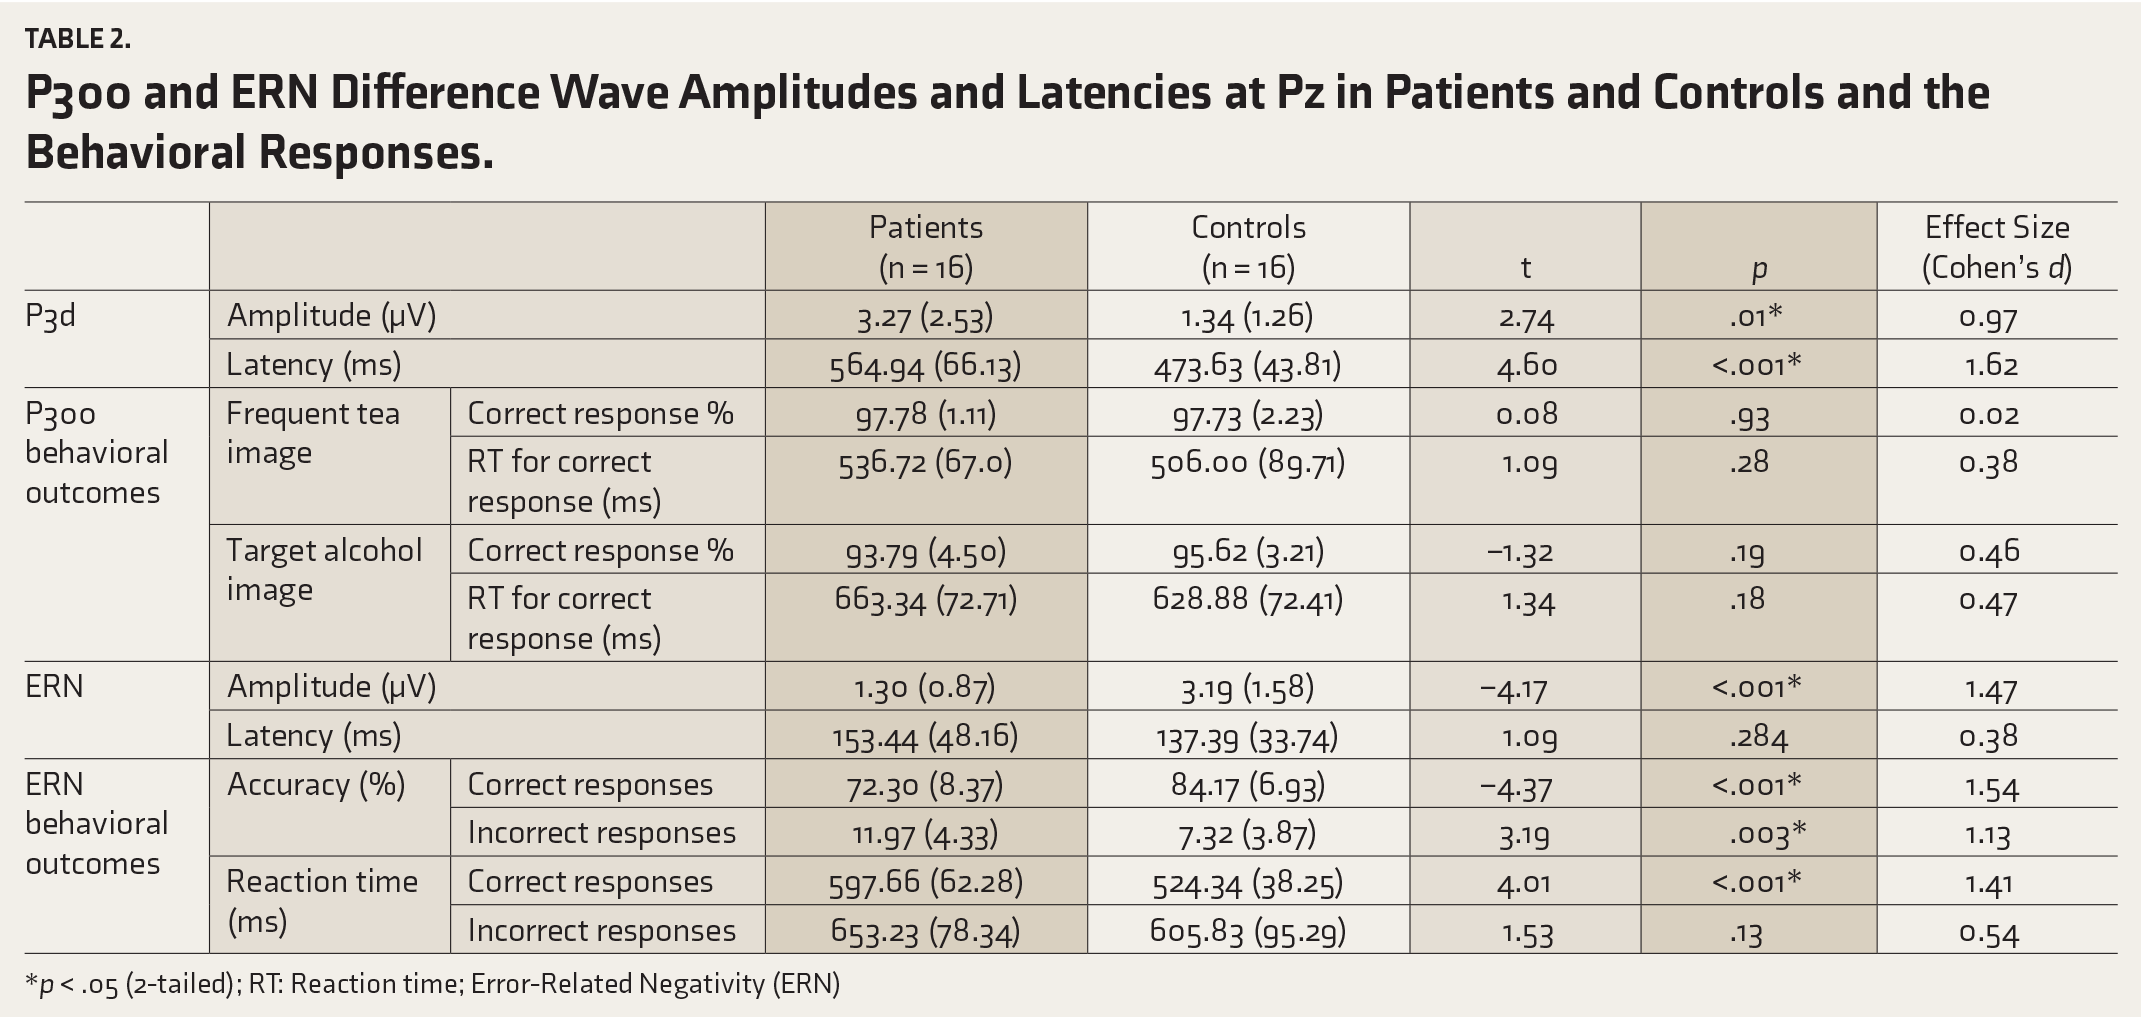
*p < .05 (2-tailed); RT: Reaction time; Error-Related Negativity (ERN)
ANGEL Task
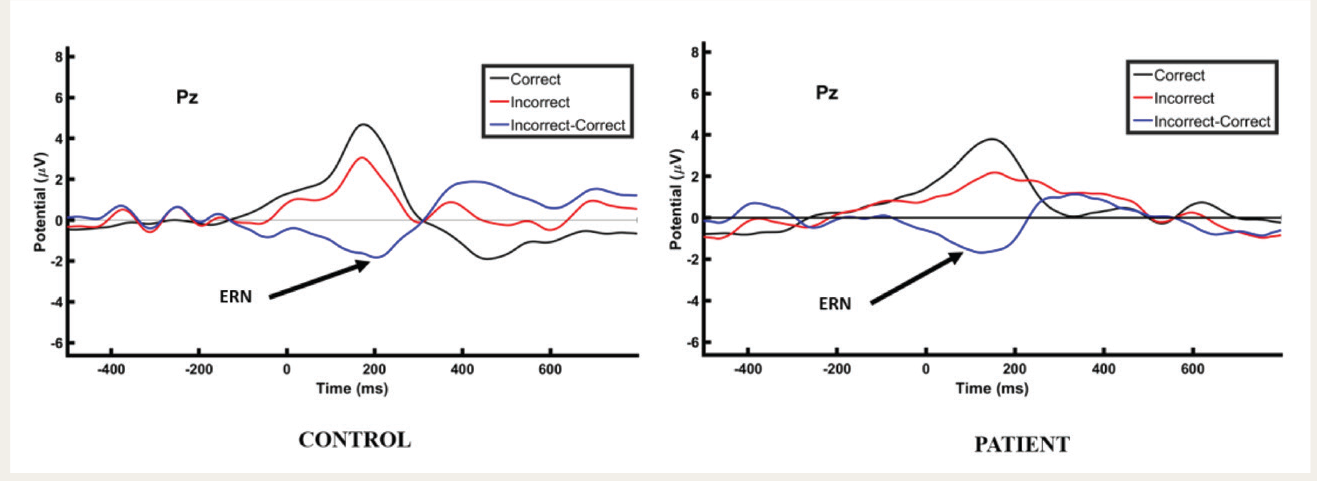
In the ANGEL task, the mean ERN difference wave (incorrect minus correct) amplitudes at the Pz electrode were significantly lower among patients compared to healthy controls (p < .001) (Table 2), with no difference in latencies of the ERN difference wave between the groups. The effect size for the amplitude difference was large (Cohen’s d=1.47).
Both groups made an average of 30.87 errors (SD 14.98) during the ANGEL task. Significant differences in task accuracy were observed: patients had lower correct responses (p < .001) and higher incorrect responses (p = .003) compared to controls. Healthy controls exhibited significantly lower reaction times for correct responses (p < .001), while no significant difference was observed for incorrect responses.
Proof of Concept ERP Tasks
Figures 3 and 4 depict representative ERP waveforms from the Go/No-Go and ANGEL tasks. In the Go/No-Go task, the P300 waveform was stimulus-locked to the rare stimulus, showing its largest positive peak within the 450–600 ms range. This response was prominently observed at the Pz electrodes. In the ANGEL task, the ERN was response-locked and appeared as a negative deflection at the Pz electrode after the response. This was followed by a positive potential (Pe) between 50 and 200 ms, noted in the patient group compared to controls.
P3d Waveforms in Go/No-go Task Over Pz Electrode as the Largest Positive Peak After Stimulus Onset in Healthy Control Subjects and Patients With Alcohol Dependence (Representative Image).
ERN Waveform in ANGEL Task Over Pz Electrode as a Negative Deflection Post Response in Healthy Control Subjects and Patients With Alcohol Dependence (Representative Image).
Discussion
The present study aimed to validate a Go/No-Go task using IAPS and the ANGEL task in patients with AUD. Results showed that AUD patients exhibited heightened P3d amplitude in response to alcohol-related images and decreased ERN amplitude compared to the control group. This indicates an enhanced attentional bias toward alcohol cues and deficits in error processing, reflected in a higher frequency of errors among AUD patients compared to controls.
Experimental Measures of Go/No-Go Task (Alcohol Cue Reactivity)
The visual Go/No-Go task in the current study elicited a notably higher positive voltage in response to the culturally relevant “target” alcohol-related stimulus (“beer in a glass” image) in comparison to the non-alcohol-related stimuli (“frequent” tea and “distractor” juice image) in patients with AUD. This effect was most prominent at the parietal midline electrode, aligning with the previous studies on the Go/No-Go task standardization.6,7,32 The Go/No-Go task paradigm, using culturally relevant images, holds significant potential for future AUD studies in India, offering insights into the neurocognitive mechanisms driving addictive behaviors. Replicating these findings on larger samples could help better understand these underlying processes.
Previous research on alcohol cue reactivity has often used complex image sets, including photographs of people drinking and still-life images of alcohol and non-alcohol-related bottles or glasses.7,33,34 Such diverse and complex images can complicate the interpretation of underlying brain activity. Our study used a single, standardized image for each category to reduce bias and maintain control over stimuli, which is crucial for investigating neural responses and cognitive processes elicited by specific visual cues. This approach addresses the challenges in prior studies, where evaluating complex, emotionally loaded visual stimuli sequences proved difficult.35,36 To minimize variability in ERP data, we used shorter sequences with block breaks after every 300 trials. This method enhanced participants’ attention and discrimination of the stimuli, consistent with previous research in this field. The standardized Go/No-Go task paradigm used in this study, focusing on culturally relevant stimuli, offers a robust framework for exploring neurocognitive aspects of AUD in the Indian context.
Experimental Measures of an ANGEL TASK (Error Processing)
The ERN and its impact on altered conscious awareness of action errors deserve special consideration, particularly since alcohol-related ERP research often emphasizes unconventional P3 and No-Go P3 components. Our current study employed the ANGEL paradigm and found reduced ERN amplitude in patients compared to the control group at the midline electrode position (Pz). This aligns with previous findings in individuals with AUD11,37 and binge drinkers. 38 Behaviorally, patients exhibited a higher frequency of incorrect responses than controls, reinforcing the electrophysiological findings observed between the groups.
Fein and Chang 39 conducted a study using a modified version of the Balloon Analog Risk Task (BART) to assess risk-taking behavior in AUD, providing trial-by-trial feedback with monetary outcomes for errors. In contrast, the Eriksen Flanker task 40 does not offer feedback. Bartholow et al. 37 used the Weapons Identification Task (WIT) to measure neural reactivity to errors during inter-racial interactions known to induce anxiety. Only one study has used a cued Go/No-Go task 10 to generate sufficient errors for AUD research.
Our study employed the ANGEL task, which uniquely measures error processing through gamification elements in the typical oddball paradigm. The task gradually increases the difficulty in maintaining motivation and provides quantitative feedback on their performance, encouraging participants to improve accuracy and speed. This approach offers a promising tool for measuring error processing in terms of engagement and meaningfulness. The findings from our research, using both the Go/No-Go and ANGEL tasks, provide supplementary information for clinical diagnosis and vulnerability assessment beyond self-report measures of behavior.41–43
The Go/No-Go and ANGEL tasks mimic real-life situations, providing greater ecological validity than cognitive tests that limit inputs and focus only on the tested variable. These paradigms are simple yet engaging, ensuring inclusivity by maintaining low reading and language standards. They incorporate multiple audio and visual cues to aid decision-making and provide performance feedback, enhancing the accuracy of the assessments.
There are a few limitations to consider when evaluating the current study. Firstly, while we used multiple electrode locations to analyze the ERP components, our research mainly focuses on the midline electrode Pz to analyze the difference wave across both tasks. Secondly, our analysis and conclusions rely entirely on the assumption that culturally relevant images carry distinct emotional significance. We did not directly compare stimuli with cultural relevance to those without such relevance, indicating a potential area for future exploration.
Conclusions
In summary, both the Go/No-Go task and ANGEL tasks effectively evoke P300 and ERN components in individuals with alcohol dependence and healthy controls. Studying ERP changes through these tasks could serve as potential indicators for predicting relapse. Administering these tasks to individuals with AUD could offer insights into the neurocognitive mechanisms underlying their addictions. Overall, these tasks show promise in understanding and evaluating key aspects of AUD, potentially aiding in predicting relapse and prevention.
Supplemental Material
Supplemental material for this article is available online.
Footnotes
Acknowledgements
We thank the Dhirubhai Ambani Foundation, A.V. Baliga Memorial Hospital, Udupi, and Axxonet System Technologies, Bangalore, Karnataka, India, for their support.
CTRI Registration
CTRI/2021/03/032163.
Declaration of Conflicting Interests
The authors declared no potential conflicts of interest with respect to the research, authorship and/or publication of this article.
Declaration Regarding the Use of Generative AI
No part of this article was written or generated by a generative AI tool. The authors take full responsibility for the accuracy, integrity, and originality of the published article.
Ethical Approval
The study received approval from the Kasturba Medical College and Kasturba Hospital Institutional Ethics Committee (IEC 753-2020).
Funding
The authors disclosed receipt of the following financial support for the research, authorship, and/or publication of this article: The research is funded by a CSR grant from the Dhirubhai Ambani Foundation.
Informed Consent
Written informed consent was obtained from all the participants.
References
Supplementary Material
Please find the following supplemental material available below.
For Open Access articles published under a Creative Commons License, all supplemental material carries the same license as the article it is associated with.
For non-Open Access articles published, all supplemental material carries a non-exclusive license, and permission requests for re-use of supplemental material or any part of supplemental material shall be sent directly to the copyright owner as specified in the copyright notice associated with the article.