
Abstract
Background:
During the COVID-19 pandemic, perceived stress is an important determinant of mental health problems, especially in health care workers (HCW). By and large, regional language tools to assess perceived stress in the context of the pandemic have not been validated in India. We aim to explore the factor structure of the Telugu translated version of the COVID-19 pandemic-related Perceived Stress Scale (PSS-10-C) administered on grassroots frontline HCW of rural Telangana, India.
Methods:
Data relating to 311 grassroots frontline HCW consisting of accredited social health activists (ASHA), multipurpose health workers (MPHW), and auxiliary nurse and midwives (ANMs) working in rural primary health centers (PHC) in five districts of Telangana were analyzed. An exploratory factor analysis was conducted to identify latent factors. Convergent validity was assessed by computing Pearson product-moment correlations between the scores of PSS-10-C and Generalized Anxiety Disorder-7 (GAD-7) and Patient Health Questionnaire-9 (PHQ-9) scales.
Results:
The principal component analysis showed that the 10 items of the scale were significantly loaded by two latent factors with eigen values of 2.792 and 2.009, respectively. Factor solution showed that six and four items correlated with each of the two factors, respectively. Significant correlations between PSS-10-C, GAD-7, and PHQ-9 scores showed convergent validity. The two factors may represent substantive factors “perceived self-efficacy” and “perceived helplessness.” There may be an influence of the reverse-coded method on the factor solution.
Conclusion:
The Telugu translated version of PSS-10-C holds fair-to-good psychometric properties.
The Telugu version of the PSS-10-C is a reliable and valid tool for assessing perceived stress because of the pandemic among grassroot frontline HCW of Telangana.Key Message:
The coronavirus disease 2019 (COVID-19) pandemic has now spanned over three waves in many countries. The pandemic has taken a heavy toll on people’s lives as well as health and human resources. This has led to a steep rise in mental health disorders in the general population during the pandemic. 1 Globally, the psychological impact of the pandemic has been much more on the health care workers (HCW). A recent meta-analysis 2 suggested that the rates of depression and anxiety in HCW were 36% and 37%, respectively; these rates were higher in frontline HCW than nonfrontline HCW.
Perceived stress (PS), defined as “the feelings or thoughts that an individual has about how much stress they are under,” 3 is a moderator in the incidence of depression and anxiety. 4 HCWs’, because of the worry of getting infected and infecting their family members, and overwhelming clinical workload because of increasing cases, fear of contagion, insufficient protective equipment, and limited treatment options,5–9 have been understood to have greater PS. In India, the rates of HCWs with moderate to high PS have been reported to be about 80%10, 11; these rates are similar to those found elsewhere in the world.9, 12
The total load of COVID-19 cases in the two Telugu-speaking states of Andhra Pradesh and Telangana, that is, 2.73 million (as on October 9, 2021), ranks fourth among the Indian states. This implies an important need to assess PS in HCW in this region, as caseload has been shown to be directly related to the mental health issues in them. 8 The grassroots frontline HCW are placed at a higher risk to develop greater PS because apart from the burden of work and risk of infection, they have faced underpayments and lack of compensations.13, 14 Therefore, validation of a local language translation tool to assess PS in the context of the pandemic is deemed necessary for assessing grassroots frontline HCW caring for rural COVID-19 cases.
The objective of this study was to translate the Perceived Stress Scale of COVID-19 (PSS-10-C) 15 to Telugu, a language spoken across the two south Indian states of Telangana and Andhra Pradesh, and to assess its psychometric properties, specifically, identifying its reliability (internal consistency) and exploring its factor structure.
Methodology
The data waere collected as part of the United Nations Children’s Fund (UNICEF) funded project titled “Mental Health of Frontline Healthcare Workers of Rural Telangana.” The study had the approval of the Institutional Ethics Committee. The study involved translation (including assessment of interversion [English-Telugu] correlation), assessment of reliability (internal consistency - split-half reliability), exploratory factor analysis, and convergent validity of the Telugu version of the PSS-10-C.
PSS-10-C
PSS-10-C is a 10-item scale scored on a 5-point Likert of 0 to 4 (never, almost never, sometimes, fairly often, and very often). Items 4, 5, 7, and 8 are reversely scored. Scores >25 are considered as high PS because of the COVID-19 pandemic. 20
Translation
The initial translation was performed independently by two translation experts fluent in English and Telugu. Discrepancies were sorted out by a discussion between the translators and one of the bilingually fluent study investigators (SKT). The “best translation” thus decided was back translated to English by another bilingual mental health professional. All three translators and the bilingually fluent study investigator were then involved in serial identity checks till the linguistic equivalence was agreed upon.
For validating this equivalence, a group of 14 bilingual HCW were administered both the English and the final Telugu versions for comprehensibility and interversion correlations. The group was given both language versions at two different times at an interval of five days, in random order for seven subjects each, for assessing interversion correlation coefficients. Simultaneous correlations, that is, interversion correlations separately for the two-time points, in seven subjects at each time, too, were assessed. All the correlation coefficients were found to be significant and ranged from 0.602 to 1; the interversion correlation coefficients for the entire sample of 14 subjects and the simultaneous correlations for the split sample at the two-time points were found to be comparable, showing statistical equivalence between the original and the translated versions (Table S1).
Data Collection
Data were collected from a total of 323 grassroots frontline HCW who were involved in frontline COVID-19 duties, consisting of the accredited social health activists (ASHA), multipurpose health workers (MPHW), and Auxiliary nurse and midwives (ANMs), working in 10 rural primary health centers (PHC) of five districts (Yadadri Bhuvanagiri, Jayaprakash Bhupalapally, Medak, Vikarabad, and Janagaon) of Telangana. A target sample of about 300 was aimed as per the customary “rule of thumb” 16 of 300 participants for exploratory factor analysis. The number of participants from each PHC was conveniently sampled and ranged between 24 and 36. HCWs previously (prepandemic) diagnosed with mental health disorders were excluded.
Written informed consent was taken from all the participants. Data was collected in August 2021. A uniform standard operating procedure for data collection was followed across the 10 PHCs. The study tools, including the Telugu version of the PSS-10-C, were administered by a psychiatry consultant faculty, a psychiatric nurse, and a training resident. After excluding samples that had incomplete responses, data from 311 participants were used for analysis.
Internal Consistency: Split-Half Reliability
The scale items were split into two sets based on odd–even numbers. Both sets contained two reversely scored items each. The Spearman–Brown coefficient was calculated as a measure of split-half reliability.
Exploratory Factor Analysis (EFA)
Exploratory factor analysis (EFA) was conducted to determine the factor structure of the 10-item PSS-10-C scale. Completed forms of the 10-item Telugu version of the scale from 311 participants were analyzed. Analysis was conducted using the IBM SPSS Statistics, version 23.0 (IBM Corporation, New York, USA).
Assumptions for the EFA were analyzed using the Kaiser–Meyer–Olkin (KMO) test (for sampling adequacy), Bartlett’s test of sphericity (for inter-item correlation significance), and the communality assessment (for the strength of factor extraction). Factor extraction was done using the principal component analysis (PCA) and confirmed using the parallel analysis (
Factor Reliability
Cronbach’s a for the extracted factors was computed. Item deletion was planned if the “Cronbach’s α if item deleted” for any of the items was more than Cronbach’s a for the extracted factors or if the corrected item-total correlations for any of the items was <.03.
Convergent Validity
To assess the convergent validity of the PSS-10-C, Pearson product-moment correlations were computed between the scores of PSS-10-C (individual item, factor, and total) and total scores on the Generalized Anxiety Disorder-7 (GAD-7) and the Patient Health Questionnaire-9 (PHQ-9) scales (both Telugu-translated versions [
Results
Sample characteristics are described in Table 1.
Sample Characteristics
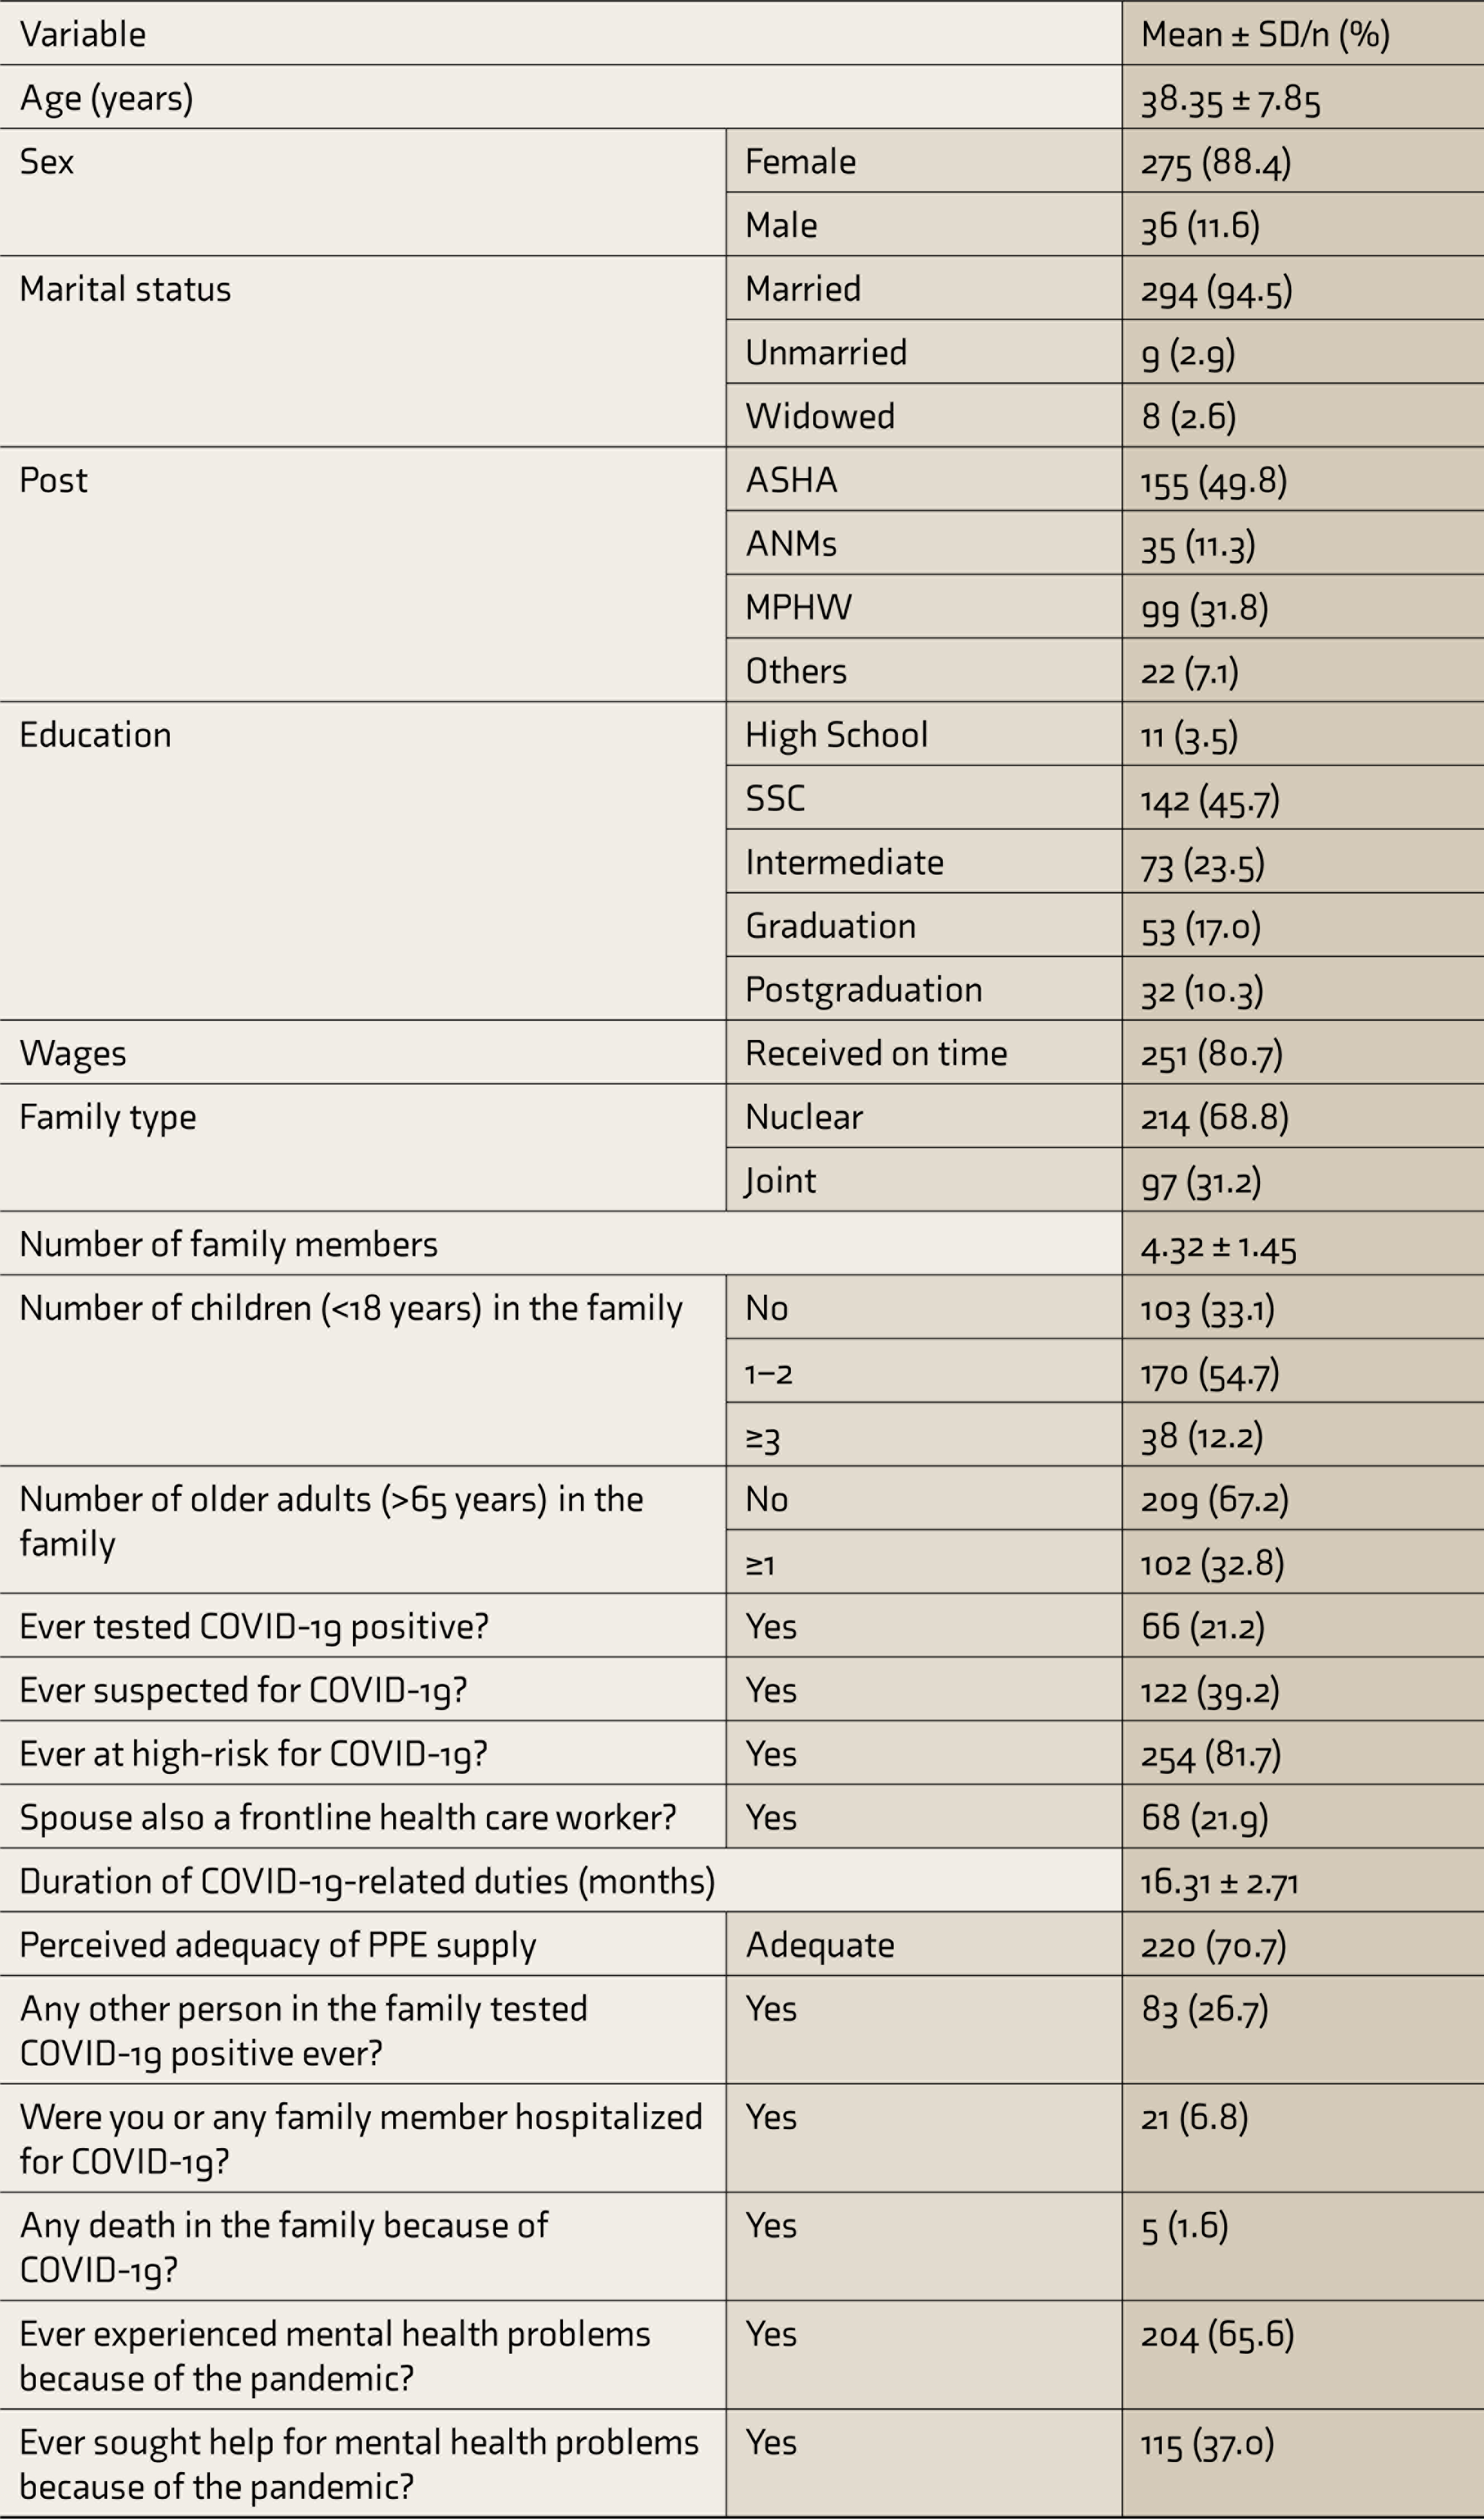
ASHA, accredited social health activists; ANMs, auxiliary nurse and midwives; MPHW, multipurpose health workers; SSC, secondary school certificate. SD, standard deviation.
Internal Consistency: Split-Half Reliability
The two split sets of items had means of 5.68 (SD = 3.73) and 5.65 (SD = 3.75). The Spearman–Brown reliability coefficient was 0.8.
Exploratory Factor Analysis (EFA)
The mean PCC-10-C score for the participants was 21.84 (SD = 5.79; range = 4–39). The proportion of participants scoring high on PSS-10-C was 27.7%. The assumptions for EFA were assessed, and they were found to be satisfactory. The sample size of 311 was sufficiently larger than the recommended sample size of 150 (i.e., 15 participants per item [10-items]) and just about sufficient to the customary “rule of thumb” 16 of 300 samples. The sampling adequacy was further confirmed using the Kaiser–Meyer–Olkin (KMO) test measure, which was found to be 0.758. Several correlations (66.67%; 30 out of 45) between each of the 10-items were found to be statistically significant (P < 0.001; Table S2). The Cronbach’s a was found to be 0.705. Bartlett’s test of sphericity was also found to be statistically significant (x 2 = 599.93; P < 0.001). The strength of extraction, that is, communality, for all the items was >0.3.
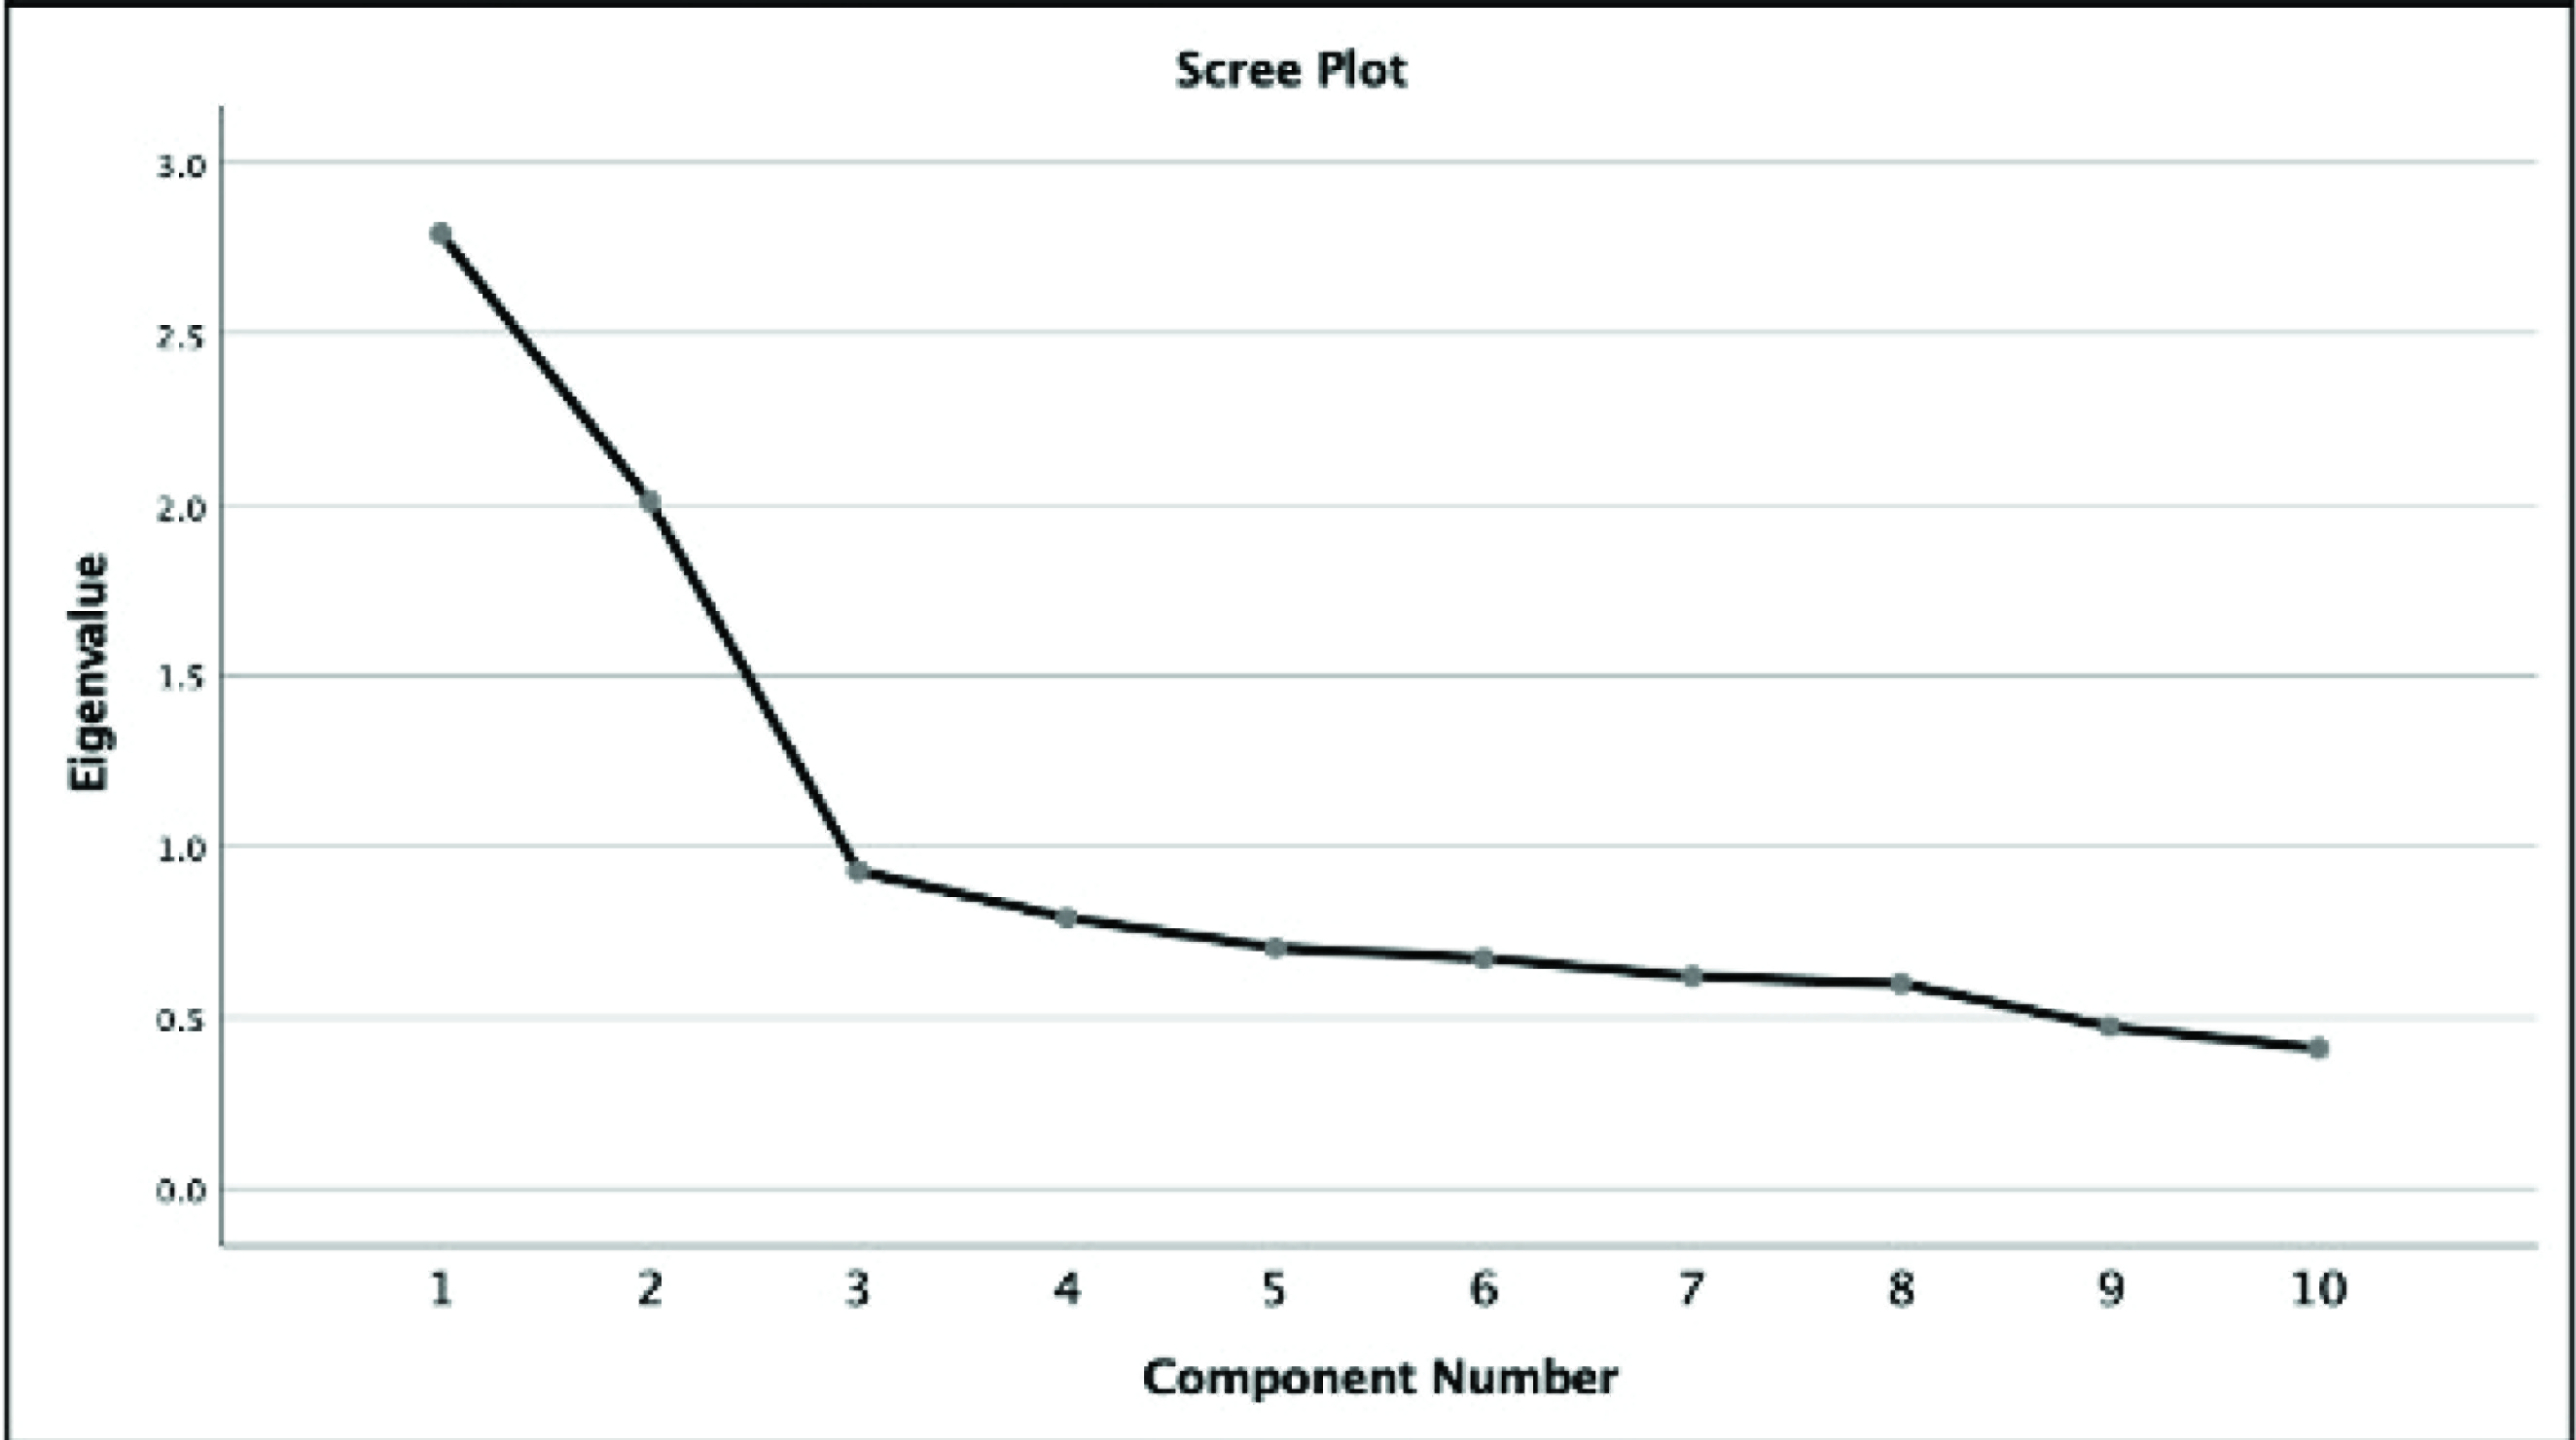
The PCA showed that the eigenvalues were >1 for two extracted factors (2.792 and 2.009, respectively; also see Figure 1 for the scree plot). The two factors accounted for 48.01% of the total variance. The PCA-calculated eigenvalues for the two factors were greater than the mean eigenvalues of the parallel analysis (1.296 and 1.199, respectively). The third factor’s calculated eigenvalue (0.928) was smaller than the mean eigenvalue of the third factor (1.131) in the parallel analysis.
Scree plot showing the Eigen values for components of the principal component analysis. Two extracted factors: (1) 2.792 and (2) 2.009 were above the threshold
The rotated component matrix (Table 2) showed that items 1, 2, 3, 6, 9, and 10 were related to latent factor 1 and 4, 5, 7, and 8 were related to latent factor 2. The correlation of items within those loaded by each of the two factors was significant (i.e., >0.5). The mean PSS-10-C scores for items loaded by latent factor 1 and latent factor 2 were 6.59 (SD = 4.43) and 4.74 (SD = 4.52), respectively.
Factor Reliability
The factor reliability for both the extracted factors was found to be good. The Cronbach’s a for factor 1 was 0.707 and for factor 2 was 0.747 (Table 2). No items were required to be deleted.
Mean, SD, Factor Loadings, and Cronbach’s a of Items Loading on the Two Latent Factors
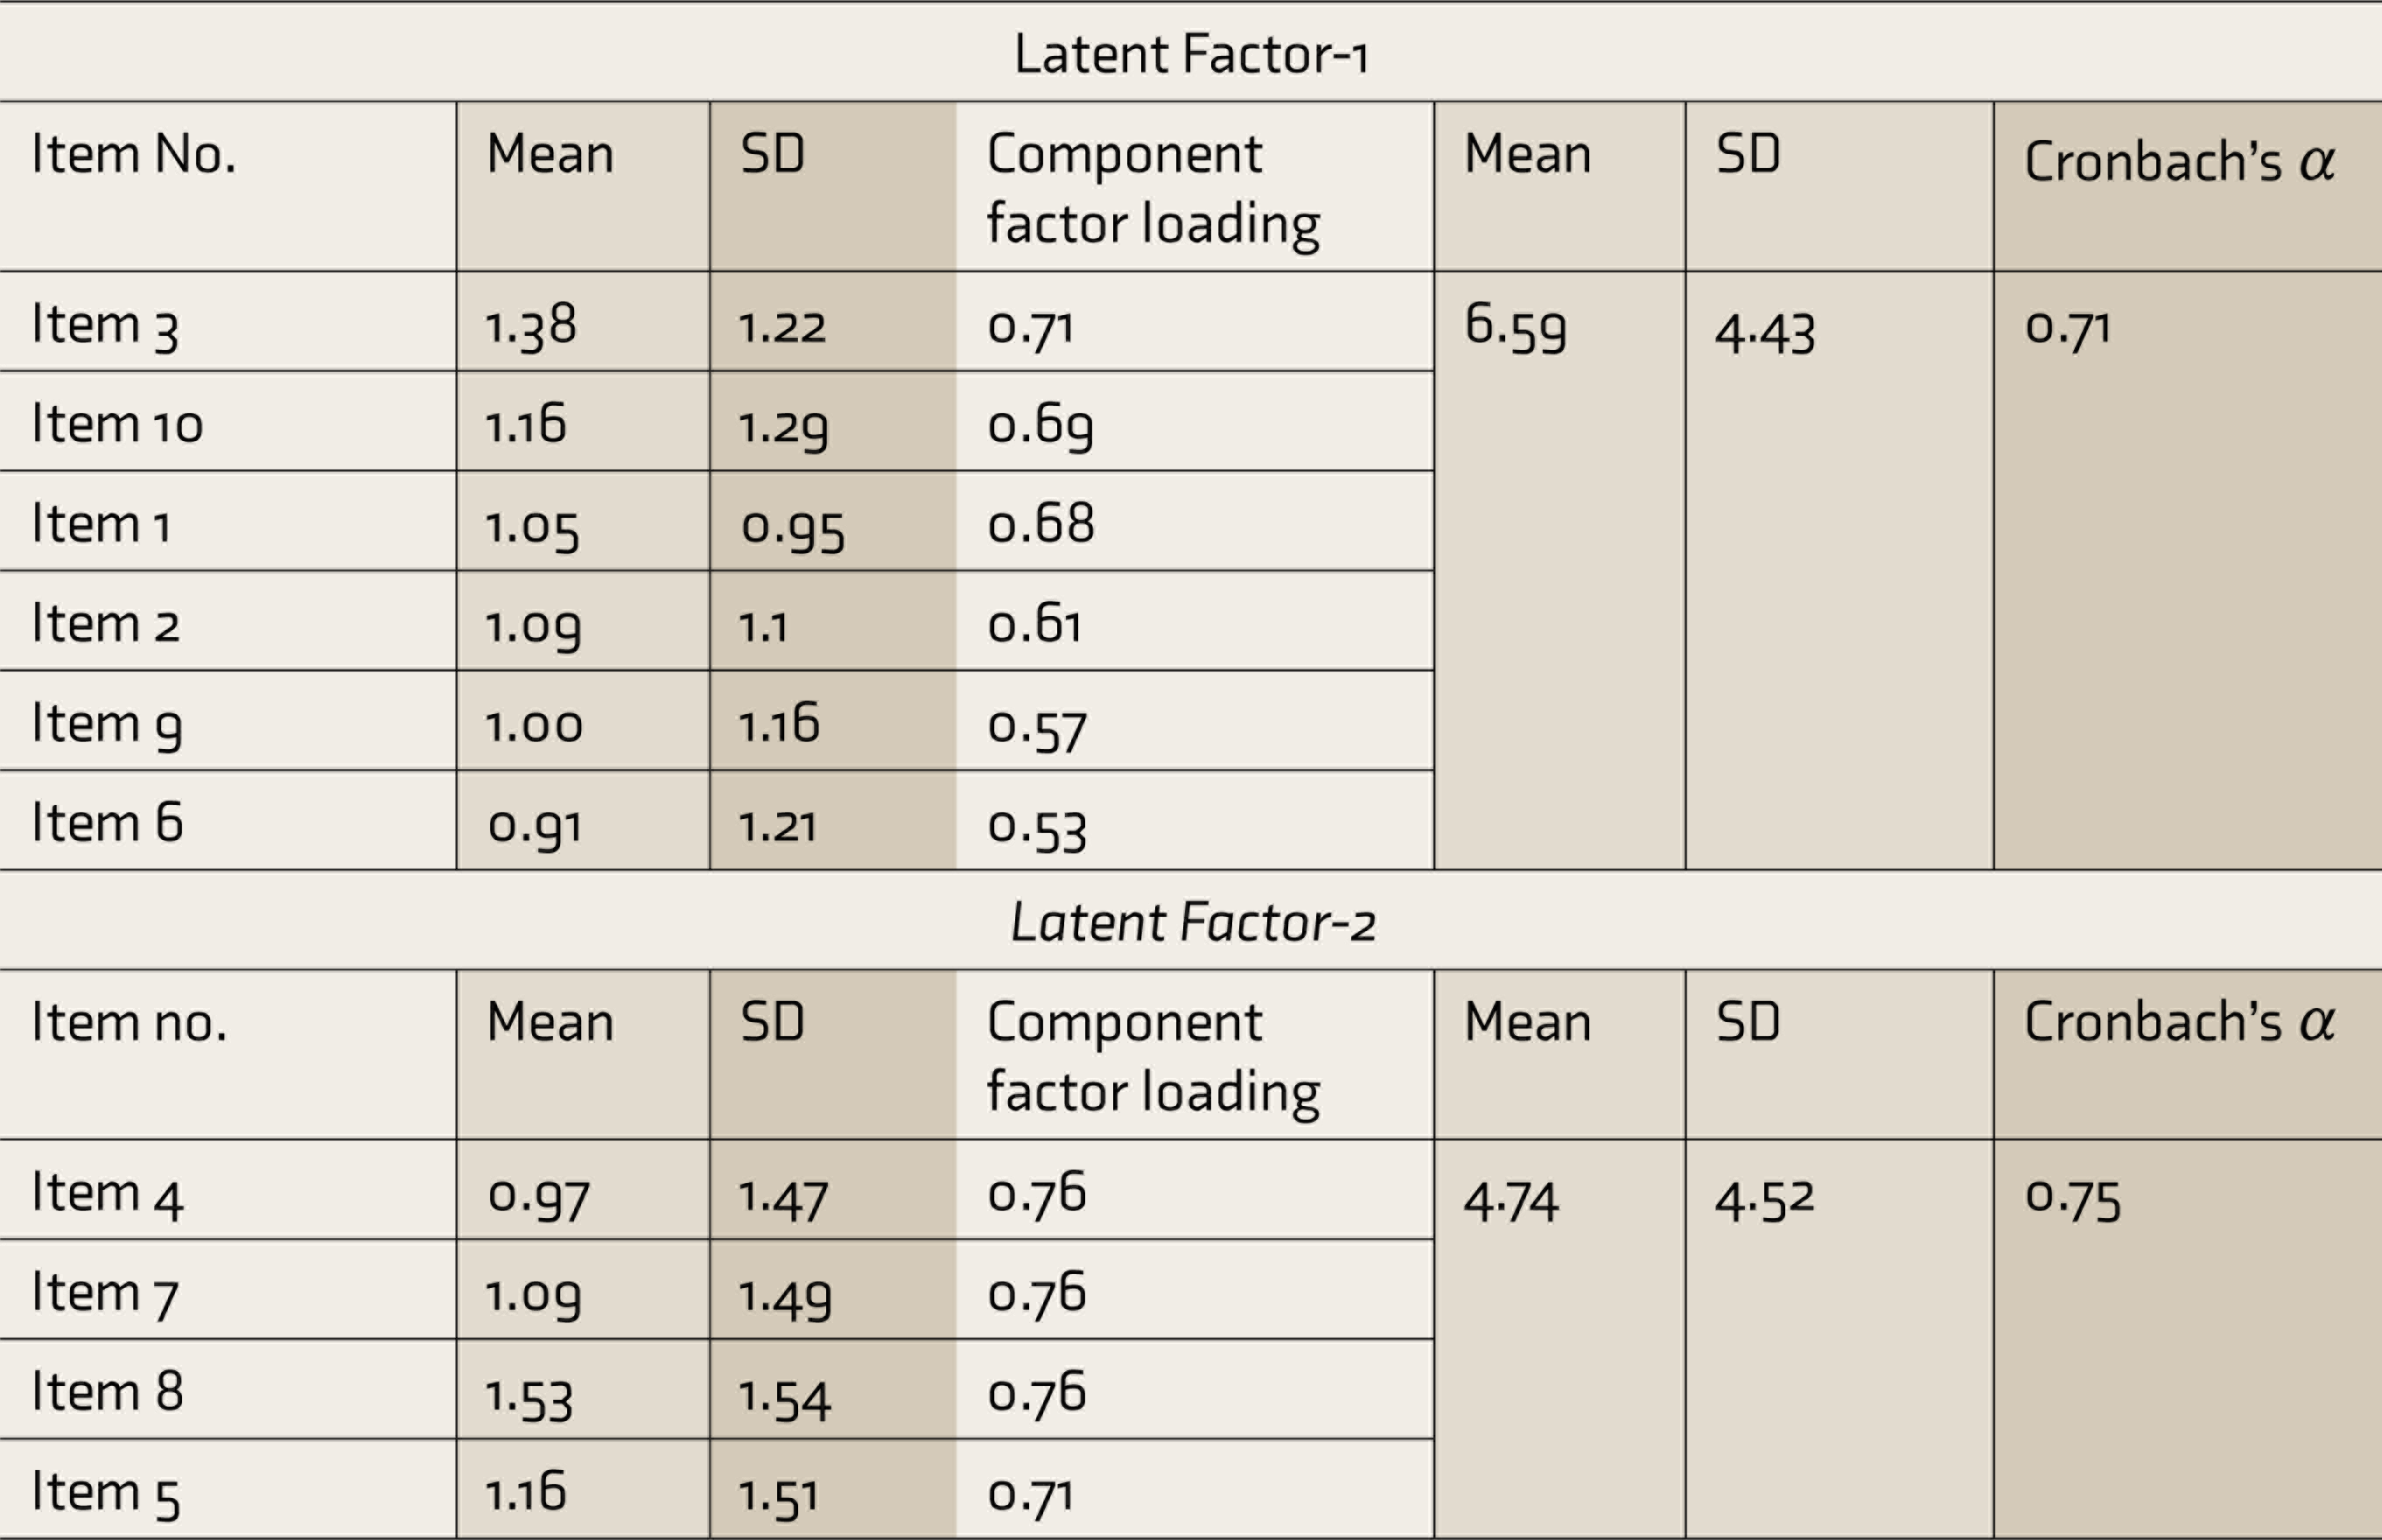
SD, standard deviation.
Convergent Validity
Out of the 311 participants, who responded to the PSS-10-C, completed responses for GAD-7 and PHQ-9 were available for 307. Table 3 shows the Pearson product-moment correlations between the scores of PSS-10-C (individual item, factor, and total) and total scores on the GAD-7 and the PHQ-9 scales. While all the correlations were significant (P < 0.001), most of them were “small to medium” (0.1–0.49) correlations. Large/strong correlations (>.5) were found between the total and factor 1 score of PSS-10-C and GAD-7 scores.
Pearson correlation coefficients between scores of PSS-10-C (individual item, factor, and total) and total scores on the Generalized Anxiety Disorder -7 (GAD-7) and the Patient Health Questionnaire-9 (PHQ-9) scales (N=307)
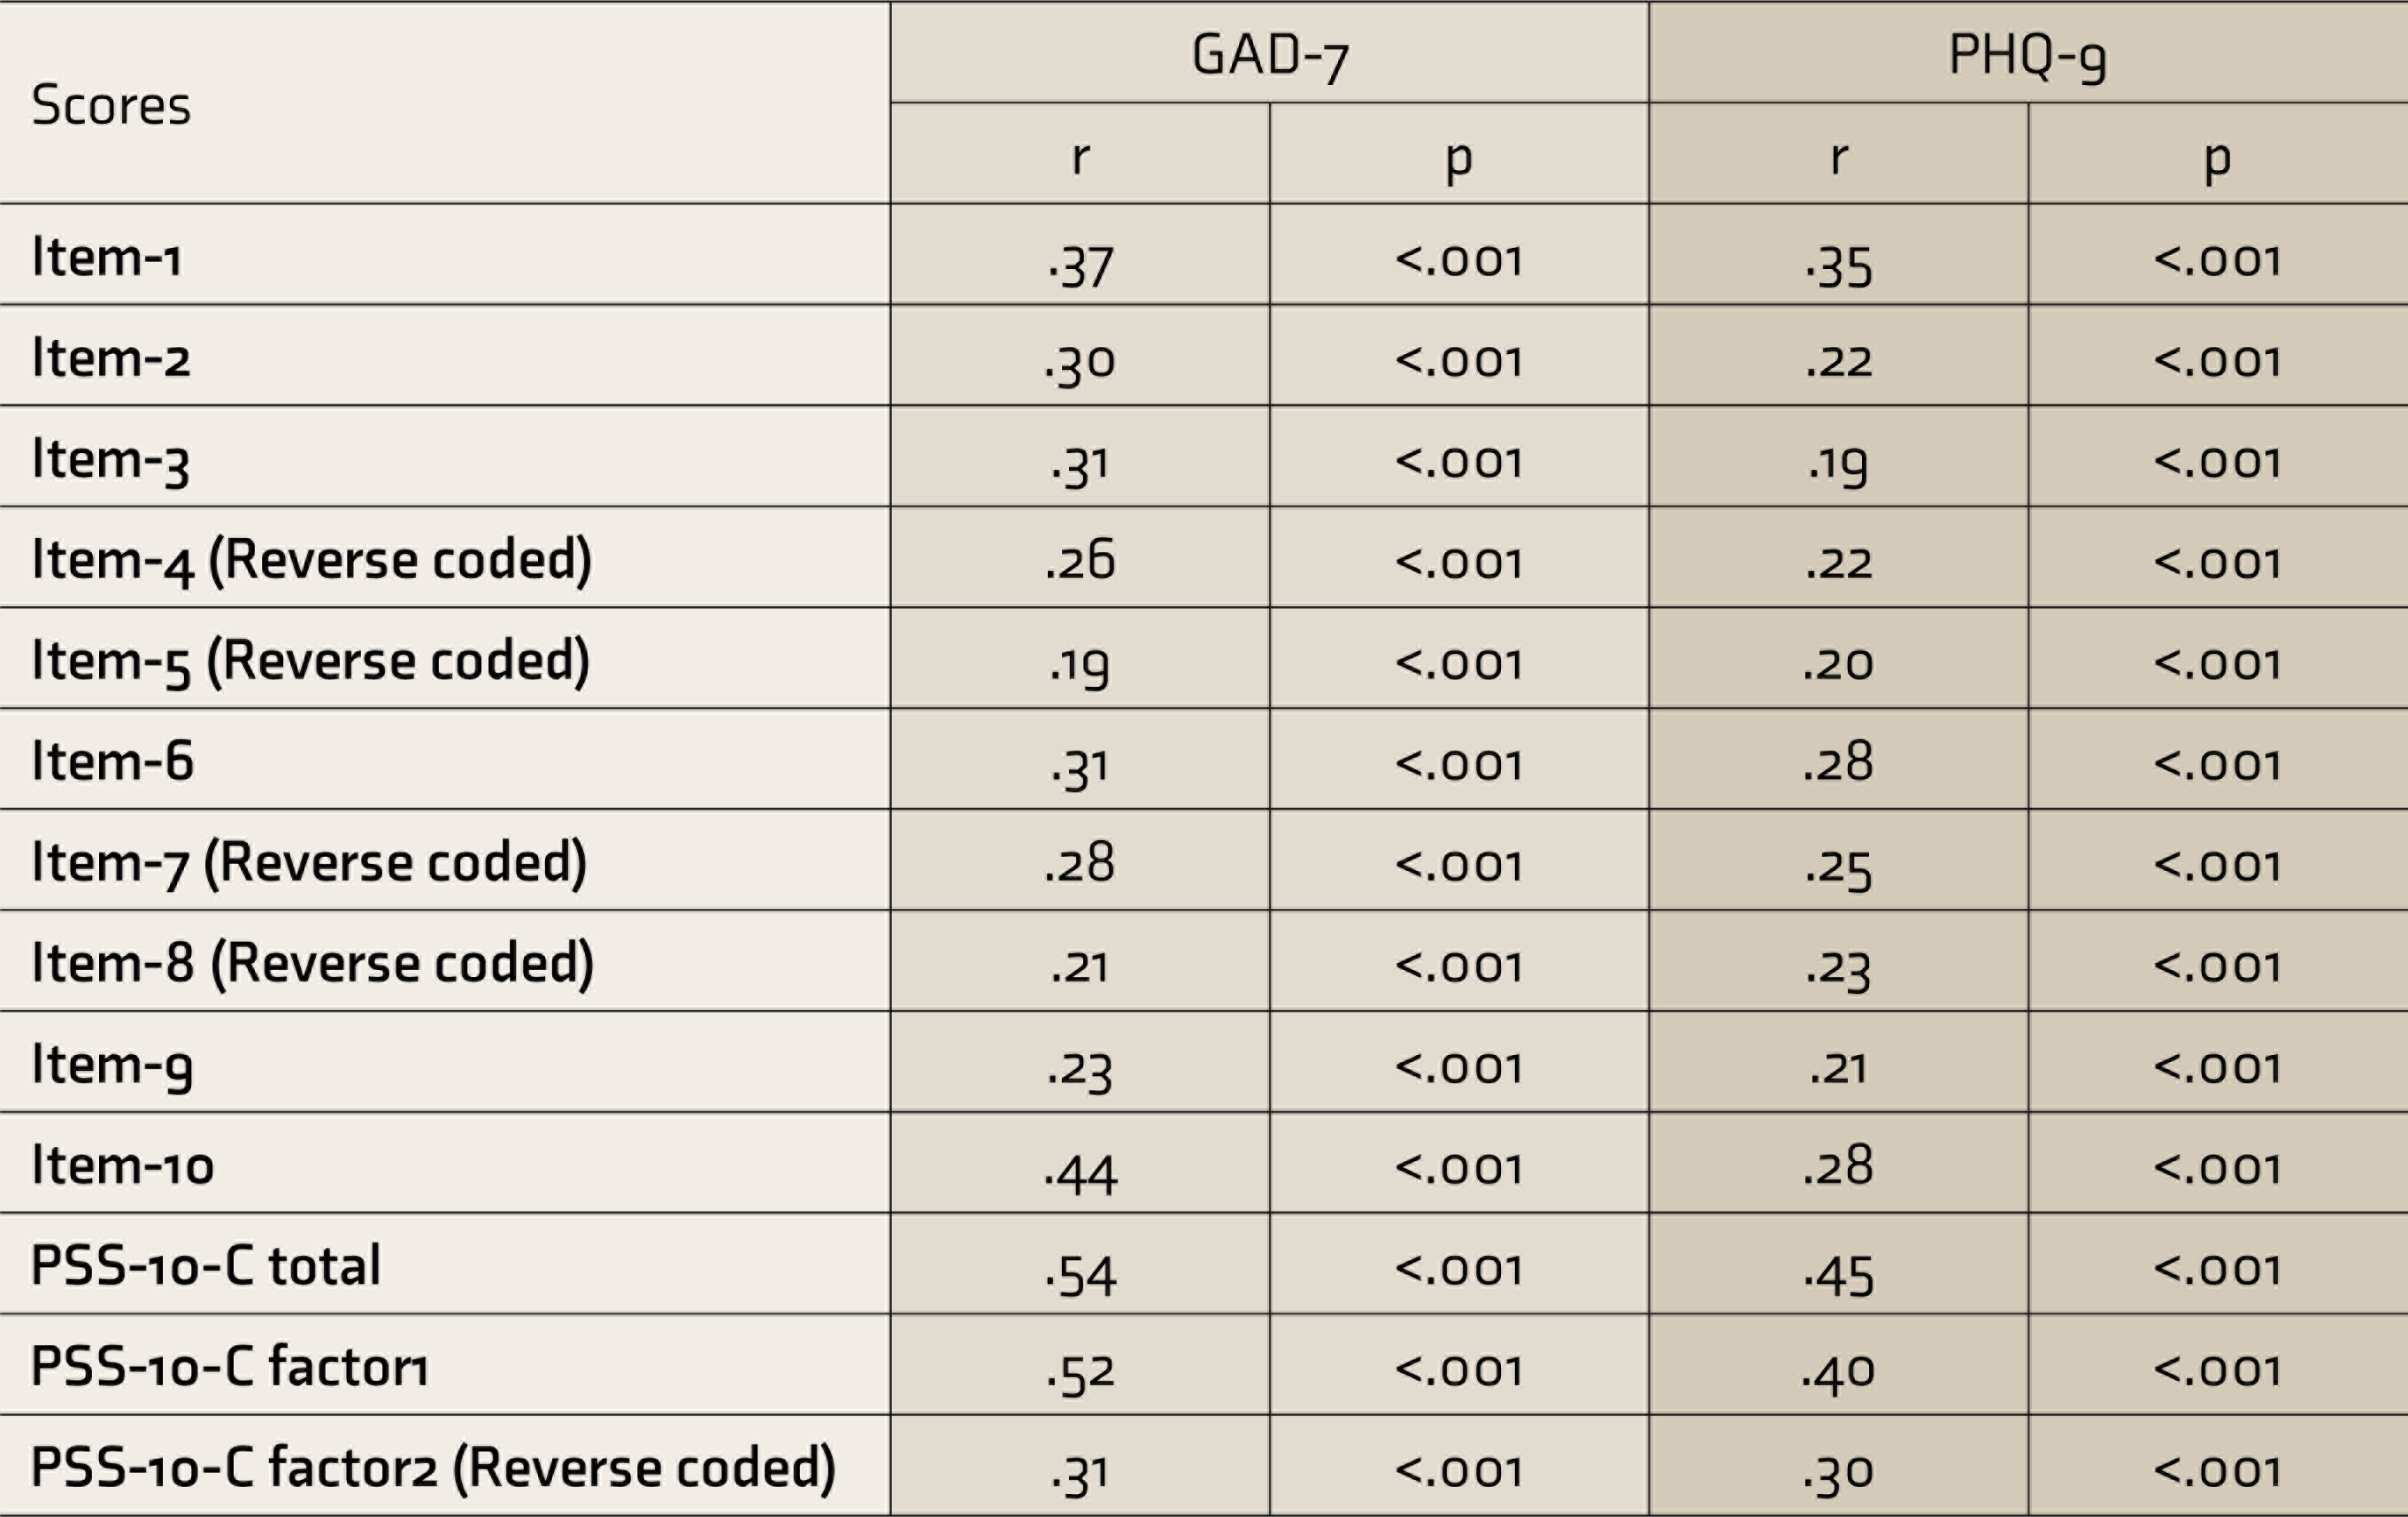
GAD-7: Generalized Anxiety Disorder -7; PHQ-9: Patient Health Questionnaire-9
Discussion
Our study showed that the Telugu version of the PSS-10-C has fairly good reliability (split-half reliability index of 0.8) and is valid for administration in grassroots frontline HCW. The PCA revealed a 2-factor solution, which also had a good reliability (Cronbach’s a >0.7). Our study also provides evidence for the convergent validity of the tool.
Assessment of PS has been considered crucial along with the assessment of depression, anxiety, and insomnia in the overall psychosocial care of frontline HCW in India. 17 The most commonly used tool for assessing PS has been the 10-item Perceived Stress Scale (PSS-10) developed by Cohen and Williamson. 18 The PSS-10 has acceptable psychometric properties when administered in the Indian population. 19 Most global and Indian studies that assessed PS in the context of the COVID-19 pandemic have used the PSS-10.9–12 In fact, the PSS-10 is the preferred scale for assessment of PS as per the recommended assessment of mental health among frontline HCW in India. 17 The PSS-10-C is the modified version of the PSS-10 for the context of the pandemic. 15 The PSS-10-C has been shown to have fairly good psychometric properties (internal consistency: Cronbach’s a >0.8) with a one-dimensional factor structure. 20 We chose PSS-10-C as the items are framed to specifically imply the role of the pandemic. Also, the fact that the PSS-10 can be administered in a concise short time frame adds to its value given the context of the restricted time of person-to-person interaction and other COVID-19 etiquettes.
The items loaded by the first and the second latent factors were negatively stated items reflecting “stress/perceived helplessness” and the positively stated items reflecting “control/perceived self-efficacy,” respectively. 21 Although the original Columbian version of the PSS-10-C had a 1-factor structure, a 2-factor solution was seen, similar to our study, for the Spanish version of the PSS-10-C, with five items loading onto each factor.One negatively stated item was reversed to a positively stated item in the Spanish version. 22 This 2-factor solution showed a good fit on confirmatory factor analysis (CFA). The authors explained the two latent factors as “distress” (for items 1, 2, 3, 9, and 10) and “coping” (for items 4, 5, 6, 7, and 8). A similar 2-factor (positive-negative perception) solution for the PSS-10 has been obtained previously, too, for the Greek, 23 Chinese, 24 Thai, 25 and Malay 26 versions of the PSS-10. The results of our convergent validity assessment too concur with those studies that found low to moderate positive correlations with scores of scales such as State-Trait Anxiety Inventory (STAI),21, 25 the depression anxiety and stress scale (DASS-21),23, 26 and Maslach Burnout Inventory (MBI). 24
Because of the shared method, the reverse-coded items may introduce a distinct covariance, the “shared method covariance.” 27 Intriguingly, the factor solution we obtained could also be explained based on the direct-reverse nature of the item wording, all reverse-coded items loaded by the second factor. And because of this, it is difficult to establish whether the two factors identified by the analysis indeed reflect two distinct qualitative “substantive” aspects (i.e., traits; control vs. stress) of the scale or mere “method” factors that are considered as artefacts. 27 Although several authors have claimed that the original PSS-10 has two latent “substantive” factors, that is, “perceived stress/helplessness” and “perceived self-efficacy,”21, 23–26 Cohen and Williamson 18 who originally developed the PSS-10 scale state that “for purposes of measuring perceptions of stress, the distinction between the two factors was considered irrelevant” as the factors derived reflected the nature of the wording. Moreover, the two identified factors are not conceptually independent and can be considered only as opposite ends of a single dimension. Being sceptical in this regard, we attempted to supplement this factor solution by assessing its convergent validity, which showed acceptability. However, a multimodel CFA, where the items of the scale are modified to create revised versions, varying from no reverse worded items to all reverse worded items, may be required on a distinct sample. This multimodel CFA may compare different factor solutions: 2-factor solution (direct reverse-coded items) versus 1-factor model versus 2-factor solutions where one is a substantive factor and the other a method factor.28, 29
Strengths and Limitations
An adequate sample size for the EFA is an inherent strength of the study. The interviews for data collection were face-to-face, rather than an online assessment like in most studies,20–22 which has questionable validity, 30 is also deemed an important strength of our study. Although the total variance explained (48%) by the two selected factors was marginally smaller than the generally accepted minimum (50%) in social sciences, the validity of selection of the number of latent factors was supplemented by parallel analysis check and the stringent criteria used for communality, that is, the strength of factor extraction.
The lack of an adequate sample to form two subsets to conduct exploratory and confirmatory factor analyses is a major limitation of our study. We also did not assess the divergent validity of the tool. Subsequent studies may use tools like the Subjective Happiness Scale for this regard. It may also be noted that although not a common practice, we chose to consider each item score as a variable along with the total and the subscale scores in correlation analyses for both linguistic equivalence and convergent validation.
Further, restricting the study sites to only a few PHCs (samples conveniently based on willingness to participate and available resources) and lack of participation from some districts where COVID-19 infection rates were high limit the generalizability of the findings. Moreover, as the participants were restricted to HCW, the generalizability of the psychometric characteristics of the Telugu version of PSS-10-C remains to be examined for other subsamples and the general population at large. Also, the phase of the pandemic during which the data collection was undertaken might have influenced the findings. This study provides data from the period when the pandemic was more in control post the second pandemic wave in India, possibly giving a sense of relative safety. The stress rates may be different when the rates of COVID-19 cases are higher. It remains to be studied if the factor structure of PSS-10-C differs with the phase of the pandemic.
The specific value for the use of PSS-10-C and not the original PSS-10 in the current study is to understand the PS specifically in the context of COVID-19 and not because of other factors that may confound the scores and may lead to greater scores. As the repercussions of the pandemic are probably going to last beyond the pandemic itself, we regard that the PSS-10-C may be useful in that context too. However, as this tool is specifically meant for the COVID-19 pandemic context, its usefulness beyond this context is unlikely.
Conclusion
The Telugu version of the PSS-10-C has fair-to-good psychometric properties in terms of reliability and validity. Contestably, though, perceived self-efficacy and perceived helplessness are the two probable latent factors that load onto the version’s items. Conducting a multimodel CFA in a separate sample may be obligatory to account for the influence of reverse-worded method covariance.
Supplemental Material
Supplemental material for this article is available online.
Footnotes
Acknowledgements
We thank all the medical officers of the selected 10 PHCs for their support during the data collection. We also thank Ms. Naomi, Nursing Officer, Department of Psychiatry, AIIMS, Hyderabad and Ms. Yangyasani Patra for helping us in the logistics and data entry/collation. We thank Mr. Bhav Singh, Dr Prasad, Dr Nuthan, and Dr Ravali Reddy for their support in the translation process.
Declaration of Conflicting Interests
The authors declared no potential conflicts of interest with respect to the research, authorship, and/or publication of this article.
Funding
This study was funded by the United Nations Children’s Fund (UNICEF) grant (Ref: HFP/RCHTS/2021/122) as part of the ‘CoVID activities for Telangana’.